Spatially targeted inhibitory rhythms differentially affect neuronal integration
- Center for Molecular and Behavioral Neuroscience, Rutgers University – Newark, United States
- Electrical Engineering and Computer Science, University of Missouri, United States
Figures
Figure 1

A model layer 5 pyramidal neuron with active dendrites.
(A) The morphology of the neuron. Virtual recordings can be obtained from any desired compartment (colored pipettes). Inset, naturalistic presynaptic activity drives firing rates in our model like those in vivo. Each black cross is the mean rate for a different simulation. (B) Examples of membrane potentials recorded simultaneously across the dendritic tree (in color) and soma (black) during naturalistic drive. Regenerative events are indicated with arrows or text (AP: action potential, bAP: backpropagating action potential). (C1–3) Demonstration of our detection of dendritic spike events (top) and characterization of their properties (bottom). Events are binned according to the properties that were used in their detection. Bin edges for the event durations were not evenly set for panels C2 and C3.
Figure 2

Influence of Na+ and NMDA spikes on action potential generation.
(A) Electrotonic distance between each dendritic compartment and the soma. (B) Dendritic compartments were grouped by their type (apical or basal) and electrotonic distance (percentile) from the soma. The percent change in Na+ spike presence in those compartments relative to somatic spiking. Na+ spikes increased immediately prior to action potentials in dendritic compartments that were electrotonically close to the soma. (C) Same format as B, but for NMDA spikes. These showed a similar degree of change, but a broader temporal coupling.
Figure 3

Influence of Ca2+ spikes on action potential generation and their behavior as a second integrative mechanism.
(A) Electrotonic distance between dendritic compartments and the apical nexus, where Ca2+ spikes are generated. (B) Change in the incidence of Ca2+ spikes at the nexus surrounding action potentials. (C) Percent change in NMDA spike presence in the apical dendrites centered on Ca2+ spike initiation. (D) Percent change in NMDA spike coupling with action potentials during Ca2+ spikes. Top, NMDA spikes in apical dendrites were more strongly coupled with action potentials during Ca2+ spikes. Bottom, this was not the case for basal dendrites.
Figure 4

Distal dendritic and perisomatic inhibition reduce action potential generation through different mechanisms.
(A) Action potential rate during periods with normal inhibitory tone (control), double rate on distal branches, or double rate on perisomatic. Both increases in inhibition dramatically reduced the firing of somatic action potentials. (B) Somatic excitability was measured by delivering current steps during the control, distal, and perisomatic inhibition states. Left, example somatic voltage responses to current steps. Right, spike frequency versus current (f–I) curve for each condition. The threshold for evoking an action potential shifted with 2× distal and perisomatic inhibition. Perisomatic, but not dendritic, inhibition changed the f-I slope (compare dashed lines with solid black). (C) Impact of altered dendritic inhibition on rate of Na+ spikes in apical and basal dendrites. (D) Same format as C, but for NMDA spikes. (E) Rate of Ca2+ spikes in the apical dendrites. Basal dendrites lacked Ca2+ spikes and were excluded. All error bars are mean ± standard deviation. (F) Examples of membrane potential recorded in control (top), and both distal (middle) and proximal (bottom) inhibition lagged by 500 ms. (G) Change in firing rate for control (black dot) and for perisomatic (blue) and distal (red) lags in inhibition from 0 to 500 ms. (H) Change in incidence of Ca2+ spikes for distal (red, top) and proximal (blue, bottom) inhibition. The control case is shown in black in both panels. (I) Same as (H) but for NMDA spikes.
Figure 5 with 1 supplement

Phase-dependent effects of beta and gamma rhythmic inhibition on dendritic spikes.
(A) Example data from the beta rhythmic inhibition simulation. Top, presynaptic spike counts. Bottom, voltage traces from somatic and dendritic compartments. Grayed periods are when inhibitory presynaptic spikes are peaking. (B) Action potential rate as a function of the phase of the beta rhythm. Dashed gray line shows the modulation of inhibitory drive with respect to phase. (C) Percent change in Ca2+ spike presence at apical nexus by beta phase. (D1–2) Percent change of NMDA spike presence in apical (1) and basal (2) dendrites stratified by electronic distance from the soma. (E1–2) Same as C, but for Na+ spikes. (F, G, H, I1–2, J1–2) Same format as above, but with events binned by the phase of gamma rhythmic inhibition. For all graphs, phase is given in radians with inhibition at a minimum for –π and maximum at 0.
Figure 5—figure supplement 1

Phase-dependent effects on dendritic spikes of beta and gamma rhythmic inhibition delivered to opposite areas of the neuron.
Beta was delivered perisomatically, while gamma was supplied to the distal dendrites. (A) Action potential rate as a function of the phase of the beta rhythm. Dashed gray line shows the modulation of inhibitory drive with respect to phase. (B) Percent change in Ca2+ spike presence at apical nexus by beta phase. (C1–2) Percent change of NMDA spike presence in apical (1) and basal (2) dendrites stratified by electronic distance from the soma. (D1–2) Same as C, but for Na+ spikes. (E, F, G1–2, H1–2) Same format as above, but with events binned by the phase of gamma rhythmic inhibition. For all graphs, phase is given in radians with inhibition at a minimum for –π and maximum at 0.
Figure 6 with 1 supplement

Phase-dependent effects of gamma and beta rhythmic inhibition on somatic excitability.
(A1) A cumulative probability plot of the distribution of somatic membrane potentials 1 ms prior to an action potential, sorted by whether they occurred during the gamma phase with maximal (peak, red line) or minimal (trough, blue line) inhibitory drive. Poisson (black) had no rhythmic modulation, but the same mean inhibitory rate. (A2) Probability distribution of somatic membrane voltage as a function of gamma phase, normalized to the peak probability value. Lines have the same color scheme as in A1. (B1) Same format as A1, but for the beta rhythm. (B2) Same format as A2, but for the beta rhythm.
Figure 6—figure supplement 1

Phase-dependent effects on somatic excitability of beta and gamma rhythmic inhibition delivered to opposite areas of the neuron.
Beta was delivered perisomatically, while gamma was supplied to the distal dendrites. (A1) A cumulative probability plot of the distribution of somatic membrane potentials 1 ms prior to an action potential, sorted by whether they occurred during the gamma phase with maximal (peak, red line) or minimal (trough, blue line) inhibitory drive. Poisson (black) had no rhythmic modulation, but the same mean inhibitory rate. (A2) Probability distribution of somatic membrane voltage as a function of gamma phase, normalized to the peak probability value. Lines have the same color scheme as in A1. (B1) Same format as A1, but for the beta rhythm. (B2) Same format as A2, but for the beta rhythm.
Figure 7

Frequency- and phase-dependent effects of inhibitory rhythms on the distal dendrites.
(A) Entrainment to an inhibitory rhythm delivered to the distal dendrites varied with its frequency. Higher frequencies were less able to entrain dendritic spikes. Entrainment tended to be strongest for apical (blue) over basal (orange) compartments. (B) Example voltage traces from dendritic compartments in either the distal basal or apical branches. Gray shading denotes the period where the inhibitory rhythm troughs occurred. For the basal segment, NMDA spikes were shaded in purple, while in the apical segment, Ca2+ spikes were shaded in green. Dendritic spike onsets denote with red lines, and offsets with blue lines. (C) Percent change from the mean in the rate of dendritic spike onsets (red gradient) and offsets (blue gradient) as a function of rhythm frequency and phase. Purple regions denote phase/frequency combinations where both onsets and offsets were elevated, while regions with either just blue or red indicate that offsets or onsets preferentially occurred, respectively. We did not determine an offset for Na+ spikes due to their transience (~1 ms).
Figure 8

Frequency- and phase-dependent effects of inhibitory rhythms on the perisomatic region.
(A) The mean somatic membrane potential during either the trough or peak phase of the inhibitory rhythm. (B) Mean of the distribution of somatic membrane potential fluctuations as a function rhythm phase and frequency. Fluctuations were measured across the entire simulation time as the difference in membrane potential at 1 ms delays. For both graphs, red lines are peaks and blue lines are troughs.
Figure 9

Phase-dependent effects of gamma and beta bursts on dendritic spikes.
(A) Example data from the gamma rhythmic inhibition simulation. Top, somatic potential (black line), with firing rate of perisomatic inhibitory synapses (blue line). Middle, voltage trace of apical compartment. Bottom, voltage trace of basal compartment. (B) Action potential rate as a function of the phase of the gamma rhythm. Blue line shows the modulation of inhibitory drive with respect to phase. (C) Percent change in Ca2+ spike presence at apical nexus by gamma phase. (D1–2) Percent change of NMDA spike presence in apical (1) and basal (2) dendrites stratified by electronic distance from the soma. (E1–2) Same as C, but for Na+ spikes. (F, G, H, I1–2, J1–2) Same format as above, but with events binned by the phase of beta rhythmic inhibition. For all graphs, cycle number is given relative to the amplitude peak of the burst.
Figure 10

Effect of beta and gamma rhythms on responsiveness to synaptic inputs targeting distinct regions of the dendritic tree.
(A) Schematic of the location for clustered excitatory synaptic inputs. (B) Normalized cross-correlation between synaptic drive onto a clustered input and spiking at the soma, stratified by whether the presynaptic spike arrived during the peak (red line) or trough (blue line) of the rhythm. Solid bars correspond to the Poisson stimulation case where inhibition was not rhythmically modulated. Top left, effect of beta on distal inputs. Top right, effect of gamma on distal inputs. Bottom left, effect of beta on proximal inputs. Bottom right, effect of gamma on proximal inputs. (C) Summary of effects in panel B where the strength of each normalized cross-correlation was measured as its area under the curve. Dots are connected by dashed gray lines if the data points came from the same simulation but at different phases of the rhythm. Solid horizontal lines reflect the cross-correlation strength in the Poisson inhibitory case (no rhythmicity).
Figure 11

A summary schematic of the principal findings.
(A) The microcircuitry that was simulated in this study. (B) Beta rhythmic inhibition to the distal dendrites modulated dendritic spikes. (C) Gamma rhythmic inhibition to the perisomatic region modulated action potential initiation. AP stands for action potentials.
Tables
Table 1
Inputs to layer 5 (L5) PN.
L5 PN dendrites can course up to L1 and receive both excitatory and inhibitory inputs to their dendrites. Here, we quantified, where possible, the experimental values for synaptic magnitude, firing rate, divergence, and release probability. We matched the model parameters to the experimental values as closely as possible while preserving a reasonable basal firing rate.
| Synapse type | Characteristics | Model | Experimental |
|---|---|---|---|
| Excitatory (basal) | Magnitude of EPSCs | 37.0±32.3 pA | 30.6±29.9 pA Morishima et al., 2011 |
| Firing rate | 4.43±2.9 Hz | 4.43±2.9 Hz (Headley personal comm.) | |
| Divergence | 2–8 | 2–8 (Markram et al., 1997; Reimann et al., 2015; Deuchars et al., 1994) | |
| Number of synapses | 10042 | 10042 (Karimi et al., 2020) | |
| Release probability | 0.53±0.22 | 0.53±0.22 (Brémaud et al., 2007) | |
| Excitatory (apical) | Magnitude | 25.9±24.9 pA | 30.6±29.9 pA (Morishima et al., 2011) |
| Firing rate | 4.43±2.9 Hz | 4.43±2.9 Hz (Headley personal comm.) | |
| Divergence | 2–8 | 2–8 (Markram et al., 1997; Reimann et al., 2015; Deuchars et al., 1994) | |
| Number of synapses | 16070 | 16070 (Karimi et al., 2020) | |
| Release probability | 0.53±0.22 | 0.53±0.22 (Brémaud et al., 2007) | |
| Inhibitory (perisomatic and somatic) | Magnitude | 162.5±103.1 pA | 208.3±58.7 pA (Xiang et al., 2002) |
| Firing rate | 16.9±14.3 Hz | 16.9±14.3 Hz (Yu et al., 2019) | |
| Divergence | 2.8±1.9 | 2.8±1.9 | |
| Number of synapses | 406 | 406 (Karimi et al., 2020) | |
| Release probability | 0.88±0.05 | 0.88±0.05 (Xiang et al., 2002) | |
| Inhibitory (basal) | Magnitude | 24.3±18.4 pA | 26.5±1.6 pA (Xiang et al., 2002) |
| Firing rate | 3.9±4.9 Hz | 3.9±4.9 Hz (Yu et al., 2019) | |
| Divergence | 2.7±1.6 | 2.7±1.6 (Tanaka et al., 2011; Thomson et al., 1996) | |
| Number of synapses | 1023 | 1023 (Karimi et al., 2020; Jadi et al., 2012) | |
| Release probability | 0.72±0.10 | 0.72±0.10 (Xiang et al., 2002) | |
| Inhibitory (apical) | Magnitude | 24.3±33.1 pA | 26.5±1.6 pA (Xiang et al., 2002) |
| Firing rate | 3.9±4.9 Hz | 3.9±4.9 Hz (Yu et al., 2019) | |
| Divergence | 12±3 | 12±3 (Silberberg and Markram, 2007; Vezoli et al., 2021) | |
| Number of synapses | 1637 | 1637 (Karimi et al., 2020) | |
| Release probability | 0.30±0.08 | 0.30±0.08 (Silberberg and Markram, 2007) |
Table 2
Short-term presynaptic plasticity.
Parameters were tuned to match experimental recordings reported in Campagnola et al., 2022.
| Synapse type | tauD1 (ms) | d1 | tauD2 (ms) | d2 | Synaptic current @ 20 Hz | Train induction vs. frequency |
|---|---|---|---|---|---|---|
| Excitatory | 35 | 0.95 | 250 | 0.8 | 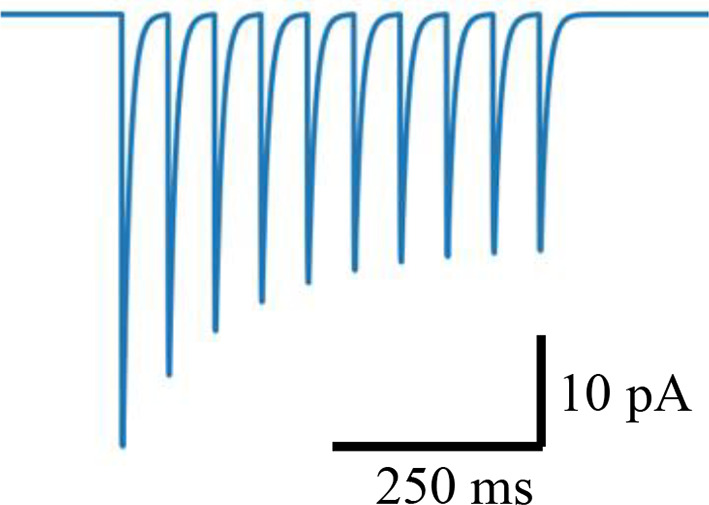 | 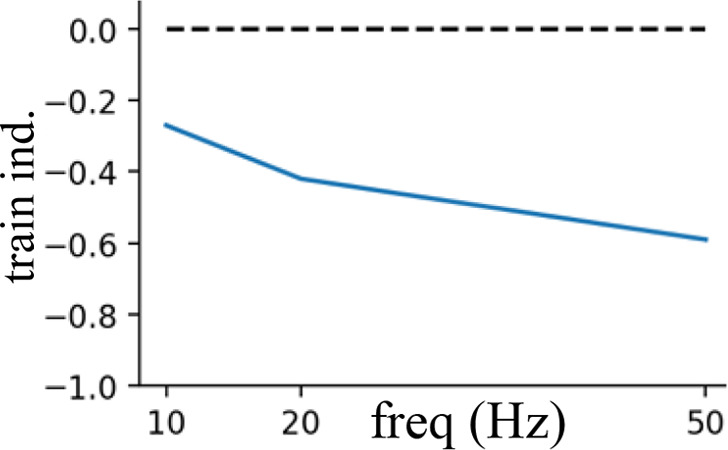 |
| Perisomatic inhibition | 40 | 0.7 | 500 | 0.7 | 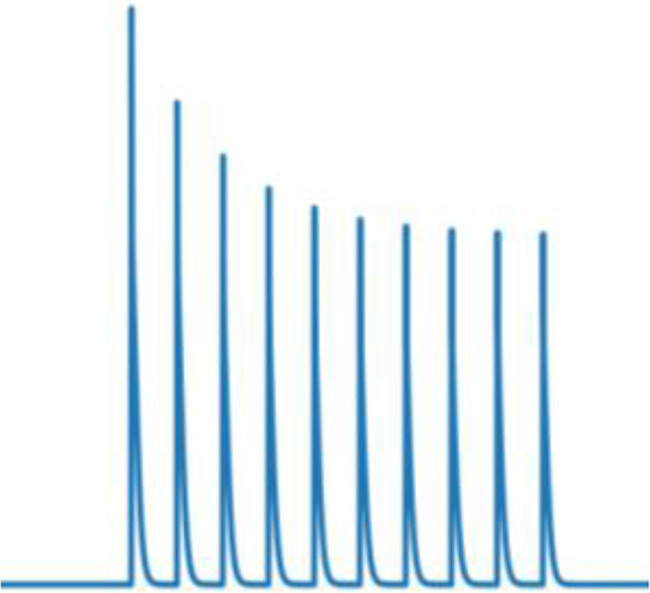 | 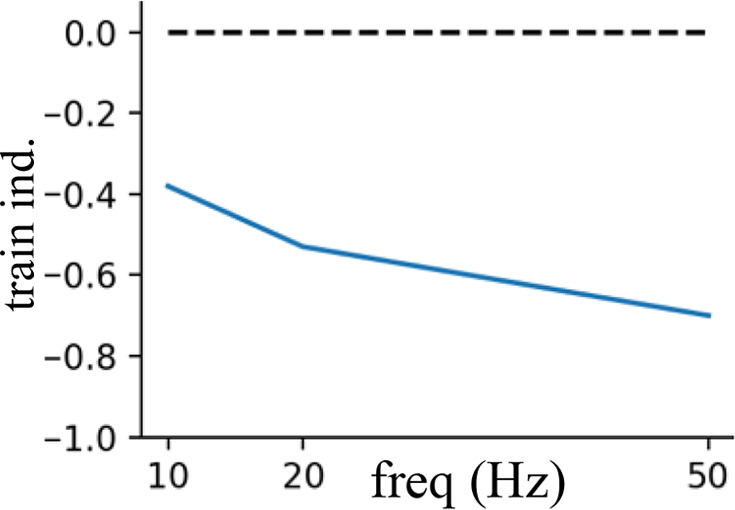 |
| Dendritic inhibition | 200 | 0.8 | 1 | 1 | 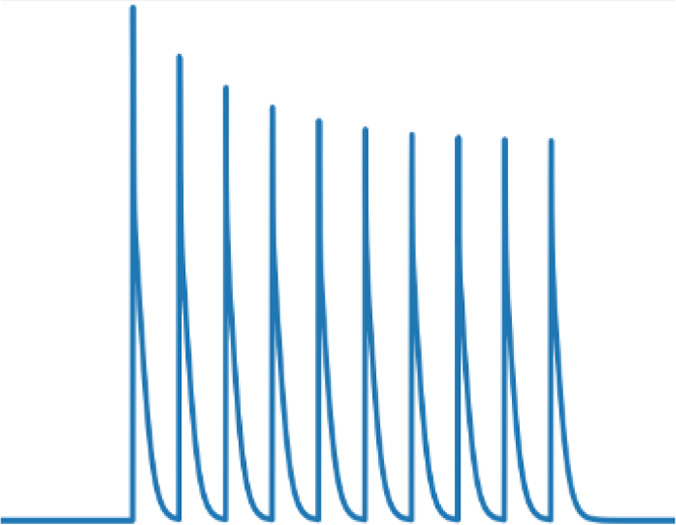 | 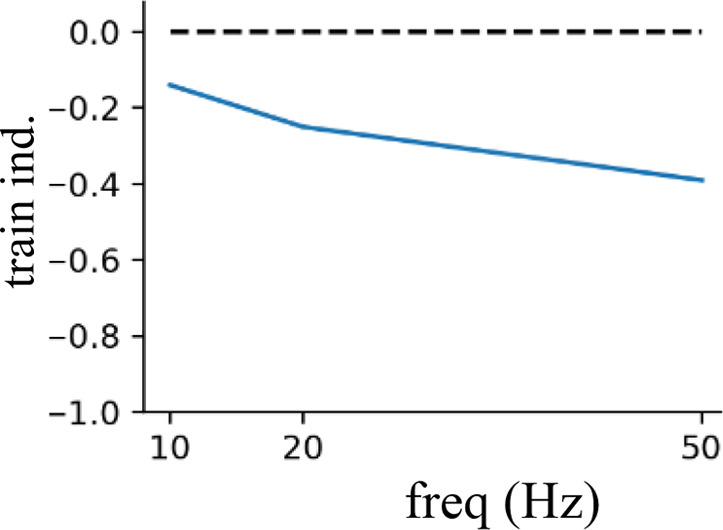 |
Additional files
Download links
A two-part list of links to download the article, or parts of the article, in various formats.
Downloads (link to download the article as PDF)
Open citations (links to open the citations from this article in various online reference manager services)
Cite this article (links to download the citations from this article in formats compatible with various reference manager tools)
Spatially targeted inhibitory rhythms differentially affect neuronal integration
eLife 13:RP95562.
https://doi.org/10.7554/eLife.95562.3


