Diverging roles of TRPV1 and TRPM2 in warm-temperature detection
- Department of Pharmacology, Heidelberg University, Germany
- Ernst Strüngmann Institute for Neuroscience in Cooperation with the Max Planck Society, Germany
- Molecular Medicine Partnership Unit, European Molecular Biology Laboratory (EMBL), Germany
Figures
Figure 1 with 3 supplements
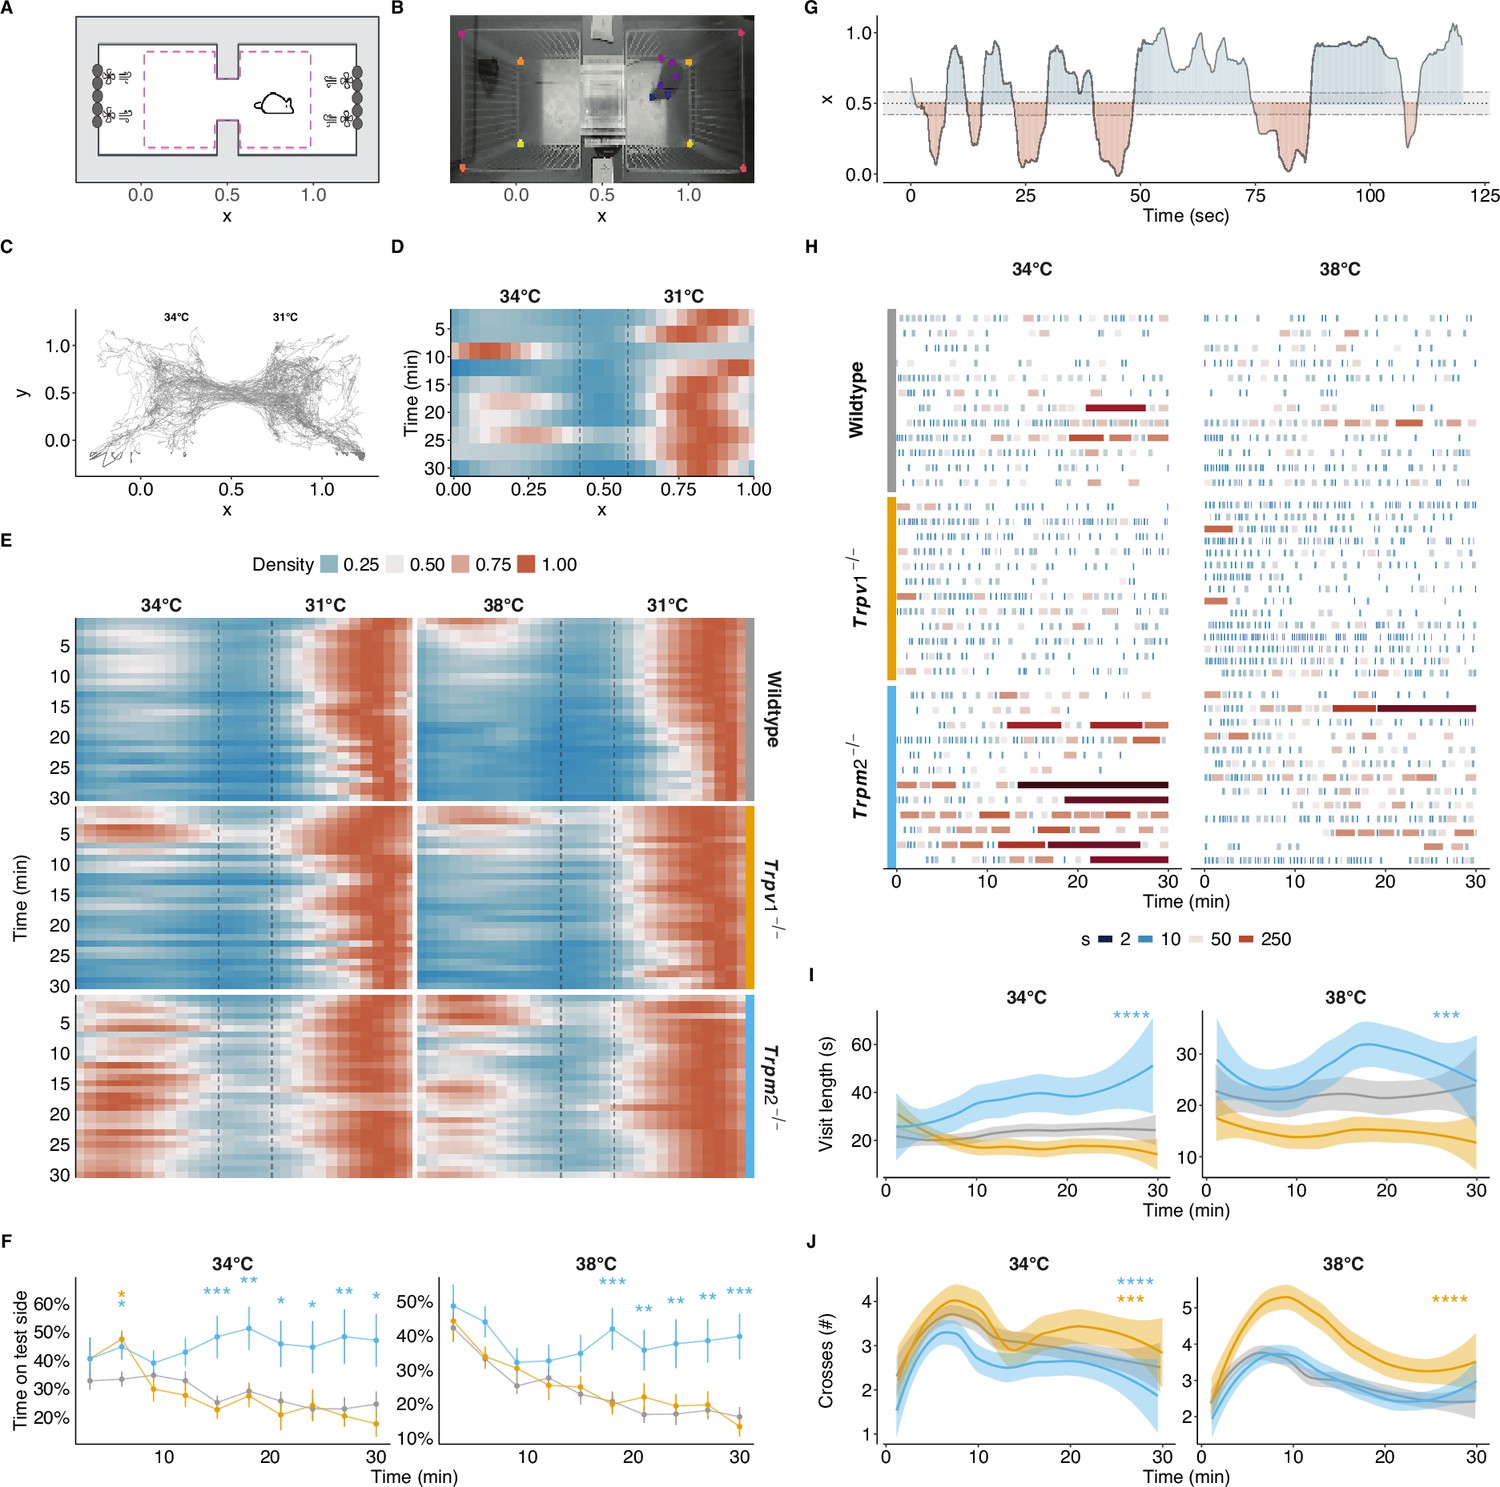
A novel ambient temperature preference test.
(A) Schematic of the chamber preference test from the top. Grey outlines the outer enclosure and the dashed line the internal cage. Peltier elements (grey oval shapes) were combined with fans for precise control of the temperature. See Figure 1—figure supplement 1 for a more detailed view. (B) A representative image of an animal exploring the chambers. Coloured dots represent the tracked keypoints on the animal and reference points in the enclosure. (C) Tracking of an example animal for 30 minutes at 31°C (right chamber) and 34°C (left chamber). (D) Density maps of the x-position of the animal in (C) over 30 minutes; binned in 3-minute-long intervals. Dashed lines represent the tunnel connecting both chambers. (E) Density maps as in (D) with 1-minute bins of all animals from wildtype (n = 48), Trpv1-/- (n = 15), and Trpm2-/- (n = 28) genotypes. (F) Proportion of time spent in the test chamber for animals shown in (E) over time, binned in 3-minute-long intervals. Mean and standard error of the mean (SEM) shown. ANOVA over genotype (34°C: F(2,70) = 7.30, p=0.001; 38°C: F(2,76) = 7.84, p<0.001), time (34°C: F(5.63,394.35) = 2.51, p<0.05; 38°C: F(3.86,293.72) = 11.07, p<0.001), and their interaction (34°C: F(11.27,394.35) = 1.98, p<0.05). Results of post hoc multiple comparison by timepoint against wildtype are indicated. (G) Exemplary behaviour of the animal in (C) and (D) over the first 120 seconds of the experiment, highlighting the visit frequency and duration of time spent in each chamber. The dashed line represents the tunnel connecting the chambers. (H) Overview of the frequency and length of the visits to the test chamber for 15 randomly sampled animals per genotype, shown in (E). Each visit is coloured by the log2 of its length to highlight varying visit lengths. (I) Averaged and smoothed visit lengths in a 3-minute rolling window with a 1-minute lag. The shaded area represents the 95% confidence interval. Linear mixed model over genotype and time with random effects across animals. (J) Averaged and smoothed number of crosses in a 3-minute rolling window. The shaded area represents the 95% confidence interval. Cox regression over genotype (34°C X2 (2) = 49.67, p<0.001; 38°C X2 (2) = 55.74, p<0.0001). (I, J) Results of post hoc multiple comparison against wildtype are indicated. *p<0.05, **p<0.01, ***p<0.001, ****p<0.0001.
Figure 1—figure supplement 1
Establishing a novel ambient temperature preference test.
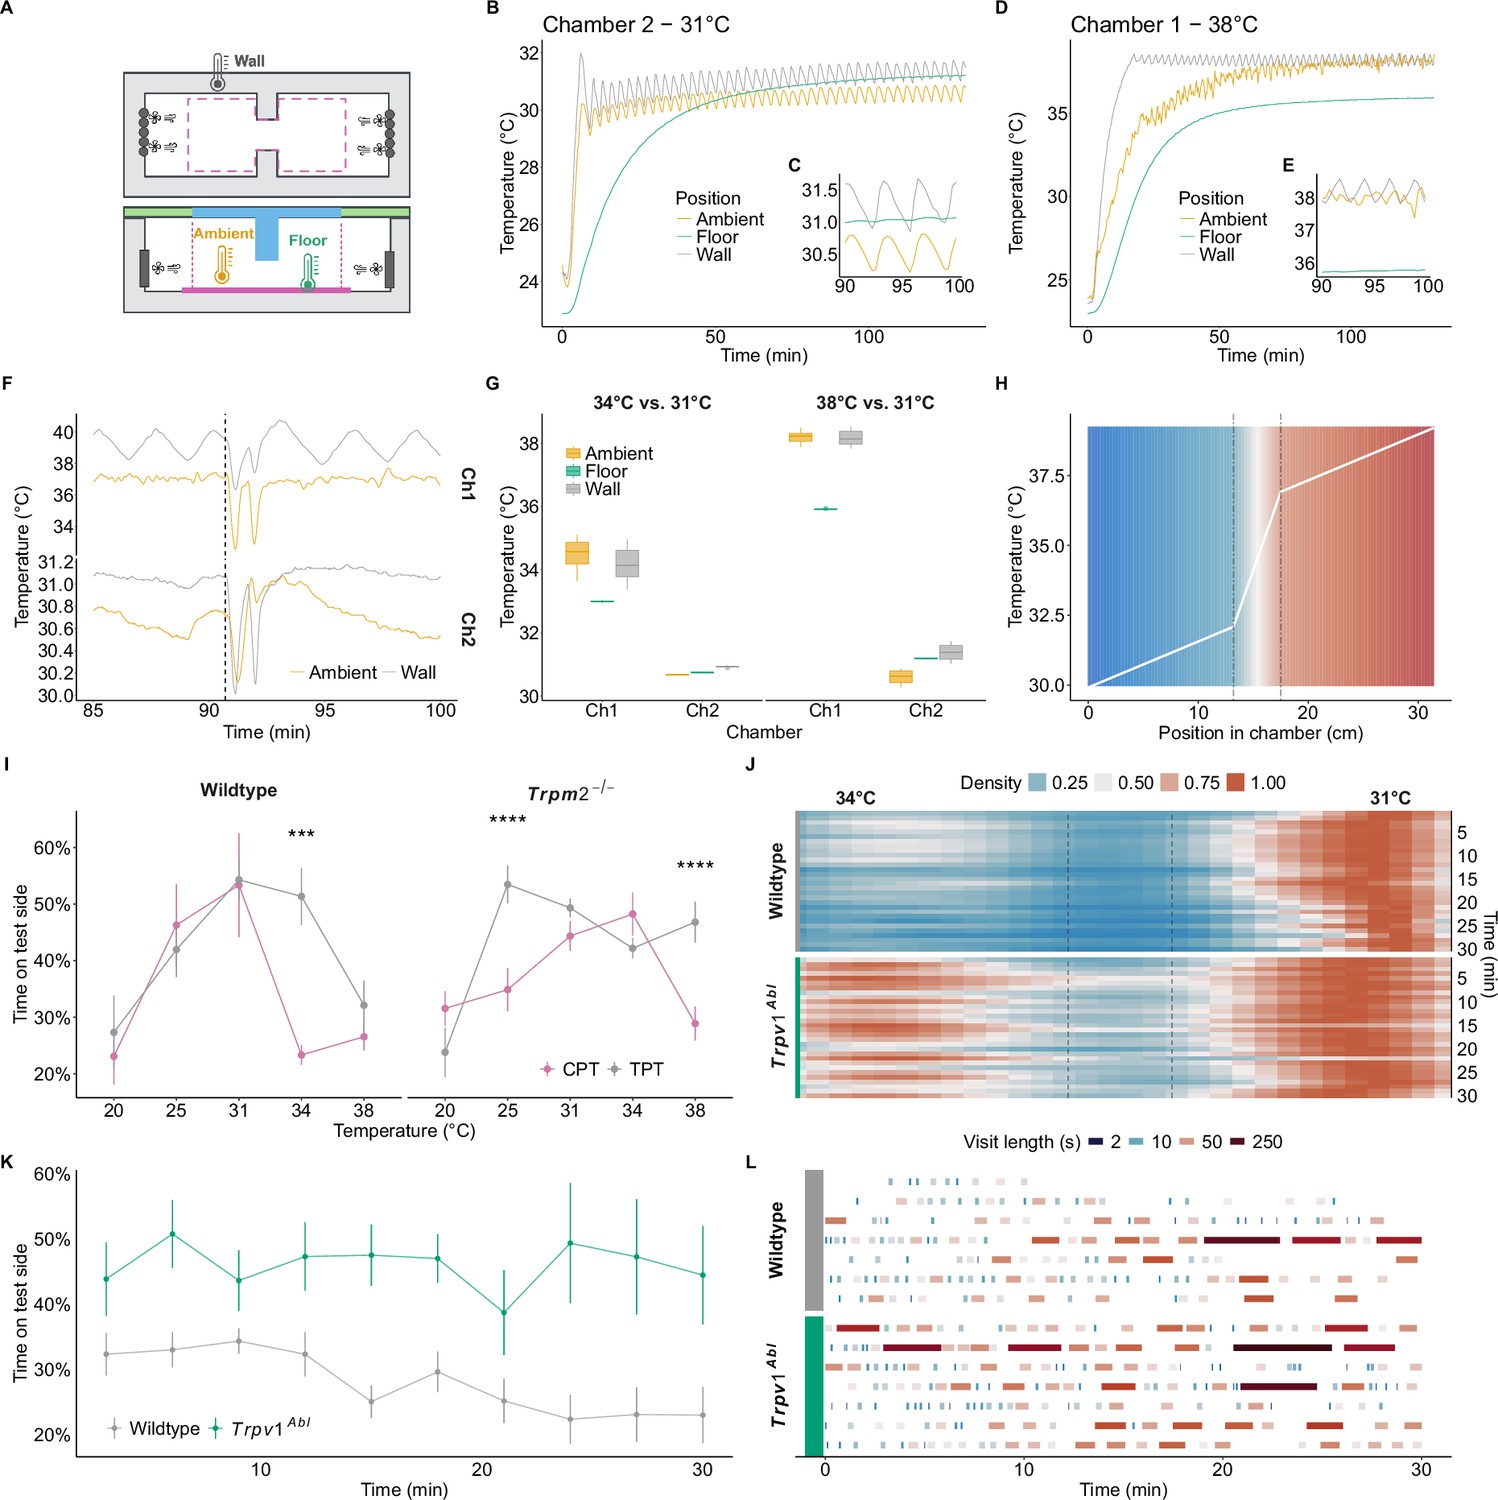
(A) Schematic of the chamber preference test (CPT) from the top (upper panel) and side (lower panel). A styrofoam enclosure ensures adequate thermal isolation (grey shading). Peltier elements (dark grey ovals) equipped with fans allow the rapid circulation of heat throughout the chamber. Two wall thermometers allow monitoring and regulation of the chamber temperature in a closed-loop fashion. A steel cage (dashed pink line) marks the area where the animals move around freely. A stainless-steel floor (pink) allows easy clean-up and adaptation of the ambient temperature. A transparent top (blue) allows video recording and tracking of the animal position throughout the experiment. Two ambient and floor thermometers were used to calibrate the corresponding wall thermometer to achieve the desired ambient temperature in each chamber. (B, D) Exemplary temperature development at the beginning of an experimental day for each chamber and thermometer indicated in (A). Neutral chamber set to 31°C shown in (D). Test chamber set to 38°C shown in (B). Insets (C) and (E) zoom-in onto the temperature recordings once the chambers stabilized (around 90 minutes of pre-warming). (F) Stability of ambient and wall temperature in chamber 1 (Ch1) and 2 (Ch2) when opening the enclosure to replace animals. The dashed line shows the time point of opening the enclosure. Floor temperature remained unaffected (data not shown). (G) Shown are box plots of wall, ambient, and floor temperatures at 31°C neutral temperature and 34°C or 38°C test temperatures in chamber 1 (Ch1) and chamber 2 (Ch2). (H) Calculated ambient temperature gradient in the CPT at 31°C neutral and 38°C test temperatures. The dashed line shows the tunnel connecting both chambers. (I) Comparison of CPT and conventional two-plate preference test (TPT) temperature preference assays in the same cohort of wildtype (n = 12) and Trpm2-/- (n = 17) animals, shown in CPT (Figure 1). Depicted is the mean preference and SEM at each test temperature. Linear mixed model over setup type and temperature with random effects across animals followed by multiple comparison testing with Sidak correction against TPT. (J) Density maps of the x-position of wildtype (n = 41) and thermally ablated animals (Trpv1-Abl, n = 13) at 31°C vs 34°C. Binned in 1-minute bins, concatenated, and interpolated. Dashed lines represent the tunnel connecting both chambers. (K) Mean proportion and SEM of time spent on the test side of animals shown in (J). ANOVA over genotype and time (genotype F(1,52) = 15.96 <0.001). (L) Overview of the frequency and length of the visits to the test chamber 7 randomly sampled animals from (J) and (K). Each visit is coloured by the log2 of its length to highlight varying visit lengths. *p<0.05, **p<0.01, ***p<0.001.
Figure 1—figure supplement 2
Temperature preference behaviour at 25°C.
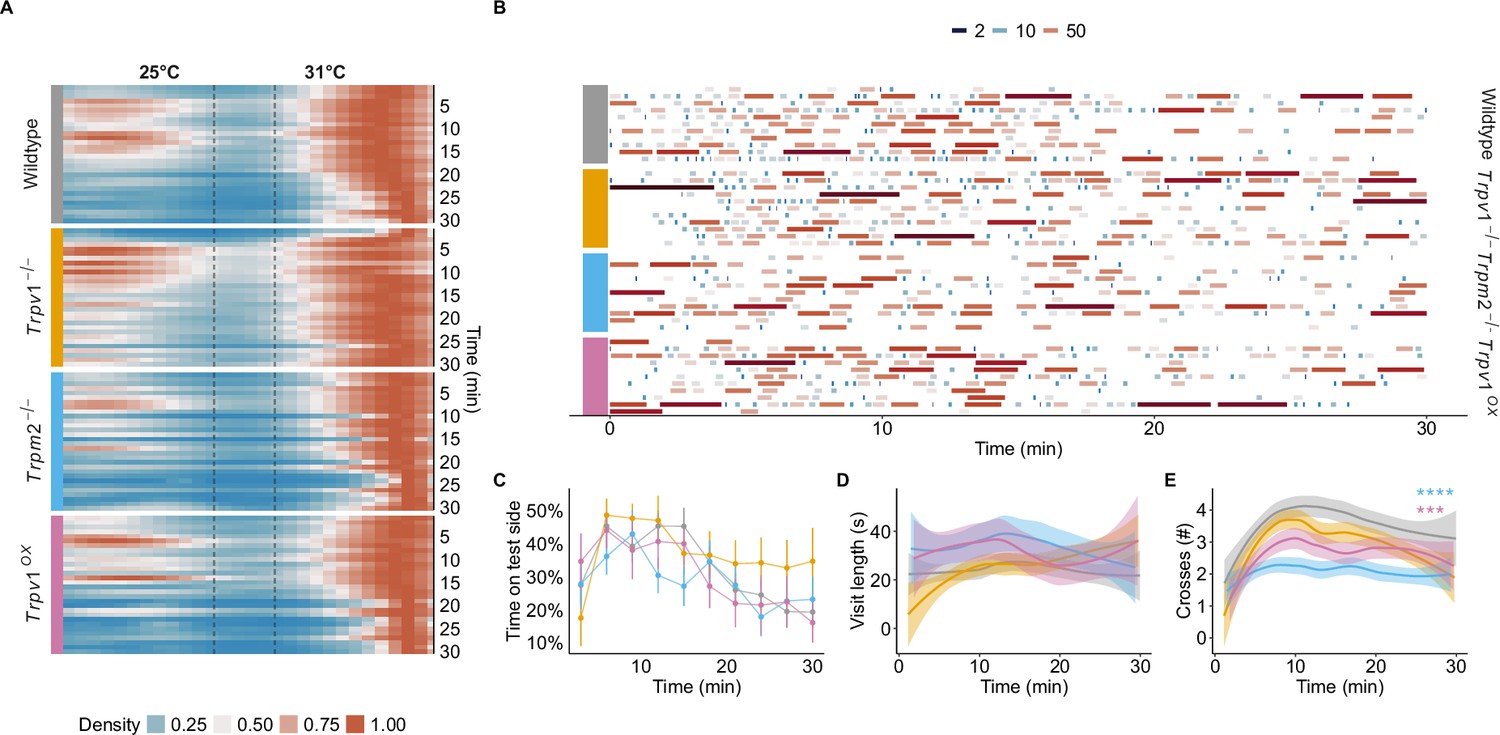
(A) Density maps of the x-position of the animals shown in chamber preference test (CPT) (Figures 1 and 4) when given the choice of 25°C and 31°C (reference temperature), over time. (B) Visit lengths to the 25°C chamber over time for 11 randomly sampled animals per genotype from (A). (C) Mean proportion and SEM of time spent at 25°C for animals from (A). ANOVA over genotype, time, and their interaction (F(5.88,258.92) = 7.01, p<0.001). (D) Averaged and smoothed visit lengths in a 3-minute rolling window with a 1-minute lag. The shaded area depicts the 95% confidence interval. (E) As in (D) but for the number of crosses. Cox regression over genotype (X2 (2) = 42.73, p<0.0001). Results of post hoc multiple comparison against wildtype are indicated. ****p<0.001.
Figure 1—figure supplement 3
Temperature preference behaviour of Trpm8-/- animals.
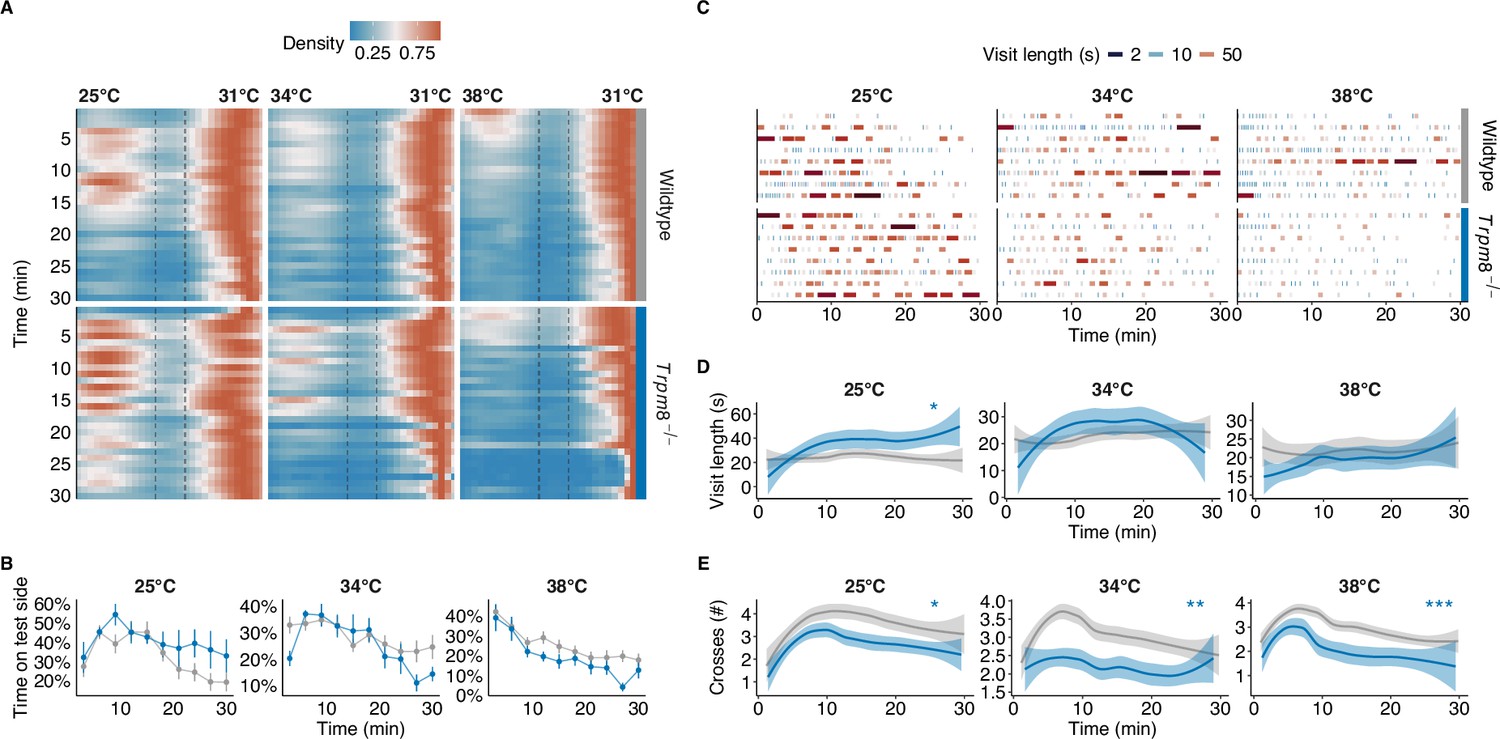
(A) Density occupation map of the Trpm8-/- animals at different test temperatures, over time. (B) Mean proportion and SEM of time spent at test side in 3-minute bins of animals from (A). (C) Overview of the frequency and length of the visits to the test chamber for eight randomly sampled animals per genotype and temperatures from (A). Each visit is coloured by the log2 of its length to highlight varying visit lengths. (D) Averaged and smoothed visit lengths in a 3-minute rolling window with a 1-minute lag. The shaded area depicts the 95% confidence interval. Linear mixed model over genotype and time with random effects across animals. Results of post hoc multiple comparison by timepoint against wildtype are indicated. (E) As in (D) but for the number of crosses. Cox regression over test temperatures (25°C: X2 (1) = 6.45, p<0.05; 34°C: X2 (1) = 8.81, p<0.01; 38°C: X2 (1) = 15.32, p<0.001). *p<0.05, ***p<0.001.
Figure 2 with 2 supplements
Absence of TRPV1 and to a lesser extent TRPM2 lead to a reduction in responses to warmth stimuli in dorsal root ganglion (DRG) cultures.
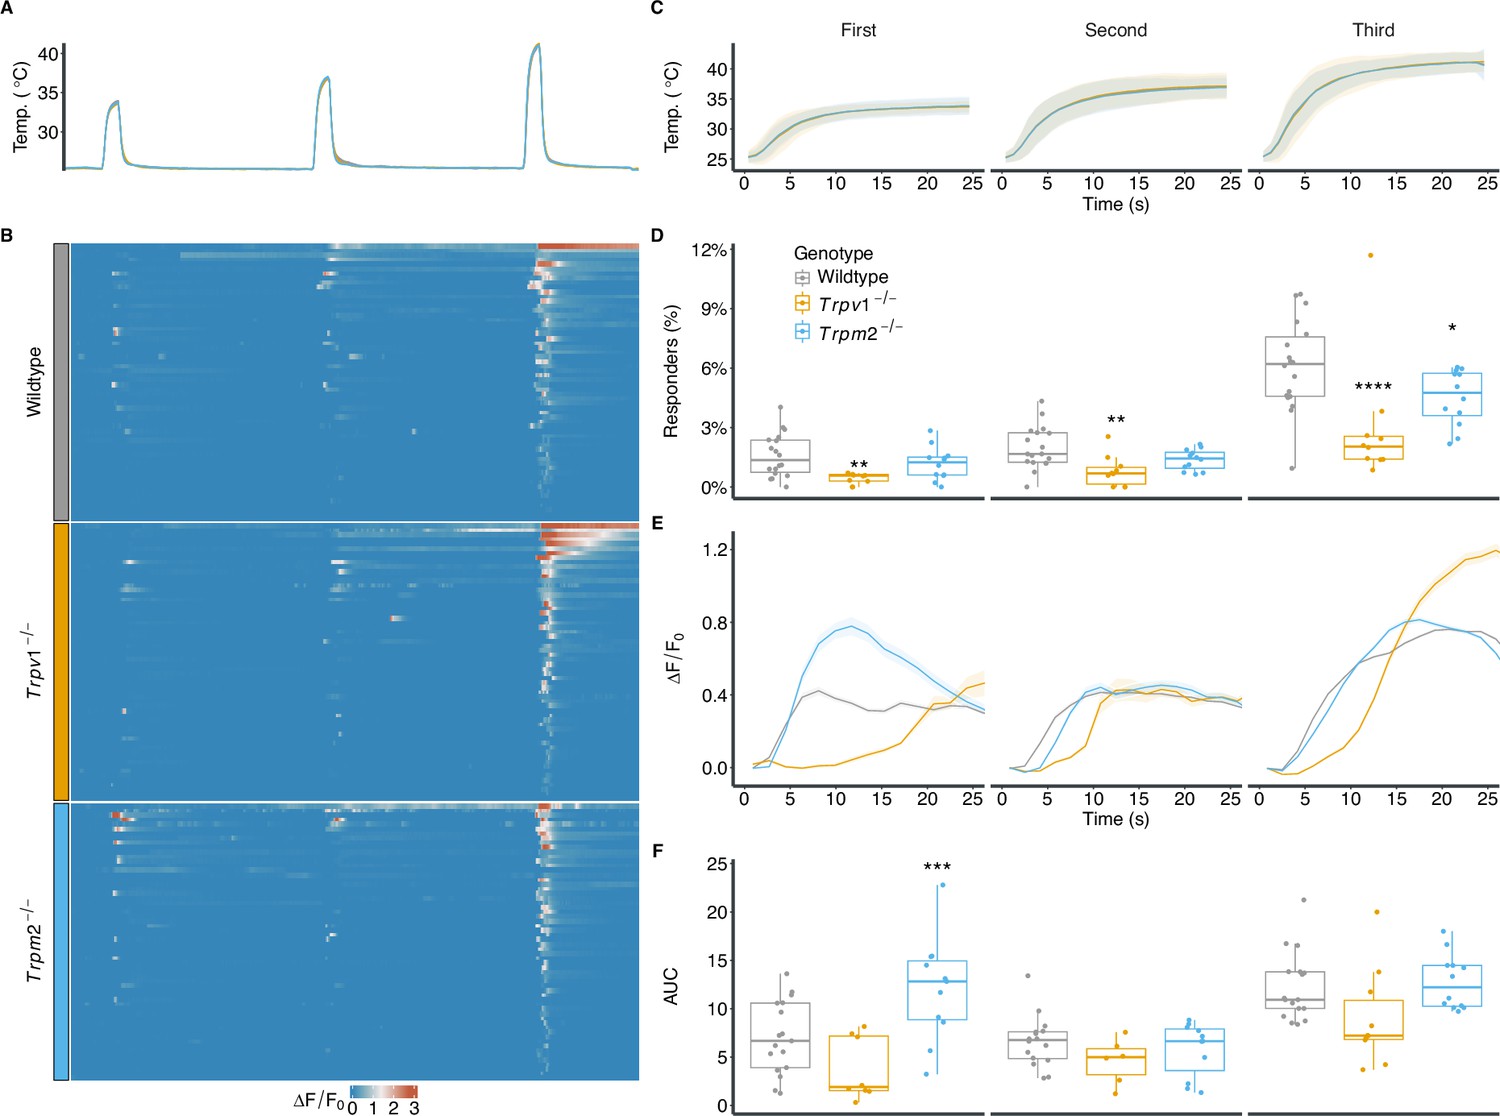
(A) Experimental paradigm of temperature stimulation. Three sequential and increasing temperature stimuli of 25 seconds, with 5-minute inter-stimulus intervals. Traces represent mean temperatures for wildtype, Trpv1-/-, and Trpm2-/- cultures. (B) Heat map showing representative normalized () calcium response of warm-sensitive neurons (60 randomly sampled cells per genotype). (C) Zoom-in of the mean and SD of the three warm-temperature stimuli shown in (A). (D) The proportions of responders to each stimulus in relation to all imaged neurons from wildtype (5 animals, 18 field of views [FOVs], 6374 cells), Trpv1-/- (5 animals, 9 FOVs, 3009 cells), and Trpm2-/- (6 animals, 12 FOVs, 4315 cells). Each dot represents an FOV. ANOVA over genotype (F(2,36) = 14.24, p<0.001), stimulus (F(1.31, 47.32) = 113.44, p<0.001), and their interaction (F(2.63, 47.32) = 9.18, p<0.001). Results of post hoc multiple comparison against wildtype are indicated. (E) Average and SEM for all responders over the whole stimulus (as shown in B) from wildtype (412 cells), Trpv1-/- (111 cells), and Trpm2-/- (204 cells). (F) Box plots of the mean area under the curve (AUC) of () from each FOV used in (D). Linear mixed model over genotype and stimulus with random effects across animals and FOVs. Pairwise contrasts against wildtype are indicated. *p<0.05, **p<0.01, ***p<0.001.
Figure 2—figure supplement 1
Responder classification and comparison of culturing conditions for primary sensory neurons.
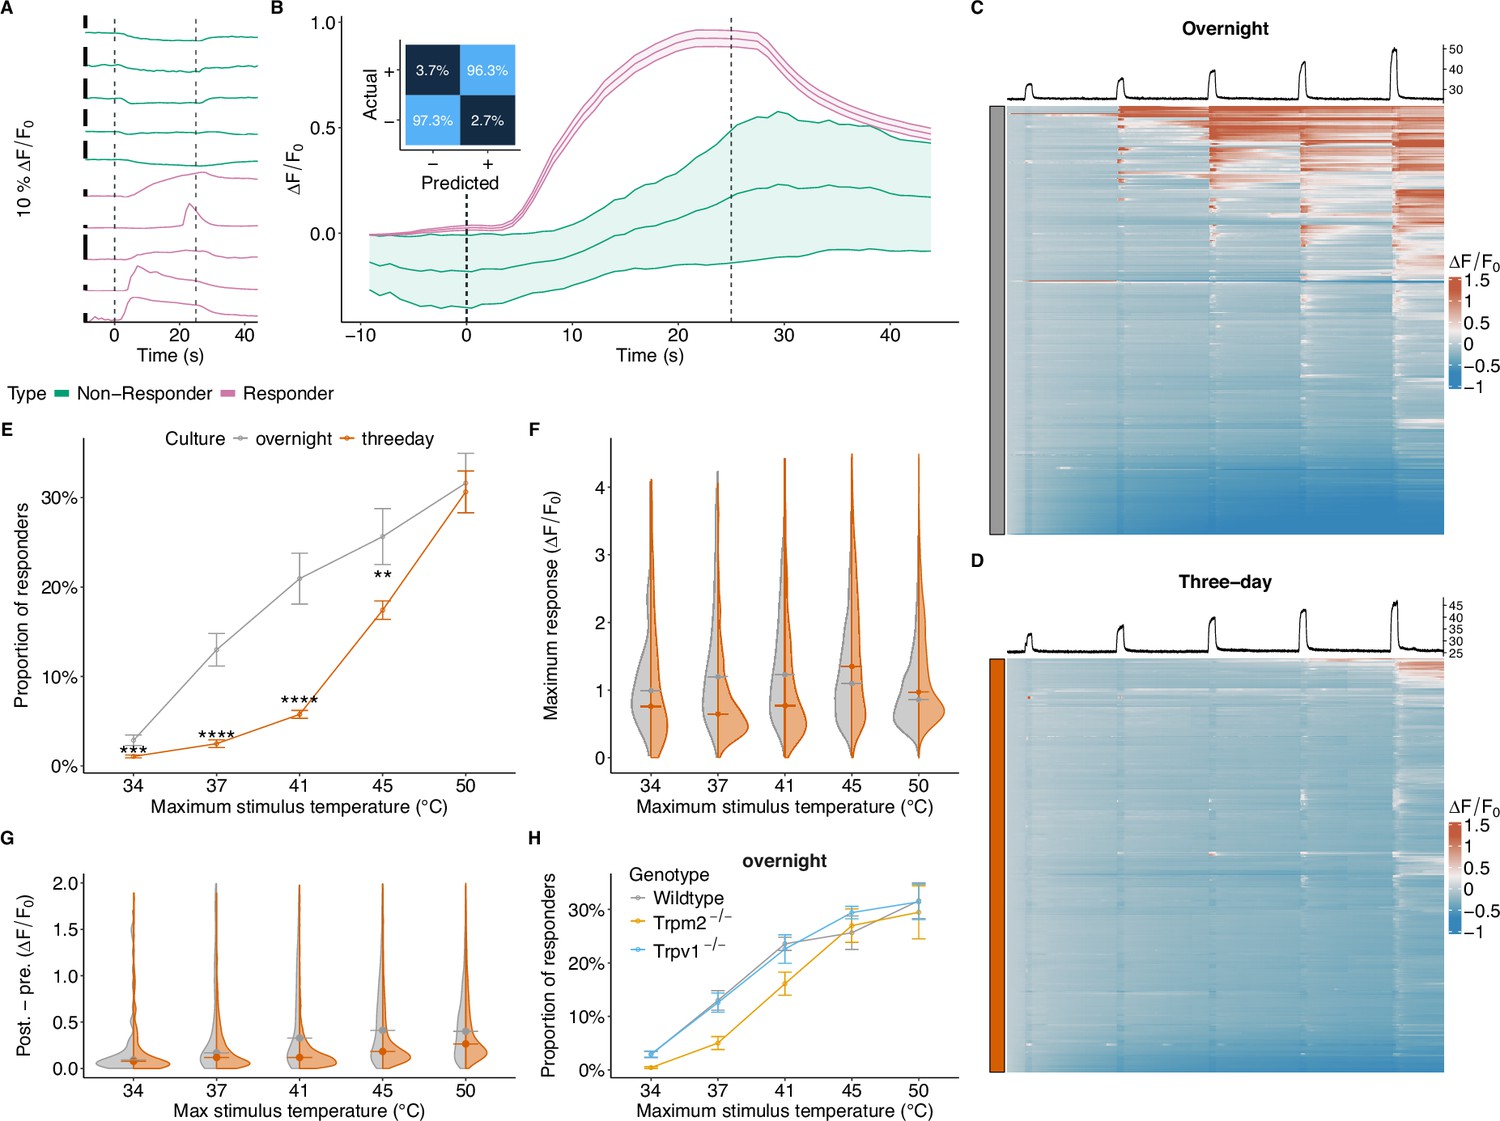
(A) Examples of temperatures responsive and non-responsive dorsal root ganglion (DRG) neurons used to train the classifier. The dashed lines represent stimulus beginning and end. (B) Average response and SEM of all responsive and non-responsive DRG neurons used to train the classifier. Classification performance (inset) shown as a confusion matrix with the percentage of actual and predicted responders (+) and non-responders (-). (C, D) Heat map showing normalized calcium responses () of individual cells (each row represents one cell) of a single field of view (FOV) of 300 randomly sampled primary DRG neurons cultured overnight (C) or for 3 days (D) in response to five consecutive and increasing temperature stimuli. (E) Fraction of responding cells in relation to all imaged cells for overnight and 3-day cultures in response to the temperature stimuli. Means and SEMs of overnight (4 animals, 8 FOVs, 2028 cells) and 3-day (15 animals, 43 FOVs, 21149 cells) cultures. ANOVA over culturing method (F(1,41) = 18.32, p<0.001), stimulus (F(1.47, 80.08) = 101.42, p<0.001), and their interaction (F(1.47, 80.08) = 7.6, p=0.003). Results of post hoc multiple comparison against overnight culture are indicated. (F) Split violin plots showing the distributions of the maximum for all responding cells during each stimulus. (G) The post- and pre-stimulus difference for each cell in each stimulus for both conditions. A window of 25 seconds before and after each stimulus was used to calculate the mean for each window. A difference of 0 indicates that a cell was able to completely return to its baseline after responding to the stimulus. (H) The mean proportions and SEM of responders to each temperature stimulus in relation to all imaged neurons in cells cultured overnight from wildtype (4 animals, 8 FOVs, 2028 cells), Trpv1-/- (2 animals, 6 FOVs, 1714 cells), and Trpm2-/- (3 animals, 5 FOVs, 1816 cells). *p<0.05, **p<0.01, ***p<0.001.
Figure 2—figure supplement 2
Response characteristics of dorsal root ganglion (DRG) neurons to warm and hot temperatures.
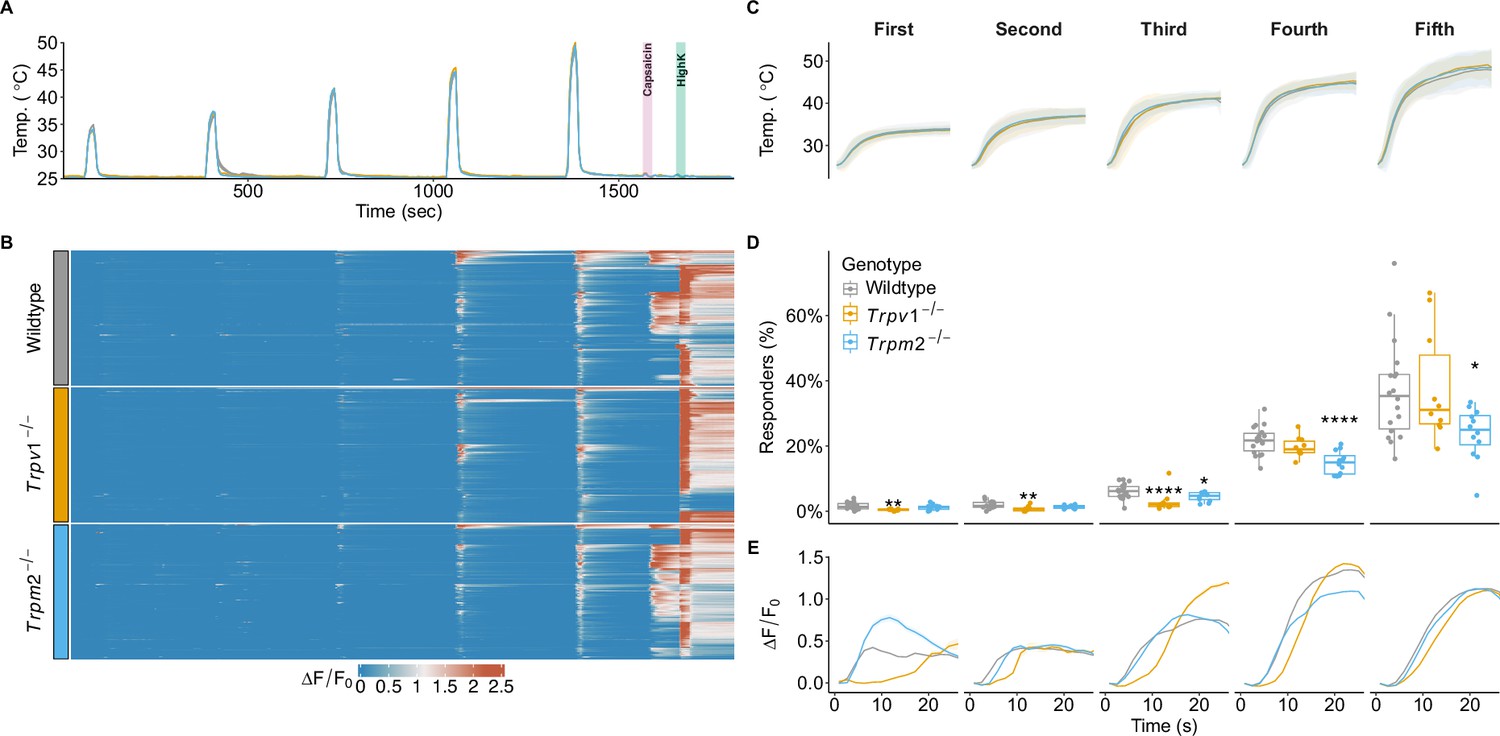
(A, B) Experimental paradigm of temperature stimulation. Five sequential and increasing temperature stimuli of 25 seconds with 5 minutes inter-stimulus intervals followed by capsaicin (1 μM) and high potassium stimulation. Capsaicin was used to identify TRPV1-positive cells and high potassium to identify neuronal cells. The traces represent mean temperatures of the field of view (FOV) shown in (B). (B) Examples of normalized () calcium responses of temperature-sensitive cells sampled from all FOVs and experiments (n = 250 cells per genotype). (C) Mean and SD of the five temperature stimuli applied. (D) The proportions of responders to each temperature stimulus in relation to all imaged neurons from wildtype (5 animals, 18 FOVs, 6374 cells), Trpv1-/- (5 animals, 10 FOVs, 3009 cells), and Trpm2-/- (6 animals, 12 FOVs, 4315 cells). Each dot represents an individual FOV. Note that the fraction of warm-sensitive neurons is small (6 ± 3%) and therefore necessitates large sample sizes for robust estimations of effects caused by gain- and loss-of-function models. ANOVA over genotype (F(2,37) = 5.52, p=0.008), stimulus (F(1.12, 41.51) = 203.09, p<0.001), and their interaction (F(2.24, 41.51) = 4.24, p=0.018). Results of post hoc multiple comparison against wildtype are indicated. (E) Average and SEM for all responders over the whole stimulus (as shown in C). *p <0.05, **p<0.01, *** p<0.001.
Figure 3 with 1 supplement
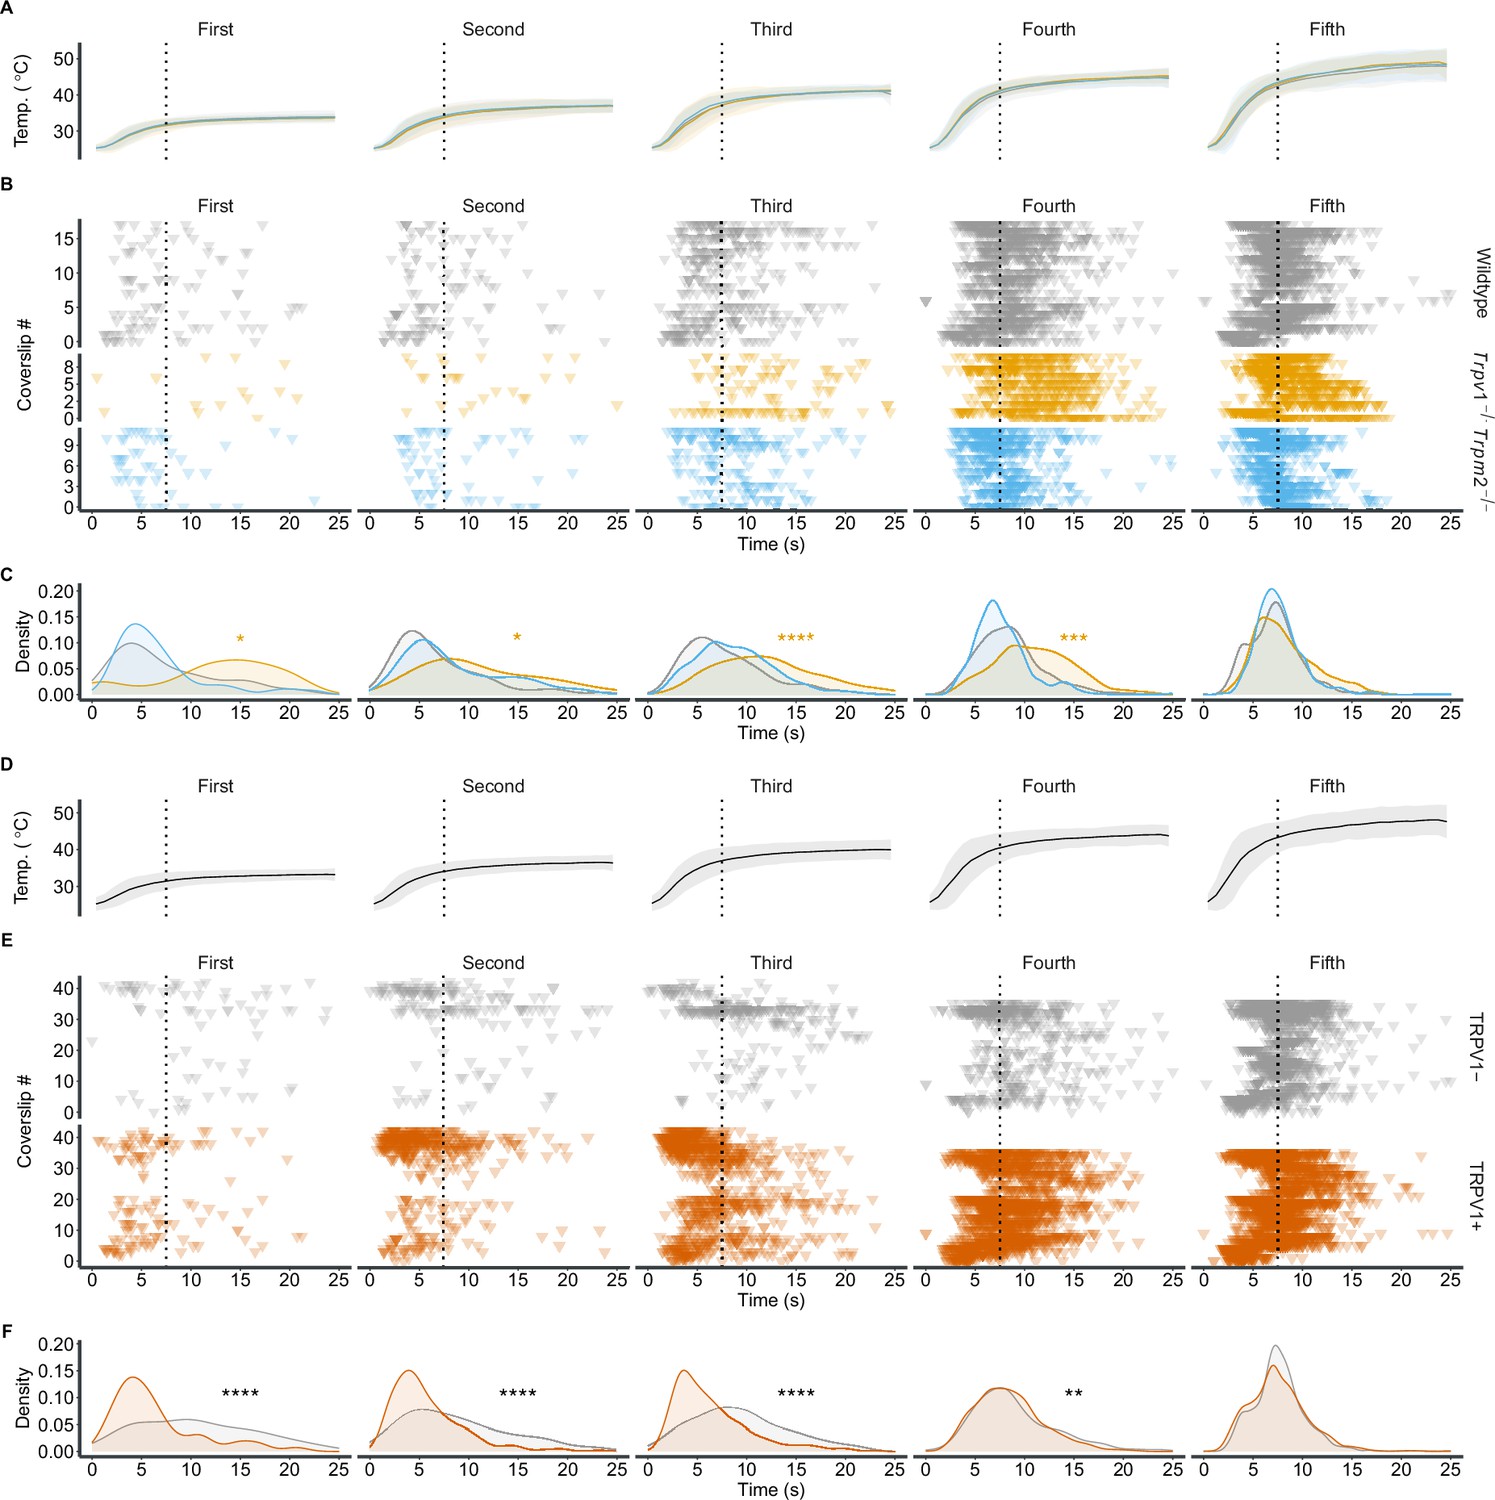
Trpv1-/- diminishes the response to dynamic temperature changes.
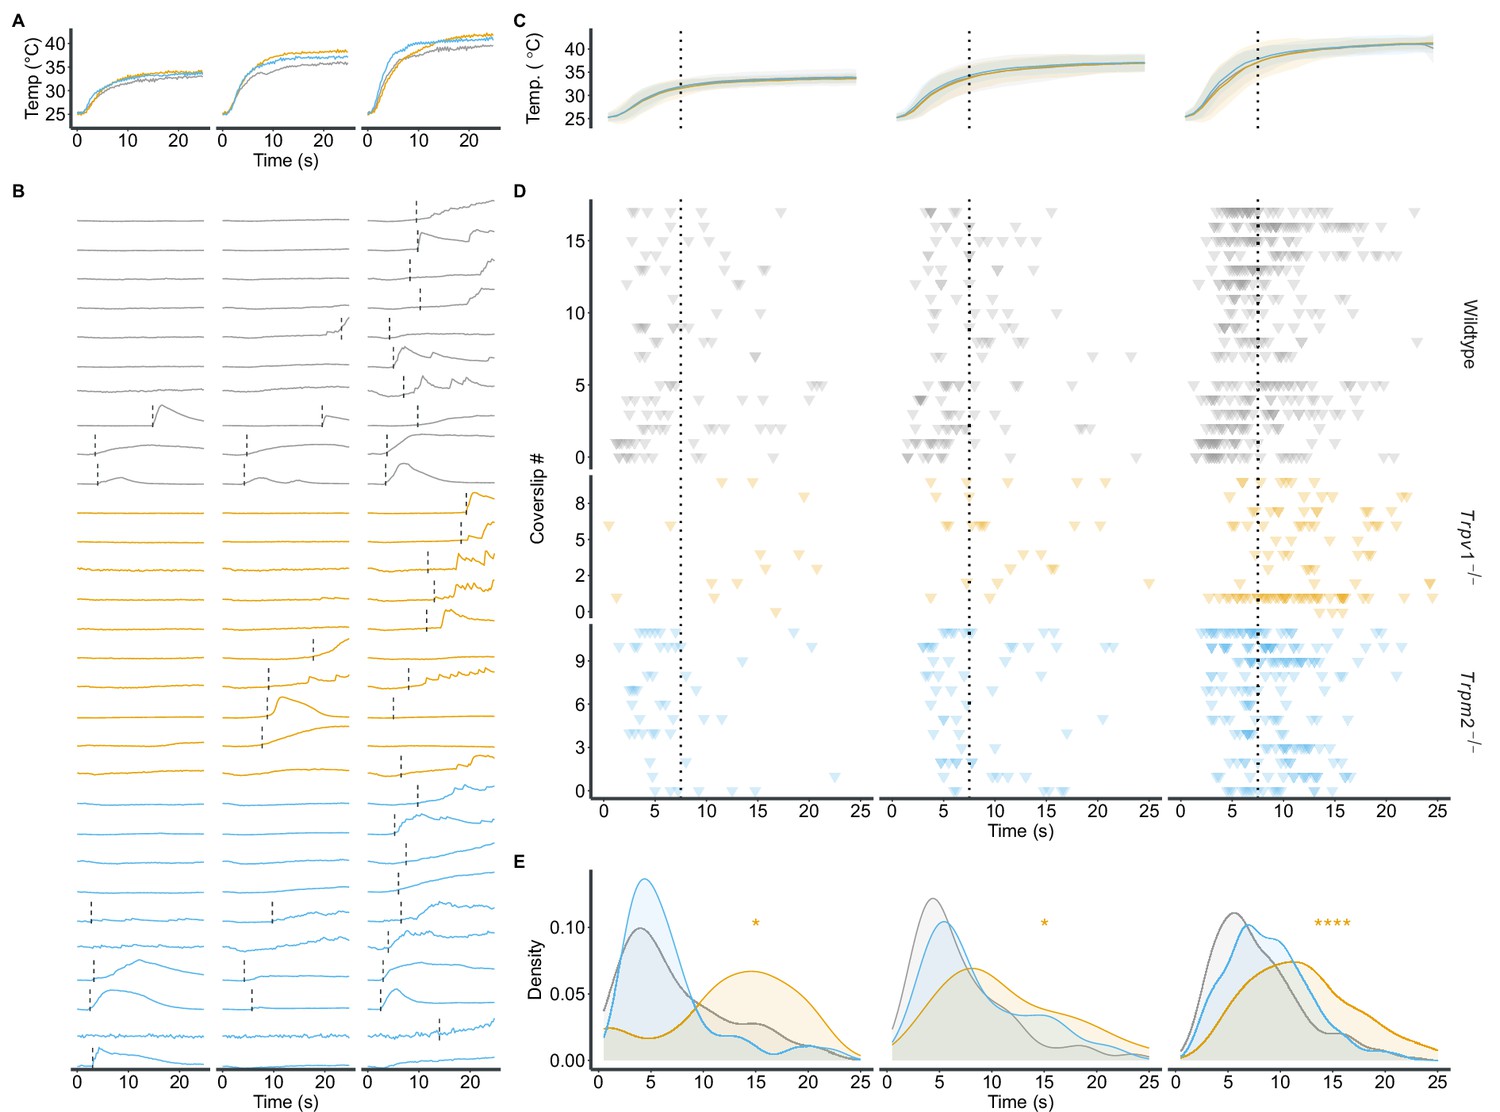
(A) Temperature traces from three exemplary imaging sessions. (B) Individual calcium traces () of 10 representative thermosensitive neurons from each genotype in response to the applied stimuli. The position of the dashed line indicates the time when the cells exceeded 10% of their maximum during the stimulus. (C) Mean and SD of the three warm-temperature stimuli shown in (A). The dotted line indicates the separation between the dynamic and static phases, defined by the end of the peak of the smoothed temperature change rate. (D) Response onset of all recorded warm-sensitive neurons. Each row represents a single field of view (FOV) (see Figure 2D). Each triangle indicates the time point at which the individual cell responds to the stimulus as shown in (B). Dotted line as in (C). (E) Density plot of response time points for each genotype and stimulus. Distributions were compared against wildtype using the Wilcoxon ranked sum test with false discovery rate post hoc correction. *p<0.05, ****p<0.0001.
Figure 3—figure supplement 1
Responses to dynamic and static segments of warm and hot temperature stimuli.
(A) Mean and SD of the five warm-temperature stimuli applied. The dotted line indicates the transition between the dynamic and the static phases of the temperature stimuli. (B) Response initiation of all temperature-responsive cells imaged. Each row represents a field of view (FOV). Each triangle denotes the time point at which the cell begins to respond to the stimulus. Dotted line as in (A). (C) Density representations of response time points for each genotype and stimulus. (D) and (E) same as (A) and (B), except that only wildtype dorsal root ganglion (DRG) cultures are included; cells are separated into two subgroups based on their responsiveness to capsaicin (orange: responsive; grey: non-responsive). (F) Density estimates of the response time points shown in (E). *p<0.05, ***p<0.001, ****p<0.0001.
Figure 4
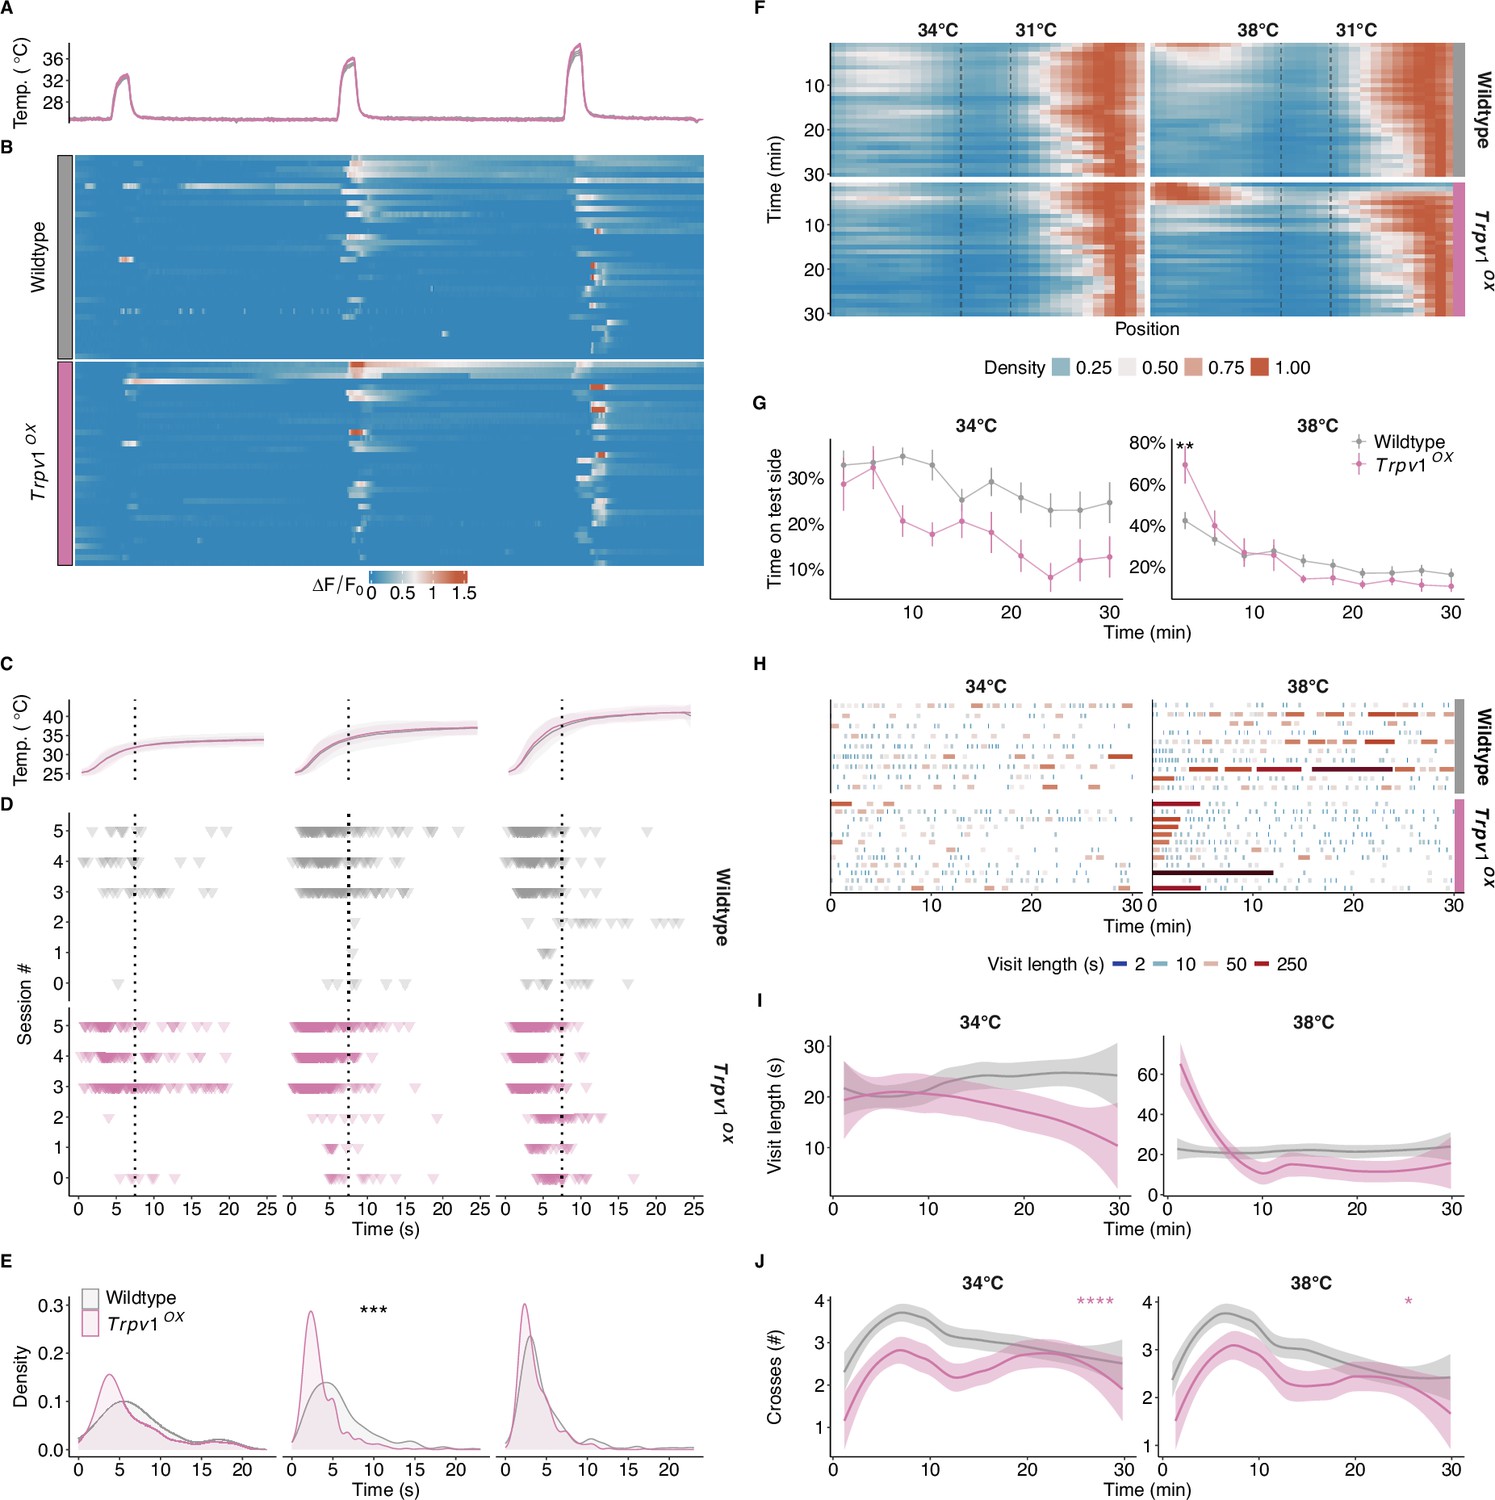
High TRPV1 expression levels promote dynamic warm-temperature detection and enhance temperature preference.
(A) Mean temperatures from all experiments and imaging sessions for wildtype (3 animals, 6 field of views [FOVs], 3133 cells) and Trpv1-OX (2 animals, 5 FOVs, 3754 cells) cultures. (B) Examples of normalized () calcium responses of warm-sensitive neurons responding to any of the stimuli depicted in (A). 42 randomly sampled cells from each genotype. (C) Mean and SD of the three warm-temperature stimuli applied. The dotted line indicates the separation between the dynamic phase and the static phase (see Figure 3C). (D) Response initiation of all warm-sensitive neurons imaged from wildtype and Trpv1-OX animals. Each row represents an individual imaging session. Each triangle denotes the time point at which the cell responds to the stimulus, as shown in Figure 3B. Dotted line as in (C). (E) Density representation of response time points for each genotype and stimulus. Distributions were compared against wildtype using the Wilcoxon ranked sum test. (F) Density maps of all wildtype (n = 48) and Trpv1-OX (n = 12) animals in the chamber preference test (CPT) over time. (G) Mean proportion and SEM of time spent in the test chamber for animals shown in (F) over time, binned in 3-minute intervals. ANOVA over genotype (34°C: F(1,51) = 6.49, p<0.05), time (34°C: F(6.12,311.93) = 4.49, p<0.001; 38°C: F(4.71,240.22) = 28.27, p<0.001), and their interaction (38°C: F(4.71,240.22) = 4.42, p<0.001). Results of post hoc multiple comparison by timepoint against wildtype are indicated. (H) Overview of the frequency and length of the visits to the test chamber for all animals shown in (F). Each visit is coloured by the log2 of its length to highlight varying visit lengths. (I) Averaged and smoothed visit lengths in a 3-minute rolling window with a 1-minute lag. The shaded area depicts the 95% confidence interval. Linear mixed model over genotype and time with random effects across animals. (J) As in (I) but for the number of crosses. Cox regression over genotype (34°C: X2 (2) = 17.52, p<0.001; 38°C: X2 (2) = 4.13, p<0.05). *p<0.05, **p<0.01, ***p<0.001, ****p<0.0001.
Figure 5 with 1 supplement
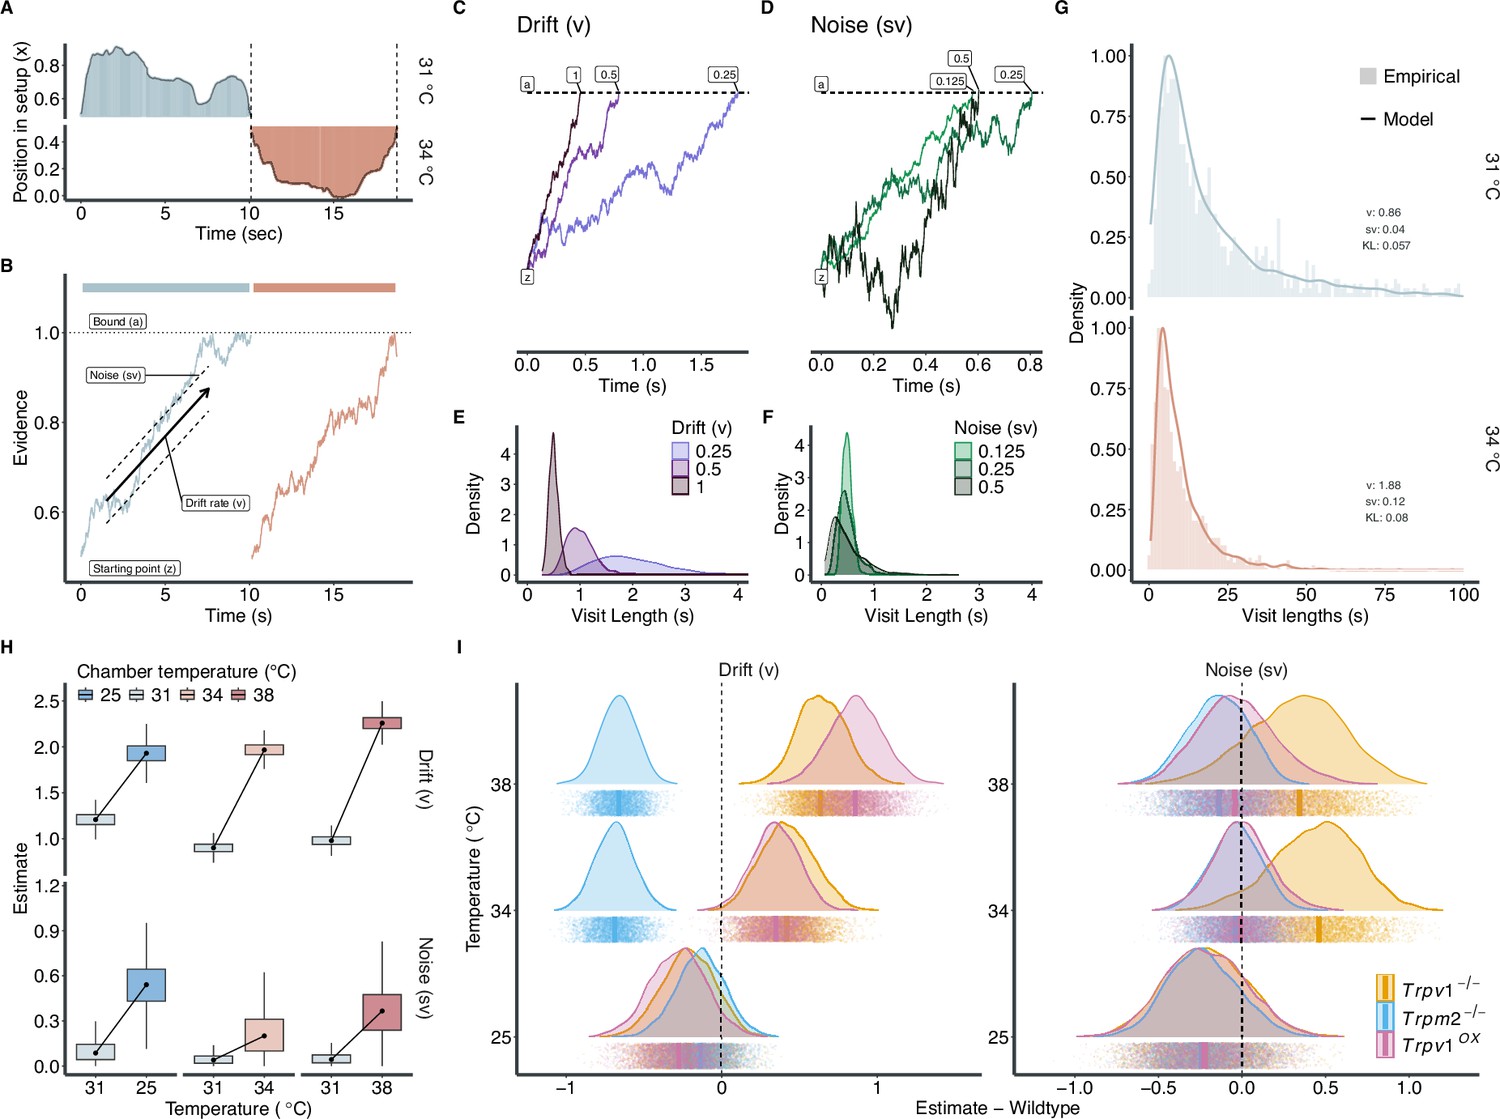
Modelling the varying roles of TRPV1 and TRPM2 on warm-temperature detection.
(A) Two example episodes of an animal inside the chamber preference test (CPT), crossing from one chamber to the other (see Figure 1G). Dashed line represents crossing time points between chambers. (B) Examples of possible evidence accumulation process for the two episodes in (A) using a drift diffusion model (DDM). (C, D) Simulations of a drift diffusion process with fixed starting points (z = 0.5) and bound (a = 1) while varying drift rates (v in C) and noise (sv in D). (E) and (F) depict the resulting distributions of visit lengths when simulating 1000 trials with the parameters from (C) and (D), respectively. (G) Distributions of visit lengths at 31°C vs. 34°C in wildtype animals. Insets show the estimated parameters for v and sv at each temperature and the Kullback–Leibler (KL) divergence between the model (continuous density line) and the empirical data (histogram). See Figure 5—figure supplement 1 for all model fits. (H) Box plots of drift v and noise sv estimates for both neutral (31°C:, solid line) and test (25–38°C, dashed line) chambers for wildtype animals resulting from hierarchical Markov chain Monte Carlo (MCMC) sampling. (I) Neutral chamber (31°C) corrected and wildtype-subtracted estimates of drift and noise for all genotypes. The dashed line represents the wildtype reference. Points indicate individual MCMC samples, and vertical lines the median of each distribution.
Figure 5—figure supplement 1
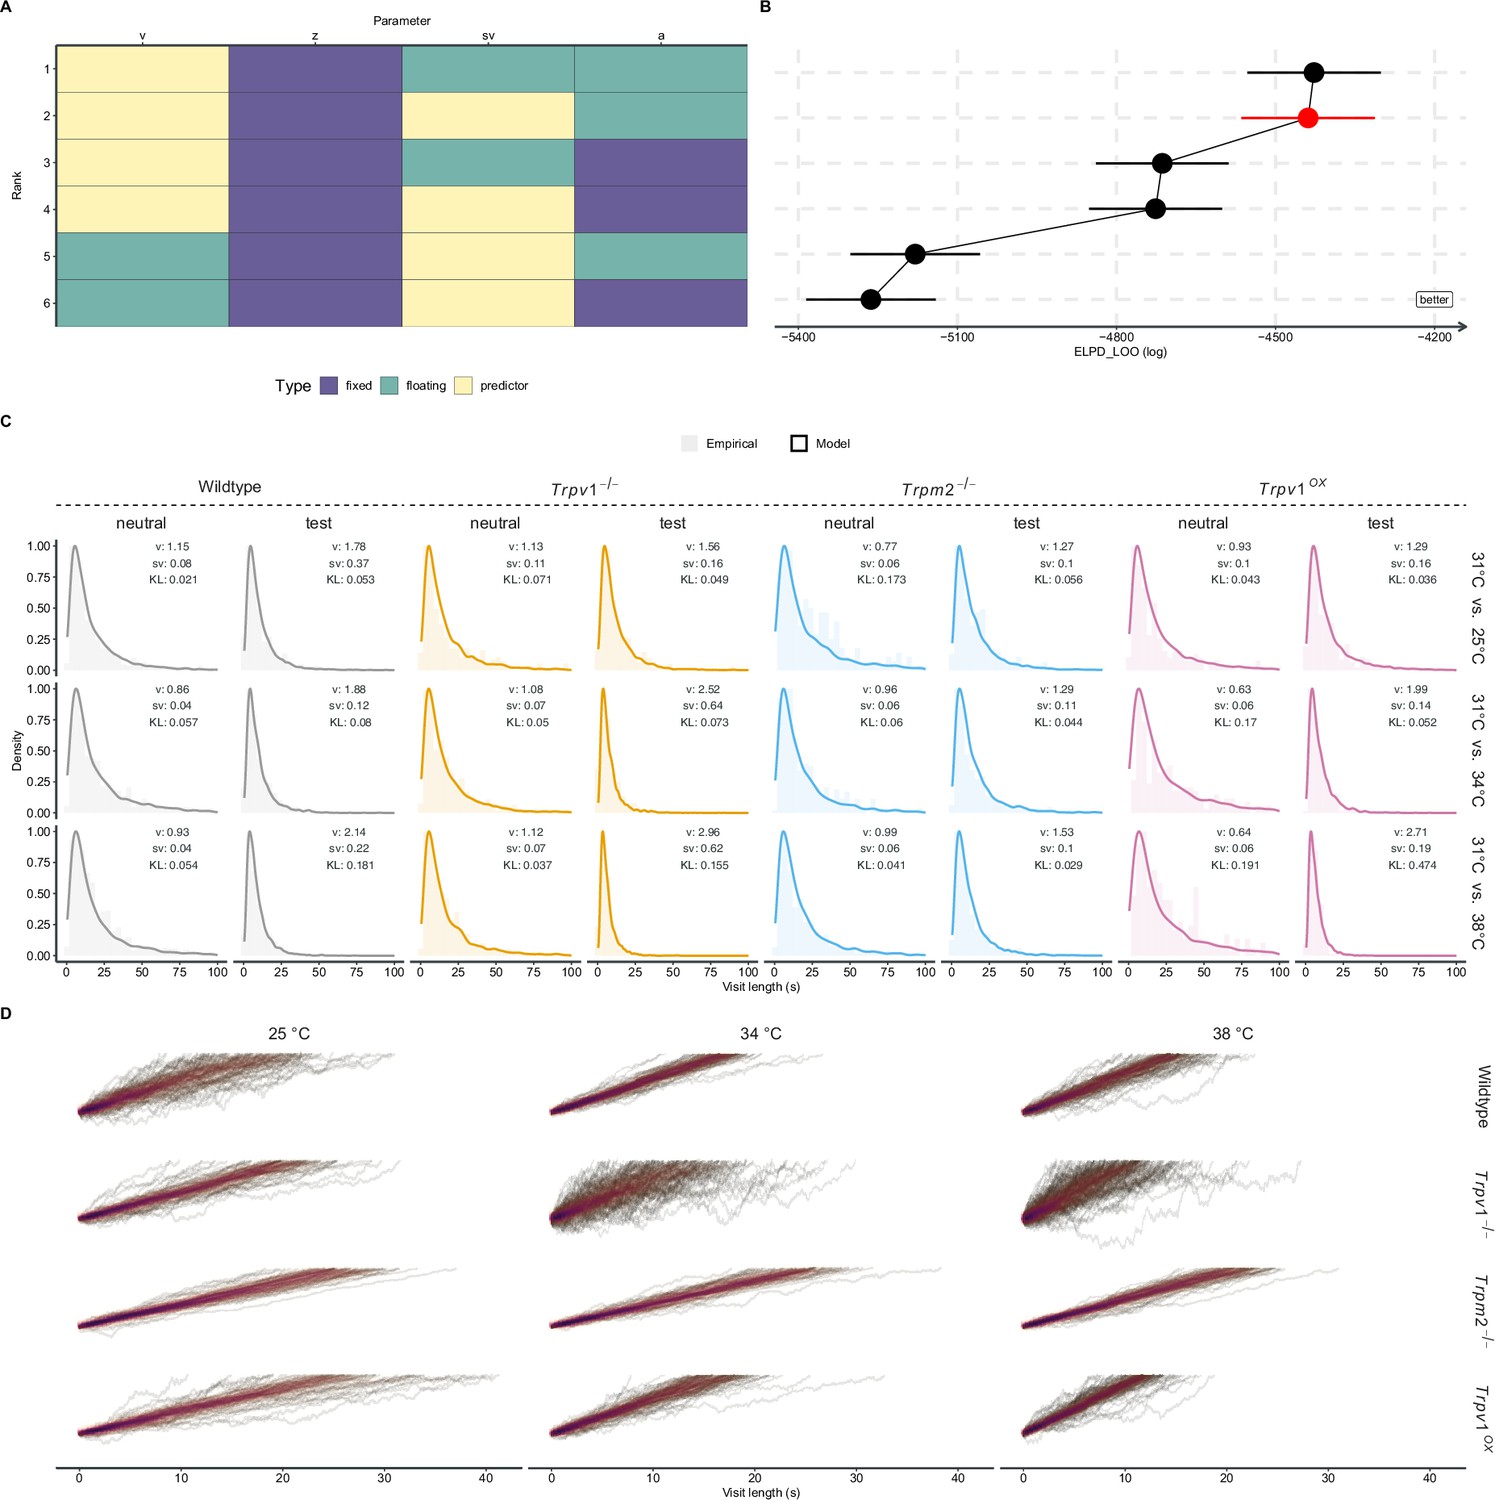
Model fits and drift diffusion model (DDM) simulations for all genotypes and test temperatures.
(A, B) Comparison of different model parameter combinations. To ensure that the DDM only reaches the upper bound, the bias z was kept fixed to 0.9, while all other parameters were allowed to either be predictors or fit to the entire data (floating) (A). Model performance was compared and ranked by calculating the expected log pointwise predictive density (ELPD) by Pareto smoothed importance sampling leave-one-out cross-validation (LOO) (B). Horizontal error bars depict the standard error of the ELPD-LOO. The chosen model is indicated in red. (C) Density estimates and histograms for collected empirical data (histogram) and 1000 simulated trials (density solid line) using the medians for drift and noise estimated for each genotype and chamber via Markov chain Monte Carlo (MCMC). Insets detail the temperature of the chamber, the used values for drift (v) and noise (sv), and the Kullback–Leibler divergence (KL) between the simulated distribution and the empirical data. (D) Simulated evidence accumulation processes for each genotype and test temperature for a 30-minute experiment. Parameters for drift, noise, and bound (starting point fixed to 0.88) were sampled randomly from the MCMC chains. Each line represents a trial. The plots are overlaid with a two-dimensional density of the resulting points, to highlight the general trajectory and the spread of the process.
Tables
Key resources table
| Reagent type (species) or resource | Designation | Source or reference | Identifiers | Additional information |
|---|---|---|---|---|
| Strain, strain background (Mus musculus) | Wildtype | Janvier Laboratories | RRID:IMSR_RJ:C57BL-6NRJ | C57BL/6NRj |
| Genetic reagent (M. musculus) | Trpm2-/- | Yasuo Mori | RRID:MGI:5697655 | B6;Trpm2tm1Yamo/Uhg |
| Genetic reagent (M. musculus) | Trpv1-/- | David Julius | RRID:IMSR_JAX:003770 | B6.129X1-Trpv1tm1Jul/J |
| Genetic reagent (M. musculus) | Trpv1-OX | Interfacultary Biomedical Faculty, University of Heidelberg | RRID:IMSR_JAX:027390 | C57BL/6N-Tg(Trpv1)5917Jsmn/J |
| Genetic reagent (M. musculus) | Trpv1cre | The Jackson Laboratory | RRID:IMSR_JAX:017769 | B6.129-Trpv1tm1(cre)Bbm/J |
| Genetic reagent (M. musculus) | Rosa-DTA | The Jackson Laboratory | RRID:IMSR_JAX:006331 | Gt(ROSA)26Sortm1(DTA)Jpmb/J |
| Genetic reagent (M. musculus) | Trpv1-Abl | This paper | F1 from crossing Trpv1cre and RosaDTA | |
| Genetic reagent (M. musculus) | Trpm8-/- | David Julius | RRID:IMSR_JAX:008198 | Trpm8tm1Jul |
| Chemical compound, drug | 4-(2-hydroxyethyl)–1-piperazineethanesulfonic acid (HEPES) | Carl Roth | Cat# 9105.4 | |
| Chemical compound, drug | Cal-520 AM | AAT Bioquest | Cat# 21130 | |
| Chemical compound, drug | Calcium chloride dihydrate | MerckMillipore | Cat# 1023821000 | |
| Chemical compound, drug | Capsaicin | Tocris | Cat# 462 | |
| Chemical compound, drug | Isoflurane | Baxter | Cat# HDG9623 | |
| Chemical compound, drug | Magnesium chloride | Sigma-Aldrich | Cat# M8266 | |
| Chemical compound, drug | Pluronic F127 | Invitrogen | Cat# P6866 | |
| Chemical compound, drug | Poly-d-lysine (PDL) | Sigma | Cat# P7886 | |
| Chemical compound, drug | Potassium chloride | Labochem International | Cat# LC-5916.1 | |
| Chemical compound, drug | Proteinase K | Carl Roth | Cat# 7528.1 | |
| Chemical compound, drug | Sodium chloride | Sigma-Aldrich | Cat# 31434 | |
| Chemical compound, drug | Tris-HCl | Carl Roth | Cat# 5429.3 | |
| Chemical compound, drug | Trypsin-EDTA 0.05% | Thermo Fisher | Cat# 25300054 | |
| Chemical compound, drug | Antibiotic-Antimitotic (100×) | Thermo Fisher Scientific | Cat# 15240062 | |
| Peptide, recombinant protein | L-alanyl-L-glutamine dipeptide (GlutaMAX) | Invitrogen | Cat# 35050 | |
| Peptide, recombinant protein | Laminin | Sigma | Cat# L2020 | |
| Peptide, recombinant protein | Collagenase | Sigma | Cat# C0130 | |
| Peptide, recombinant protein | Bovine serum albumin (BSA) fraction V | Carl Roth | Cat# T844.1 | |
| Biological sample (Bos taurus) | Fetal calf serum (FCS) – EU Approved | Invitrogen | Cat# 10270 | |
| Other | Dulbecco’s PBS | Thermo Fisher Scientific | Cat# 14040141 | Sterile, commercial phosphate-buffered saline for cell-culture use |
| Other | DMEM/F12 without Glutamine | Thermo Fisher Scientific | Cat# 21331046 | Sterile, commercial medium for cell-culture |
| Software, algorithm | LOGO! Soft Comfort | Siemens | ||
| Software, algorithm | MetaFluor | Molecular Devices | RRID:SCR_014294 | |
| Software, algorithm | Miniscope DAQ | UCLA Miniscope Team | RRID:SCR_021480 | |
| Software, algorithm | Python 3.10 | Python Software Foundation | RRID:SCR_008394 | |
| Software, algorithm | R 4.3.2 | R Core Team | RRID:SCR_001905 | |
| Software, algorithm | FFmpeg 4.2 | FFmpeg Developers | RRID:SCR_016075 | |
| Software, algorithm | Thermes USB DAQ | Physitemp | ||
| Software, algorithm | HSSM 0.1.5 | GitHub | RRID:SCR_026356 | |
| Software, algorithm | MINIROCKET (sktime 0.35.0) | Dempster et al., 2021; Dempster and Jafferji, 2022 | https://doi.org/10.48550/arXiv.2012.08791 | |
| Software, algorithm | Suite2p | GitHub | RRID:SCR_016434 | |
| Software, algorithm | Cellpose | GitHub | RRID:SCR_021716 |
Additional files
Download links
A two-part list of links to download the article, or parts of the article, in various formats.
Downloads (link to download the article as PDF)
Open citations (links to open the citations from this article in various online reference manager services)
Cite this article (links to download the citations from this article in formats compatible with various reference manager tools)
Diverging roles of TRPV1 and TRPM2 in warm-temperature detection
eLife 13:RP95618.
https://doi.org/10.7554/eLife.95618.4


