Bacterial exonuclease III expands its enzymatic activities on single-stranded DNA
- Department of Veterinary Medicine, Zhejiang University College of Animal Sciences, China
- Hainan Institute of Zhejiang University, China
- Life Sciences Institute, Zhejiang University, Hangzhou, China
- School of Public Health, and Department of Pathology of Sir Run Run Shaw Hospital, Zhejiang University School of Medicine, China
- Key Laboratory of Systems Health Science of Zhejiang Province, School of Life Science, Hangzhou Institute for Advanced Study, University of Chinese Academy of Sciences, China
- CAS Key Laboratory of Synthetic Biology, Institute of Plant Physiology and Ecology, Shanghai Institutes for Biological Sciences, Chinese Academy of Sciences, China
- Department of Microbiology and Microbial Engineering, School of Life Sciences, Fudan University, China
- State Key Laboratory for Diagnosis and Treatment of Infectious Diseases, National Clinical Research Center for Infectious Diseases, National Medical Center for Infectious Diseases, The First Affiliated Hospital, College of Medicine, Zhejiang University, China
Figures
Figure 1 with 2 supplements
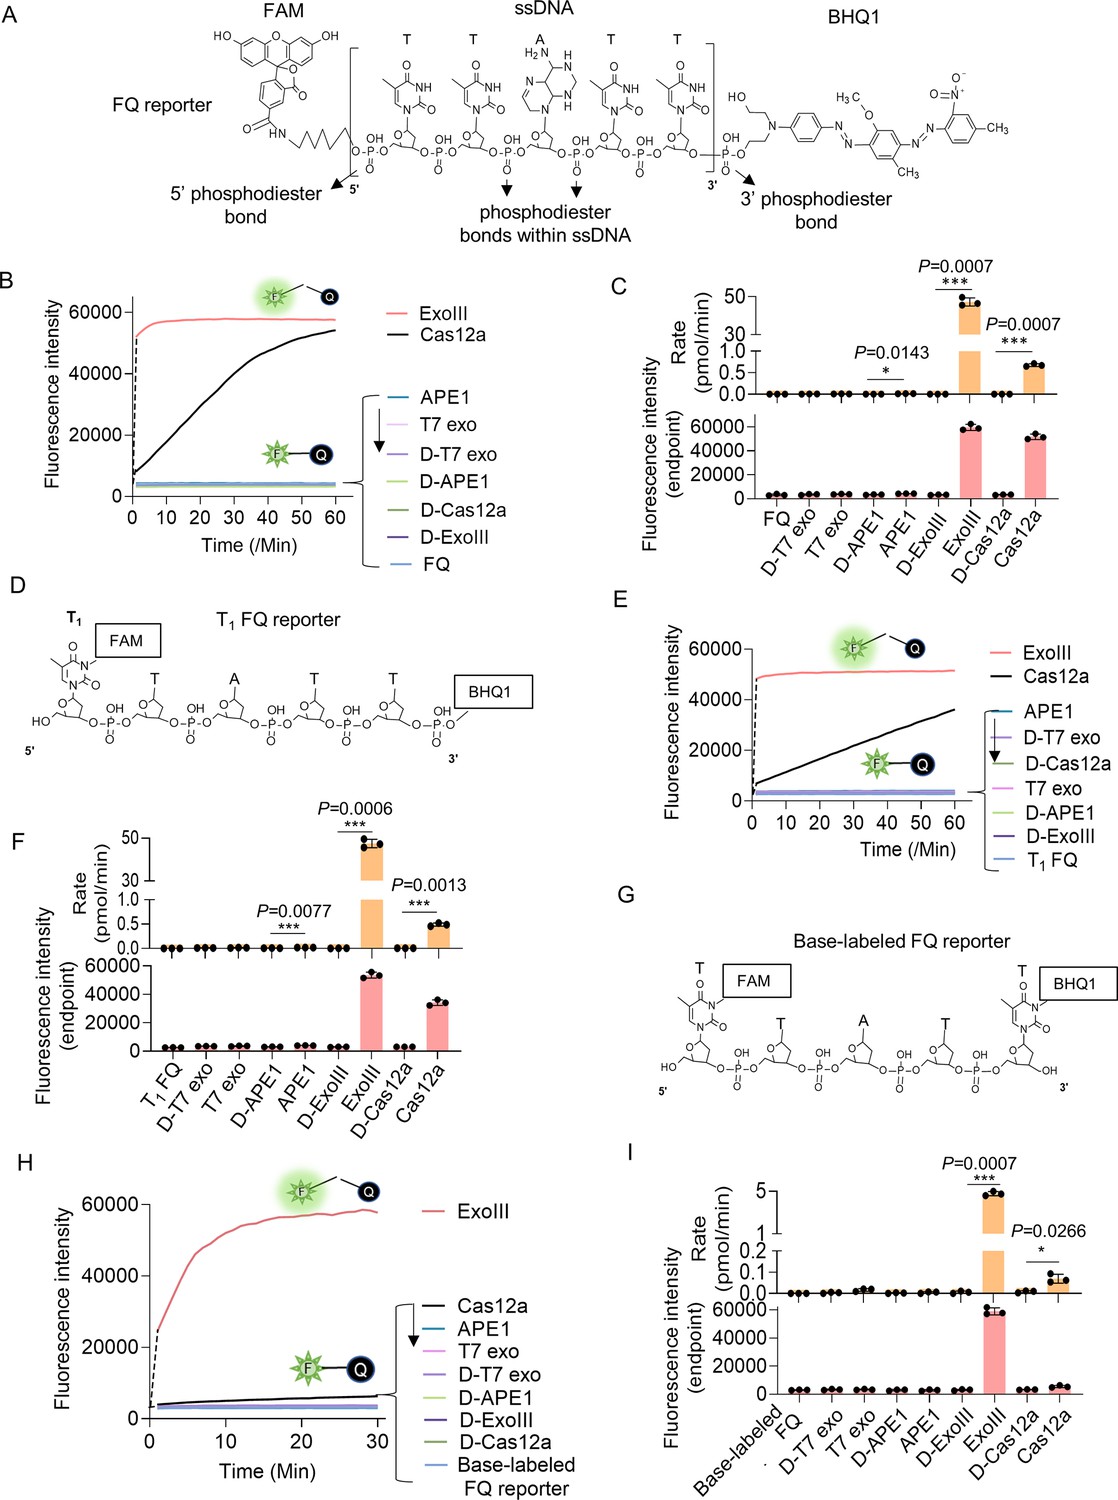
Eexonuclease Ⅲ (ExoIII) (5 U/μl) rapidly cleaved the ssDNA fluorescence-quenching (FQ) reporter (5 μM) of the CRISPR/Cas12a system with an average rate of 4.5~45 pmol (2.7~27 × 1012) phosphodiester bonds per minute.
(A) The typical structure of the ssDNA FQ is presented, in which three types of putative susceptible sites for ExoIII digestion are outlined, including 5′ phosphodiester bond, phosphodiester bonds within ssDNA, and 3′ phosphodiester bond. (B) The fluorescence intensity of FQ reporter (5 μM) treated with four active nucleases (T7 exonuclease (T7 exo) (5 U/μl), APE1 (5 U/μl), ExoIII (5 U/μl), and Cas12a/crRNA (0.1 μM)) or their heat-deactivated counterparts (D-T7 exo, D-APE1, D-ExoIII, D-Cas12a) was monitored every minute for 60 min. The dsDNA nuclease T7 exo was a negative control, also used to examine if the ssDNA substrates in the reaction formed dsDNA regions internally and between ssDNA strands, while LbCas12a with a trans-cleavage activity on ssDNA was a positive control. The D-nuclease served as the internal control of each active nuclease. The curve was plotted with an average value of three repeats. (C) The average rate of ExoIII digestion on FQ reporter was calculated by the formula: (the fluorescence produced/total fluorescence × 50 pmol)/reaction time. The total fluorescence means the fluorescence intensity generated when the input FQ reporter (50 pmol) was all cleaved. p (APE1 vs. D-APE1)=0.0143; p (ExoIII vs. D-ExoIII)=0.0007; p (Cas12a vs. D-Cas12a)=0.0007. *p<0.05, and ***p<0.001. The fluorescence intensity at the endpoint of the reaction was plotted based on three repeats, after the FQ reporter respectively treated with four active nucleases and their heat-deactivated counterpart (D-nuclease). (D) The 5′ T1 FAM-labeled FQ reporter structure is designed and presented, in which the 5′ phosphodiester bond is removed and 3′ phosphodiester bond retained. (E) Real-time monitoring on the fluorescence generated upon 5′ T1 FAM-labeled FQ reporter (5 μM) treated with four nucleases (T7 exonuclease (T7 exo) (5 U/μl), APE1 (5 U/μl), ExoIII (5 U/μl), and Cas12a-crRNA (0.1 μM)) or deactivated nucleases (D-T7 exo, D-APE1, D-ExoIII, D-Cas12a) was performed for 60 min. The average value of four repeats was calculated and curved. (F) The average rate of ExoIII digestion on T1-labeled FQ reporter was calculated by the formula: (the fluorescence produced/total fluorescence × 50 pmol)/reaction time. After the FQ reporter was treated with the four nucleases or their deactivated ones, the fluorescence intensities at the reaction endpoint were measured and plotted. p (APE1 vs. D-APE1)=0.0077; p (ExoIII vs. D-ExoIII)=0.0007; p (Cas12a vs. D-Cas12a)=0.0013. (G) The structure of the base-labeled FQ reporter for ExoIII is diagrammed, in which both 5′ and 3′ phosphodiester bonds are removed. (H) The digestion of the four nucleases and their deactivated counterparts on the base-labeled FQ reporter was monitored for 30 min. The average value of three repeats was calculated and curved. (I) The average rate of ExoIII digestion on the base-labeled FQ reporter was calculated by the formula: (the fluorescence produced/total fluorescence × 50 pmol)/reaction time. After the cleavage reactions on the FQ reporter, the fluorescence intensities at the reaction endpoint were measured and plotted. p (ExoIII vs. D-ExoIII)=0.000006; p (Cas12a vs. D-Cas12a)=0.0185. The statistical analysis was performed using a two-tailed t-test. *p<0.05, ***p<0.001. The dashed line in the figure does not indicate the real-time fluorescence generated in the reaction but only represents a trend in the period for monitor machine to initiate ~2 min.
Figure 1—video 1
Exonuclease Ⅲ (ExoIII) immediately triggers significant fluorescence at room temperature when mix with the fluorescence-quenching (FQ) reporter under LED blue light.
Figure 1—video 2
Exonuclease Ⅲ (ExoIII) rapidly causes significant fluorescence at room temperature when mixed with the T1 labeled fluorescence-quenching (FQ) reporter under LED blue light.
Figure 2 with 1 supplement
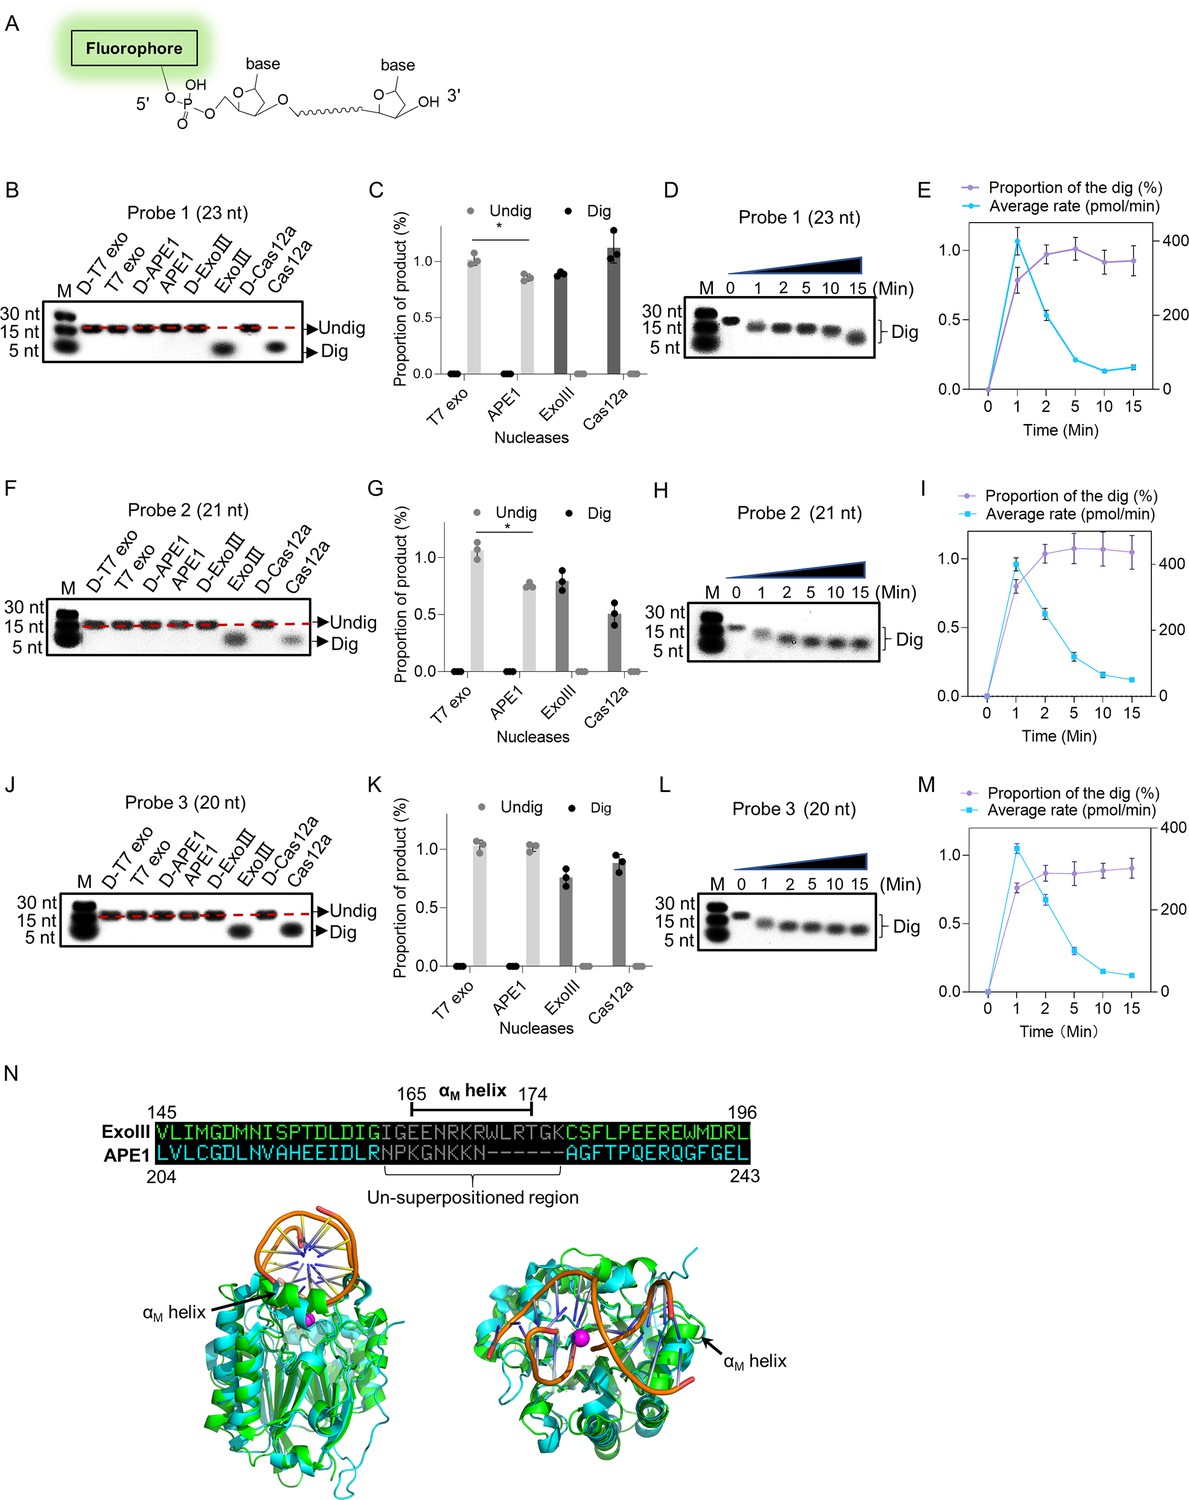
Exonuclease Ⅲ (ExoIII) (5 U/μl) digested the 5′ end fluorophore-labeled ssDNA substrates (5 µM) in a 3′ to 5′-end direction with an estimated rate of ~1013 nucleotides per minute.
(A) The 5′ fluorophore-labeled ssDNA structure for the following ExoIII digestion is shown. The squiggle line represents the ~20 nucleotides of the ssDNA oligo. (B, F, and J) The ssDNA oligo of Probe 1, Probe 2, or Probe 3 (5 µM) was treated with the four nucleases (T7 exo (5 U/μl), APE1 (5 U/μl), ExoIII (5 U/μl), and Cas12a-crRNA (0.1 μM)) and their deactivate counterpart (D-T7 exo, D-APE1, D-ExoIII, D-Cas12a) for 30 min. The reaction products were analyzed by gel electrophoresis. Undig, undigested; dig, digested; M, maker. (C, G, and K) The gray intensity of the digested or undigested bands produced by the three probes was measured by ImageJ. The undigested or digested proportions were calculated with the formula: Proportion = (Intensity of the undigested or digested band produced in the active nuclease treatment)/(Intensity of the undigested band produced in the corresponding deactivated nuclease treatment). p (APE1 vs. T7 exo on Probe 1)=0.04; p (APE1 vs. T7 exo on Probe 2)=0.02; *p<0.05. The statistical analysis was performed using a two-tailed t-test. (D, H, and L) The time course of ExoIII digestion on the three probes was analyzed by gel electrophoresis, and the gray intensity of the generated bands was measured by ImageJ. (E, I, and M) The digesting rate of ExoIII on the ssDNA was calculated by: the digested proportion ×50 pmol × digested nucleotides/reaction time. The digested proportion was calculated by the formula: (gray intensity of the digested band produced)/(gray intensity of the band at 0 s). Detailed information on these oligos is described in Supplementary file 2. All experiments were repeated three times, and the representative ones were shown. (N) The structure alignment between ExoIII (PDB ID:1AKO) and APE1-dsDNA (PDB ID: 1DE8 and NDB ID: 5WN5) was performed by Pymol, and the un-superpositioned region (Residues 165–174, αM helix) in the enzyme-substrate binding surface between ExoIII and APE1 was displayed. The aligned structures were shown from different angles by Pymol.
-
Figure 2—source data 1
Exonuclease Ⅲ (ExoⅢ) rapidly digested the 5′ end fluorophore-labeled ssDNA substrates.
- https://cdn.elifesciences.org/articles/95648/elife-95648-fig2-data1-v1.zip
Figure 2—figure supplement 1
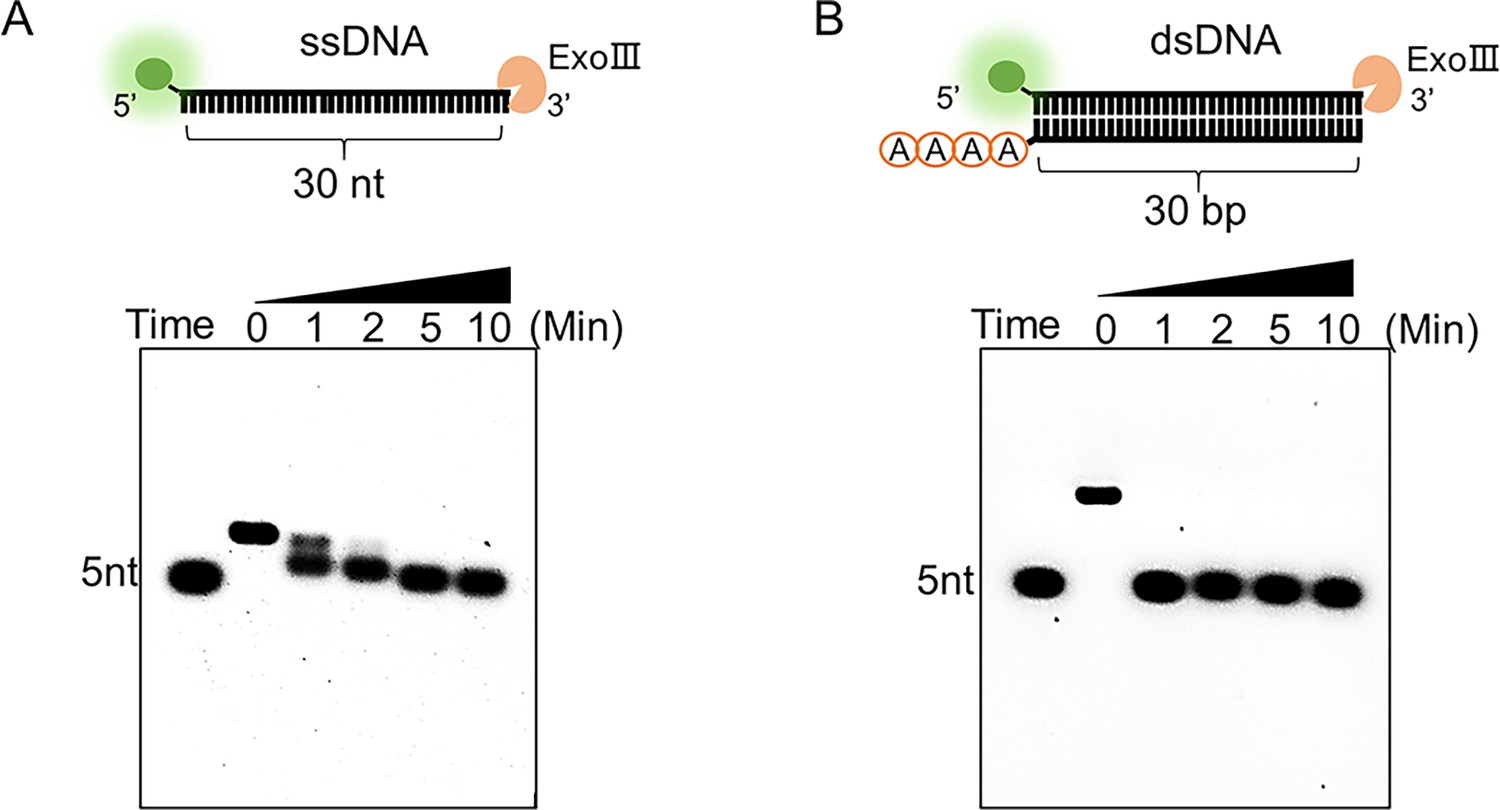
The digestion process of exonuclease Ⅲ (ExoIII) on ssDNA and double-stranded DNA (dsDNA) substrates was compared.
The commercial ExoIII (10 U/µl) was incubated with the FAM-labeled ssDNA (A) or dsDNA (10 µM) (B). The reaction products at different timepoints were analyzed by the 6% agarose gel.
-
Figure 2—figure supplement 1—source data 1
The digestion process of exonuclease Ⅲ (ExoⅢ) on ssDNA and double-stranded DNA (dsDNA) substrates.
- https://cdn.elifesciences.org/articles/95648/elife-95648-fig2-figsupp1-data1-v1.zip
Figure 3 with 1 supplement
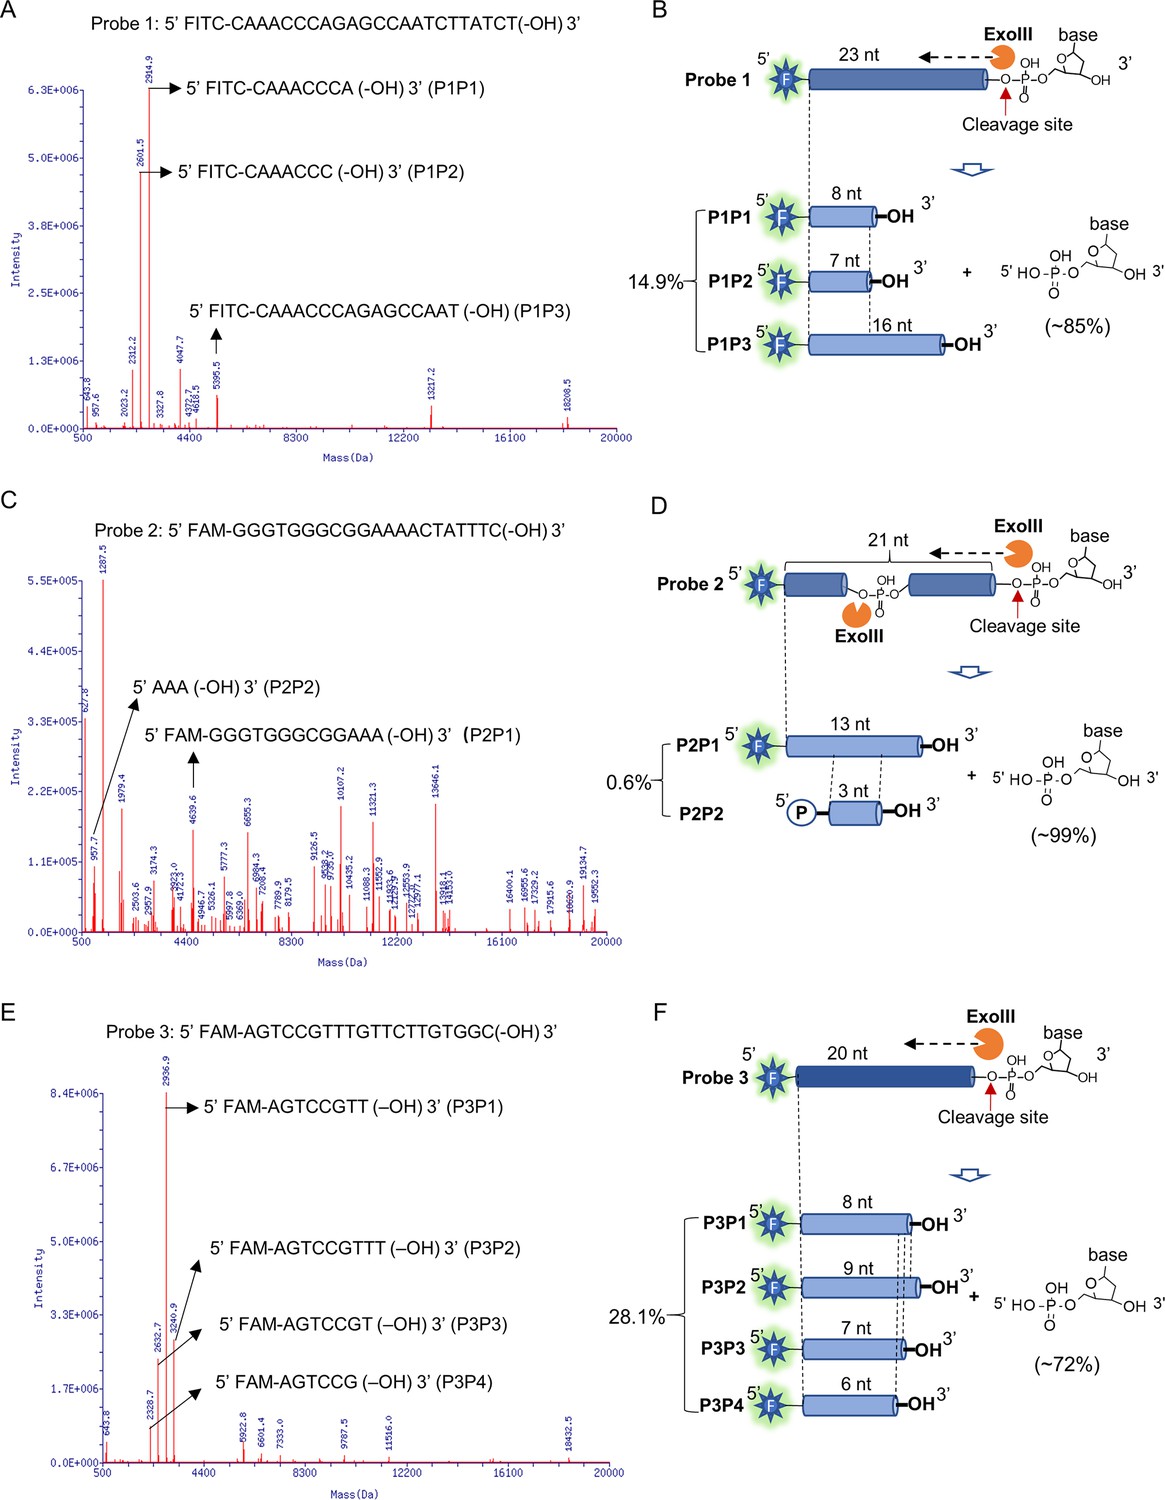
Mass spectrometry analysis revealed the exonuclease and endonuclease activities of exonuclease Ⅲ (ExoIII) on ssDNA.
After the ssDNA probe (5 µM) was incubated with ExoIII (5 U/µl) at 37 °C for 30 min, the reaction product was analyzed by mass spectrometry. The detection range of mass spectrometry is 500~20,000 Da. (A) The mass peaks of ssDNA Probe 1 digested by ExoIII are present. The three major peaks of reaction products of Probe 1 (P1P1, P1P2, and P1P3) are indicated by arrows. The information related to major peaks is provided in Table 1. (B) The digestion process, including the cleavage site, product, and relevant proportion of Probe 1 is illuminated based on the mass spectrometry analysis. The three major mass peaks match three fragments of Probe 1 (8 nt, 7 nt, and 16 nt), respectively. (C) The mass peaks of ssDNA Probe 2 digested by ExoIII are displayed. The two major peaks (P2P1 and P2P2) are labeled by arrows. (D) The digestion process of Probe 2 is illuminated based on the mass spectra analysis. The two major mass peaks of reaction products match two fragments of Probe 2 (13 nt and 3 nt). (E) The mass peaks of Probe 3 digested by ExoIII are displayed. The major peaks (P3P1, P3P2, P3P3, and P3P4) are labeled by arrows. (F) The reaction process of Probe 3 is illuminated based on the mass spectra analysis and gel result (L). The four major mass peaks of reaction products match the fragments of Probe 3 (8 nt, 9 nt, 7 nt, and 6 nt). As the control, the mass peaks of undigested ssDNA probes are displayed in Figure 3—figure supplement 1.
Figure 3—figure supplement 1
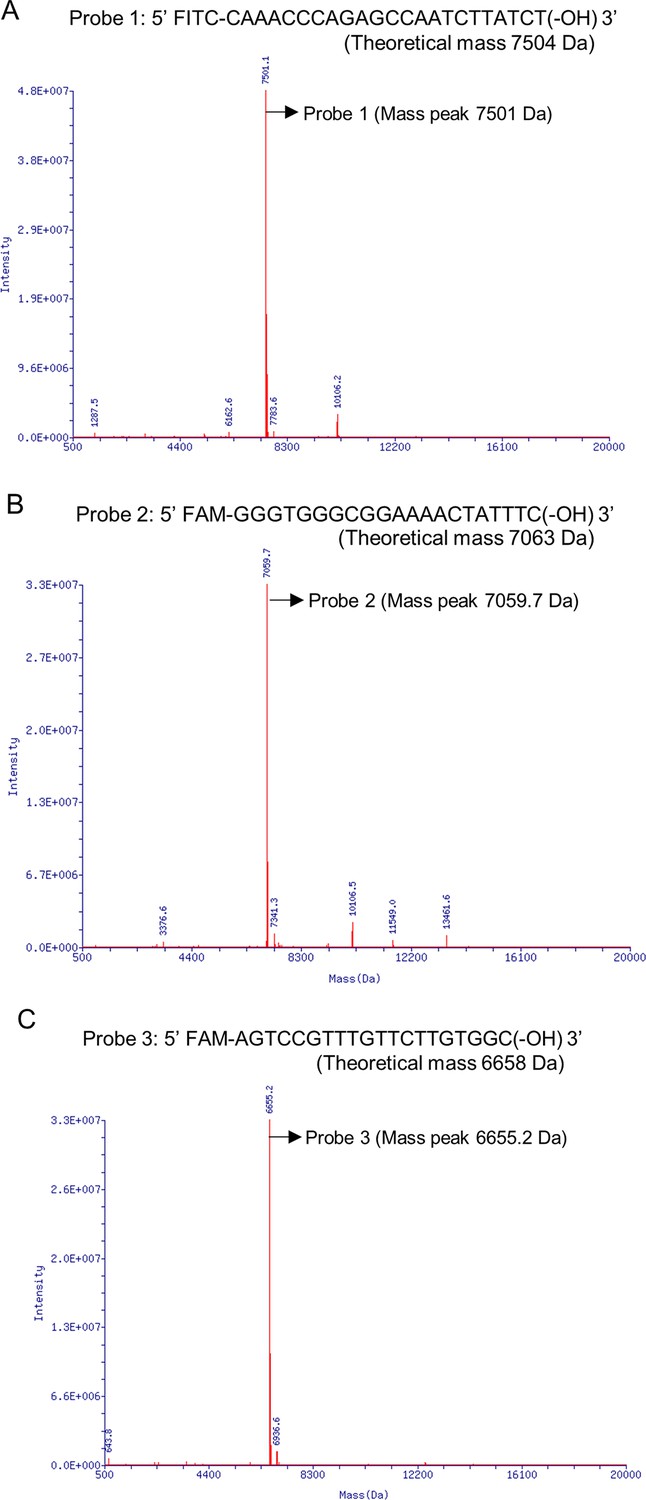
As controls of the exonuclease Ⅲ (ExoIII)-treated ssDNAs, the mass peaks of ssDNA probes undigested by ExoIII were present at (A) for Probe 1, (B) for Probe 2, and (C) for Probe 3.
The arrows indicate the major mass peaks produced in Probe 1 (Mass peak = 7501.1 Da, Intensity = 4.79E+07), Probe 2 (Mass peak = 7059.7 Da, Intensity = 3.34E+07), and Probe 3 (Mass peak = 6655.2 Da, Intensity = 3.30E+07). These mass peaks match the theoretical mass of ssDNA Probe 1 (7504 Da), ssDNA Probe 2 (7063.2 Da), and ssDNA Probe 3 (6658 Da). Detailed information on major mass peaks is described in Table 1.
Figure 4
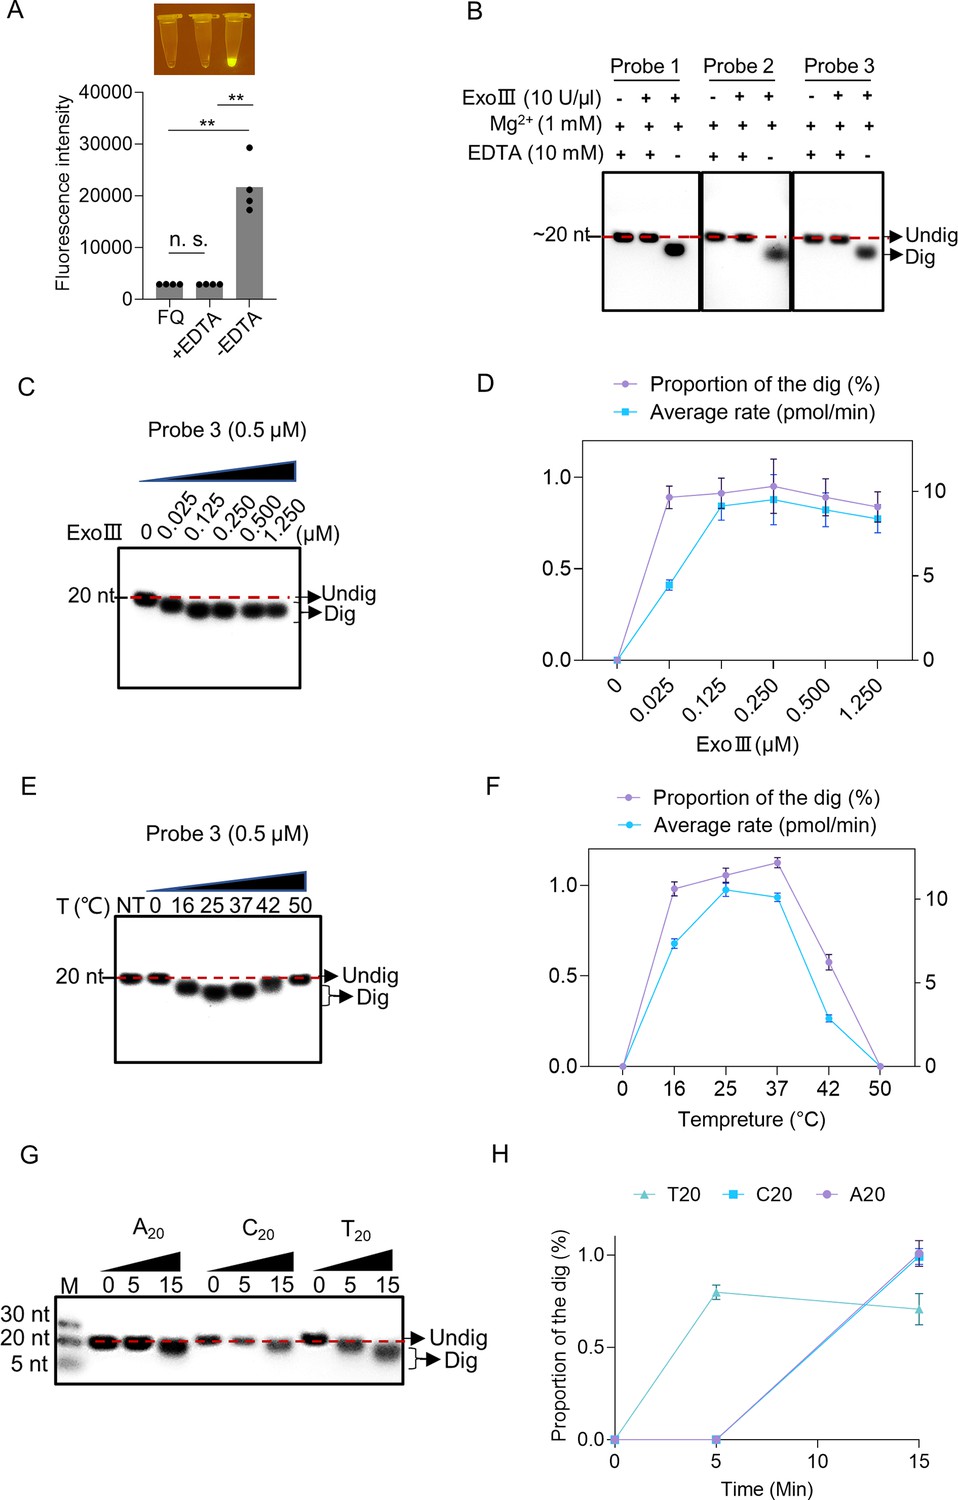
Enzymatic reaction conditions for the ssDNase activity of exonuclease Ⅲ (ExoIII) were investigated.
(A) EDTA (10 mM) was added with the mixture of fluorescence-quenching (FQ) reporter (2.5 µM) and MgCl2 (1 mM) before incubating with commercial ExoIII (5 U/µl) for 10 min. The fluorescence intensity generated in 10 min was measured and plotted on four repeats. The corresponding fluorescent tubes at the reaction endpoint were captured under LED UV light. The reaction without adding EDTA was regarded as a control. **p<0.01. The n.s. indicates no significance. Statistical significance was determined by a two-tailed t-test. (B) Three ssDNA probes (5 µM) with or without adding EDTA were digested by commercial ExoIII (5 U/µl) for 10 min, and the reaction products were analyzed by gel. (C) Different amounts of purified ExoIII (0, 0.025, 0.125, 0.250, 0.500, and 1.250 µM) were incubated with ssDNA Probe 1 (0.5 µM) for 10 min, and the reaction products were analyzed by gel electrophoresis. (D) The digesting rate of ExoIII on the ssDNA was calculated by: the digested proportion × 50 pmol × digested nucleotides/reaction time. The digested proportion of Probe 3 was calculated by: (Gray intensity of the digested band)/(Gray intensity of the undigested band with 0 µM ExoIII). (E) The ssDNA substrate (0.5 µM) was incubated with ExoIII (0.5 µM) at different temperatures (0, 16, 25, 37, 42, and 50 °C) for 10 min, and the products were analyzed by gel electrophoresis. NT, no treatment. (F) The digested proportion of Probe 3 was calculated by: (Gray intensity of the digested band)/Gray intensity of the undigested band (NT). (G) The 5′ FAM-labelled ssDNA probes constructed by 20 consecutive identical bases (A20, C20, T20) were digested by ExoIII over 15 min, and the reaction products were separated by gel electrophoresis. The fluorescence intensity difference between the three oligos is caused by the bases covalently linked with a fluorophore. G20 was not tested here as it easily forms a G-quadruplex structure. (H) The gray intensity was determined by ImageJ. A digested proportion curve over 15 min was plotted from three repeats. The digested proportion was calculated by the formula: (Intensity of the digested band produced)/(Intensity of the band at 0 s). Data represents the average value of three repeats and is expressed as mean ± SD.
-
Figure 4—source data 1
Enzymatic reaction conditions for the ssDNase activity of exonuclease Ⅲ (ExoⅢ).
- https://cdn.elifesciences.org/articles/95648/elife-95648-fig4-data1-v1.zip
Figure 5
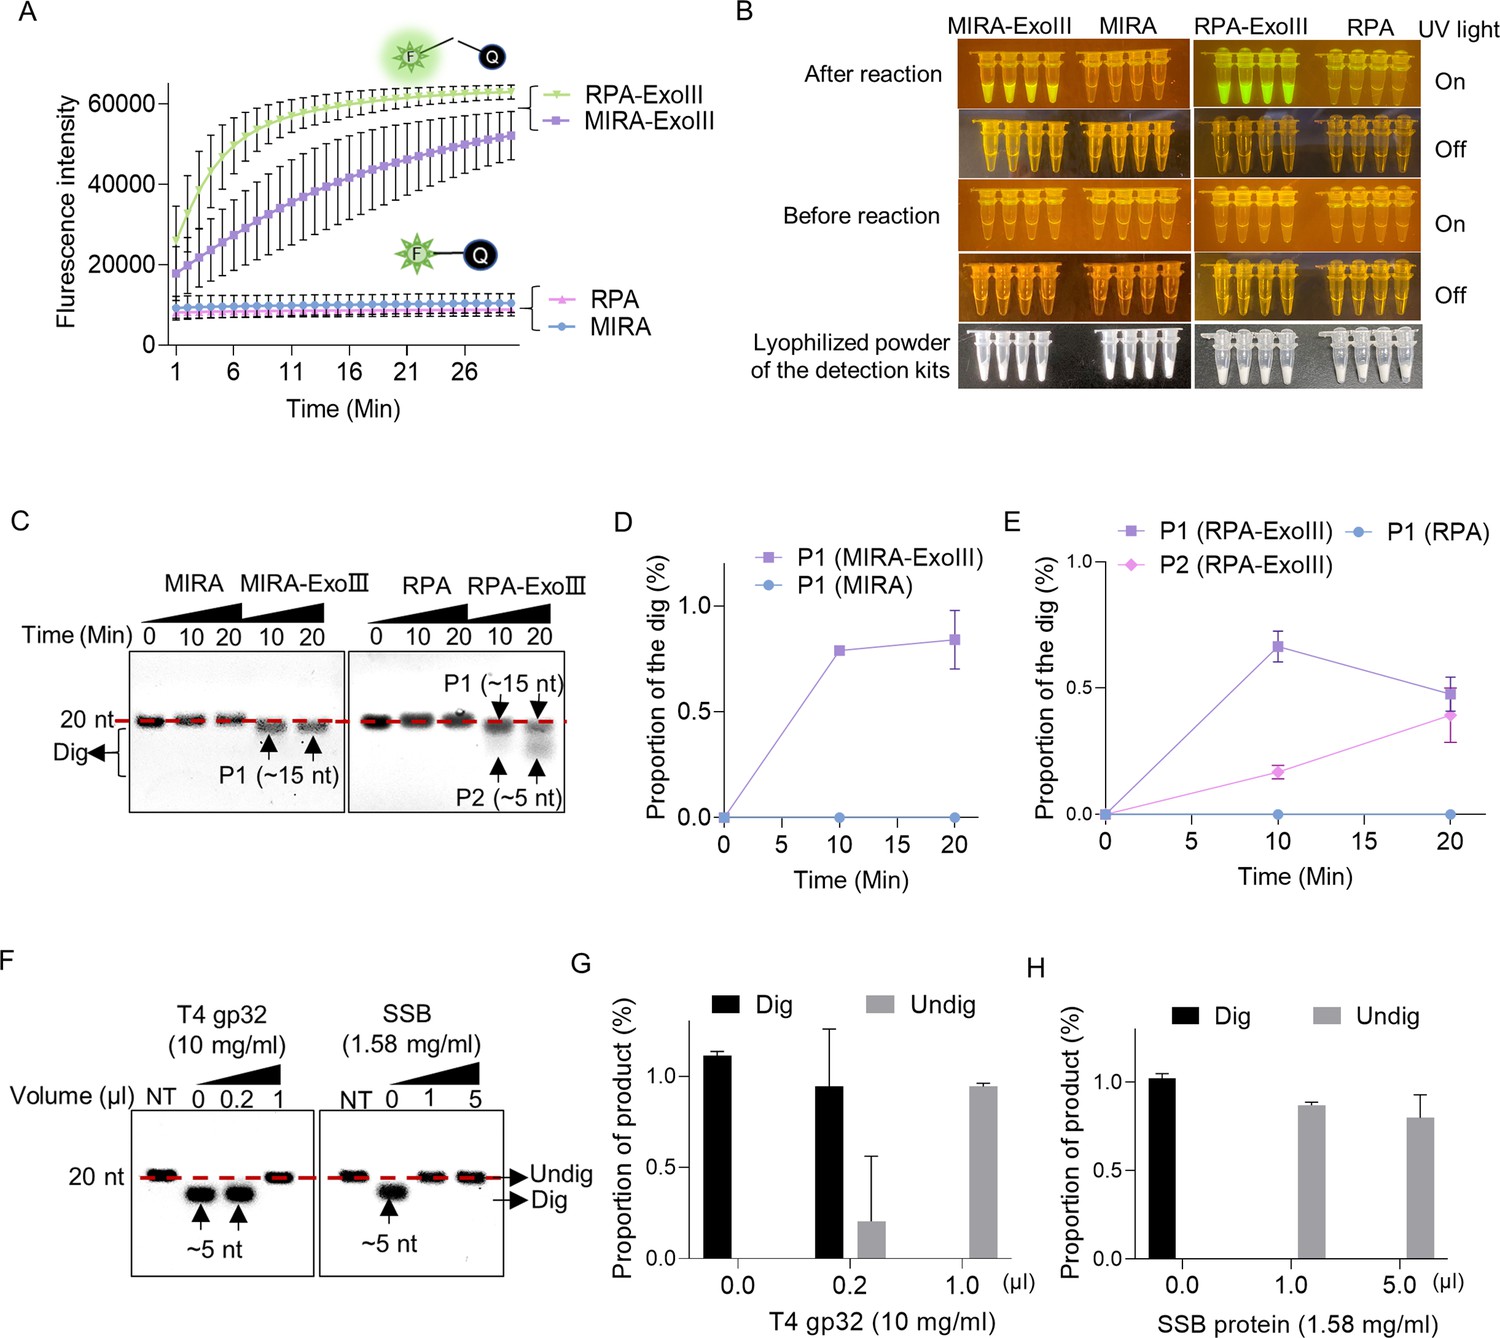
Exonuclease Ⅲ (ExoIII) in the isothermal amplification kits digested the ssDNA fluorescence-quenching (FQ) reporter and 5′ FAM-labeled ssDNA probes, while the single-stranded DNA binding protein protected the ssDNA probe from ExoIII digestion.
(A) The fluorescence of the FQ reporter generated in four detection kits (MIRA, MIRA-ExoIII (containing ExoIII), RPA, and RPA-ExoIII (containing ExoIII)) was monitored for 30 min. MIRA and recombinase polymerase amplification (RPA) were the control of their corresponding counterparts, respectively. The average value of three repeats was calculated and plotted. (B) Before and after these four commercial kits were incubated with the FQ reporter for 30 min, the reaction tubes with fluorescence generated were visualized under LED blue light by the naked eye. MIRA-ExoIII indicates the ExoIII-containing MIRA kit; MIRA indicates the MIRA kit without ExoIII. (C) The 5′ FAM-labeled ssDNA probe (Probe 1) was incubated with the four detection kits for 20 min, and the reaction products were analyzed by gel electrophoresis. Undig, undigested; dig, digested. (D, E) The analysis on the gray intensities of the band was performed by ImageJ. The digested proportion was calculated by: (Intensity of the digested band)/(Intensity of the undigested band at 0 min). (F) Different amounts of single-stranded DNA binding protein (T4 gp32 or SSB (E. coli)) were incubated with the ssDNA oligo (Probe 1) for 10 min before being treated with ExoIII for 10 min. The reaction products of ExoIII digestion were separated by gel electrophoresis. The ssDNA oligo treated with deactivated ExoIII served as control. (G, H) The gray intensity of bands was measured by ImageJ, and the digested or undigested proportions were calculated by: (Intensity of the digested or undigested band)/(Intensity of the band produced in the treatment of deactivated ExoIII).
-
Figure 5—source data 1
Exonuclease Ⅲ (ExoⅢ) in the isothermal amplification kits digested the ssDNA fluorescence-quenching (FQ) reporter and 5′ FAM-labeled ssDNA probes.
- https://cdn.elifesciences.org/articles/95648/elife-95648-fig5-data1-v1.zip
Figure 6 with 3 supplements
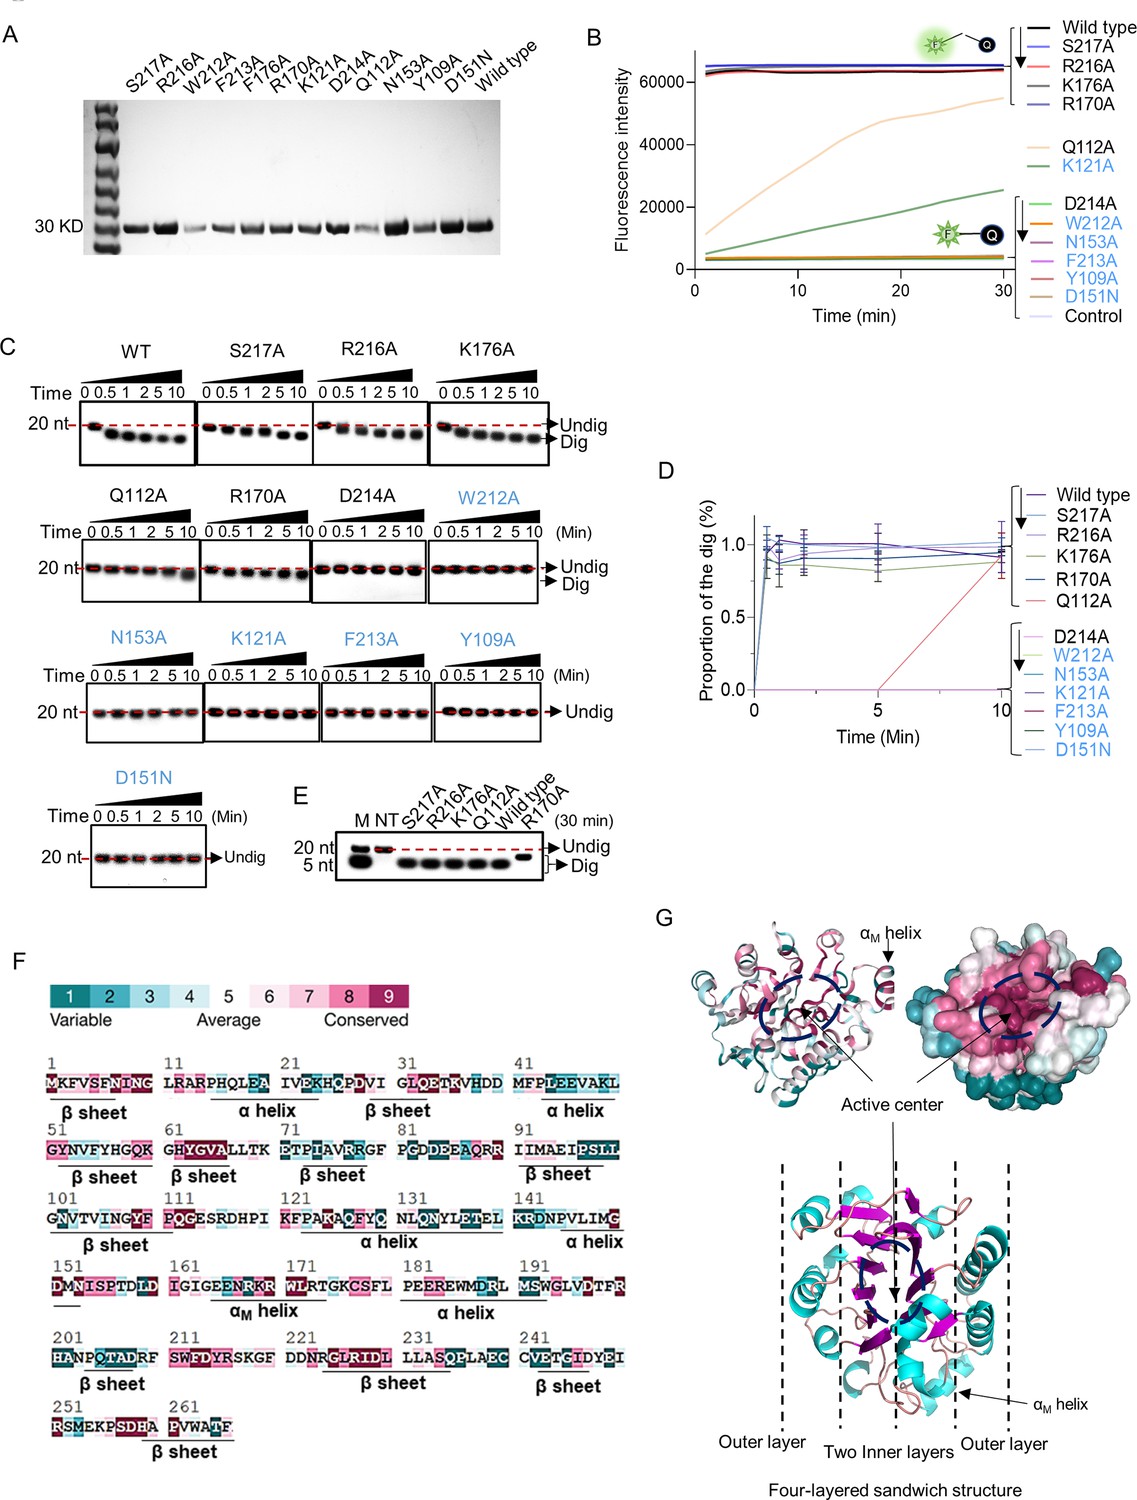
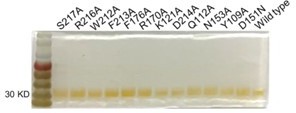
Point mutation of exonuclease Ⅲ (ExoIII) identified the critical amino acid residues that determine the ssDNase activity.
(A) All purified mutants and wild-type proteins used in the study were loaded into the 8% PAGE electrophoresis and stained with Coomassie Brilliant Blue. (B) The fluorescence-quenching (FQ) reporter (5 µM) was incubated with ExoIII mutants (2.5 µM) (S217A, R216A, D214A, F213A, W212A, K176A, D151N, R170A, N153A, K121A, Q112A, Y109A) and wild-type (WT) and the generated fluorescence was monitored for 30 min. FQ reporter treated with deactivated wild-type ExoIII was regarded as a control. The mutations in blue indicated they are previously-reported key residues for double-stranded DNA (dsDNA)-targeted activities of ExoIII. (C) The ssDNA oligo of Probe 3 (20 nt) was incubated with the ExoIII mutants, and the reaction products were analyzed by gel electrophoresis. (D) The gray intensity of the bands was determined by ImageJ. The average intensity value of three repeats was used to calculate the proportion of the digested band with: (Intensity of the digested band)/(Intensity of the undigested band at 0 min). (E) The digested products of S217A, R216A, K176A, R170A, Q112A, and wild type, after 30 min of incubation with ssDNA substrate, were compared with each other by gel electrophoresis. (F) The residue conservation of ExoIII (PDB ID:1AKO) was investigated using the ConSurf database (https://consurfdb.tau.ac.il/index.php). The conservation degree of ExoIII residues is calculated among 300 homologs, which the color scale indicates. (G) The carton and surface style of the ExoIII structure (PDB ID:1AKO) with conservation-indicated color is displayed (upper part). The four-layered sandwich structure of ExoIII is displayed by Pymol (lower part): the pink indicates β-sheet; the blue represents α-helices; the red indicates the random coils or turns.
-
Figure 6—source data 1
The critical amino acid residues of exonuclease Ⅲ (ExoⅢ) for its ssDNase activity.
- https://cdn.elifesciences.org/articles/95648/elife-95648-fig6-data1-v1.zip
Figure 6—figure supplement 1
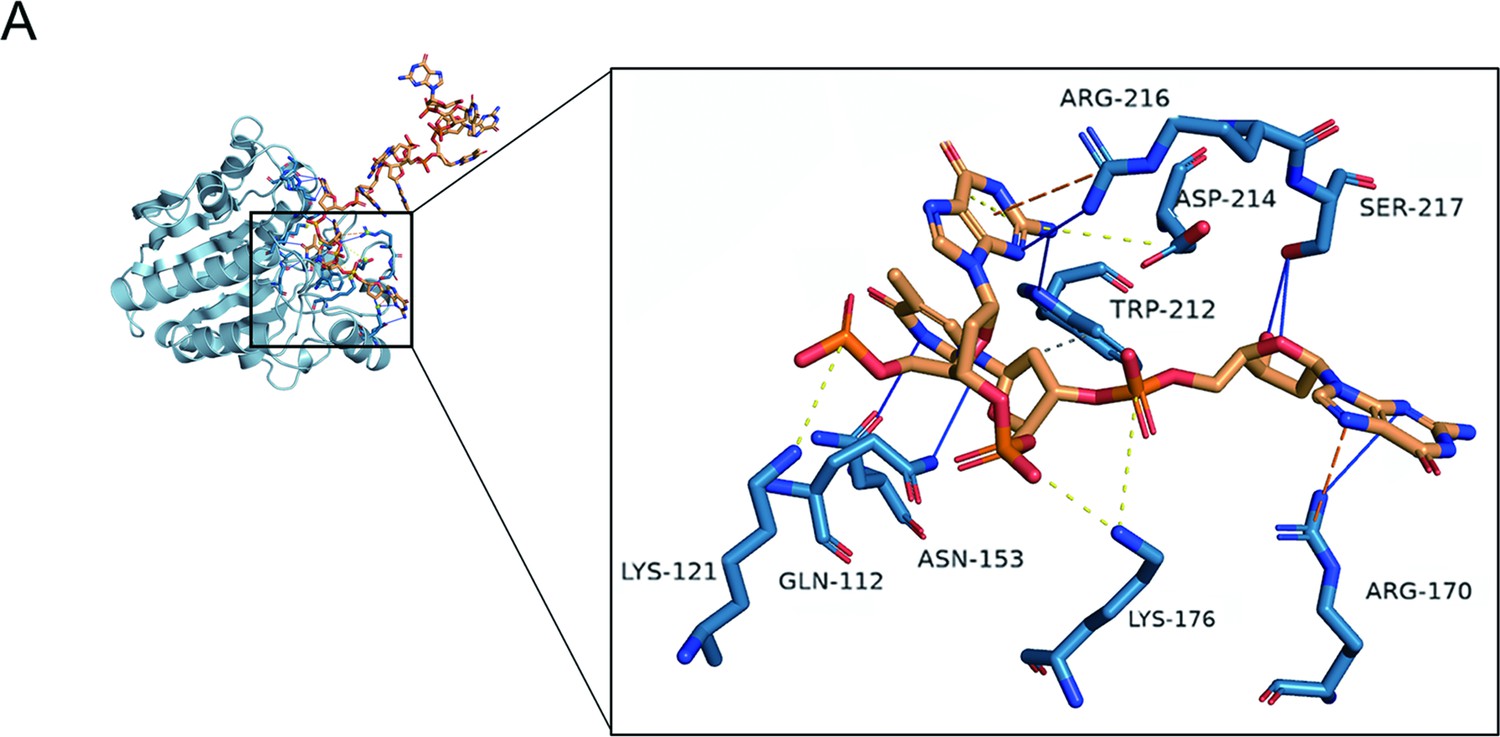
The molecular docking of exonuclease Ⅲ (ExoIII) (PDB code: 1AKO) and ssDNA (NDB ID: 1S40) was performed at the HADDOCK docking server (https://wenmr.science.uu.nl/haddock2.4/), and the result was displayed in detail.
Residues (SER217, ARG216, ASP214, TRP212, LYS176, ARG170, ASN153, LYS121, and GLN112) were predicted to interact with ssDNA during the enzymatic catalyzation.
Figure 6—figure supplement 2

All purified mutants and wild-type proteins used in the study were examined by the silver-stained SDS-PAGE gel.
-
Figure 6—figure supplement 2—source data 1
The silver-stained SDS-PAGE gel.
- https://cdn.elifesciences.org/articles/95648/elife-95648-fig6-figsupp2-data1-v1.zip
Figure 6—figure supplement 3
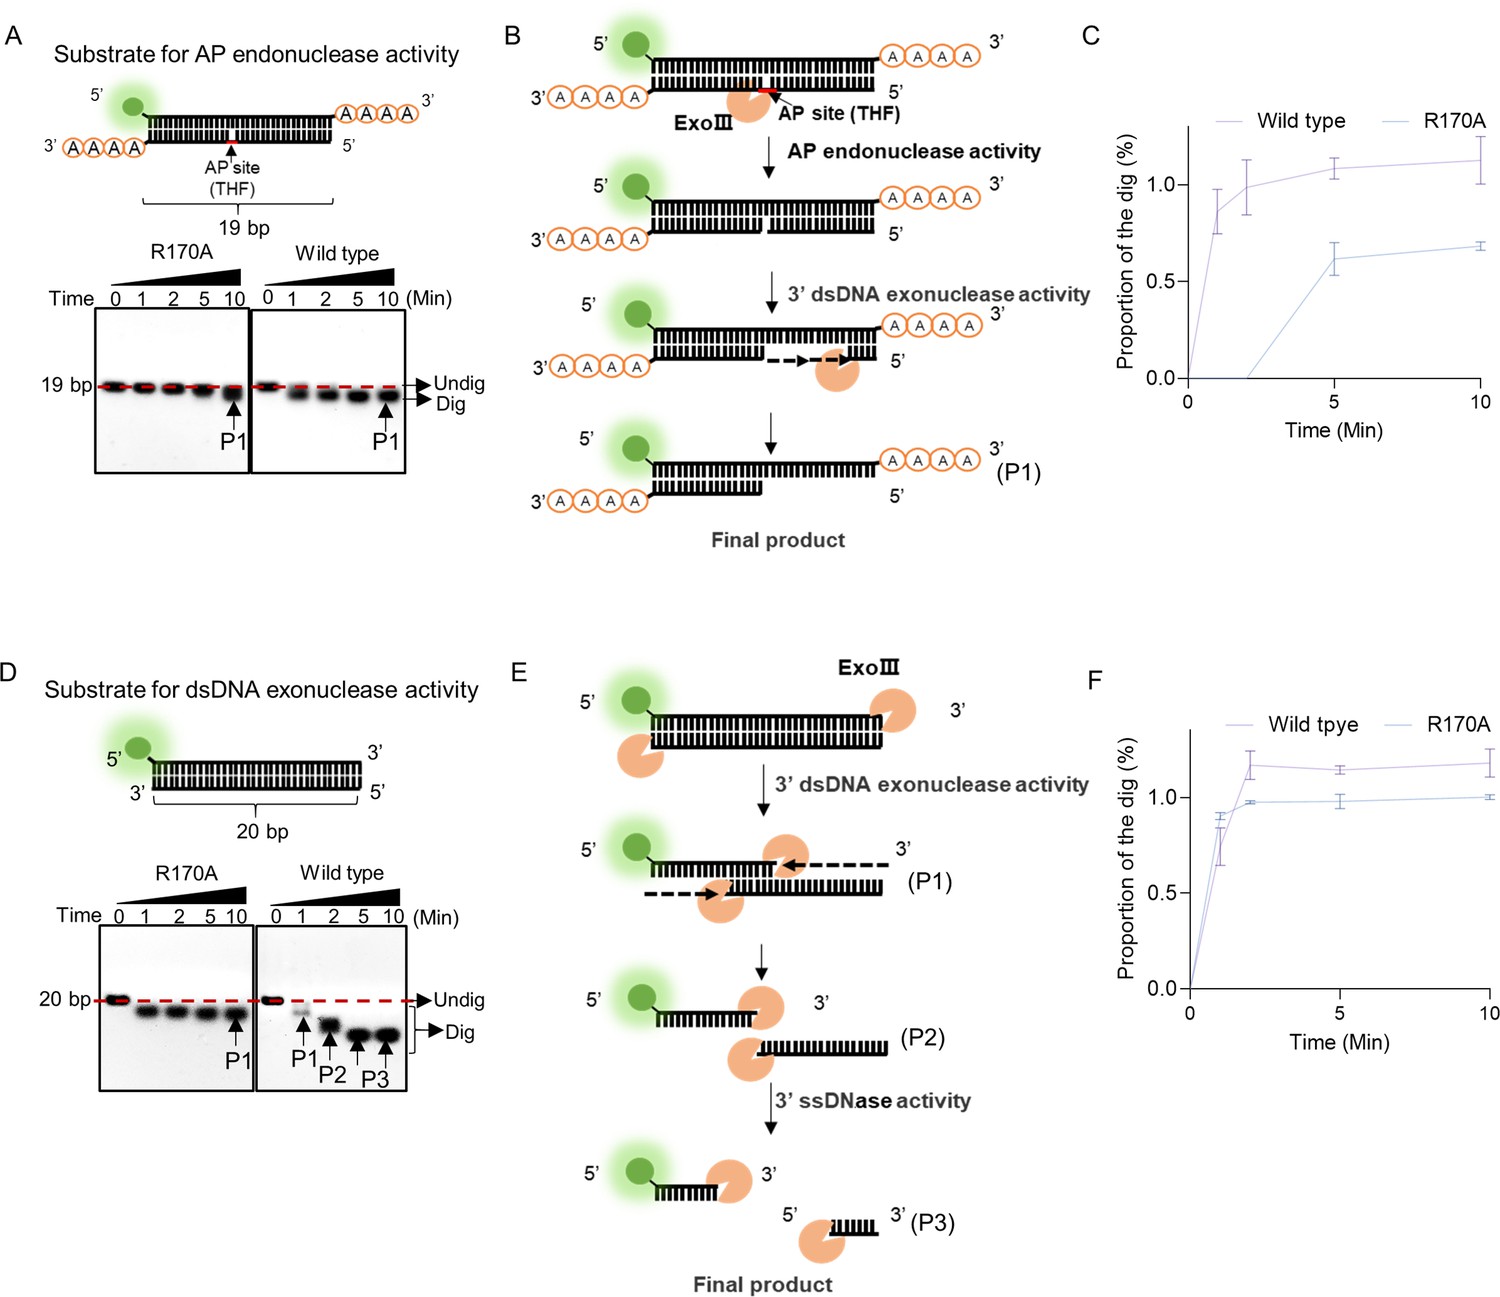
R170A mutant exhibited a weakened apurinic/apyrimidinic (AP)-endonuclease activity.
(A) The double-stranded DNA (dsDNA) structure with blunt ends was displayed as a substrate for 3′ exonuclease activity of exonuclease Ⅲ (ExoIII). The substrate was digested by R170A and wild-type ExoIII for 10 min, respectively. Time course analysis of the digestions was presented by gel electrophoresis. (B) The digestion process of ExoIII on the substrate is diagramed based on the activities identified. (C) The Gray intensity of the bands was measured by ImageJ. Then, the average intensity value of three repeats was to calculate the proportion of the digested band by (Intensity of the digested band)/(Intensity of the undigested band at 0 min). (D) The dsDNA structure with 3′end A4 was used as the substrate for AP-endonuclease activity. The substrate was incubated with R170A and wild type ExoIII for 10 min, respectively. Time course analysis of the digestions was performed. (E) The digestion process of ExoIII on the substrate is portrayed based on the activities identified. (F) The gray intensity of the bands was measured by ImageJ. The average intensity value of three repeats was to calculate the proportion of the digested band by: (Intensity of the digested band)/(Intensity of the undigested band at 0 min).
-
Figure 6—figure supplement 3—source data 1
R170A mutant exhibited a weakened apurinic/apyrimidinic (AP)-endonuclease activity.
- https://cdn.elifesciences.org/articles/95648/elife-95648-fig6-figsupp3-data1-v1.zip
Figure 7 with 1 supplement
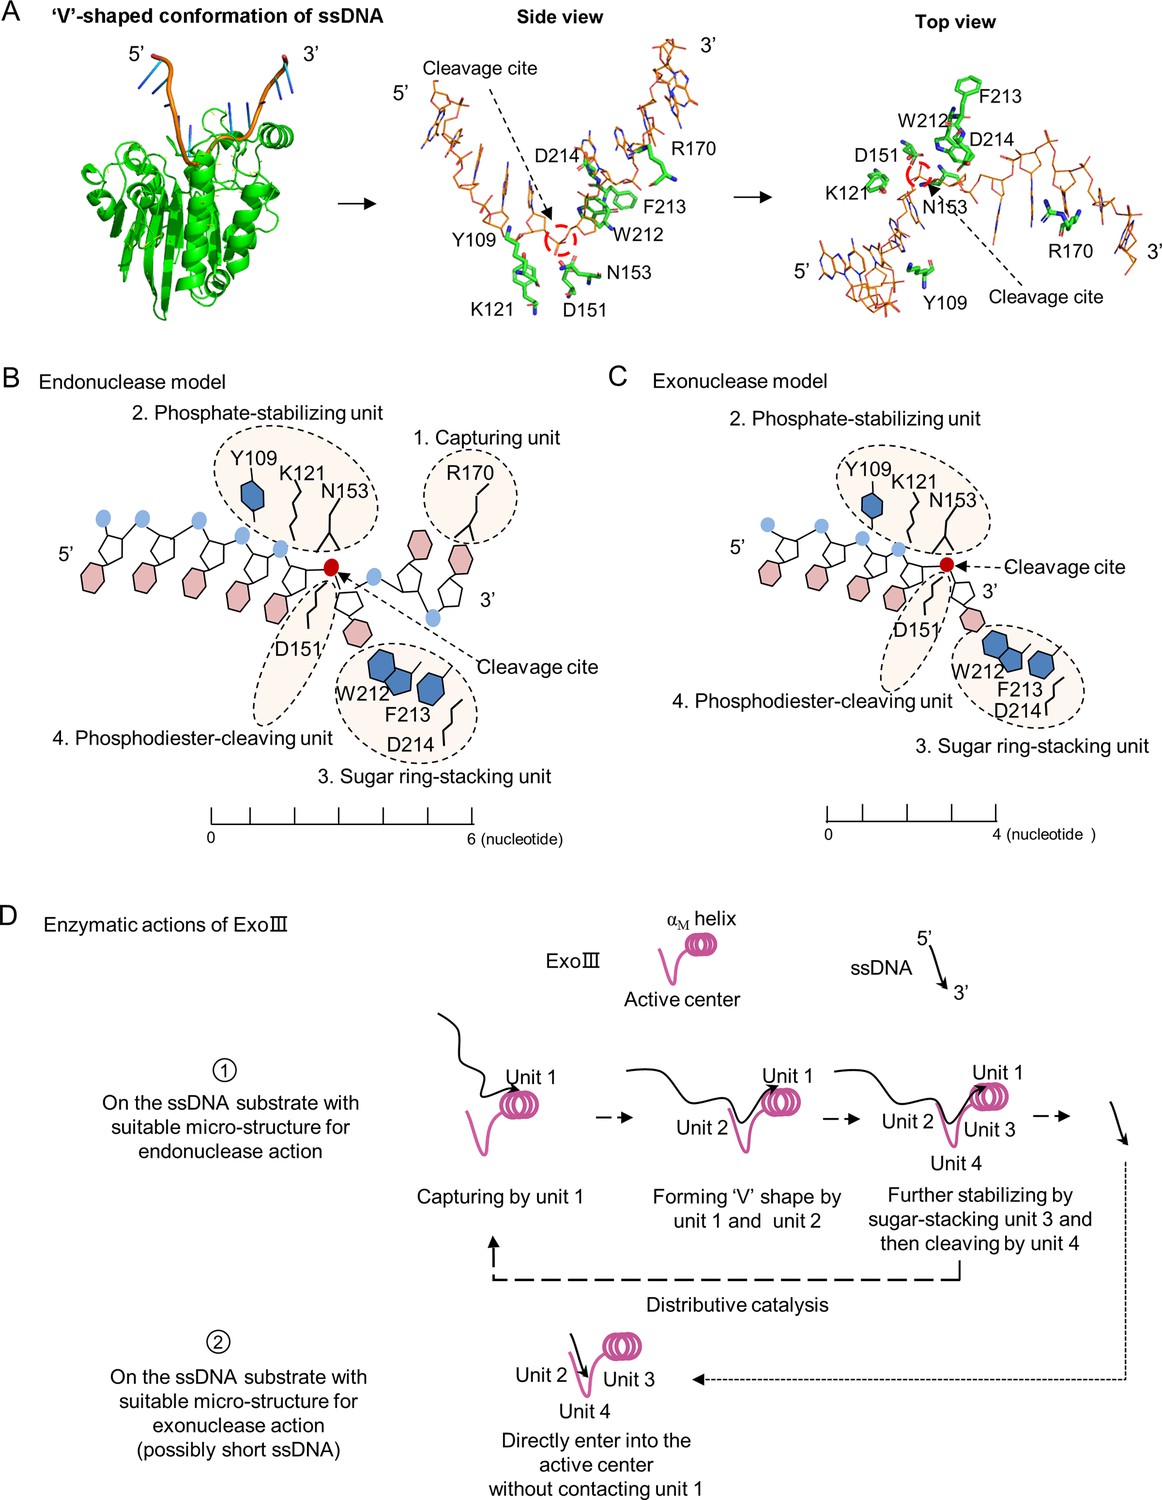
A theoretical model for the enzymatic actions of exonuclease Ⅲ (ExoIII) on ssDNA is proposed.
(A) The ExoIII-ssDNA structure was obtained by structure alignment between ExoIII (PDB:1AKO) and APE1-dsDNA (PDB: 5WN5) by Pymol. The key residues and the cleavage site of ExoIII are labeled in situ and presented by side and top view. (B) According to the ExoIII-ssDNA structure and the previously reported functions of the key residues (4), four functional units of ExoIII on ssDNA are primarily defined: capturing unit (R170, at 3′ side of the cleavage site and three nucleotides away from it), phosphate-stabilizing unit (Y109, K121, and N153, at 5′ side of cleavage site and three nucleotides away from it) and sugar ring-stacking unit (W212, F213, and D214) and phosphodiester-cleaving unit (D151). In the model of endonuclease, Unit 1(R170), located at the surface of ExoIII, is most likely the first contact with the substrate, and binding at the 3′ side of the cleavage site naturally drives the endonucleolytic cleavage on ssDNA. Interactions of unit 1 and unit 2 with substrates may help convert the ~6 nucleotides at 3′ end of ssDNA to form a 'V' shape intermediate for docking into the active center and being processed by unit 3 and unit 4. (C) In the exonuclease model, some types of ssDNA (possibly short ssDNA or others with suitable micro-structure) directly enter into the active center without contacting unit 1, and sequentially processed by unit 2, 3 and 4. (D) The ssDNA substrate tends to be captured by the unit 1, then stabilized by the unit 2 and 3, and finally cleaved by unit 4 of ExoIII, producing short fragments of ssDNA (endonuclease activity), which may reflect the distributive catalysis of ExoIII on ssDNA. The short ssDNA (~3 nt) or others with suitable microstructure would directly enter into the active center and be processed by units 2, 3, and 4 into mononucleotides (exonuclease activity). Most ssDNA substrates might be digested by both endonuclease and exonuclease activity of ExoIII.
Figure 7—figure supplement 1
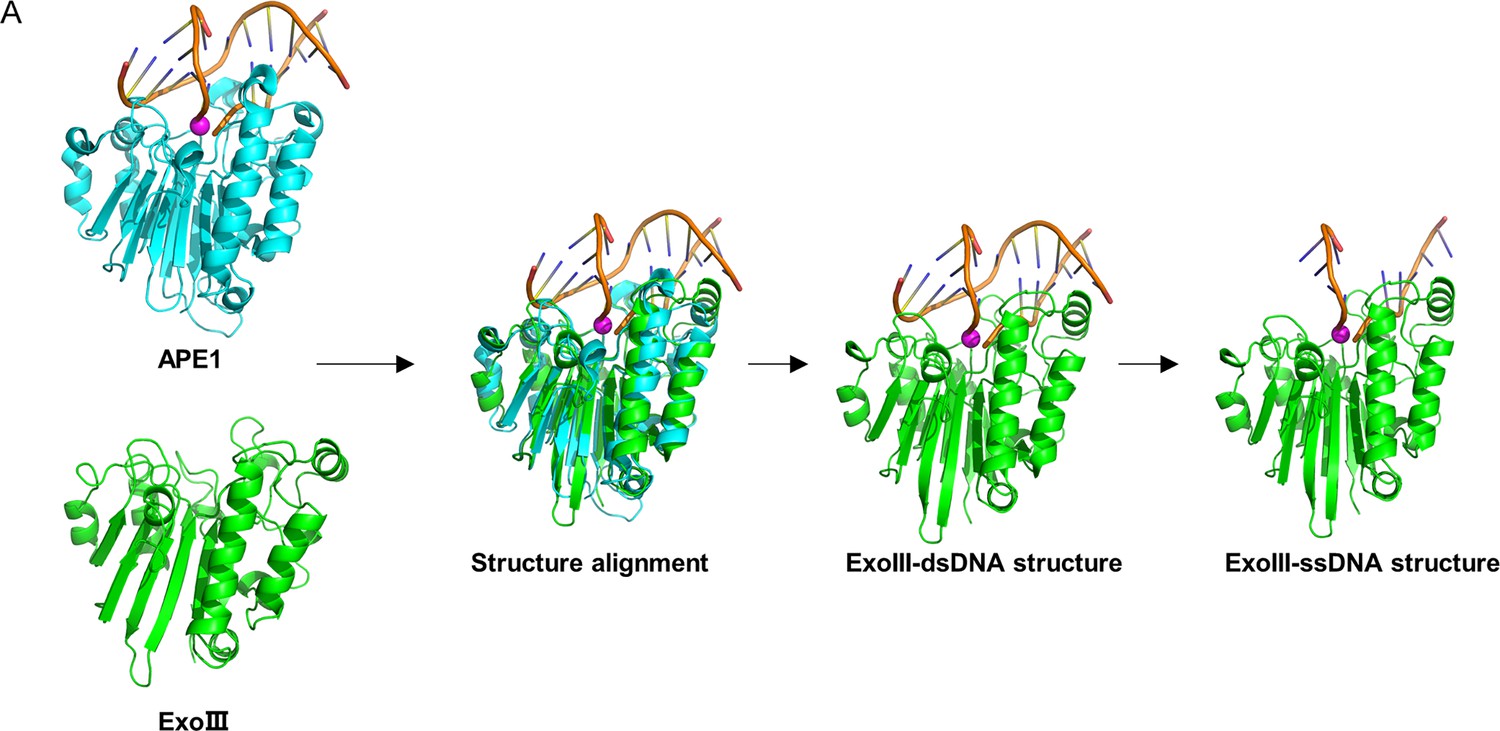
Structure alignment was performed between exonuclease Ⅲ (ExoIII) (PDB ID: 1AKO) and APE1-dsDNA (PDB ID: 1DE8 and NDB ID: 5WN5) complex through TM-align (Version 20190822) (https://zhanggroup.org/TM-align/).
The two similar homologous structures were perfectly superpositioned to each other. Then, the structure of APE1 and one ssDNA of double-stranded DNA (dsDNA) were deleted in the alignment by Pymol, while the other ssDNA that stretches into the active site of ExoIII forms the ExoIII-ssDNA structure with ExoIII.
Figure 8 with 2 supplements
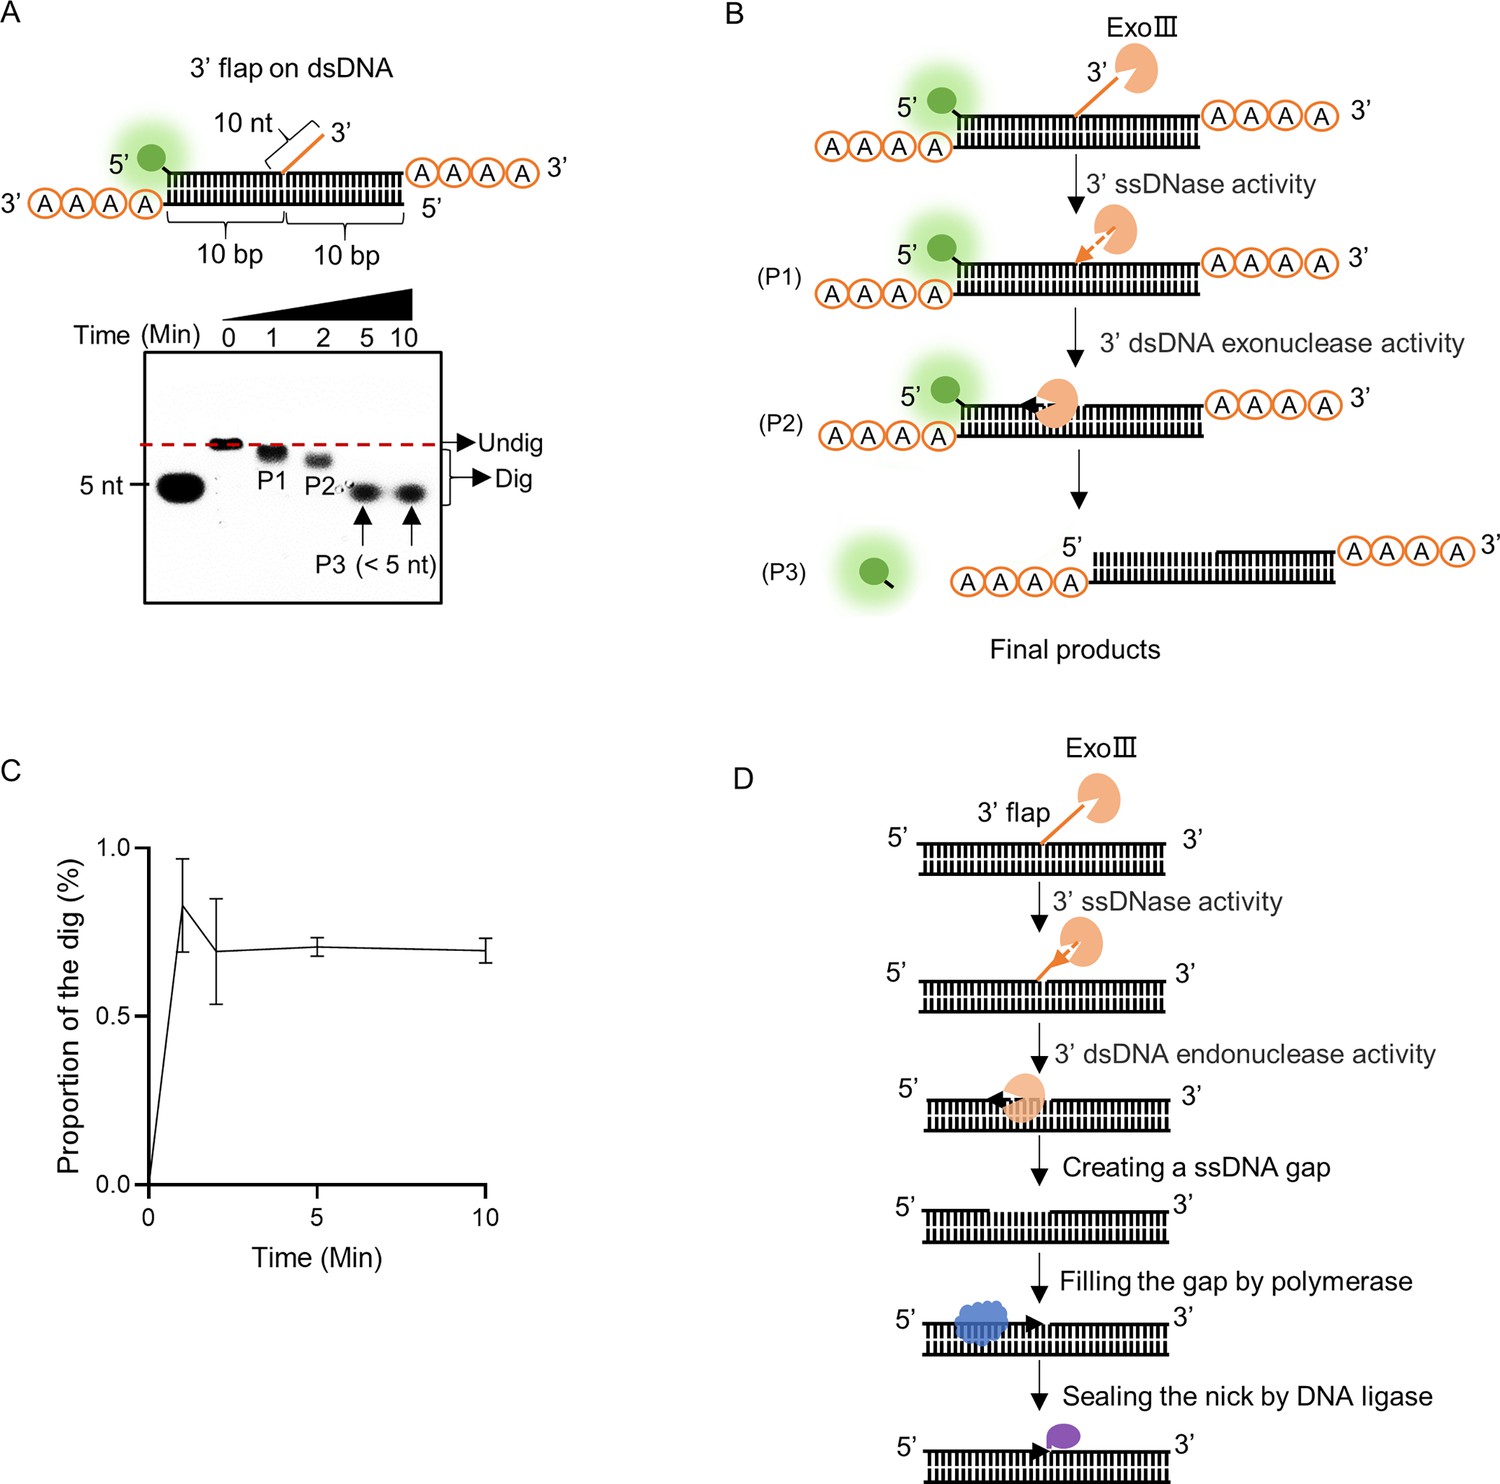
Exonuclease Ⅲ (ExoIII) efficiently digested the 3′ flap ssDNA on double-stranded DNA (dsDNA).
(A) The constitution of the dsDNA structure with 3′ flap is displayed. The time course analysis of ExoIII (2.5 µM) digestion on the structure (5 µM) was performed, and the products were analyzed by gel electrophoresis. (B) According to the activities of ExoIII on ssDNA and dsDNA, the process of enzymatic reaction on the dsDNA structure was outlined. (C) The digested proportions of ssDNA substrates were calculated by: (gray intensity of the digested band)/(gray intensity of the undigested band at 0 min) and plotted based on an average value of three repeats. (D) Based on our result and the gap-creation ability of ExoIII (Yoo et al., 2021), a novel biological role of ExoIII in DNA repair was proposed: when the 3′ ssDNA flap occurs on dsDNA during biological processes such as base excision repair (BER) or DNA replication, ExoIII recognizes and removes the ssDNA flap by its ssDNase activity; then it continues to digest and create a ssDNA gap on the dsDNA by exonuclease activity; the resulted intermediate recruits the DNA polymerase to re-synthesize the complementary strand; finally, the nick left is sealed by DNA ligase.
-
Figure 8—source data 1
Exonuclease Ⅲ (ExoⅢ) efficiently digested the 3′ flap ssDNA on double-stranded DNA (dsDNA).
- https://cdn.elifesciences.org/articles/95648/elife-95648-fig8-data1-v1.zip
Figure 8—figure supplement 1
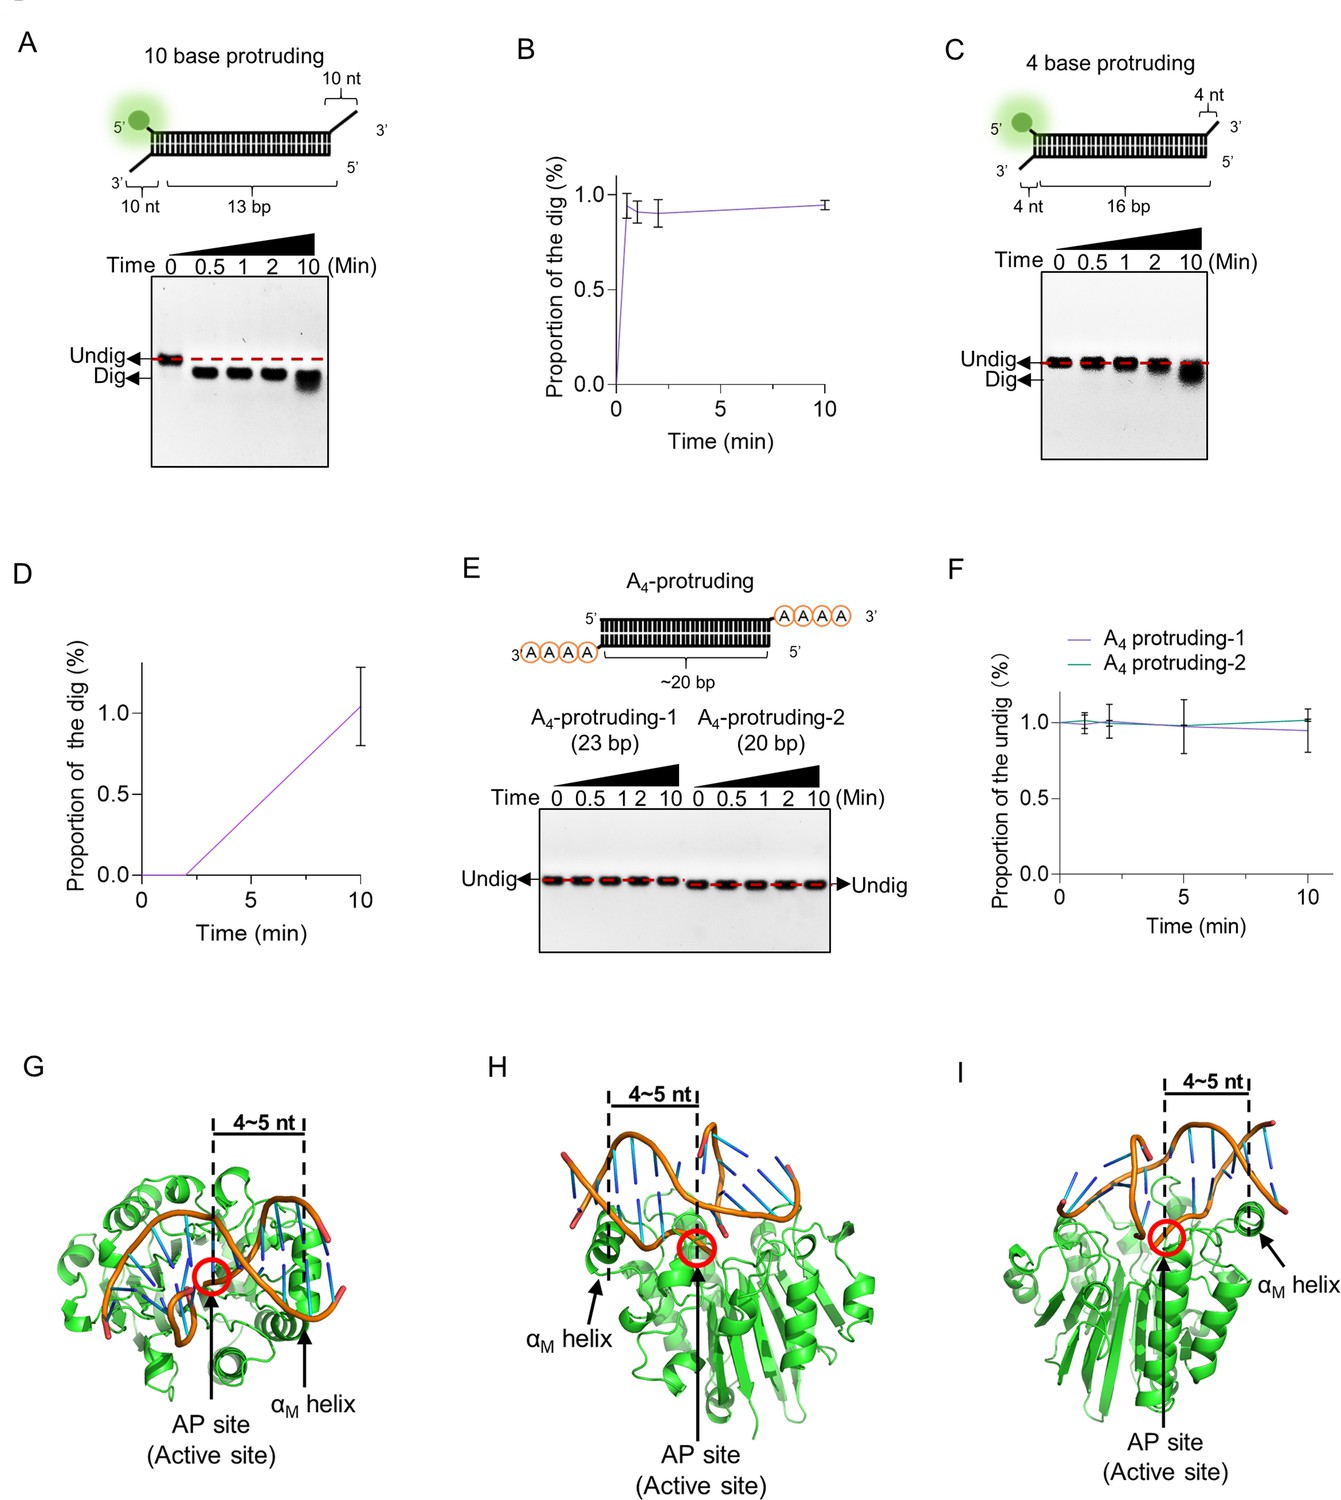
The double-stranded DNA (dsDNA) substrates with 3′ protruding bases (≥4 nt) were digested by exonuclease Ⅲ (ExoIII).
(A) The dsDNA substrate with a 3′ 10-base protruding structure (5 µM) was incubated with ExoIII (2.5 µM) for 10 min, and the time course analysis of ExoIII digestion was performed. (B) The gray intensity of the bands was determined by ImageJ. The average intensity value of three repeats was to calculate the proportion of the digested band by: (Intensity of the digested band)/(Intensity of the undigested band at 0 min). (C) The dsDNA substrate with a 3′ end 4-base protruding structure was incubated with ExoIII for 5 min, and the time course of ExoIII digestion was analyzed by gel electrophoresis. (D) The Gray intensity of the bands was determined by ImageJ. The average intensity value of three repeats was to calculate the proportion of the digested band by: (Intensity of the digested band)/(Intensity of the undigested band at 0 min). (E) The dsDNA substrates with 3′ consecutive four-As protruding structure were incubated with ExoIII for 10 min, and the time course of ExoIII digestion was analyzed by gel electrophoresis. Undig, undigested; dig, digested. (F) The gray intensity of the bands was determined by ImageJ. The average intensity value of three repeats was to calculate the proportion of the undigested band by: (Intensity of the undigested band)/(Intensity of the undigested band at 0 min). The detailed information on these substrates is described in Table 1. The αM helix of E. coli is 4~5 bp apart from the active site. The structure of ExoIII-dsDNA was obtained in the structure alignment between APE1-dsDNA (PDB ID: 1DE8 and NDB ID: 5WN5) and ExoIII (PDB ID: 1AKO) by Pymol. The binding interface between ExoIII and dsDNA containing an apurinic/apyrimidinic (AP) site was present from three view angles: the top (G) and the two sides (H, I).
-
Figure 8—figure supplement 1—source data 1
Exonuclease Ⅲ (ExoⅢ) digested the double-stranded DNA (dsDNA) substrates with 3′ protruding bases.
- https://cdn.elifesciences.org/articles/95648/elife-95648-fig8-figsupp1-data1-v1.zip
Figure 8—figure supplement 2
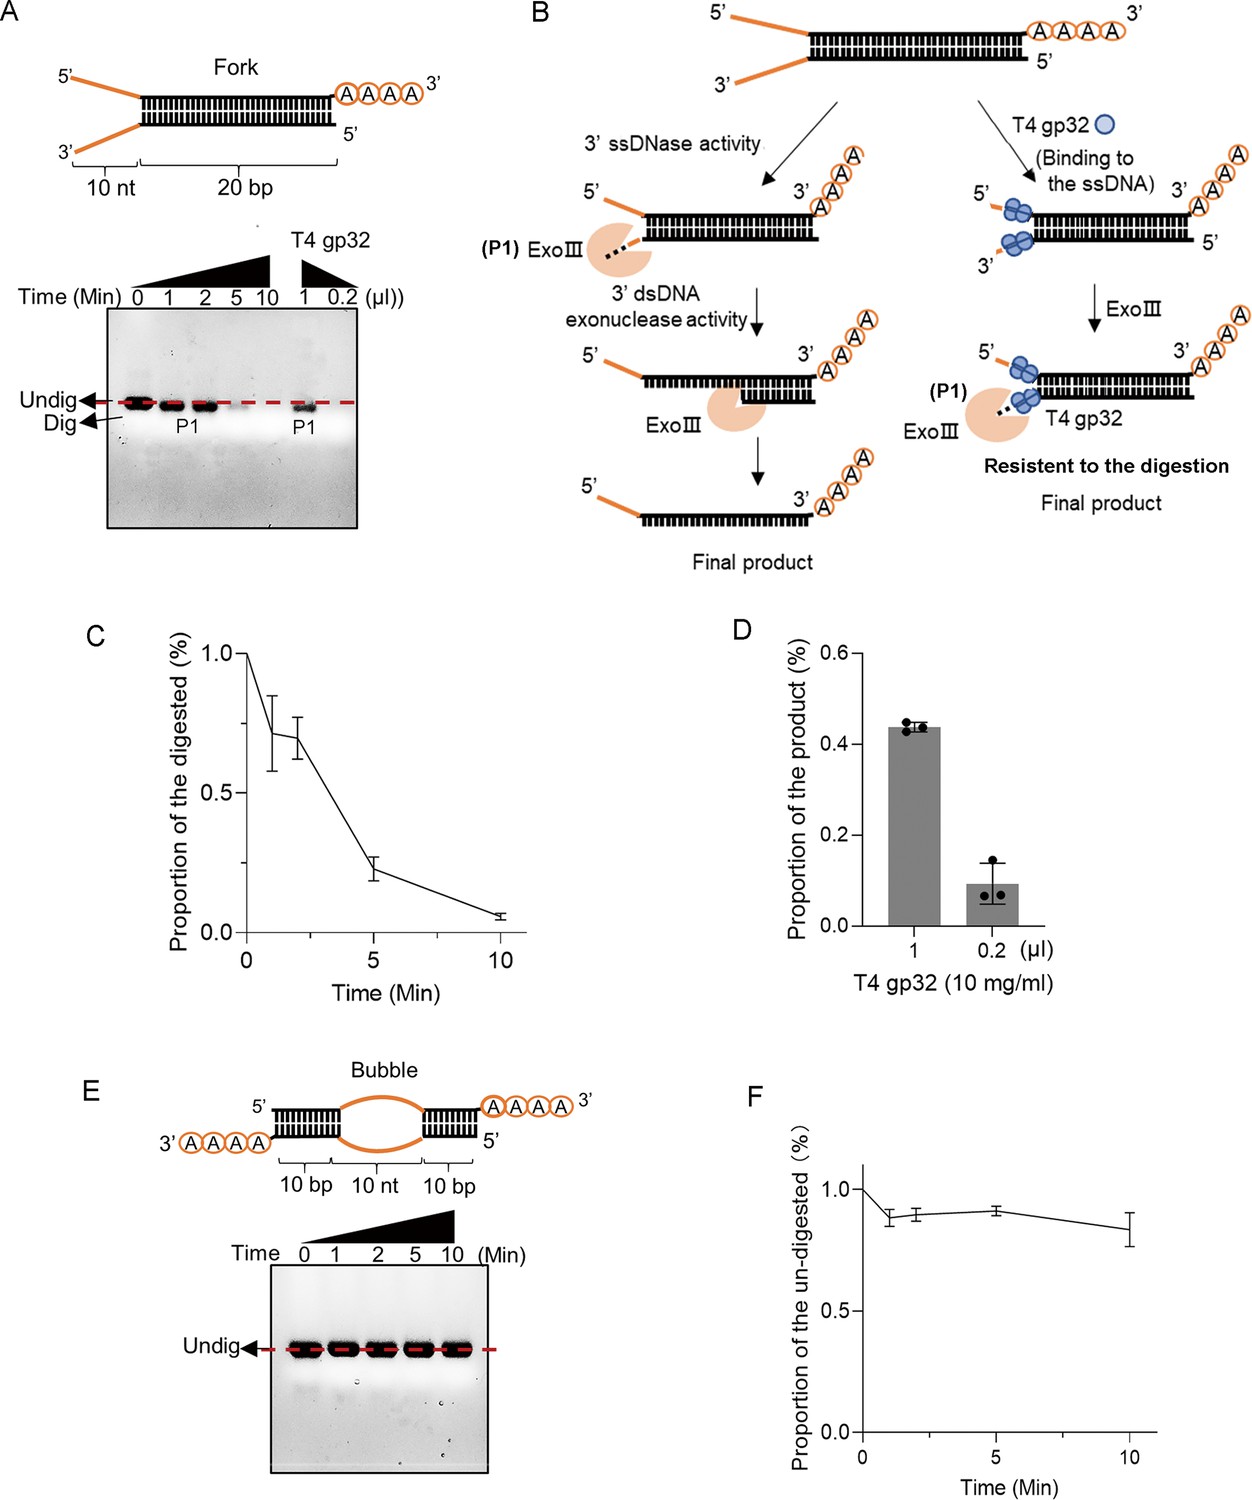
Exonuclease Ⅲ (ExoIII) digested the fork double-stranded DNA (dsDNA) structure with 3' end ssDNA, while the ssDNA binding protein T4 gp32 suppressed the digestion.
(A) The constitution of fork dsDNA structure is present. The time course analysis of ExoIII digestion on the structure was performed, and the products were analyzed by gel electrophoresis. 0.2 or 1 µl ssDNA binding protein T4 gp32 (10 mg/ml) was pre-incubated in the fork structure for 10 min before ExoIII digestion. The reaction products were analyzed by gel electrophoresis. (B) Based on the activities of ExoIII on ssDNA and dsDNA and the protection effect of T4 gp32, the process of enzymatic reaction on the fork dsDNA structure was outlined. (C) The digested proportions of ssDNA substrates were calculated by (Gray intensity of the digested band)/(Gray intensity of the undigested band at 0 min) and plotted based on the average value of three repeats. (D) The product proportions were calculated by: (Gray intensity of the band with T4 gp32 pre-treatment)/(Gray intensity of the band without T4 gp32 pre-treatment and ExoIII digestion at 0 min) and plotted based on the average value of three repeats. (E) The constitution of bubble dsDNA structure with 3' end A4 is portrayed. The time course analysis of ExoIII digestion on the structure was performed, and the products were analyzed by gel electrophoresis. The nucleic acid dye was used in the gel to visualize the reaction products containing the dsDNA duplex. (F) The undigested proportions of ssDNA substrates were calculated by (Gray intensity of the undigested band)/(Gray intensity of the undigested band at 0 min) and plotted based on the average value of three repeats.
-
Figure 8—figure supplement 2—source data 1
Exonuclease Ⅲ (ExoⅢ) digested the fork double-stranded DNA (dsDNA) structure with 3' end ssDNA.
- https://cdn.elifesciences.org/articles/95648/elife-95648-fig8-figsupp2-data1-v1.zip
Author response image 1

Author response image 2
Tables
Table 1
The mass spectrometry analysis on the exonuclease Ⅲ (ExoIII)-treated ssDNA oligos.
| Sample(Theoretical mass) | ssDNA without ExoIII | ssDNA treated with ExoIII | |||||||
|---|---|---|---|---|---|---|---|---|---|
| Mass peak (Da) | Intensity | Relative (%) | Presumed products (Theoretical mass) | Mass peak (Da) | Intensity | Relative (%) | Presumed products (Theoretical mass) | Structure of the top intensity | |
| Probe 1 (7504) | 7501.1 | 4.79E+07 | 100 | FITC-CAAACCCAGAGCCAATCTTATCT (7504) | 2914.9 | 6.31E+06 | 100 | FITC-CAAACCCA (2915.6) |  |
| 7523.4 | 1.69E+07 | 35.28 | FITC-CAAACCCAGAGCCAATCTTATCT (7504) + Na+ | 2601.5 | 4.76E+06 | 75.37 | FITC-CAAACCC (2602.4) | ||
| 7546.1 | 1.02E+07 | 21.4 | FITC-CAAACCCAGAGCCAATCTTATCT (7504)+2Na+ | 4047.7 | 1.10E+06 | 17.43 | Undefined | ||
| 7567.9 | 3.45E+06 | 7.2 | FITC-CAAACCCAGAGCCAATCTTATCT (7504)+3Na+ | 2312.2 | 1.07E+06 | 17.01 | Undefined | ||
| 10106.2 | 3.10E+06 | 6.47 | Undefined | 5395.5 | 6.18E+05 | 9.79 | FITC-CAAACCCAGAGCCAAT (5397.2) | ||
| Probe 2 (7063) | 7059.7 | 3.34E+07 | 100 | FAM-GGGTGGGCGGAAAACTATTTC (7063) | 1287.5 | 5.53E+05 | 100 | Mass peak of ExoIII |  |
| 7082.3 | 7.84E+06 | 23.46 | FAM-GGGTGGGCGGAAAACTATTTC (7063)+Na + | 627.8 | 3.35E+05 | 60.59 | Mass peak of ExoIII or TT (P) (626.4) | ||
| 7104.6 | 2.95E+06 | 8.84 | FAM-GGGTGGGCGGAAAACTATTTC (7063)+2Na+ | 13646.1 | 2.01E+05 | 36.26 | Undefined | ||
| 10106.5 | 2.27E+06 | 6.8 | Undefined | 10107.2 | 1.97E+05 | 35.57 | Undefined | ||
| 7341.3 | 1.20E+06 | 3.58 | Undefined | 1979.4 | 1.92E+05 | 34.81 | Undefined | ||
| 13461.6 | 1.07E+006 | 7.94 | Undefined | 4639.6 | 1.59E+05 | 28.74 | FAM-GGGTGGGCGGAAA (4641.6) | ||
| 11549.0 | 6.24E+005 | 6.55 | Undefined | 6655.3 | 1.55E+05 | 28.11 | Undefined | ||
| 3376.6 | 4.57E+005 | 2.88 | Undefined | 1291.6 | 1.45E+05 | 26.29 | Mass peak of ExoIII or GCGG/GGCG/GGGC (P) (1293.8) | ||
| 7481.5 | 3.82E+005 | 5.67 | Undefined | 9126.5 | 1.02E+05 | 18.42 | Undefined | ||
| 957.7 | 1.02E+05 | 18.39 | AAA (P) (957.6) | ||||||
| Probe 3 (6658) | 6655.2 | 3.30E+07 | 100 | FAM-AGTCCGT TTGTTCTTGTGGC (6658) | 2936.9 | 8.36E+06 | 100 | FAM-AGTCCGTT (2937.6) |  |
| 6677.5 | 1.06E+07 | 32.18 | FAM-AGTCCGTTTGTTCTTGTGGC (6658) + Na+ | 3240.9 | 2.77E+06 | 33.1 | FAM-AGTCCGTTT (3241.8) | ||
| 6699.9 | 6.00E+06 | 18.15 | FAM-AGTCCGTTTGTTCTTGTGGC (6658)+2Na+ | 2632.7 | 2.34E+06 | 27.99 | FAM-AGTCCGT (2633.4) | ||
| 6721.6 | 1.85E+06 | 5.59 | Undefined | 2328.7 | 8.11E+05 | 9.69 | FAM-AGTCCG (2329.2) | ||
| 6936.6 | 1.29E+06 | 3.91 | Undefined | 643.8 | 4.59E+05 | 5.48 | Undefined | ||
| ExoIII | 1287.6 | 5.44E+05 | 100 | Undefined | |||||
| 627.8 | 3.45E+05 | 63.38 | Undefined | ||||||
| 2639.4 | 1.91E+05 | 35.09 | Undefined | ||||||
| 1291.6 | 1.47E+05 | 27.04 | Undefined | ||||||
| 19174.8 | 1.36E+05 | 25.08 | Undefined | ||||||
Table 2
The embedded use of ssDNA in various exonuclease Ⅲ (ExoIII)-associated diagnostic platforms.
| Classification by the ExoIII activity used in the methods | Diagnostic platforms | Targets | Functions of ExoIII | Involved nucleic acid aptamer | Published |
|---|---|---|---|---|---|
| dsDNA exonuclease-based detection | ExoIII-aided electrochemiluminescencence techniques | miRNA-21 (a cancer biomarker) | Recognize and degrade dsDNA to ssDNA for triggering subsequent reaction | The ssDNA oligos and hairpin dsDNA with 3′ end protruding ssDNA or dsDNA with the blunt end | Zhang et al., 2023 |
| ExoIII combined with quantum dots. | HIV and HBV virus | Wang et al., 2021 | |||
| ExoIII combined with nanoparticles | p53 gene | Wu et al., 2021 | |||
| ExoIII integrated with the microfluidic platform. | Manganese superoxide dismutase gene | Zheng et al., 2020 | |||
| ExoIII facilitated chemiluminescence techniques. | Synthetic DNA target | Gao and Li, 2014 | |||
| AP-endonuclease based detections | ExoIII integrated with Recombinase Polymerase Amplification (RPA) | Aeromonas salmonicida | Recognize and cleave the AP site on dsDNA for releasing fluorescence signal. | Primers and a ssDNA oligo containing AP site labeled with fluorescence and quencher groups | Zhou et al., 2022 |
| Burkholderia cepacia | Daddy Gaoh et al., 2023 | ||||
| Elizabethkingia miricola | Qiao et al., 2022 | ||||
| Porcine parvovirus | Wang et al., 2017 | ||||
| Dengue virus | Abd El Wahed et al., 2015 | ||||
| SARS-CoV-2 | Behrmann et al., 2020 |
Table 3
An updated list for ExoIII activities.
| Substrates | Preferred structures | Activities | Products | Key references |
|---|---|---|---|---|
| dsDNA | With 3′ phosphonate | 3′ phosphatase | Phosphate | Richardson and Kornberg, 1964 |
| Containing AP | Endonuclease | ssDNA gap on DNA | Rogers and Weiss, 1980 | |
| Natural DNA | Exonuclease | Phosphate, 5′ mononucleotides, ssDNA | Richardson et al., 1964 | |
| RNA | RNA/DNA hybrid | RNase H | Mono-ribonucleotide, ssDNA | Weiss et al., 1978 |
| ssDNA | Containing AP | Active (less than dsDNA) | Oligos | Shida et al., 1996 |
| Nonstructural ssDNA | Exonuclease and endonuclease activities | Mononucleotide, Oligos | This study |
Key resources table
| Reagent type (species) or resource | Designation | Source or reference | Identifiers | Additional information |
|---|---|---|---|---|
| Gene (E. coli) | ExoⅢ | GenBank | GeneID:946254 | |
| Strain, strain background | Rosetta(DE3) Competent Cells | LGC Biosearch Technologies | 70954 | |
| Peptide, recombinant protein | ExoⅢ | NEB | NEB#M0206V | |
| Peptide, recombinant protein | T7 exonuclease | NEB | NEB#M0263L | |
| Peptide, recombinant protein | LbCas12a | NEB | NEB#M0653S | |
| Peptide, recombinant protein | T4 gp32 | Beyotime Biotech. Inc, China | D7057S | |
| Peptide, recombinant protein | SSB (E. coli) | Beyotime Biotech. Inc, China | P7415 | |
| Recombinant DNA reagent | pET-30a (plasmid) | Addgene | EMD Biosciences | Protein expression |
| Commercial assay or kit | HisSep Ni-NTA 6FF Chromatography | Yeasen Biotechnology Co., Ltd, China | 20503ES10 | Protein purification |
| Commercial assay or kit | ClonExpress II One Step Cloning Kit | Vazyme Biotech, China | C112 | |
| Commercial assay or kit | T7 in vitro transcription kit | Vazyme Biotech, China | TR101 V22.2 | crRNA synthesis |
| Commercial assay or kit | TURBO DNase | Thermo Fisher Scientific, Massachusetts, USA | AM2238 | crRNA synthesis |
| Commercial assay or kit | RPA | TwistAmp Basic | TABAS03KIT | |
| Commercial assay or kit | MIRA (Basic type) | Amplification Future company | WLB8201KIT | |
| Commercial assay or kit | RPA | TwistAmp exo | TAEXO02KIT | |
| Commercial assay or kit | MIRA (Fluorescence type) | Amplification Future company | WLE8202KIT | |
| Sequence-based reagent | FQ reporter | This paper | Sunya Biotechnology Co., China | 5’-FAM-TTATT-BHQ1-3’ |
| Sequence-based reagent | Probe 1 | This paper | Sunya Biotechnology Co., China | CAAACCCAGAGCCAATCTTATCT |
| Sequence-based reagent | Probe 2 | This paper | Sunya Biotechnology Co., China | CGGGTGGGCGGAAAACTATTTC |
| Sequence-based reagent | Probe 3 | This paper | Sunya Biotechnology Co., China | AGTCCGTTTGTTCTTGTGGC |
| Sequence-based reagent | crRNA | This paper | GGUAAUUUCUACUAAGUGUA GAUAACAGCACAUGCAGAAUCAU | |
| Software | PyMOL | DeLano Scientific | ||
| Software | Mx3500P | Agilent | Fluorescence monitoring | |
| Software | Graphpad | Dotmatics | Version 9.0.0 |
Additional files
-
Supplementary file 1
All the reaction products of ExoIII obtained by mass spectrometry analysis are provided.
- https://cdn.elifesciences.org/articles/95648/elife-95648-supp1-v1.xlsx
-
Supplementary file 2
All the sequences used in the study are listed.
- https://cdn.elifesciences.org/articles/95648/elife-95648-supp2-v1.docx
-
MDAR checklist
- https://cdn.elifesciences.org/articles/95648/elife-95648-mdarchecklist1-v1.docx
Download links
A two-part list of links to download the article, or parts of the article, in various formats.
Downloads (link to download the article as PDF)
Open citations (links to open the citations from this article in various online reference manager services)
Cite this article (links to download the citations from this article in formats compatible with various reference manager tools)
Bacterial exonuclease III expands its enzymatic activities on single-stranded DNA
eLife 13:RP95648.
https://doi.org/10.7554/eLife.95648.3


