Metabolite profiling of human renal cell carcinoma reveals tissue-origin dominance in nutrient availability
- Department of Biology, Massachusetts Institute of Technology, United States
- Koch Institute for Integrative Cancer Research, Massachusetts Institute of Technology, United States
- Broad Institute of MIT and Harvard, United States
- Medical Scientist Training Program, Vanderbilt University, United States
- Department of Medicine, Vanderbilt University Medical Center (VUMC), United States
- Graduate Program in Cancer Biology, Vanderbilt University, United States
- Steele Laboratories of Tumor Biology, Department of Radiation Oncology, Massachusetts General Hospital and Harvard Medical School, United States
- Whitehead Institute for Biomedical Research, United States
- Department of Medicine, Massachusetts General Hospital, United States
- Harvard Medical School, United States
- Department of Surgery, University of Chicago Medicine, United States
- Ben May Department of Cancer Research, University of Chicago, United States
- Vanderbilt Center for Immunobiology and Vanderbilt-Ingram Cancer Center, VUMC, United States
- Department of Pathology, Microbiology and Immunology, VUMC, United States
- Dana-Farber Cancer Institute, United States
Figures
Figure 1 with 1 supplement
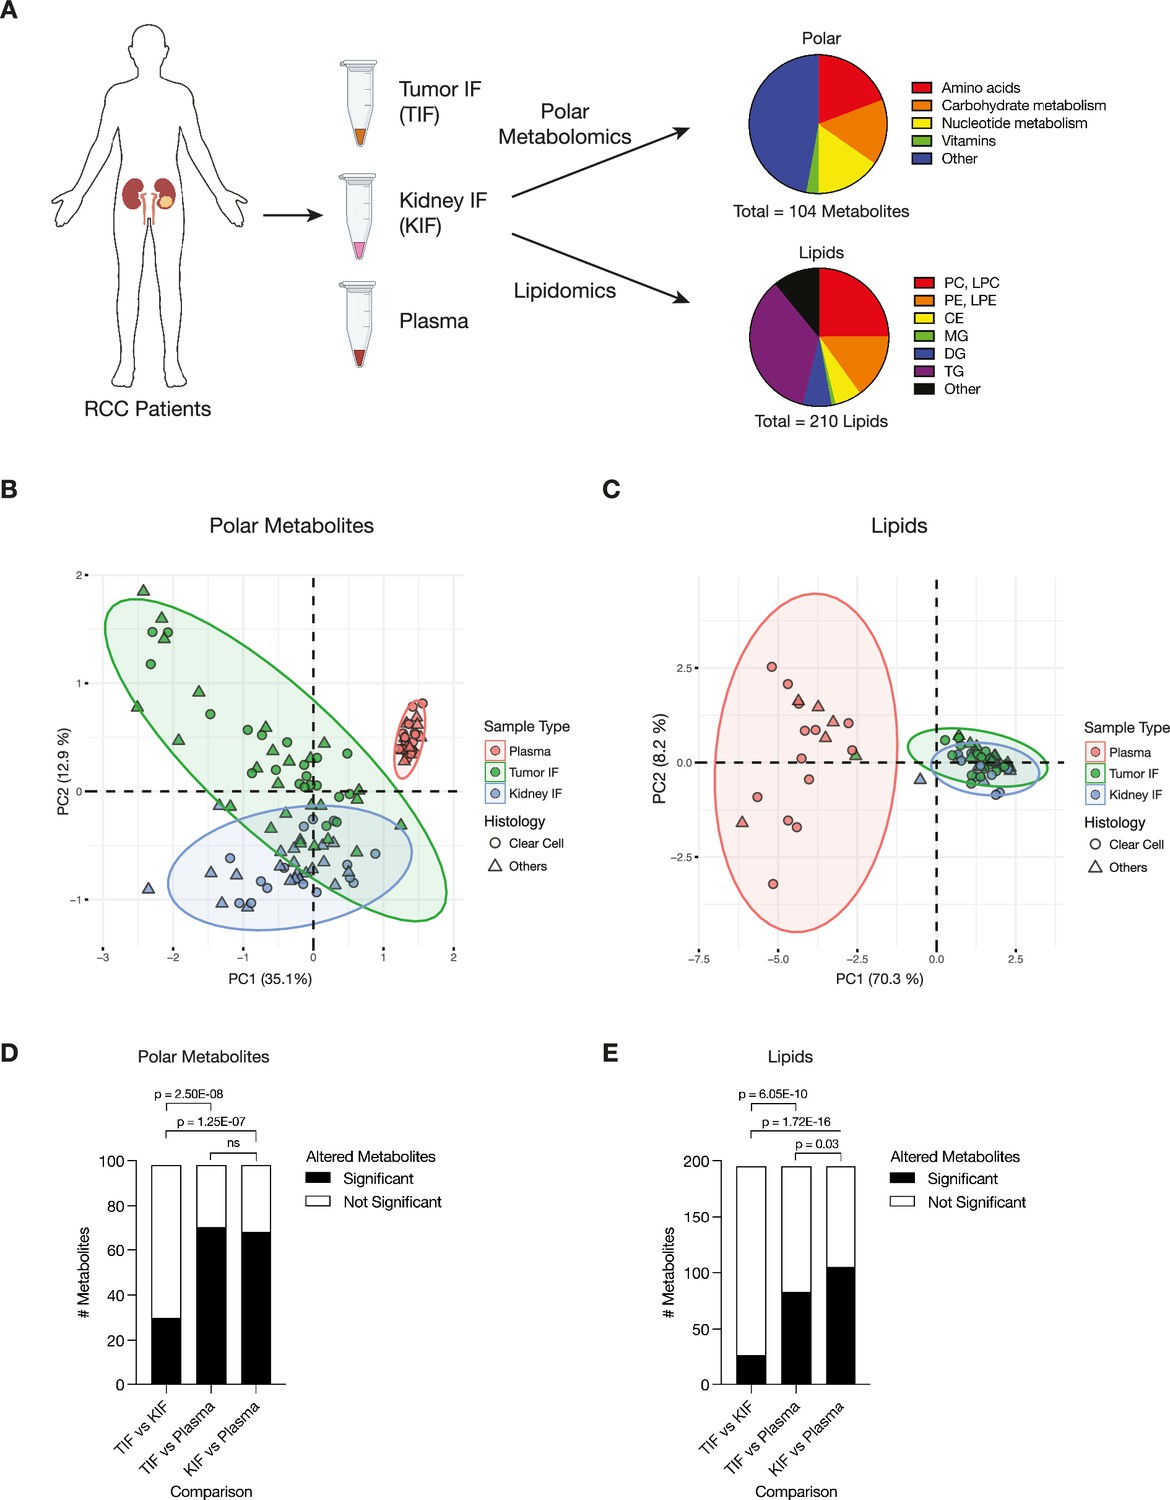
Levels of metabolites in renal cell carcinoma (RCC) tumor interstitial fluid (TIF) are similar to those found in normal kidney interstitial fluid (KIF).
(A) Schematic depicting study design whereby samples collected from patients with RCC undergoing nephrectomy were used to derive TIF, KIF, and plasma. Samples were then subjected to polar metabolomics and lipidomics analyses. See Supplementary file 1 for patient information, and Supplementary file 2 for metabolite concentrations. (B) Principal component analysis of polar metabolites measured from the indicated RCC patient samples (n = 55 patients). For each sample, absolute levels of 98 polar metabolites were quantified by liquid chromatography/mass spectrometry (LC/MS). Data represent 55 TIF, 46 KIF, and 27 plasma samples. The 95% confidence interval is displayed. (C) Principal component analysis of lipid species measured from the indicated RCC patient samples (n = 38 patients). For each sample, relative levels of 195 lipids were assessed by LC/MS. Data represent 34 TIF, 25 KIF, and 18 plasma samples. The 95% confidence interval is displayed. (D) T-test analysis of polar metabolites (n = 98) that do or do not significantly differ in concentration between each site from all RCC patient samples (n = 55 patients). Cutoffs of |log2 fold change| >1 and adjusted p-value (false discovery rate-corrected) <0.05 were used to determine significant metabolites. p-values in the plot are derived from chi-squared statistical analysis. (E) T-test analysis of lipids (n = 195) that do or do not significantly differ in concentration between each site from all RCC patient samples (n = 38 patients). Cutoffs of |log2 fold change| >1 and adjusted p-value (false discovery rate-corrected) <0.05 were used to determine significant metabolites. p-values in the plot are derived from chi-squared statistical analysis. Panel A created with BioRender.com, and published using a CC BY-NC-ND license with permission.
© 2024, BioRender Inc. Figure 1 was created using BioRender, and is published under a CC BY-NC-ND 4.0. Further reproductions must adhere to the terms of this license
Figure 1—figure supplement 1
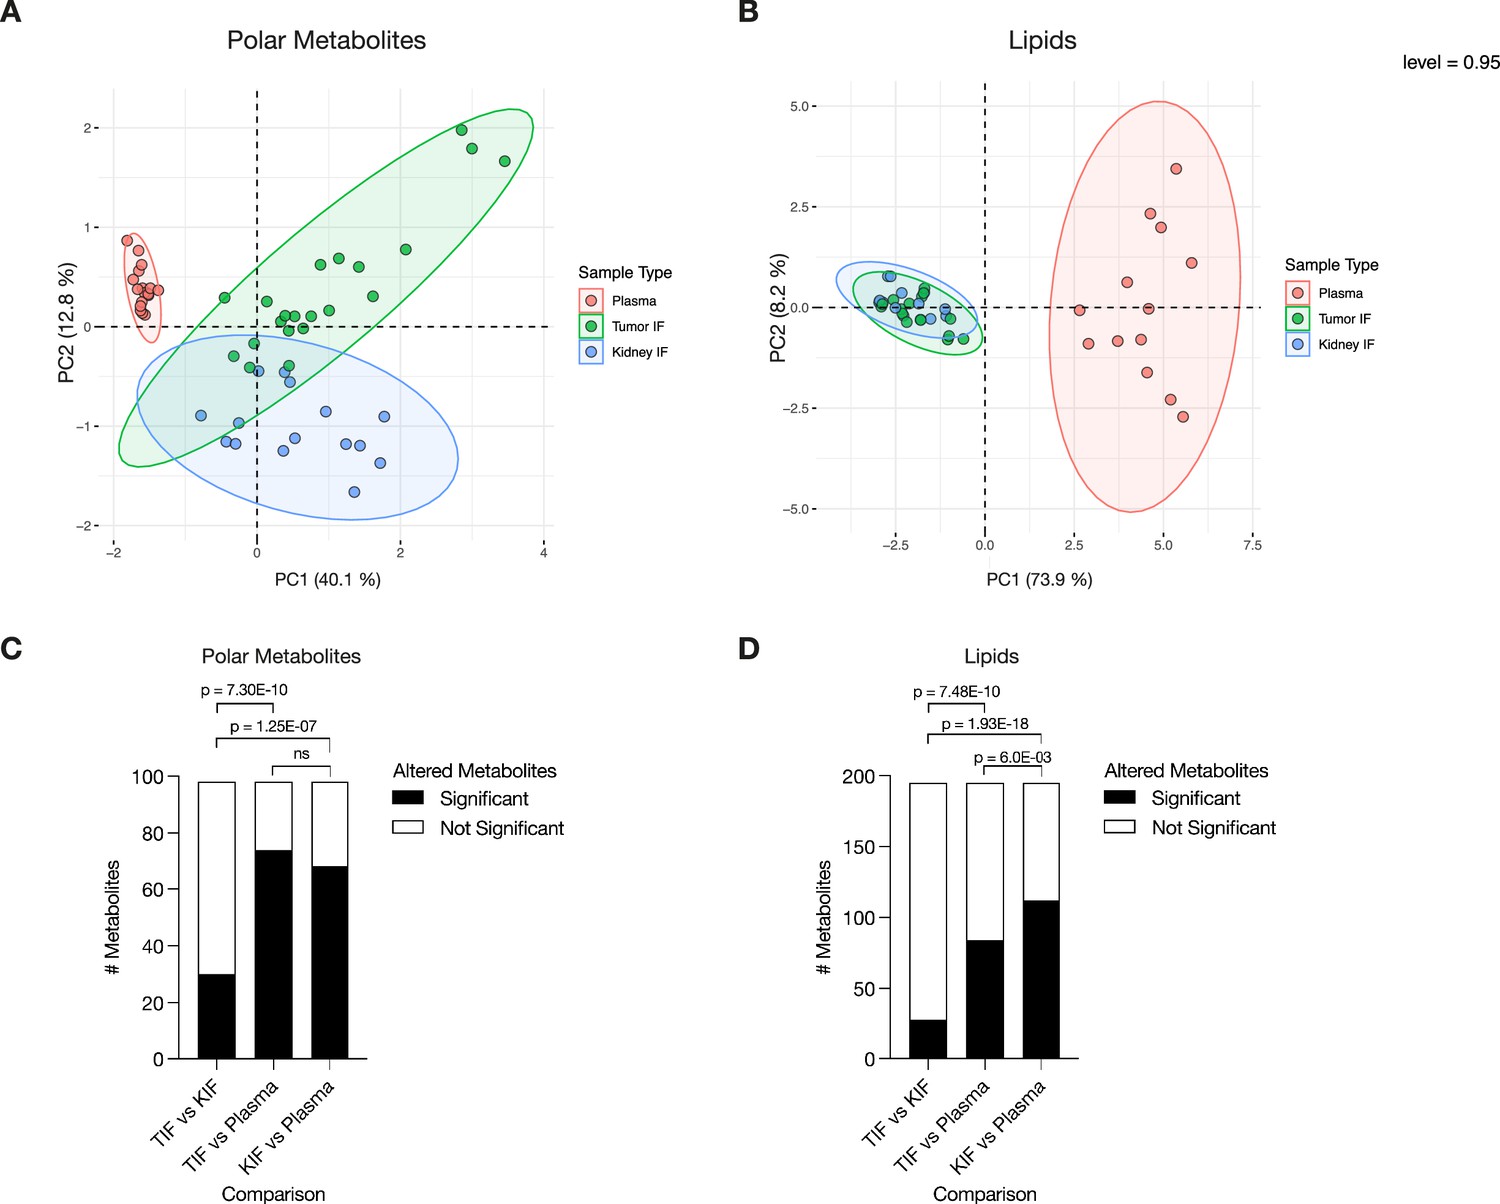
Levels of metabolites in clear cell renal cell carcinoma (RCC) interstitial fluid are similar to those found in normal kidney interstitial fluid (KIF).
(A) Principal component analysis of polar metabolites measured from the indicated clear cell RCC patient samples (n = 41 patients). For each sample, absolute levels of 98 polar metabolites were quantified by liquid chromatography/mass spectrometry (LC/MS). Data represent 36 tumor interstitial fluid (TIF), 28 KIF, and 20 plasma samples. The 95% confidence interval is displayed. (B) Principal component analysis of lipid species measured from the indicated clear cell RCC patient samples (n = 28 patients). For each sample, relative levels of 195 lipids were assessed by LC/MS. Data represent 25 TIF, 18 KIF, and 15 plasma samples. The 95% confidence interval is displayed. (C) T-test analysis of polar metabolites (n = 98) that do or do not significantly differ in concentration between each site from clear cell RCC patient samples (n = 41 patients). Cutoffs of |log2 fold change| >1 and adjusted p-value (false discovery rate-corrected) <0.05 were used to determine significant metabolites. p-values in the plot are derived from chi-squared statistical analysis. (D) T-test analysis of lipids (n = 195) that do or do not significantly differ in concentration between each site from all clear cell RCC patient samples (n = 28 patients). Cutoffs of |log2 fold change| >1 and adjusted p-value (false discovery rate-corrected) <0.05 were used to determine significant metabolites. p-values in the plot are derived from chi-squared statistical analysis.
Figure 2 with 3 supplements
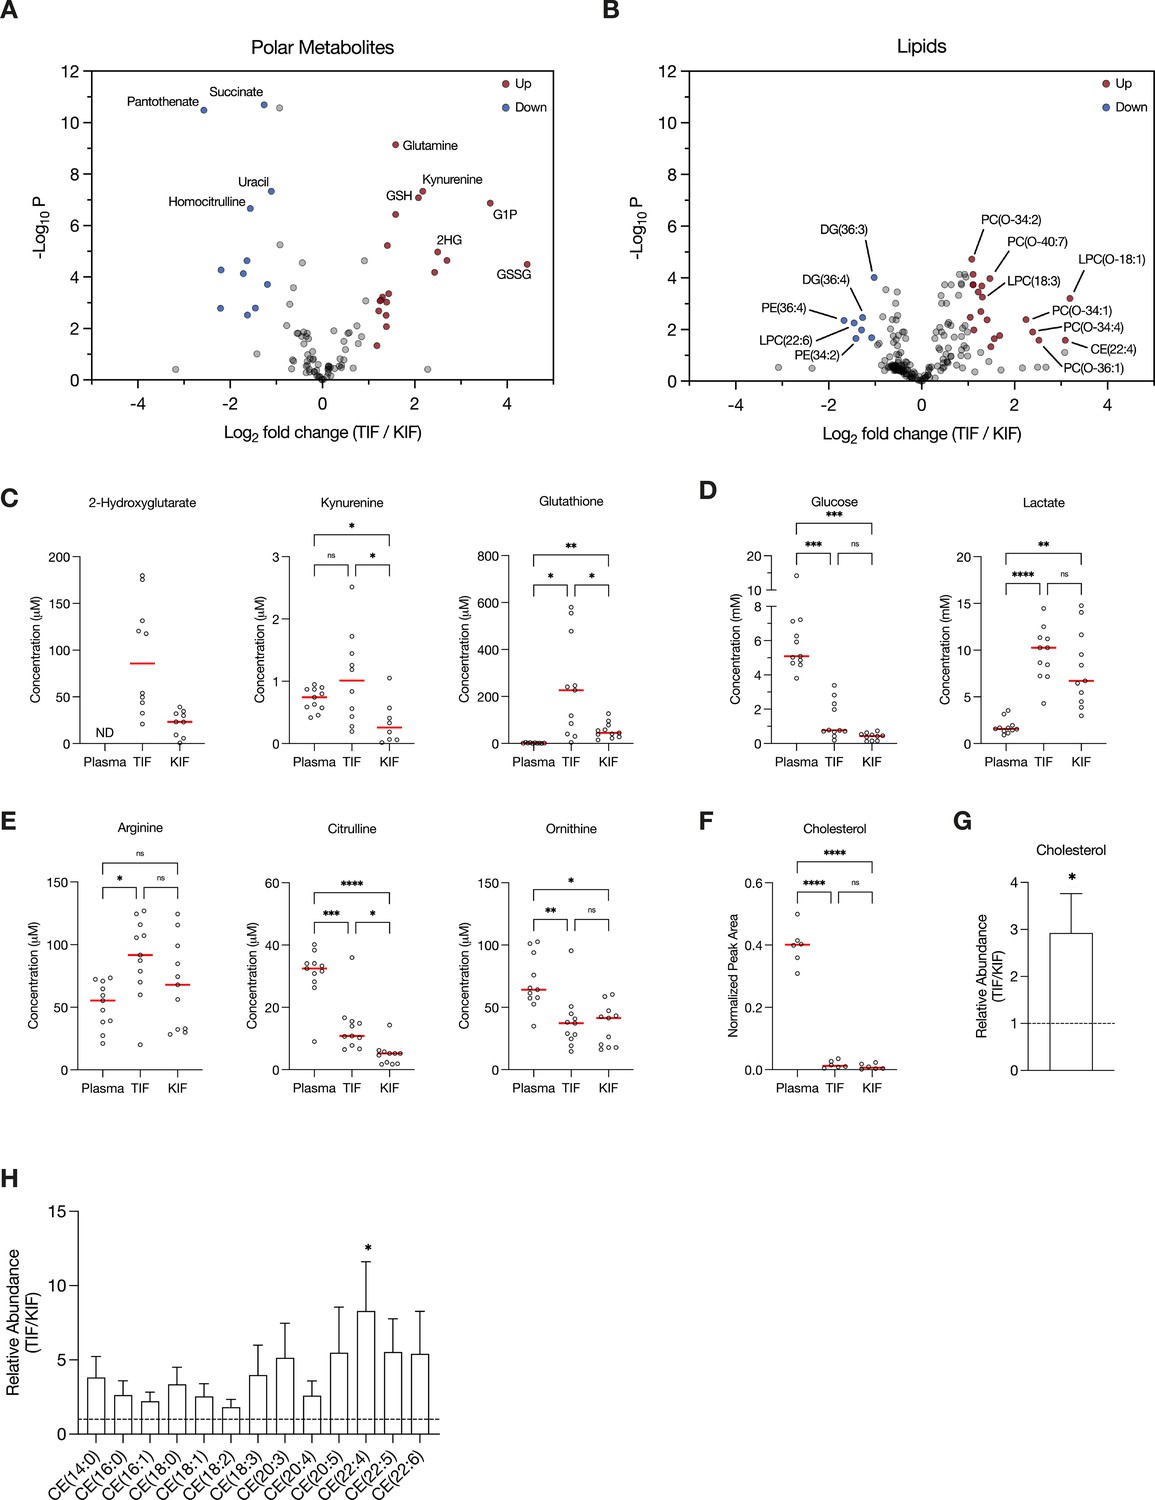
Assessment of metabolites that differ between renal cell carcinoma (RCC) interstitial fluid and normal kidney interstitial fluid (KIF).
Volcano plots depicting the log2 fold change in polar metabolite concentration (A) or relative lipid levels (B) between tumor interstitial fluid (TIF) and KIF from RCC patients (n = 55 patients in [A], n = 38 patients in [B]). Cutoffs of |log2 fold change| >1 and adjusted p-value (false discovery rate-corrected) <0.05 were used to select significantly altered metabolites. Metabolites or lipids highlighted in red and blue are significantly higher and lower in TIF compared to KIF, respectively. Full names of selected lipids: PC(O-34:2), PC(P-34:1)/PC(O-34:2); PC(O-40:7), PC(P-40:6)/PC(O-40:7); LPC(O-18:1), LPC(P-18:0)/LPC(O-18:1); PC(O-34:1), PC(P-34:0)/PC(O-34:1); PC(O-34:4), PC(P-34:3)/PC(O-34:4); PC(O-36:1), PC(P-36:0)/PC(O-36:1). (C–E) Levels of selected metabolites measured by liquid chromatography/mass spectrometry (LC/MS) in plasma, TIF, and KIF from matched RCC patients (n = 10 patients). Each point represents a value measured from one patient, and the red line represents the mean across all patients considered. p-values were derived from either mixed-effects analysis (kynurenine, glutathione, glucose) or repeated measures one-way analysis of variance (ANOVA) (2-hydroxyglutarate, lactate, arginine, citrulline, ornithine), depending on whether missing values were present, and were Tukey multiple comparisons corrected (ns, not significant; *p < 0.05; **p < 0.01; ***p < 0.001; ****p < 0.0001). (F) Normalized peak area values of cholesterol measured by LC/MS in plasma, TIF, and KIF from matched RCC patients (n = 6 patients). Each point represents a sample, and the red line represents the mean across all patients considered. p-values were derived from repeated measures one-way ANOVA with Tukey multiple comparisons correction (ns, not significant; ****p < 0.0001). Relative abundance of cholesterol (G) or cholesteryl esters (H) in TIF compared to KIF from matched RCC patients (n = 20 patients). The mean is presented ± standard error of the mean (SEM), and the black dotted line indicates a ratio of 1, representing no difference in lipid levels between TIF and KIF. p-values were derived from a one sample t-test compared to 1 (*p < 0.05).
Figure 2—figure supplement 1
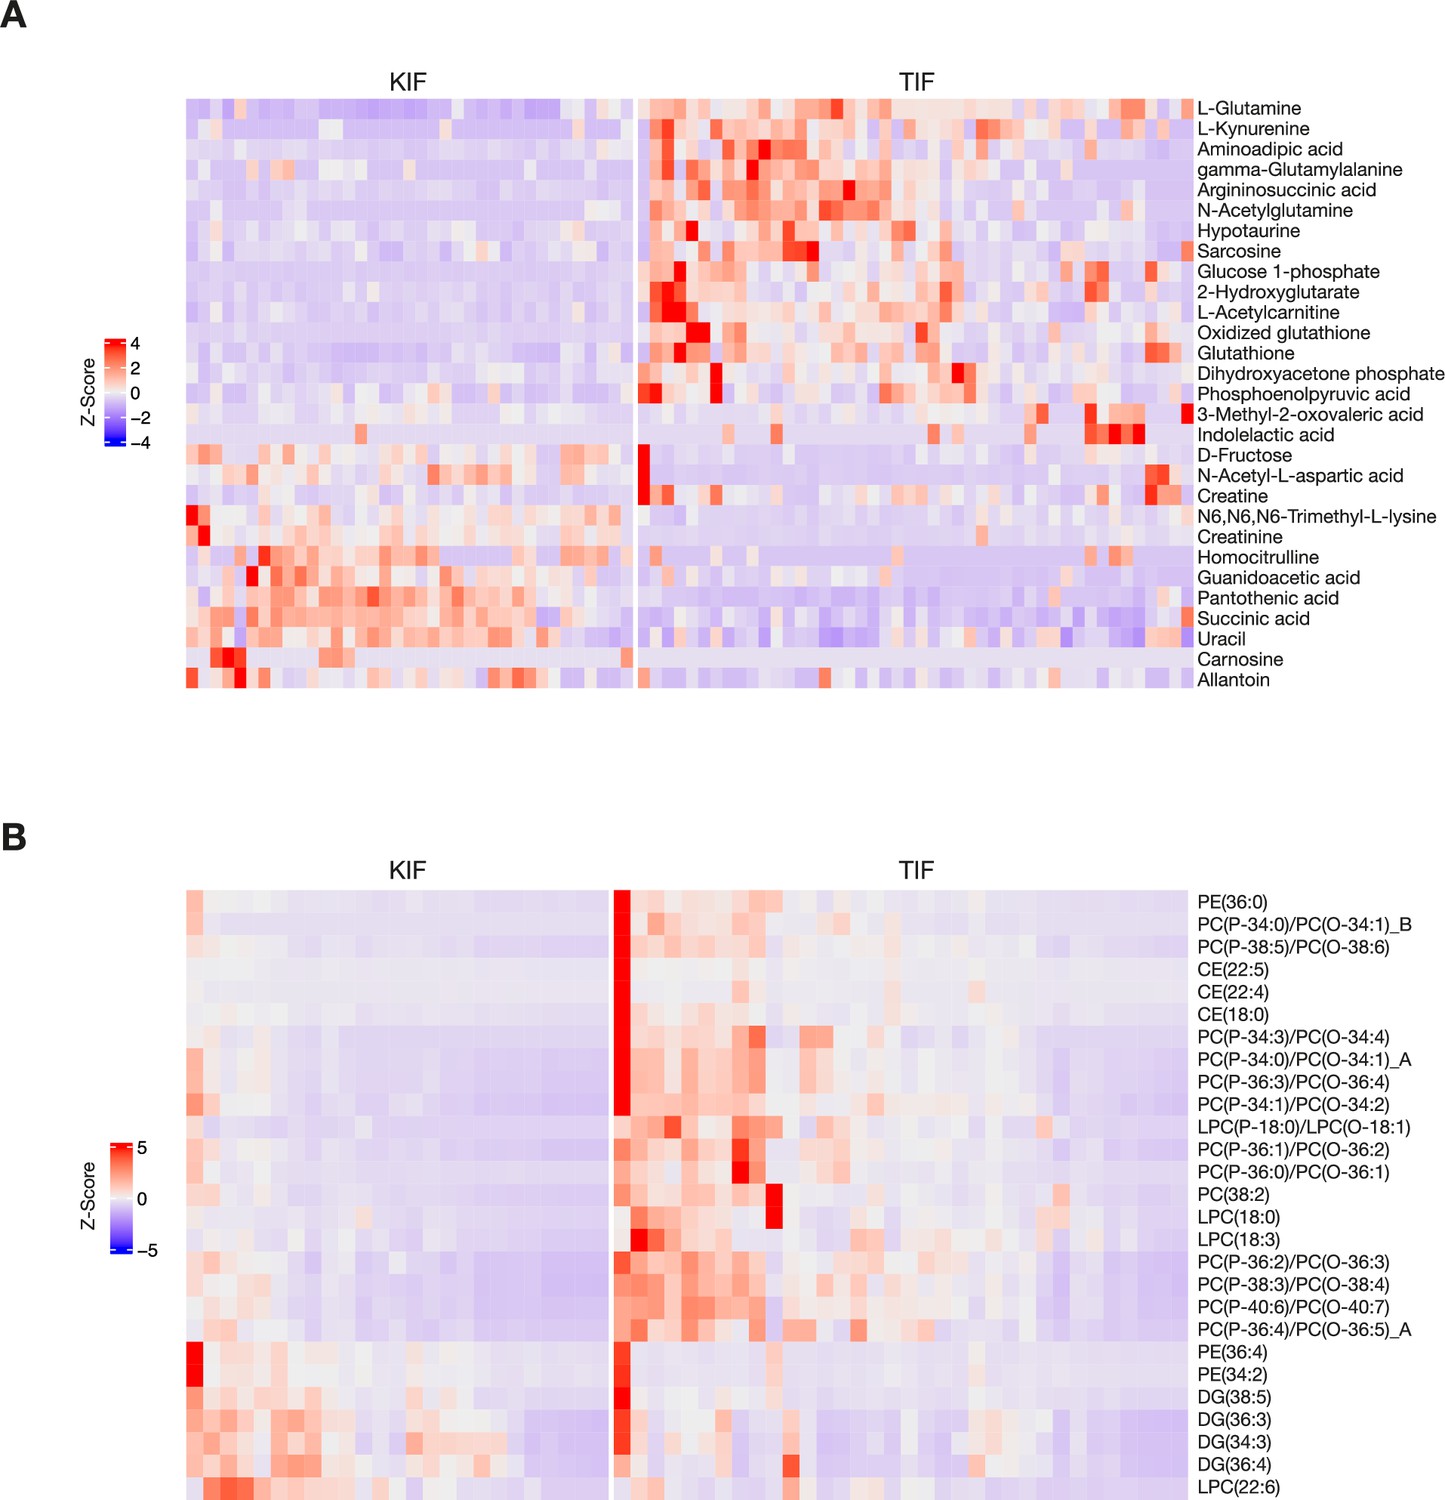
Heatmaps of metabolites that differ between renal cell carcinoma (RCC) interstitial fluid and normal kidney interstitial fluid (KIF).
Heatmaps depicting relative concentrations of the indicated polar metabolites (A) or lipids (B) that differ between KIF and tumor interstitial fluid (TIF). Data within each row were Z-score normalized.
Figure 2—figure supplement 2
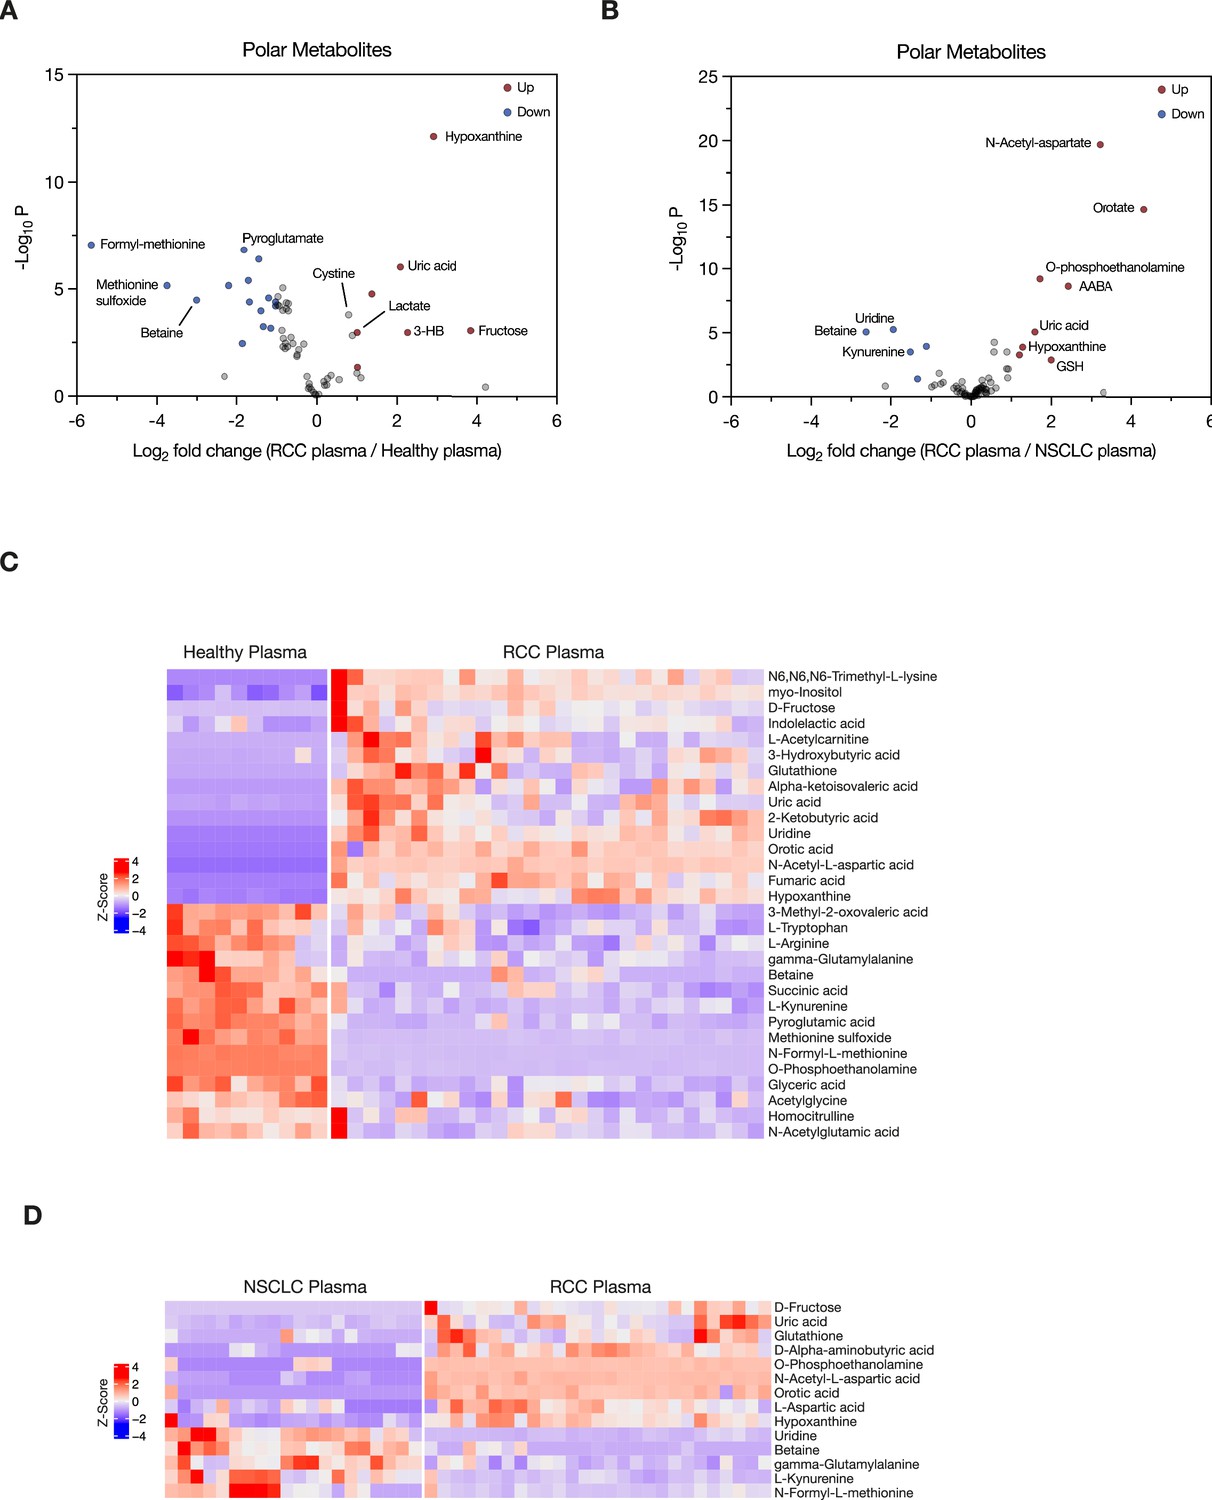
Assessment of metabolites that differ between plasma in patients with renal cell carcinoma (RCC) with plasma from normal individuals and from patients with non-small cell lung cancer (NSCLC).
(A, B) Volcano plots depicting the log2 fold change in polar metabolite concentration measured in plasma from patients with RCC (n = 27) compared to that measured in plasma from healthy adults (n = 10) (A), or measured in plasma from patients with RCC compared to that measured in patients with NSCLC (n = 20). Cutoffs of |log2 fold change| >1 and adjusted p-value (false discovery rate-corrected) <0.05 were used to select significantly altered metabolites. Metabolites highlighted in red and blue are significantly higher and lower in RCC plasma, respectively. Heatmaps depicting relative concentrations of the indicated polar metabolites that differ between healthy and RCC plasma (C) or between NSCLC and RCC plasma (D). Data within each row were Z-score normalized.
Figure 2—figure supplement 3
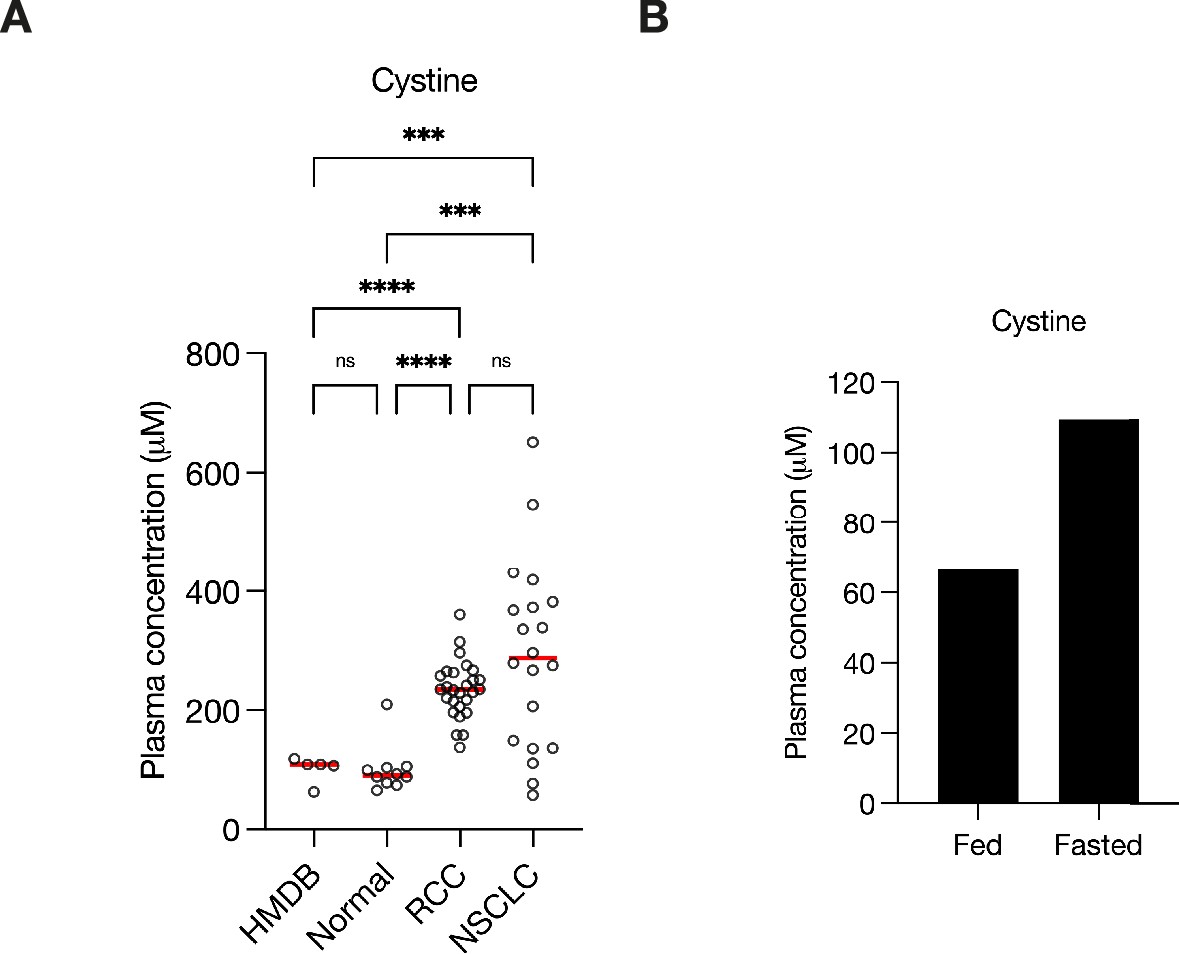
Plasma cystine concentration is affected by fasting.
(A) Concentration of cystine as reported in the Human Metabolome Database (HMDB) (n = 5) or measured in plasma from healthy adults (normal, n = 10), from renal cell carcinoma (RCC) patients (n = 27), or non-small cell lung cancer (NSCLC) patients (n = 20). Each point represents a sample from patient, and the red line represents mean across all samples considered. p-values were derived from Brown–Forsythe and Welch analysis of variance (ANOVA) test with Dunnett’s T3 multiple comparisons correction (ns, not significant; ***p < 0.001; ****p < 0.0001). (B) Concentration of cystine measured by liquid chromatography/mass spectrometry (LC/MS) in plasma from an overnight (>9.5 hr) fasted healthy adult and plasma from the same adult ~4 hr after eating (fed).
Additional files
-
Supplementary file 1
Patient sample information.
- https://cdn.elifesciences.org/articles/95652/elife-95652-supp1-v1.xlsx
-
Supplementary file 2
Polar metabolite concentrations and related information.
- https://cdn.elifesciences.org/articles/95652/elife-95652-supp2-v1.xlsx
-
Supplementary file 3
Lipid concentrations and related information.
- https://cdn.elifesciences.org/articles/95652/elife-95652-supp3-v1.xlsx
-
MDAR checklist
- https://cdn.elifesciences.org/articles/95652/elife-95652-mdarchecklist1-v1.pdf
Download links
A two-part list of links to download the article, or parts of the article, in various formats.
Downloads (link to download the article as PDF)
Open citations (links to open the citations from this article in various online reference manager services)
Cite this article (links to download the citations from this article in formats compatible with various reference manager tools)
Metabolite profiling of human renal cell carcinoma reveals tissue-origin dominance in nutrient availability
eLife 13:RP95652.
https://doi.org/10.7554/eLife.95652.3


