Decoupling both local and global abundance from global range size, challenging the abundance-occupancy relationship in birds
- Evolution & Ecology Research Centre, Centre for Ecosystem Science, and School of Biological, Earth and Environmental Sciences, University of New South Wales, Australia
- Theoretical Sciences Visiting Program, Okinawa Institute of Science and Technology Graduate University, Japan
- Department of Wildlife Ecology and Conservation, Fort Lauderdale Research and Education Center, University of Florida, United States
Figures
Figure 1
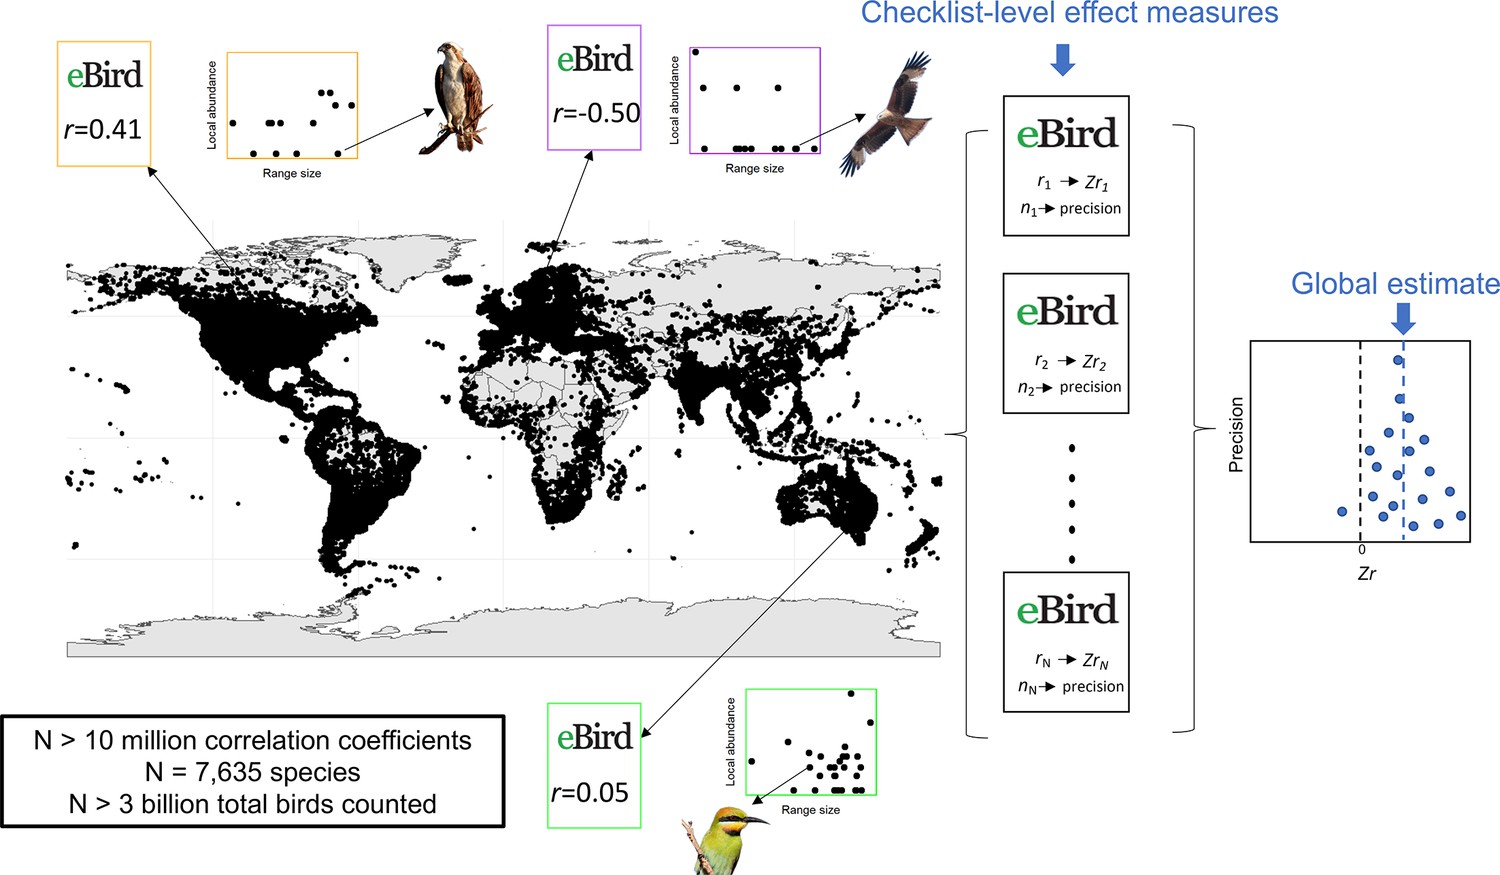
A conceptual overview of our methods.
We aggregated individual eBird checklists across the world (shown on the map), represented by the three coloured insets which show the relationship between global range size (x-axis) and local abundance (y-axis) and the associated correlation value. We then aggregated these checklist level measures for 16,562,995 eBird checklists into the largest-ever meta-analysis to find the global-level relationship between global range size and local abundance.
Figure 2
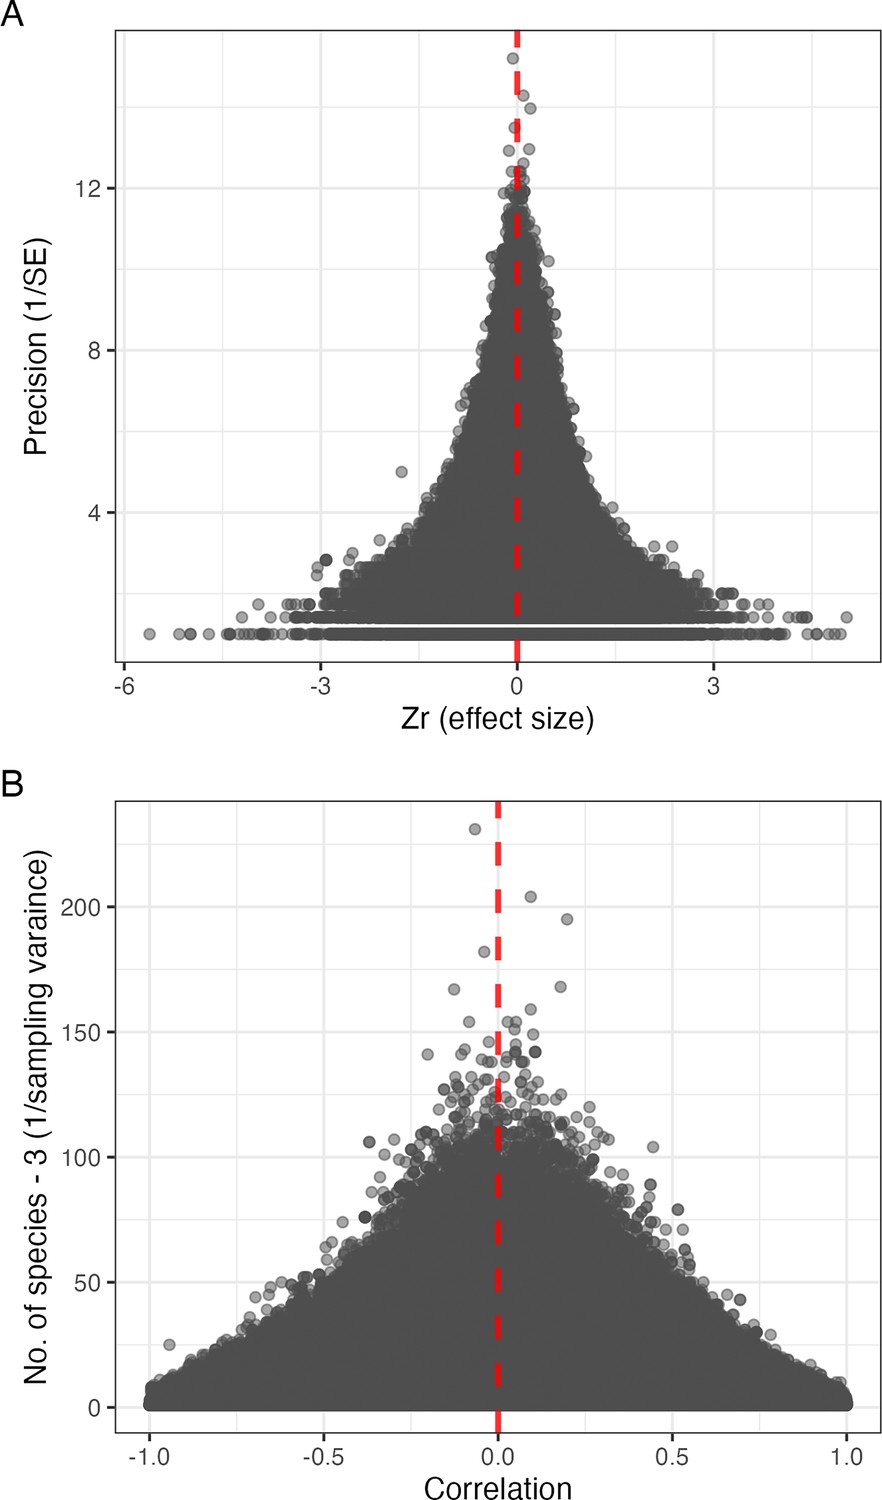
Funnel plots.
(A) The relationship between 16,562,995 effect sizes (Fisher’s; x-axis) and their precision (the square root of the inverse of the sampling variance; y-axis). (B) The relationship between 16,562,995 correlations based on 3,005,668,285 observations of 7635 species (Pearson’s correlation coefficients; x-axis) and the number of species – 3, which is the inverse of the sampling variances for Zr (y-axis). Both plots consist of data points with the red dashed line indicating zero effect.
Figure 3
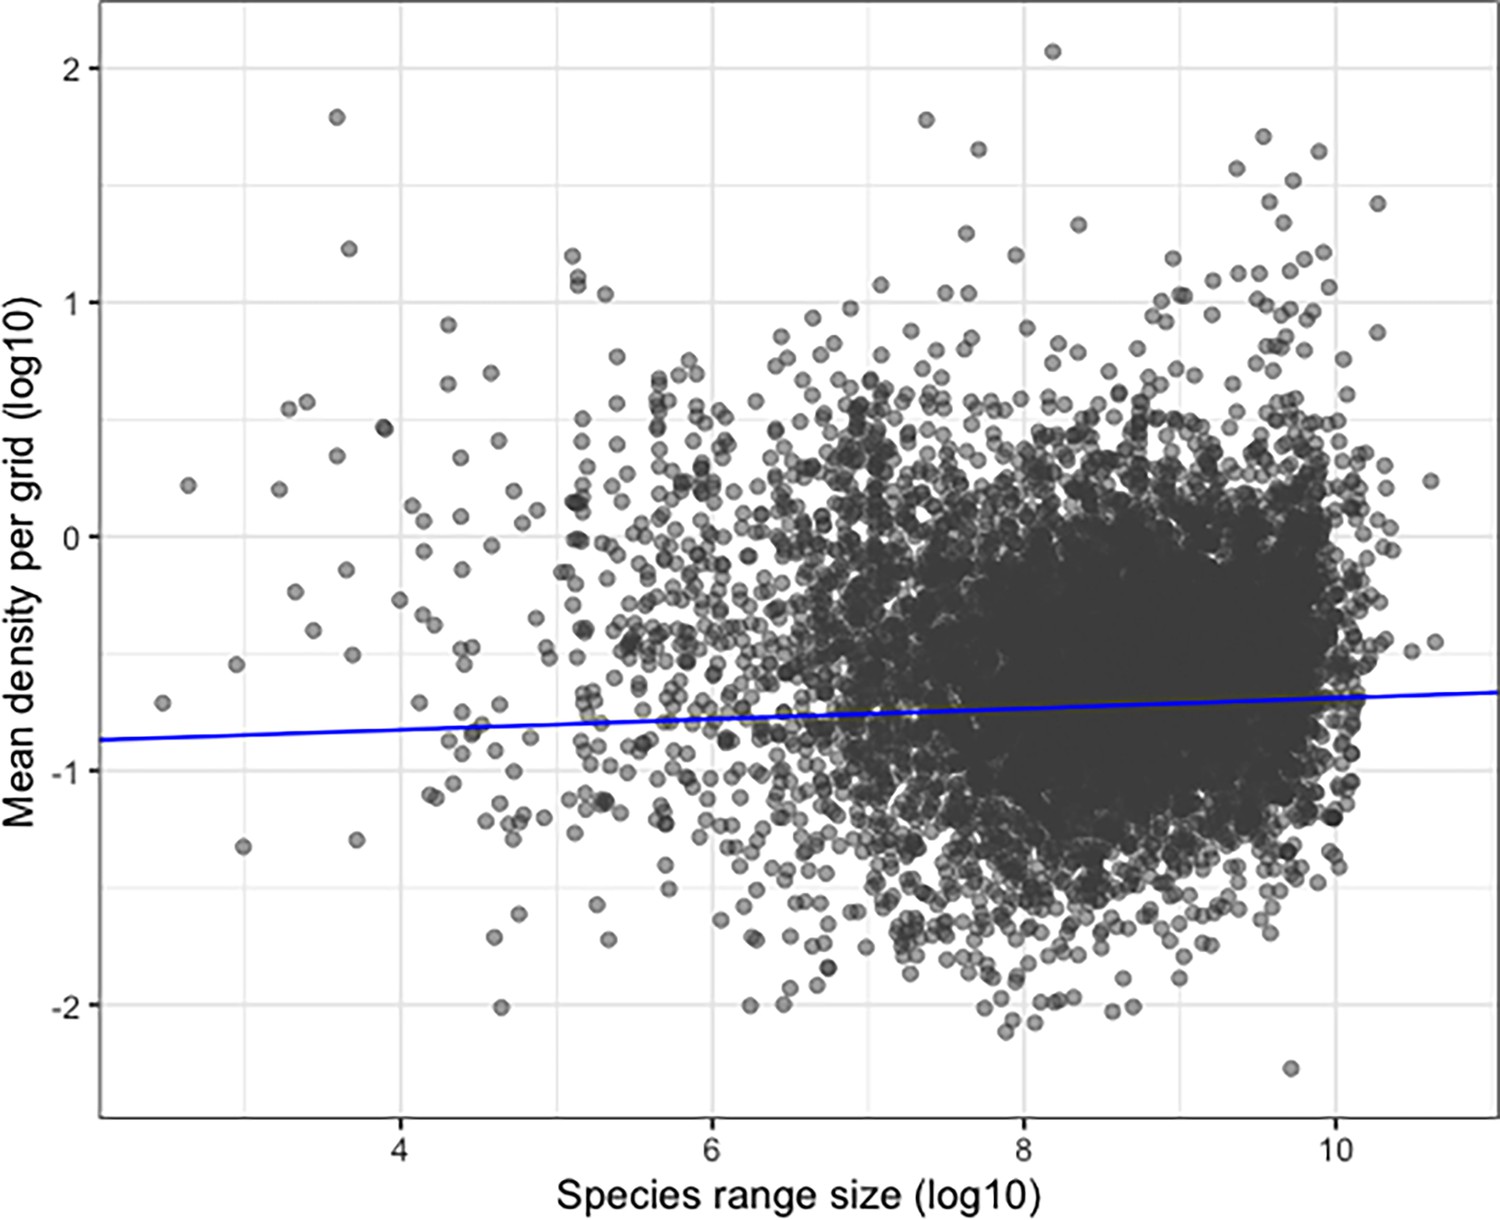
The relationship between species average (mean) density and species range size.
We calculated the mean density of a species in 5-degree grids where species occurred (y-axis), while the species range size (x-axis) was estimated by the sum of the percentage occurrence of the species multiplied by the grid size (km2) across all the 575 grids (7464 species). The blue line indicates an average slope line from phylogenetic comparative models with 100 different posterior phylogenetic trees.
Additional files
-
MDAR checklist
- https://cdn.elifesciences.org/articles/95857/elife-95857-mdarchecklist1-v1.docx
-
Supplementary file 1
Statistical results from meta-analytic models.
- https://cdn.elifesciences.org/articles/95857/elife-95857-supp1-v1.docx
-
Supplementary file 2
Statistical results from comparative analysis.
- https://cdn.elifesciences.org/articles/95857/elife-95857-supp2-v1.docx
-
Supplementary file 3
Mathmatical formulations for meta-analytic models.
- https://cdn.elifesciences.org/articles/95857/elife-95857-supp3-v1.docx
Download links
A two-part list of links to download the article, or parts of the article, in various formats.
Downloads (link to download the article as PDF)
Open citations (links to open the citations from this article in various online reference manager services)
Cite this article (links to download the citations from this article in formats compatible with various reference manager tools)
Decoupling both local and global abundance from global range size, challenging the abundance-occupancy relationship in birds
eLife 13:RP95857.
https://doi.org/10.7554/eLife.95857.3


