RNA polymerase III is involved in regulating Plasmodium falciparum virulence
- Institut Pasteur, Universite Paris Cité, France
- Institut Pasteur, Sorbonne Université Ecole doctorale Complexité du Vivant, France
- Institut Pasteur, Biomedical Center, Division of Physiological Chemistry, Faculty of Medicine, Ludwig-Maximilians-Universität München, Germany
- Institut Pasteur, Laboratory of Pathogen-Host Interaction (LPHI), CNRS, University of Montpellier, France
- Institut Pasteur, Institut Curie, PSL Research University, Centre de Recherche, CurieCoreTech Mass Spectrometry Proteomics, France
- Institut Pasteur, Instituto de Medicina Molecular João Lobo Antunes, Faculdade de Medicina da Universidade de Lisboa, Portugal
- Institut Pasteur, LPHI, MIVEGEC, CNRS, INSERM, University of Montpellier, France
Figures
Figure 1 with 2 supplements
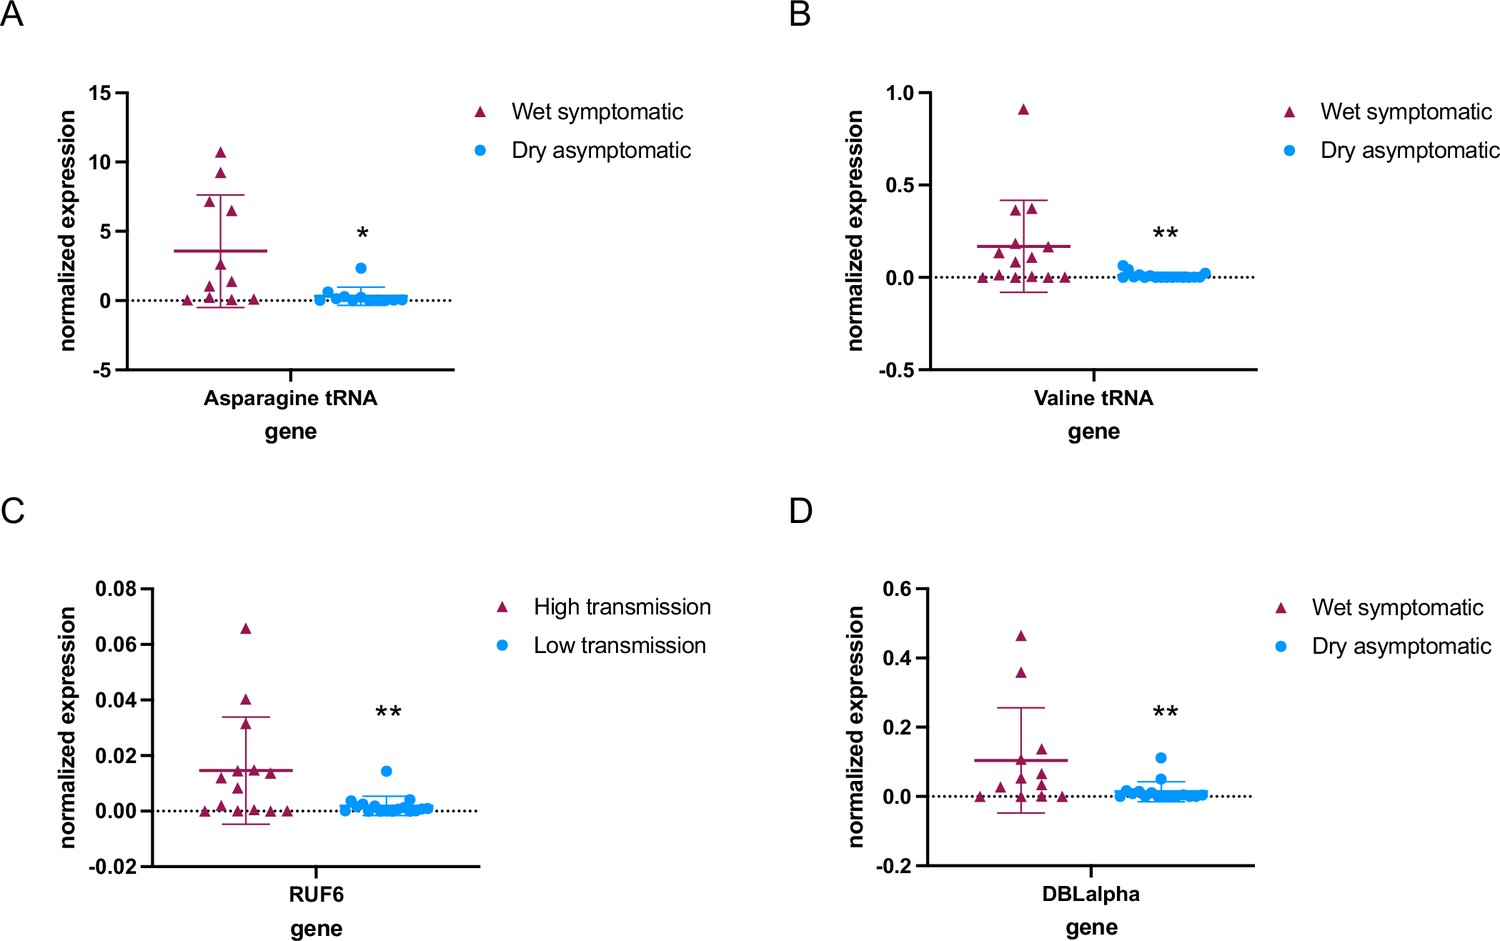
RNA polymerase III (RNA Pol III)-transcribed genes are downregulated in asymptomatic individuals during the dry season.
Steady-state RNA levels as quantified by reverse transcription-quantitative PCR (RT-qPCR) using primers to tRNA Asparagine (Pf3D7_0714700) (A) and tRNA Valine (Pf3D7_0312600) (B) as well as RNA Pol III-transcribed RUF6 ncRNA (C). DBLalpha primers were used to detect RNA Pol II-transcribed var genes (D). Normalized expression is shown using fructose-bisphosphate aldolase (FBA Pf3D7_1444800) as the reference gene in symptomatic individuals during the wet season (n = 14+) and asymptomatic individuals during the dry season (n = 17+). + with the exception of Asparagine tRNA wet symptomatic (n=11) and dry asymptomatic (n=12), and DBLalpha wet symptomatic (n=12) and dry asymptomatic (n=16). Boxplots indicate the mean with standard deviation. Wilcoxon matched-pairs signed rank test was done to determine significance (* indicates p<0.05 and ** indicates p<0.005).
-
Figure 1—source data 1
Reverse transcription-quantitative PCR (RT-qPCR) values used in analysis.
- https://cdn.elifesciences.org/articles/95879/elife-95879-fig1-data1-v1.xlsx
Figure 1—figure supplement 1
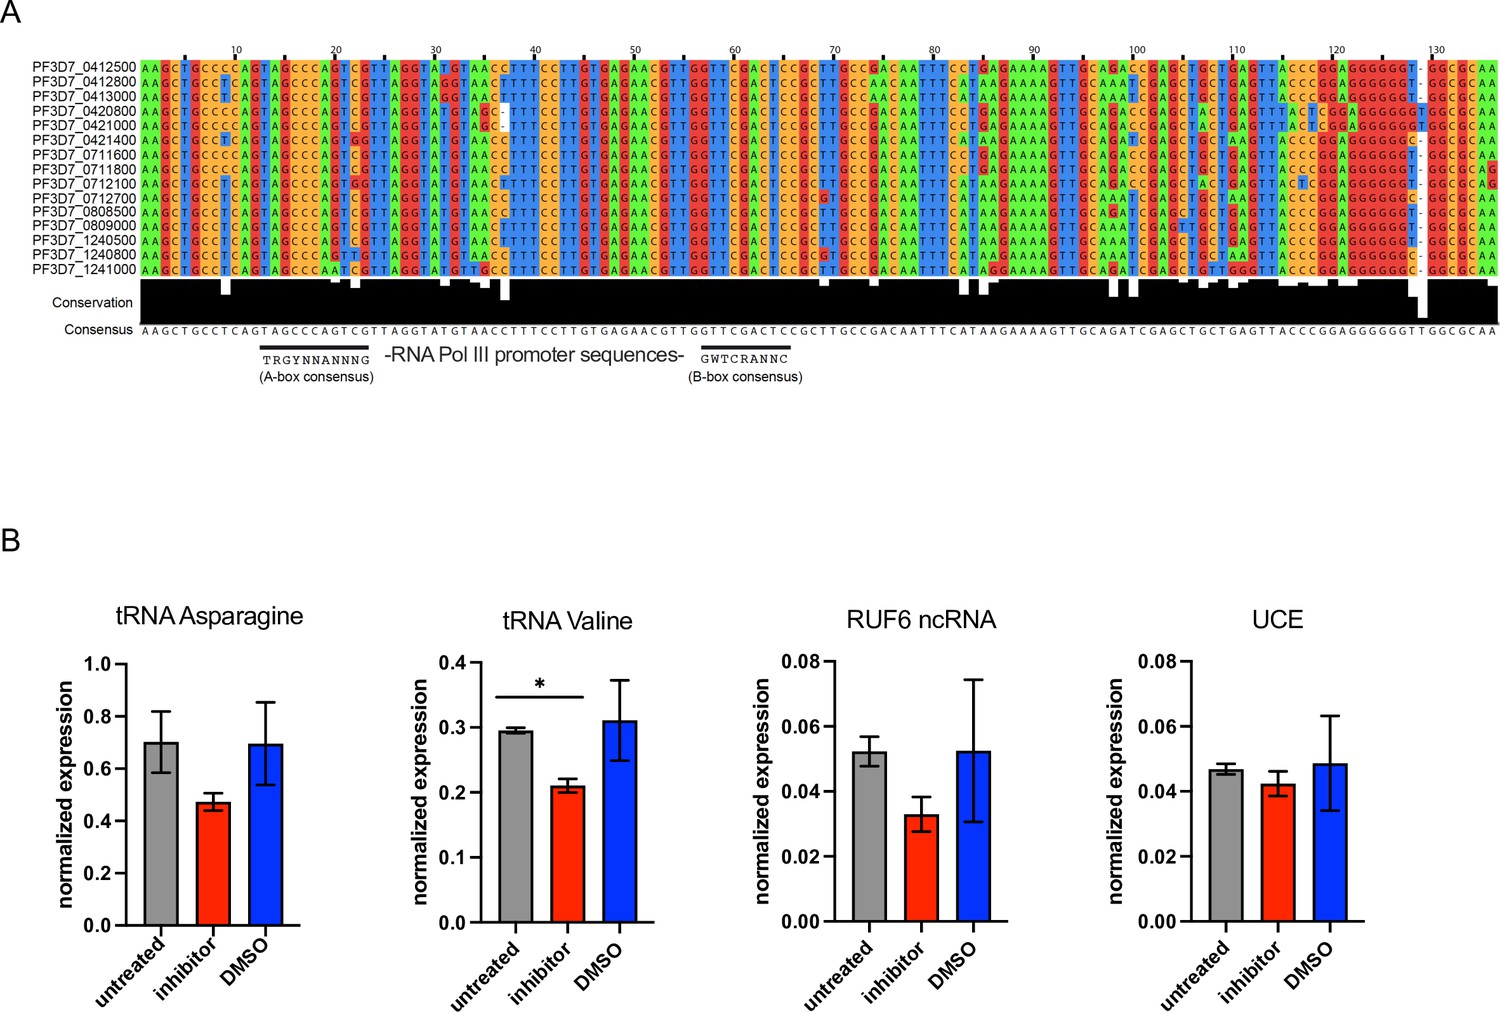
RUF6 is transcribed by RNA polymerase III (RNA Pol III).
(A) Multiple sequence alignment of highly conserved genes encoding GC-rich ncRNA elements. 15 members of RUF6 gene family aligned by Clustal Omega (http://www.ebi.ac.uk) and presented in Jalview (http://www.jalview.org). Degree of conservation per base and consensus sequence are displayed below. Black lines show position of potential A- and B-box consensus motifs (as assessed in Guizetti et al., 2016). (B) Reverse transcription-quantitative PCR (RT-qPCR) shows transcript levels for tRNA Asparagine, tRNA Valine, RUF6 ncRNA, and a housekeeping gene encoding ubiquitin-conjugating enzyme in synchronized wildtype parasites at 24 hpi that were untreated or treated with RNA Pol III inhibitor or DMSO. Transcript levels are normalized to fructose-bisphosphate aldolase (PF3D7_1444800) transcript levels. Mean SEM of two independent experiments are shown. Statistical significance was determined by two-tailed Student’s t-test (*p<0.05).
Figure 1—figure supplement 2

RNA polymerase III (RNA Pol III)-transcribed genes are reduced during dry asymptomatic cases.
(A) tRNA Leucine (Pf3D7_API05400) and tRNA Asparagine (Pf3D7_API05500) transcripts identified by RNA-seq analysis from Andrade et al., 2020, for wet symptomatic (n=12) and dry asymptomatic (n=12) individuals. Statistical significance was determined by two-tailed Student’s t-test (*p<0.05).
Figure 2 with 2 supplements
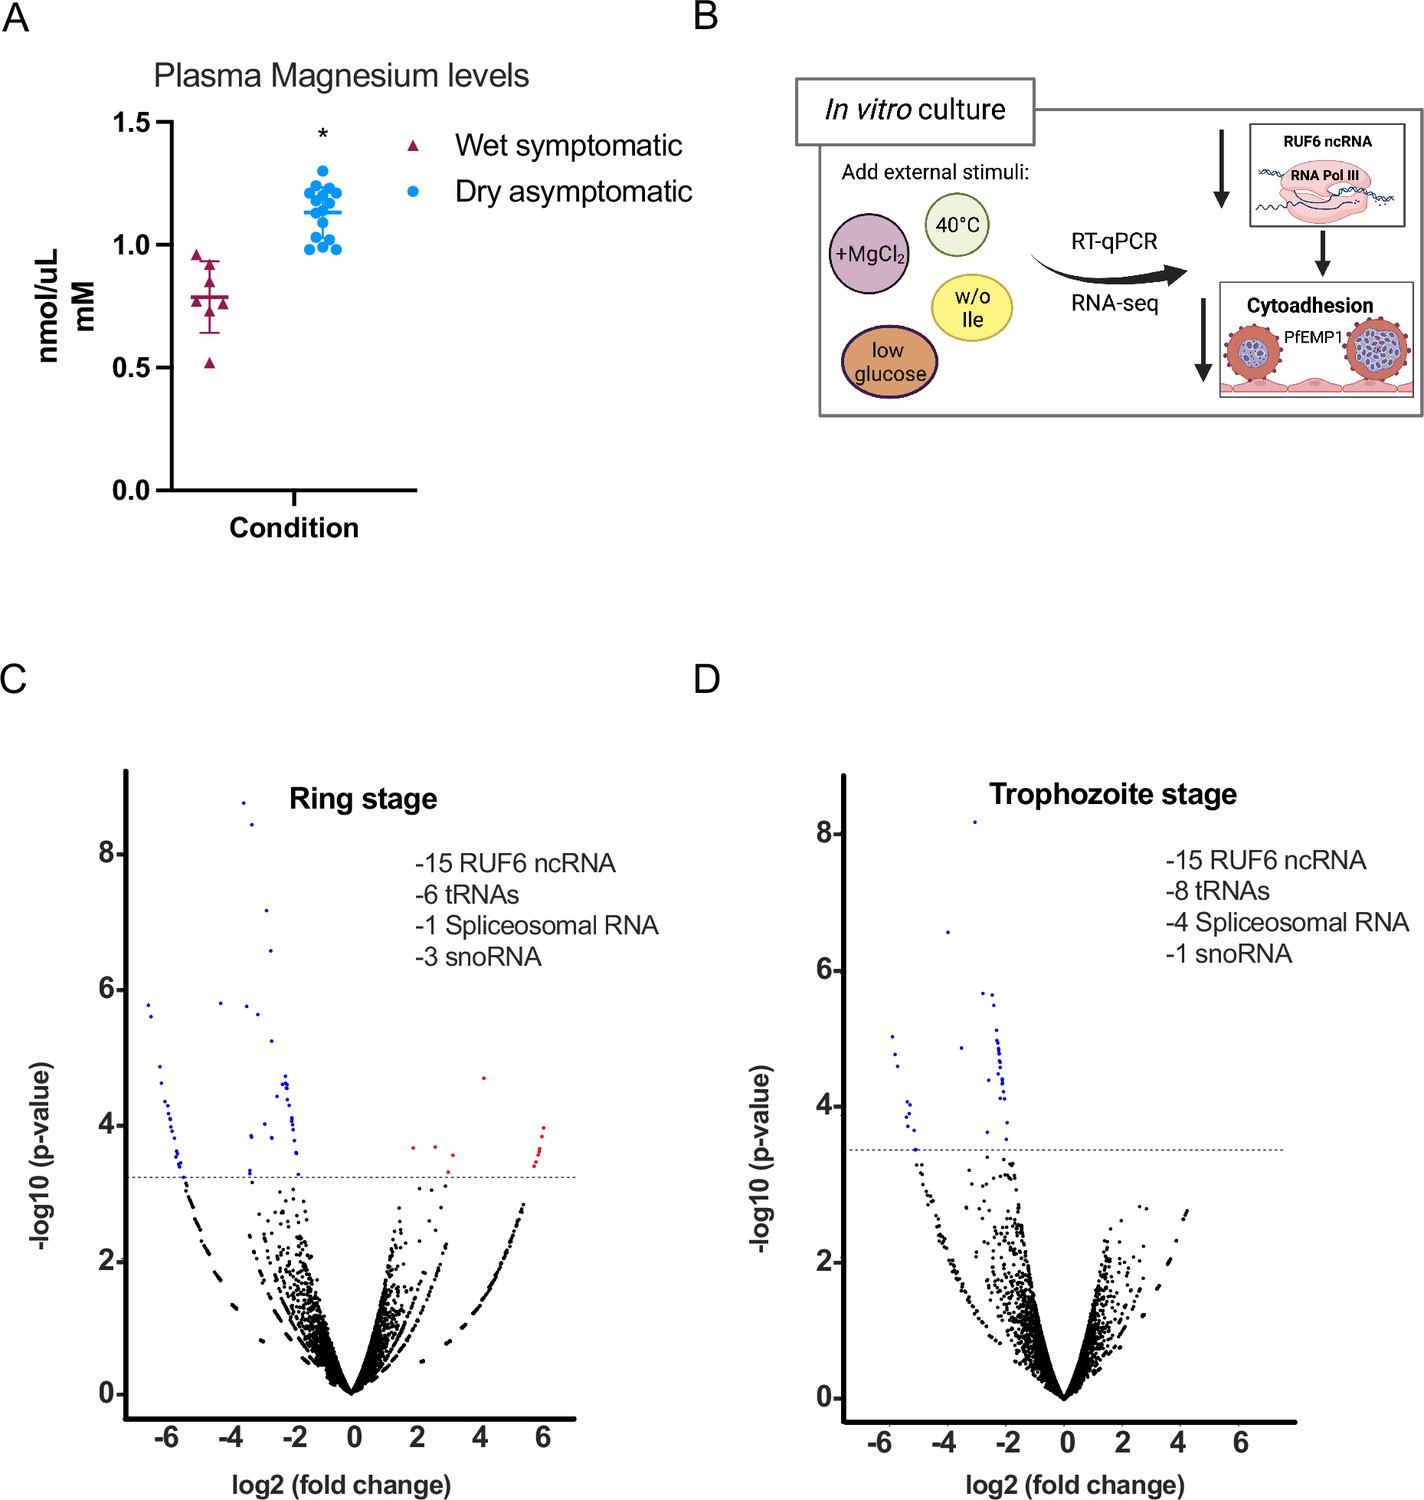
External factors modulate RNA polymerase III (RNA Pol III)-transcribed genes.
(A) Plasma magnesium levels are significantly increased in asymptomatic individuals during the dry season compared to symptomatic individuals during the wet season. Concentration is shown in nmol/μL (mM). (B) Schematic showing underlying molecular mechanism summary using in vitro cultured P. falciparum. (C, D) Volcano plot showing log2(fold-change, FC) against −log10 (p-value) of transcripts identified by RNA-seq analysis of 3D7 control and addition of MgCl2 harvested during ring (C) and trophozoite stages (D). Expressed transcripts from three replicates between control and addition of MgCl2 that are significantly upregulated are highlighted in red while significantly downregulated RNA Pol III genes are highlighted in blue (FDR corrected p-value of <0.05 and an FC ≥± 1.95) with examples listed as text. Black dots indicate non-significant transcripts with an FC ≤ 2.0.
-
Figure 2—source data 1
RNA-seq analysis for control and MgCl2 supplemented cultured parasites.
- https://cdn.elifesciences.org/articles/95879/elife-95879-fig2-data1-v1.xlsx
Figure 2—figure supplement 1

RNA polymerase III (RNA Pol III)-transcribed genes are reduced in response to external factors.
Transcript levels as quantified by reverse transcription-quantitative PCR (RT-qPCR) on 3D7 parasites harvested during late ring stage for control parasites, parasites in the absence of isoleucine (w/o Ile), at 40°C, at low glucose levels (0.5 mg/mL), and presence of additional MgCl2 ([3 mM] total). Primers were used for Pol II-transcribed ubiquitin-conjugating enzyme (UCE Pf3D7_0812600), Pol I-transcribed rRNA A1, Pol III-transcribed RUF6 ncRNA, Pol III-transcribed tRNA Valine (Pf3D7_0312600), and Pol II-transcribed active var gene (Pf3D7_1240900). Results are normalized to an RNA Pol II-transcribed reference gene FBA (Pf3D7_1444800) and presented as fold-change/control. Error bars are displayed from three biological replicates. Statistical significance was determined by two-tailed Student’s t-test (*p<0.05).
Figure 2—figure supplement 2
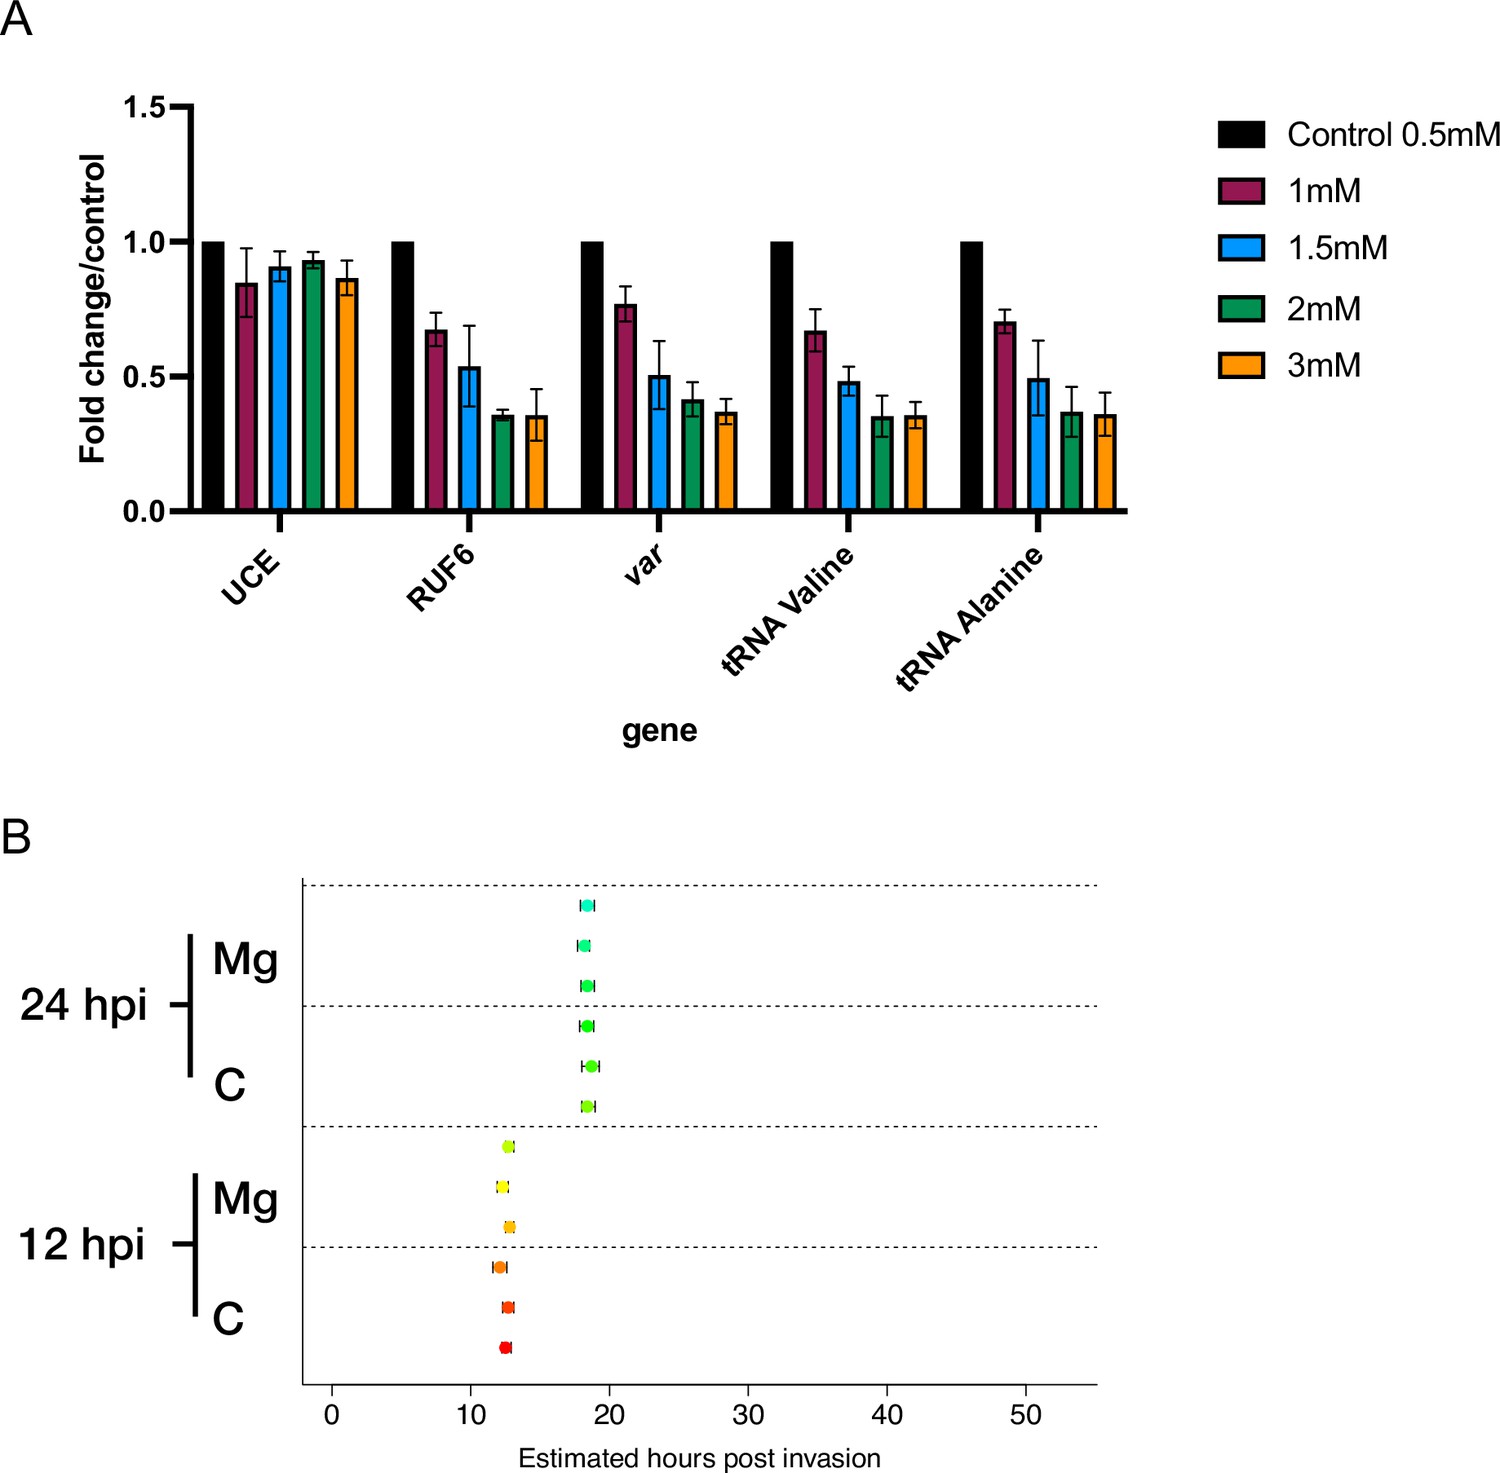
RNA polymerase III (RNA Pol III)-transcribed genes are reduced in response to increasing MgCl2 supplementation concentrations.
(A) Transcript levels as quantified by reverse transcription-quantitative PCR (RT-qPCR) on 3D7 parasites harvested during late ring stage for control parasites and parasites in the presence of additional MgCl2 levels ([1 mM], [1.5 mM], [2 mM], and [3 mM] total). Primers were used for Pol II-transcribed ubiquitin-conjugating enzyme (UCE Pf3D7_0812600), Pol III-transcribed RUF6 ncRNA, Pol III-transcribed tRNA Valine (Pf3D7_0312600) and Alanine (PF3D7_0411500), and Pol II-transcribed var DBLalpha. Results are normalized to an RNA Pol II-transcribed reference gene FBA (Pf3D7_1444800) and presented as fold-change/control. Error bars are displayed from three biological replicates. (B) Cell cycle progression estimation of a wildtype 3D7 clone in the absence (‘C’) or presence (‘Mg’) of MgCl2 supplementation. RNA-seq data from synchronized parasites harvested at 12 and 24 hpi were compared to microarray data (from Bozdech et al., 2003, as in Lemieux et al., 2009). Replicates are represented with circles.
Figure 3 with 1 supplement
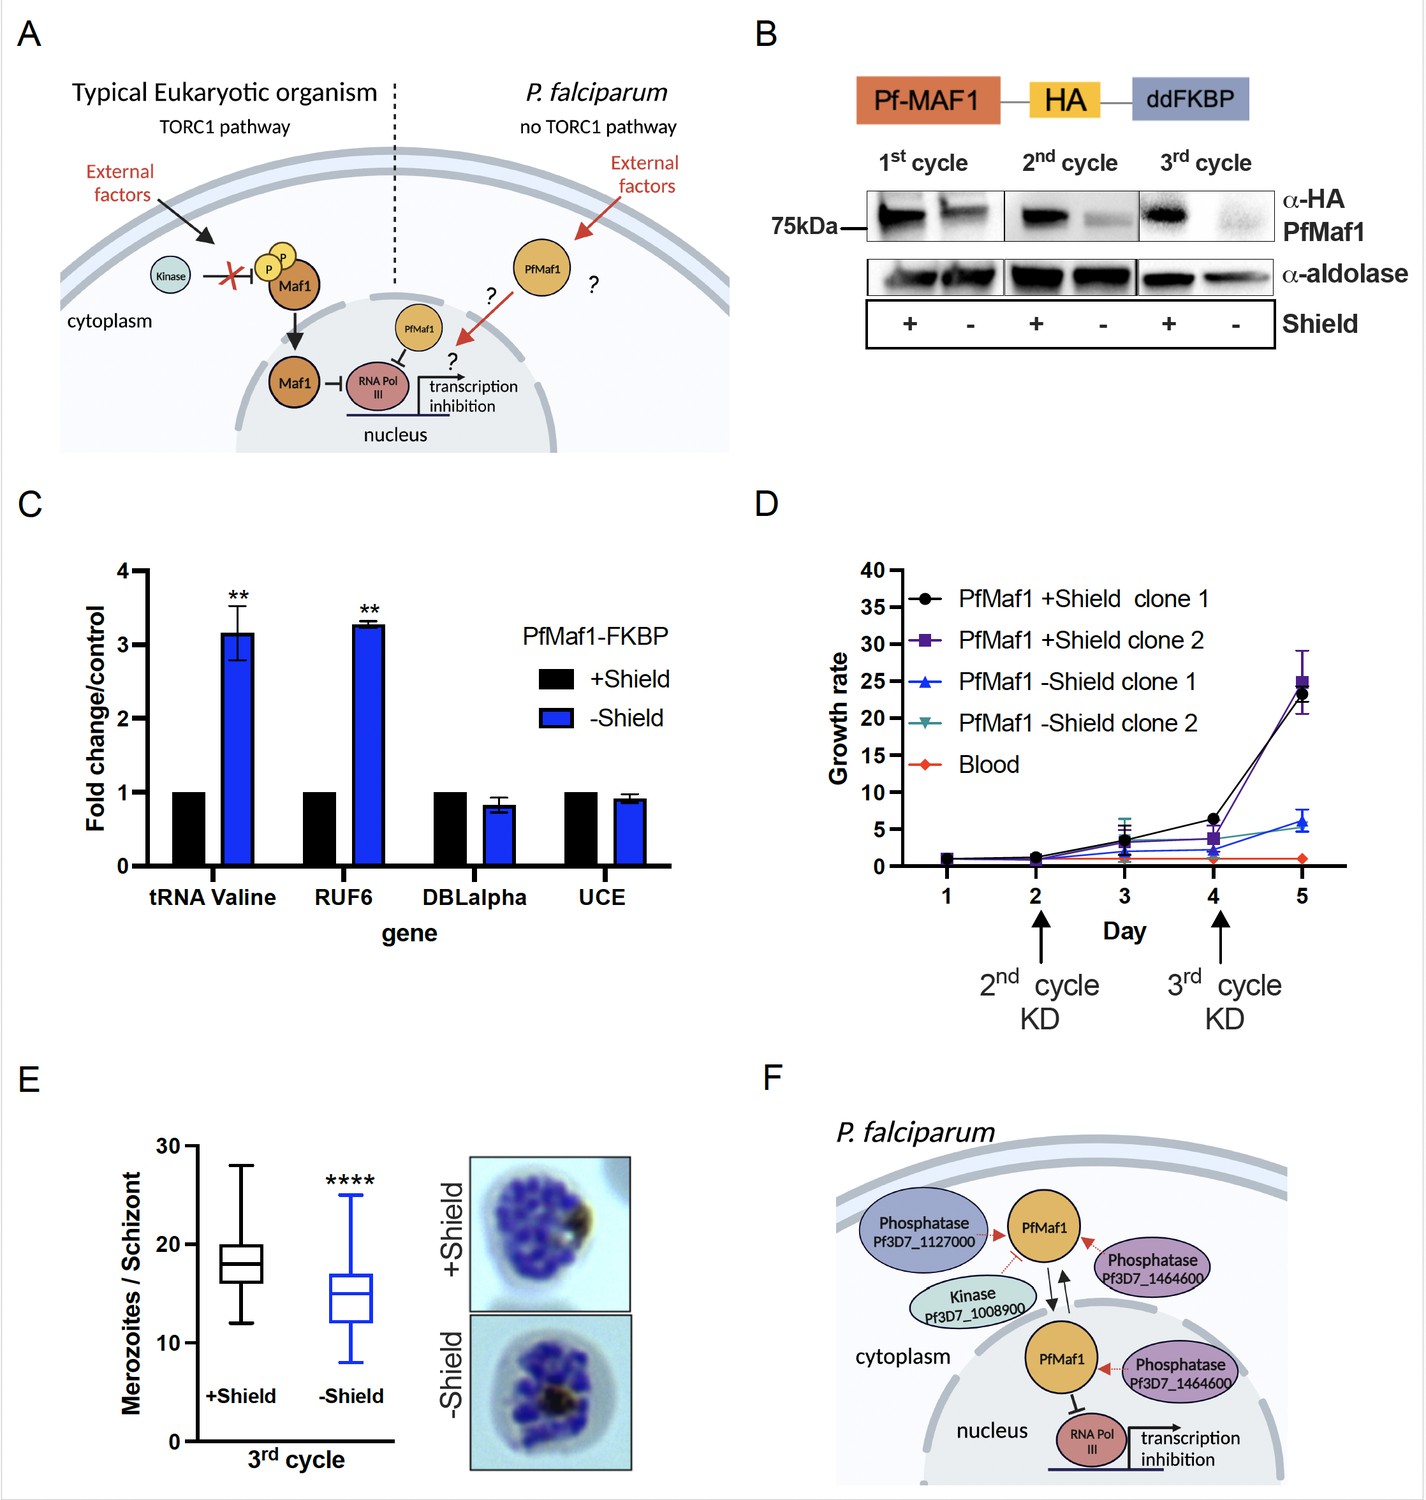
Nuclear PfMaf1 is essential to regulate RNA polymerase III (RNA Pol III).
(A) Illustration of the TORC1-dependent cellular localization of Maf1 protein in unfavorable conditions in typical eukaryotic organisms compared to P. falciparum that has no TORC1 pathway. (B, top) Illustration of recombinant PfMaf1 with a 3HA tag followed by a ddFKBP domain to allow for knockdown studies. (B, bottom) Western blot analysis for PfMaf1 in total extracts in pSLI-Maf1-FKBP transfected parasites at 24 hpi after 1, 2, and 3 cycles without addition of Shield-1 (−) and control, with addition of Shield-1 (+). Aldolase levels are also shown. Representative of three replicates. (C) Transcript levels as quantified by reverse transcription-quantitative PCR (RT-qPCR) using the same primers in Figure 2B in parasites harvested at 18 hpi in control group and without Shield for 2 cycles. Error bars are displayed from three biological replicates. Statistical significance was determined by two-tailed Student’s t-test (**p<0.005). (D) Growth curve over 5 days of clonal pSLI-Maf1-FKBP parasites for two conditions: in the presence or absence of Shield-1. Uninfected red blood cells (‘blood’ in red) serve as reference of background. Error bars indicate standard deviation of three technical replicates in different blood from two different clones (n=6). (E) Data is represented as box-whisker plot of mean merozoite number per schizont ± SD (Mann-Whitney), with the median represented at the center line. Boxplots show the data of 100 segmented schizonts counted per condition (n=100). Statistical significance was determined by two-tailed Student’s t-test (***p<0.001). Representative Giemsa images are shown to the right for + and – Shield. (F) Visual representation of co-immunoprecipitation followed by quantitative mass spectrometry (Co-IP MS) analysis of cytoplasmic and nuclear PfMaf1. Labeled proteins represent important significant and unique proteins in cytoplasmic and nuclear fractions not found in either of the controls.
-
Figure 3—source data 1
Western blot analysis shows PfMaf1 is depleted after 1 and 3 cycles without Shield-1 drug added.
- https://cdn.elifesciences.org/articles/95879/elife-95879-fig3-data1-v1.pdf
-
Figure 3—source data 2
Western blot analysis shows PfMaf1 is depleted after 2 cycles without Shield-1 drug added.
- https://cdn.elifesciences.org/articles/95879/elife-95879-fig3-data2-v1.pdf
-
Figure 3—source data 3
Co-immunoprecipitation followed by quantitative mass spectrometry (Co-IP MS) analysis for cytoplasmic and nuclear PfMaf1-binding proteins.
- https://cdn.elifesciences.org/articles/95879/elife-95879-fig3-data3-v1.xls
Figure 3—figure supplement 1
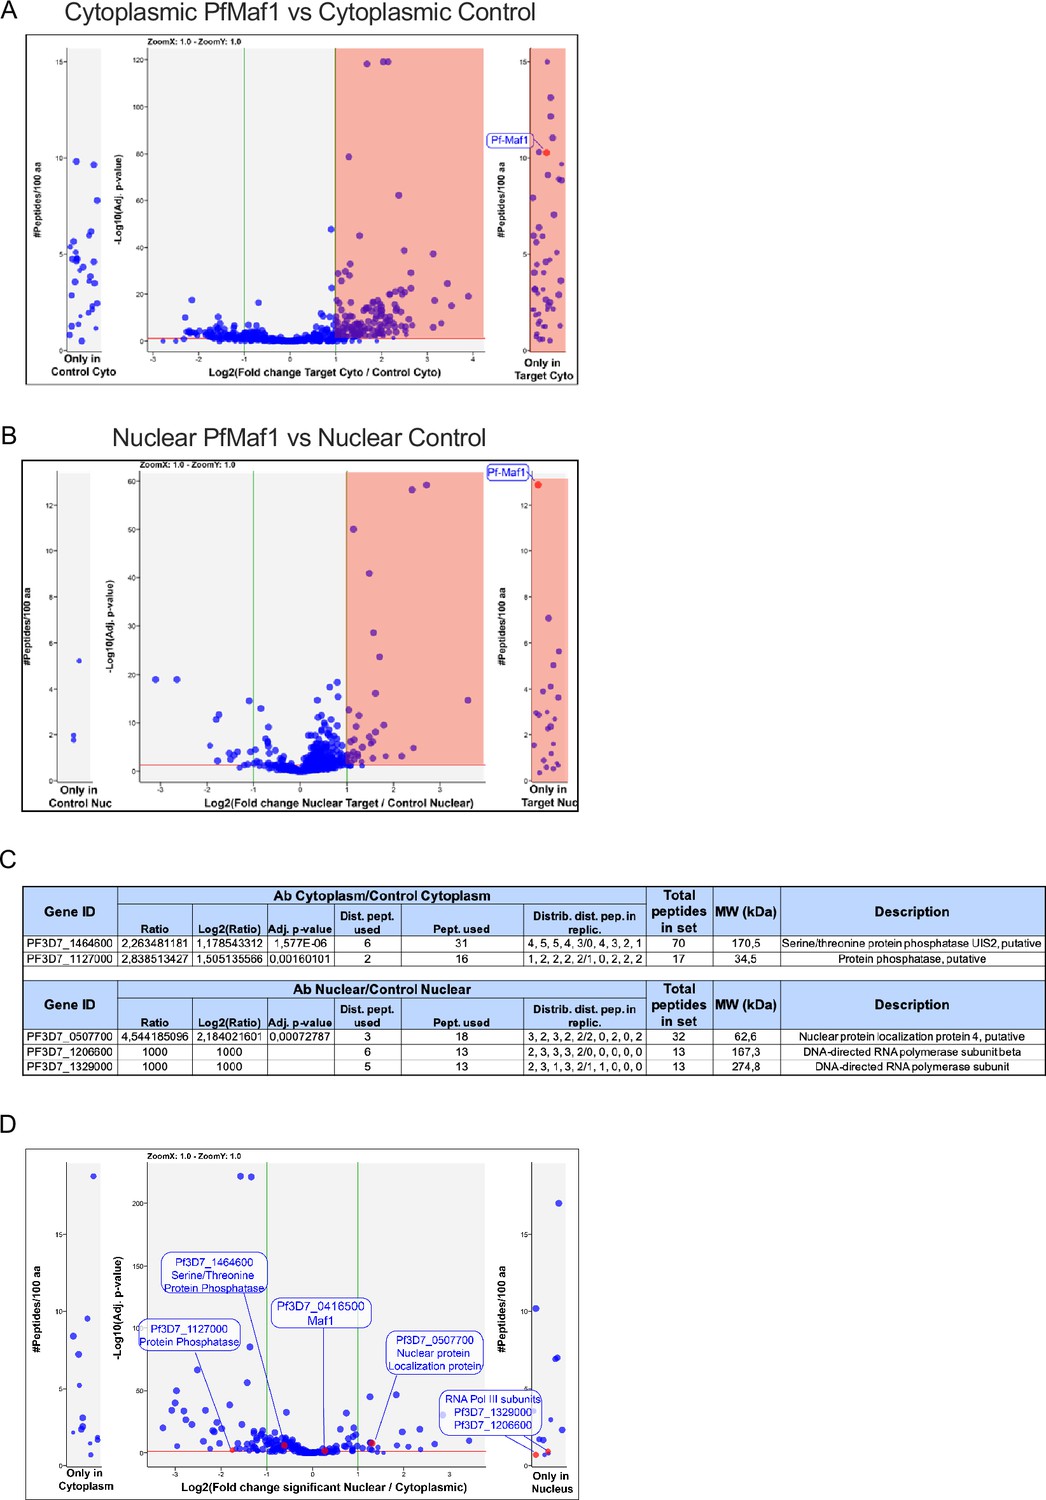
PfMaf1 cytoplasmic and nuclear interactome.
Co-immunoprecipitation followed by quantitative mass spectrometry (Co-IP MS) volcano plot of enrichment for all five replicates for cytoplasmic (A) and nuclear (B) PfMaf1 vs control proteins are indicated and labeled. Each dot represents a protein, and its size corresponds to the sum of peptides from both conditions used to quantify the ratio of enrichment. x-axis = log2(fold-change), y-axis = −log10(p-value), horizontal red line indicates adjusted p-value=0.05, and vertical green lines indicate absolute fold-change=2.0. Side panels indicate proteins uniquely identified in either sample (y-axis=number of peptides per 100 amino acids) with a minimum of two distinct peptides in three replicates of a same state. (C) Table showing values for significantly and uniquely enriched proteins from both extracts as labeled in Figure 3F. (D) Volcano plot showing the distribution of significant and unique proteins in cytoplasmic and nuclear fractions not found in either of the controls. Each dot represents a protein, and its size corresponds to the sum of peptides from both conditions used to quantify the ratio of enrichment. x-axis = log2(fold-change), y-axis = −log10(p-value), horizontal red line indicates adjusted p-value=0.05, and vertical green lines indicate absolute fold-change=2.0. Side panels indicate proteins uniquely identified in either sample (y-axis=number of peptides per 100 amino acids) with a minimum of two distinct peptides in three replicates of a same state.
Figure 4 with 1 supplement
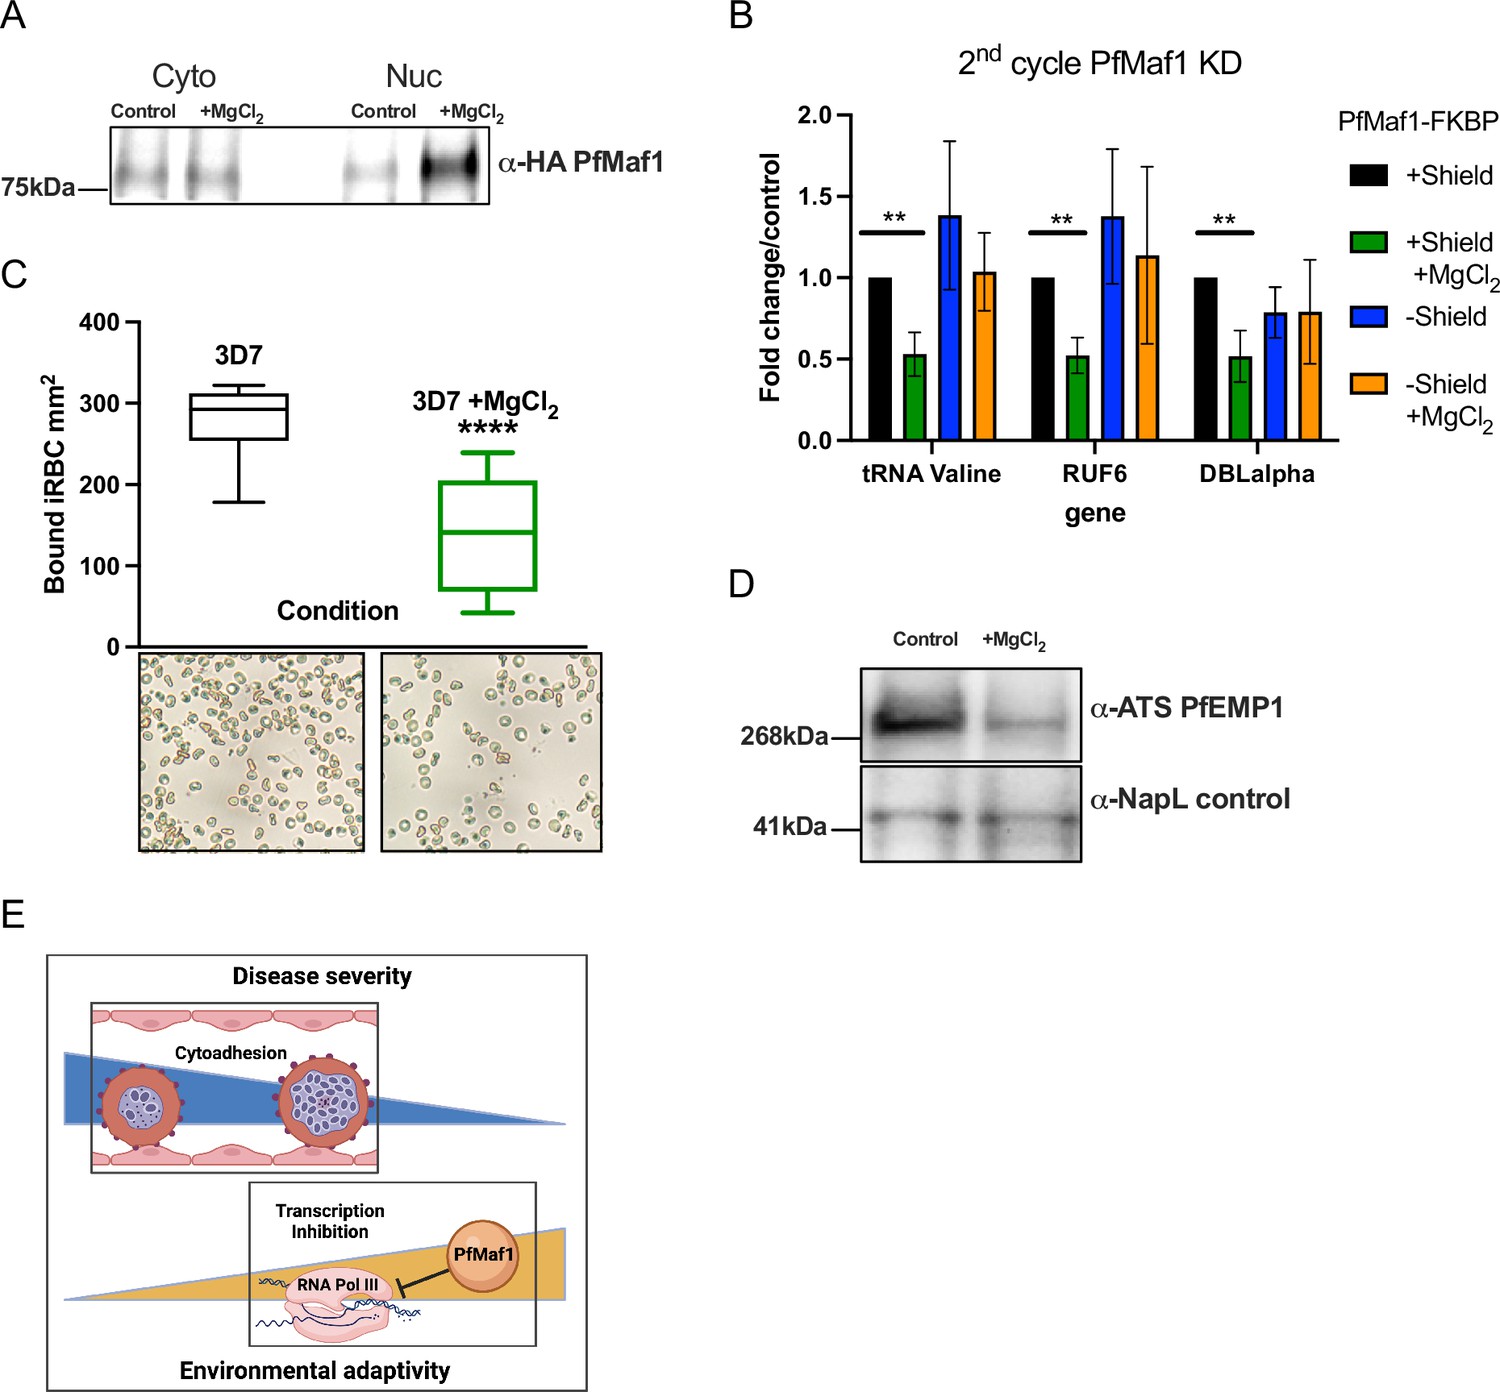
External factors modulate virulence through PfMaf1-regulated RNA polymerase III (RNA Pol III) inhibition.
(A) Immunoprecipitation western blot analysis for cytoplasmic and nuclear extracts for PfMaf1 expression in PfMaf1-FKBP transfected parasites with addition of MgCl2 ([3 mM] total) and control parasites harvested at 18 hpi. Controls are shown in B. (B) Transcript levels as quantified by reverse transcription-quantitative PCR (RT-qPCR) using primers to tRNA Valine (Pf3D7_0312600), RUF6 ncRNA, var DBLalpha, and normalized to FBA (Pf3D7_1444800) for four conditions: control (black), addition of MgCl2 (green), knockdown (KD) of PfMaf1 (blue), and KD of PfMaf1 and addition of MgCl2 (orange). Error bars are displayed from three biological replicates. Statistical significance was determined by two-tailed Student’s t-test (**p<0.005). (C) Cytoadhesion binding assay data is represented as box-whisker plot of mean number of bound infected red blood cell (iRBC) ± SD (Mann-Whitney) mm2, with the median represented at the center line. Boxplots show the data of three biological replicates (n=3). Statistical significance was determined by two-tailed Student’s t-test (****p<0.001). Representative images are shown below for 3D7 and 3D7 +MgCl2. (D) Western blot analysis for extracts for ATS-PfEMP1 expression in 3D7 control parasites and with addition of MgCl2 ([3 mM] total) harvested after plasmion. NapL control levels are also shown. Representative of three replicates. (E) Schematic showing summary of study linking decreased cytoadherence, associated with disease severity, with increased RNA Pol III inhibition, triggered in response to external factors.
-
Figure 4—source data 1
Immunoprecipitation followed by western blot analysis shows nuclear PfMaf1 levels increase with MgCl2 supplementation.
- https://cdn.elifesciences.org/articles/95879/elife-95879-fig4-data1-v1.pdf
-
Figure 4—source data 2
Western blot analysis shows decreased PfEMP1 expression with MgCl2 supplementation.
- https://cdn.elifesciences.org/articles/95879/elife-95879-fig4-data2-v1.pdf
Figure 4—figure supplement 1
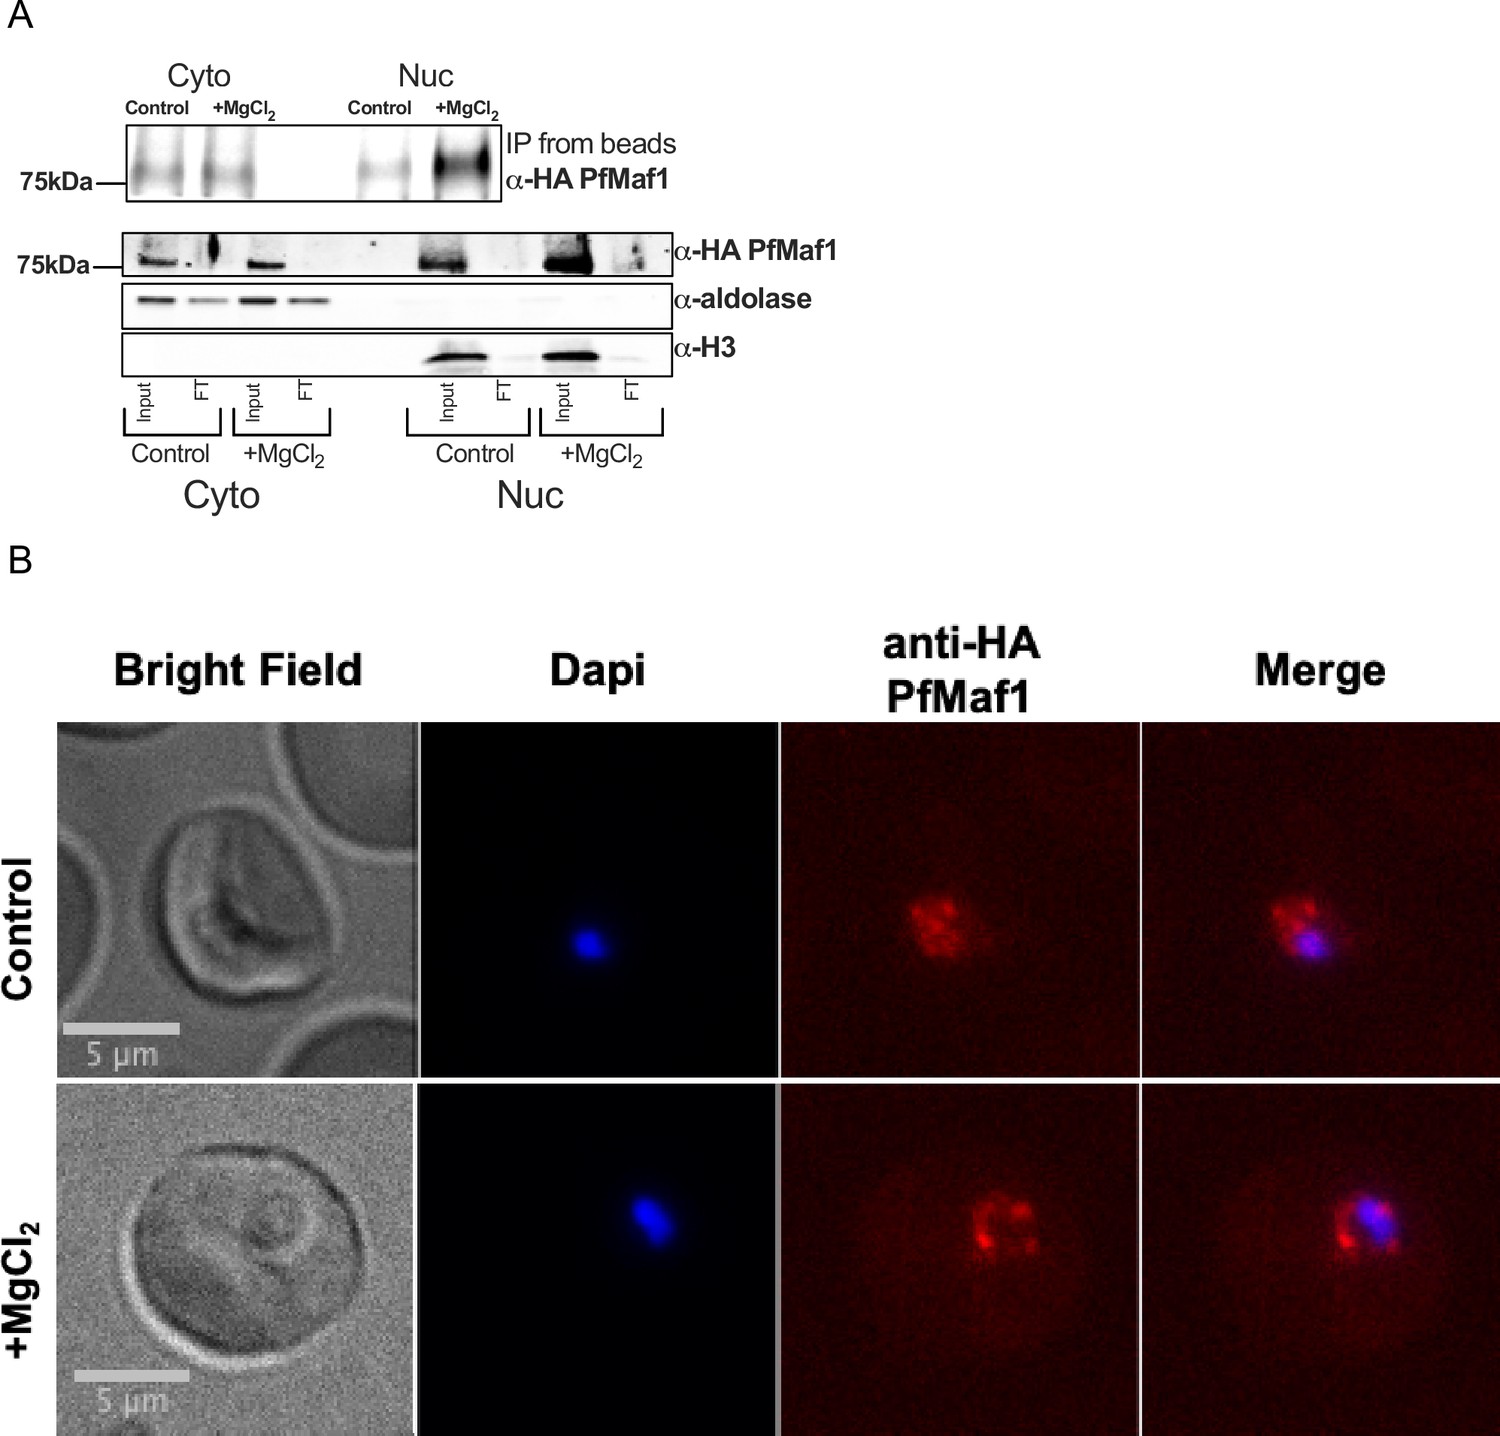
MgCl2 supplementation increases nuclear PfMaf1 levels.
(A) Immunoprecipitation western blot analysis for cytoplasmic and nuclear extracts for PfMaf1 expression in PfMaf1-FKBP transfected parasites with addition of MgCl2 ([3 mM] total) and control parasites harvested at 18 hpi from Figure 4A. Anti-HA PfMaf1, aldolase, and histone H3 are shown from input and flow-through (FT). (B) Representative immunofluorescence images show brightfield, Dapi, anti-HA PfMaf1, and Dapi-HA merge for PfMaf1 in control and addition of MgCl2 ([3 mM] total) in parasites harvested and fixed at late ring stage.
Additional files
-
Supplementary file 1
Quantitative PCR (qPCR) analysis primer pairs.
Primer pairs used are listed including the forward and reverse sequences.
- https://cdn.elifesciences.org/articles/95879/elife-95879-supp1-v1.docx
-
Supplementary file 2
Samples used for plasma magnesium concentration assay.
Age and sex are indicated for each sample as well as the month each sample was from. Green highlight shows magnesium concentration and purple highlight shows which samples were also used for reverse transcription-quantitative PCR (RT-qPCR) analysis in Figure 1.
- https://cdn.elifesciences.org/articles/95879/elife-95879-supp2-v1.xlsx
-
MDAR checklist
- https://cdn.elifesciences.org/articles/95879/elife-95879-mdarchecklist1-v1.pdf
Download links
A two-part list of links to download the article, or parts of the article, in various formats.
Downloads (link to download the article as PDF)
Open citations (links to open the citations from this article in various online reference manager services)
Cite this article (links to download the citations from this article in formats compatible with various reference manager tools)
RNA polymerase III is involved in regulating Plasmodium falciparum virulence
eLife 13:RP95879.
https://doi.org/10.7554/eLife.95879.3


