TMC7 deficiency causes acrosome biogenesis defects and male infertility in mice
- Key Laboratory of Experimental Teratology, Ministry of Education, Department of Cell Biology, School of Basic Medical Sciences, Shandong University, China
- Advanced Medical Research Institute, Shandong University, China
- Center for Reproductive Medicine, Shandong University, China
- CUHK-SDU Joint Laboratory on Reproductive Genetics, School of Biomedical Sciences, The Chinese University of Hong Kong, China
- State Key Laboratory of Stem Cell and Reproductive Biology, Institute of Zoology, Chinese Academy of Sciences, China
Figures
Figure 1 with 1 supplement
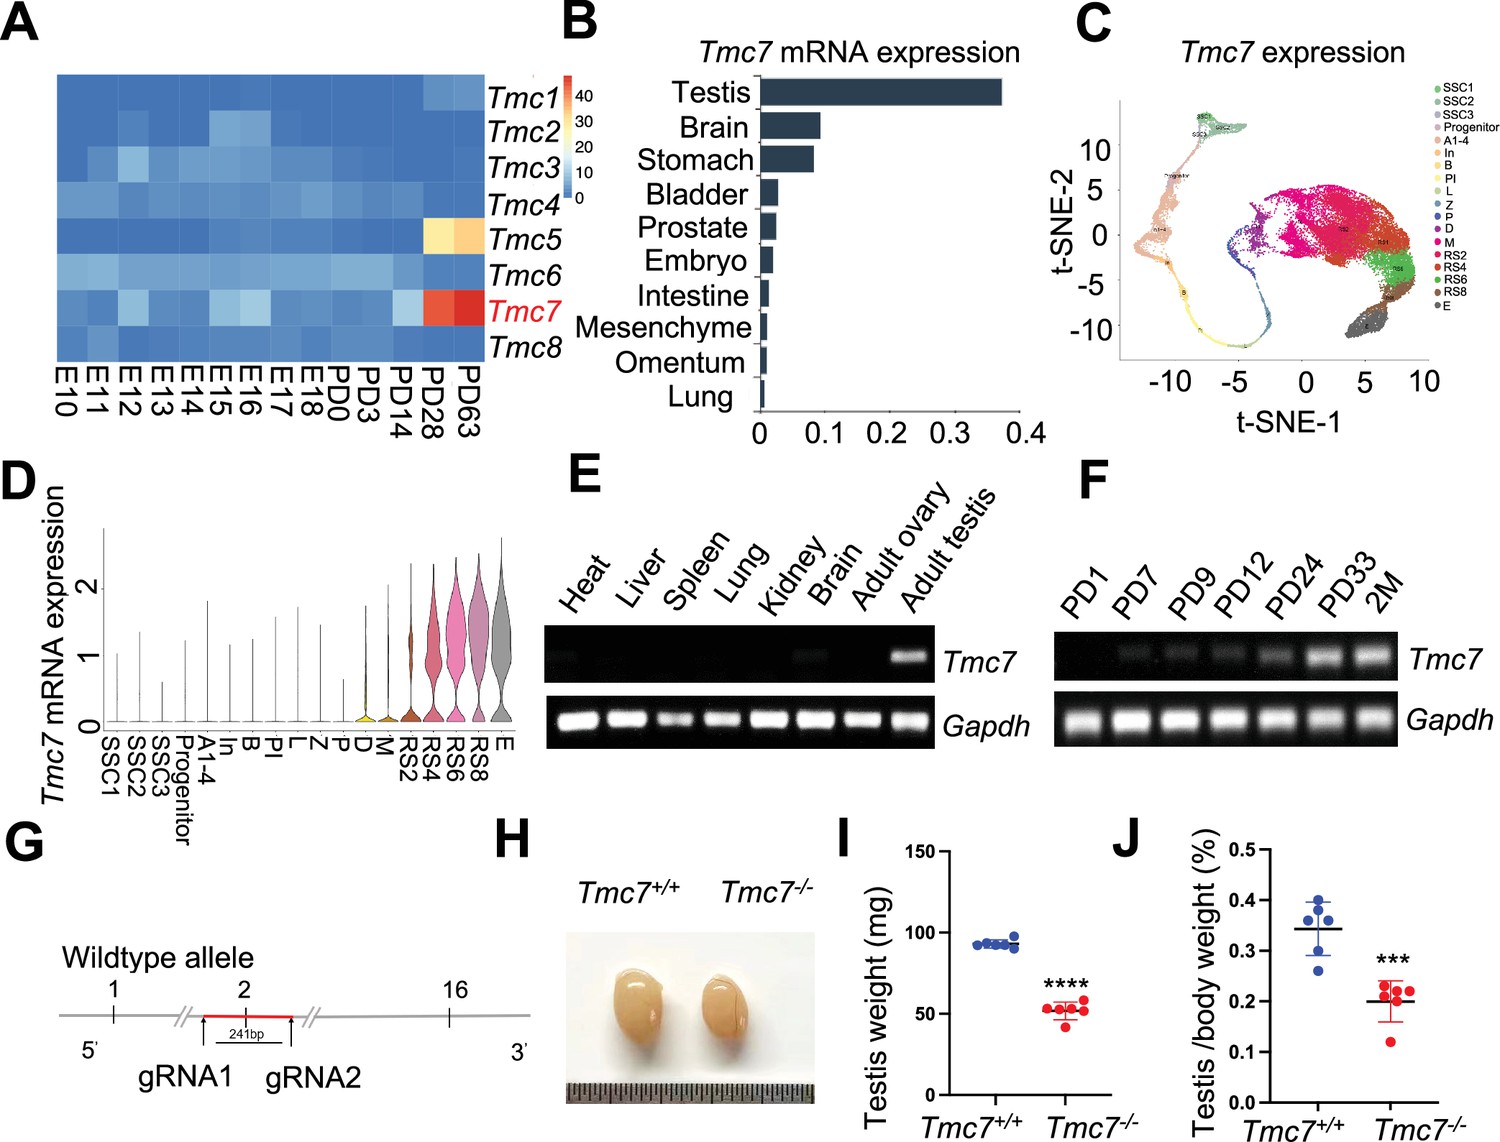
Tmc7 expression is confined to the testis, and its deletion leads to male infertility.
(A) Heatmap analysis of the expression of Tmc family members at embryonic day (E) 10–E18 and different postnatal days (P0, P3, PD14, PD28, and PD63) in mouse testis using the Evo-devo mammalian organ database (http://apps.Kaessmannlab.org/evodevoapp/). (B) The analysis of Tmc7 expression in different tissues using the Mouse Cell Atlas database (https://bis.zju.edu.cn/MCA/). (C, D) t-Distributed Stochastic Neighbor Embedding (t-SNE) plot and violin plot showing the expression of Tmc7 in different mouse germ cells using the Male Health Atlas (http://malehealthatlas.cn/). SSC1-3: spermatogonial stem cells I–III; Progenitor: spermatogonia progenitor cell; A1–4: A1–4 spermatogonia; In: intermediate spermatogonia; B: type B spermatogonia; PI: preleptotene; L: leptotene; Z: zygotene; P: pachytene; D: diplotene; M: metaphase; RS: round spermatid. E: elongating spermatid. (E) The expression of Tmc7 in different adult mouse tissues was measured by RT-PCR, including the heart, liver, spleen, lung, kidney, brain, ovary, and testis. Gapdh was used as the control. (F) The expression of Tmc7 at different postnatal times (PD1, PD7, PD9, PD12, PD24, PD33, and 2 months) was measured by RT-PCR. Gapdh was used as the control. (G) Schematic illustrating the generation of Tmc7−/− mice using CRISPR/Cas9. (H) Testis from 9-week-old WT and Tmc7−/− mice. (I) Testicular weights of 9-week-old WT and Tmc7−/− mice. Six adult mice of each genotype were used. (J) Testis/body weight ratio of 9-week-old WT and Tmc7−/− mice. Six mice of each genotype were used. Images are representative of at least three independent experiments. The results are presented as the mean ± S.D., and two-sided unpaired Student’s t-tests were used to calculate the p-values (*p<0.05, **p<0.01, ***p<0.001).
-
Figure 1—source data 1
Uncropped and labeled gels for Figure 1.
- https://cdn.elifesciences.org/articles/95888/elife-95888-fig1-data1-v1.zip
Figure 1—figure supplement 1
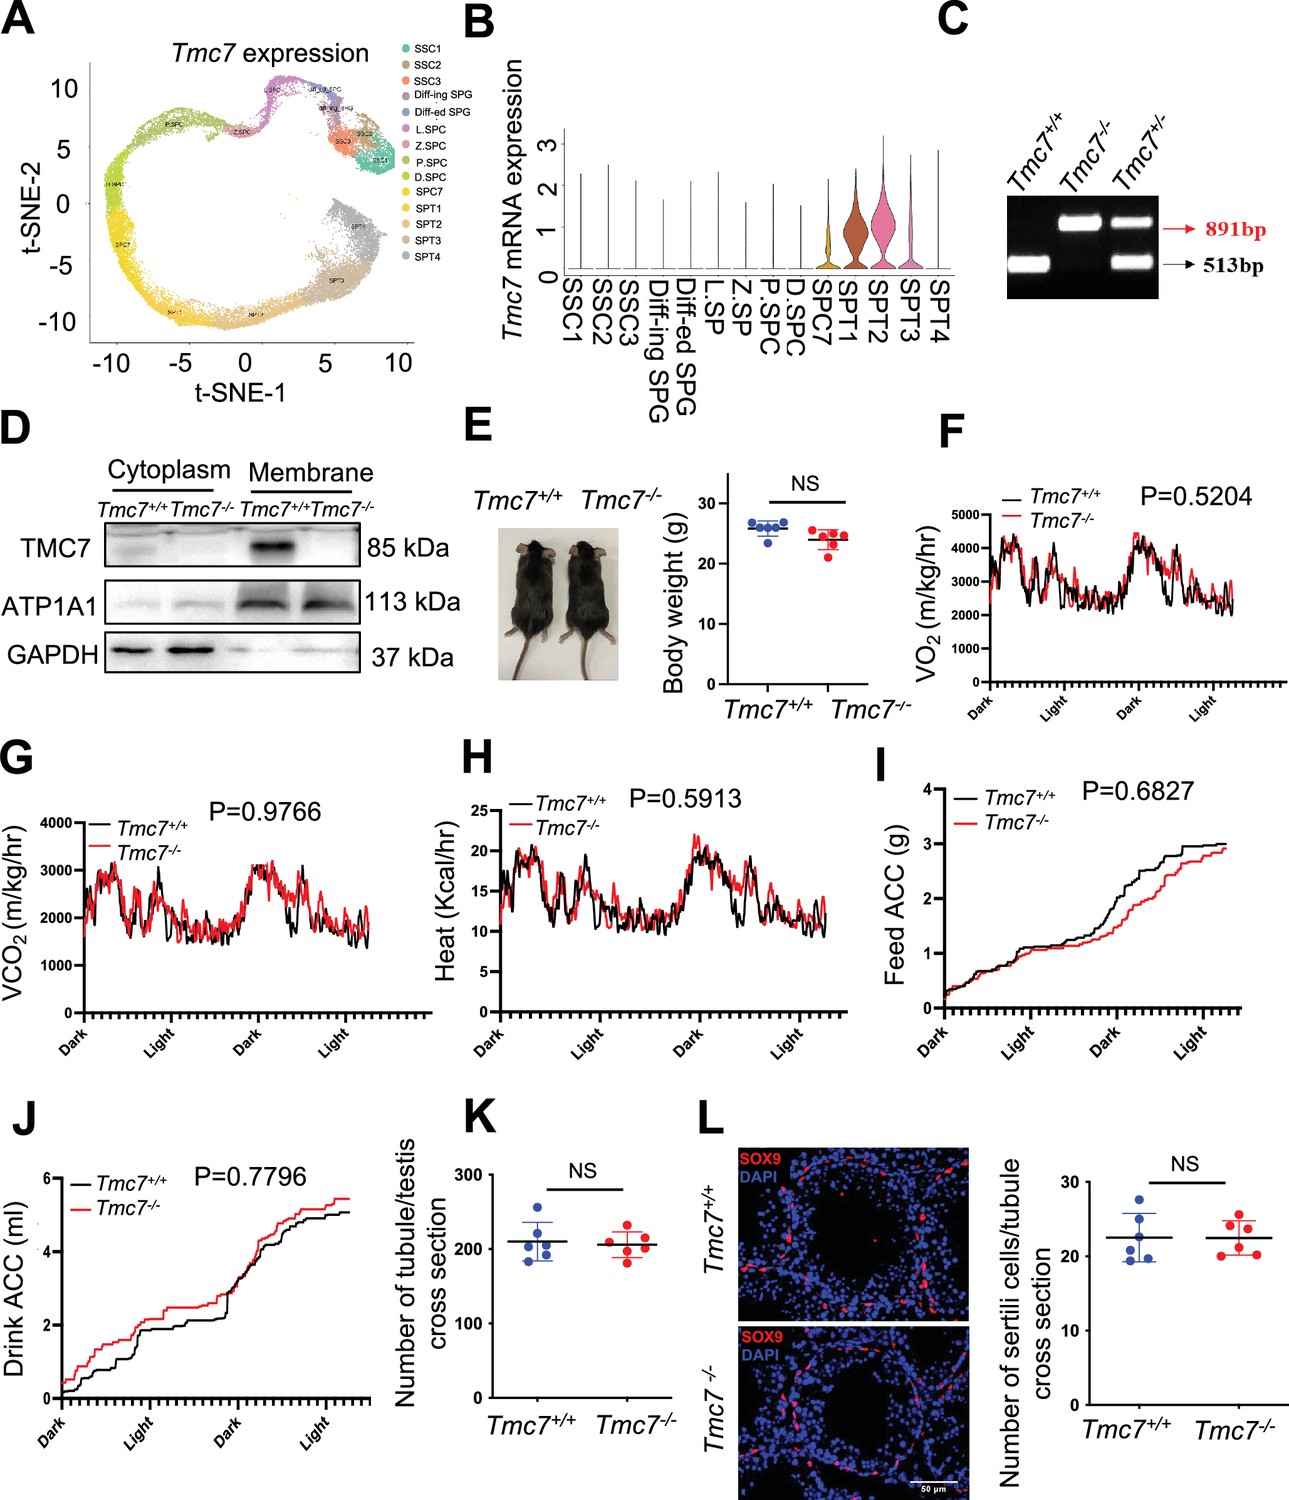
Phenotypic characterization of Tmc7−/− mice.
(A, B) t-Distributed Stochastic Neighbor Embedding (t-SNE) plot and violin plot showed the expression of TMC7 in different human germ cell using Male Health Atlas (http://malehealthatlas.cn/). SSC1-3: spermatogonial stem cells I–III; Diff-ed SPG: differenced spermatogonia; Diff-ing SPG: differentiating spermatogonia; SPC: spermatocyte; SPT: spermatids. (C) Genotyping of Tmc7 mice by PCR of tail-derived DNA. (D) Western blot was performed to detect the knockout efficiency in cytoplasm and membrane protein of testis in 9-week mice. (E) The mice of WT and Tmc7-/- for 9-week mice and the body weights of 9-week WT and Tmc7-/- male mice, Six mice of each genotype were used. (F–J) Oxygen and consumption, carbon dioxide production, energy expenditure, and food and water intake were measured using metabolic cages in 9-week WT and Tmc7-/- male mice. Four mice were used. two-way ANOVA was used to analyze the p-values. (K) The average number of tubules per testis in 9-week WT and Tmc7-/- male mice, six mice were used. (L) IF staining of SOX9, a marker of Sertoli cell, and average number of Sertoli cells per seminiferous tubules in 9-week WT and Tmc7-/- male mice. Ten tubules in each testis were counted and six mice were used. Scale bar, 50 μm. The results are presented as the mean ± S.D. Two-sided unpaired Student’s t-test and two-way ANOVA were used to analyze the p-values (ns, nonsignificant, *p<0.05, **p<0.01, ***p<0.001).
-
Figure 1—figure supplement 1—source data 1
Uncropped and labeled gels for Figure 1—figure supplement 1.
- https://cdn.elifesciences.org/articles/95888/elife-95888-fig1-figsupp1-data1-v1.zip
-
Figure 1—figure supplement 1—source data 2
Raw unedited gels for Figure 1—figure supplement 1.
- https://cdn.elifesciences.org/articles/95888/elife-95888-fig1-figsupp1-data2-v1.zip
Figure 2 with 2 supplements
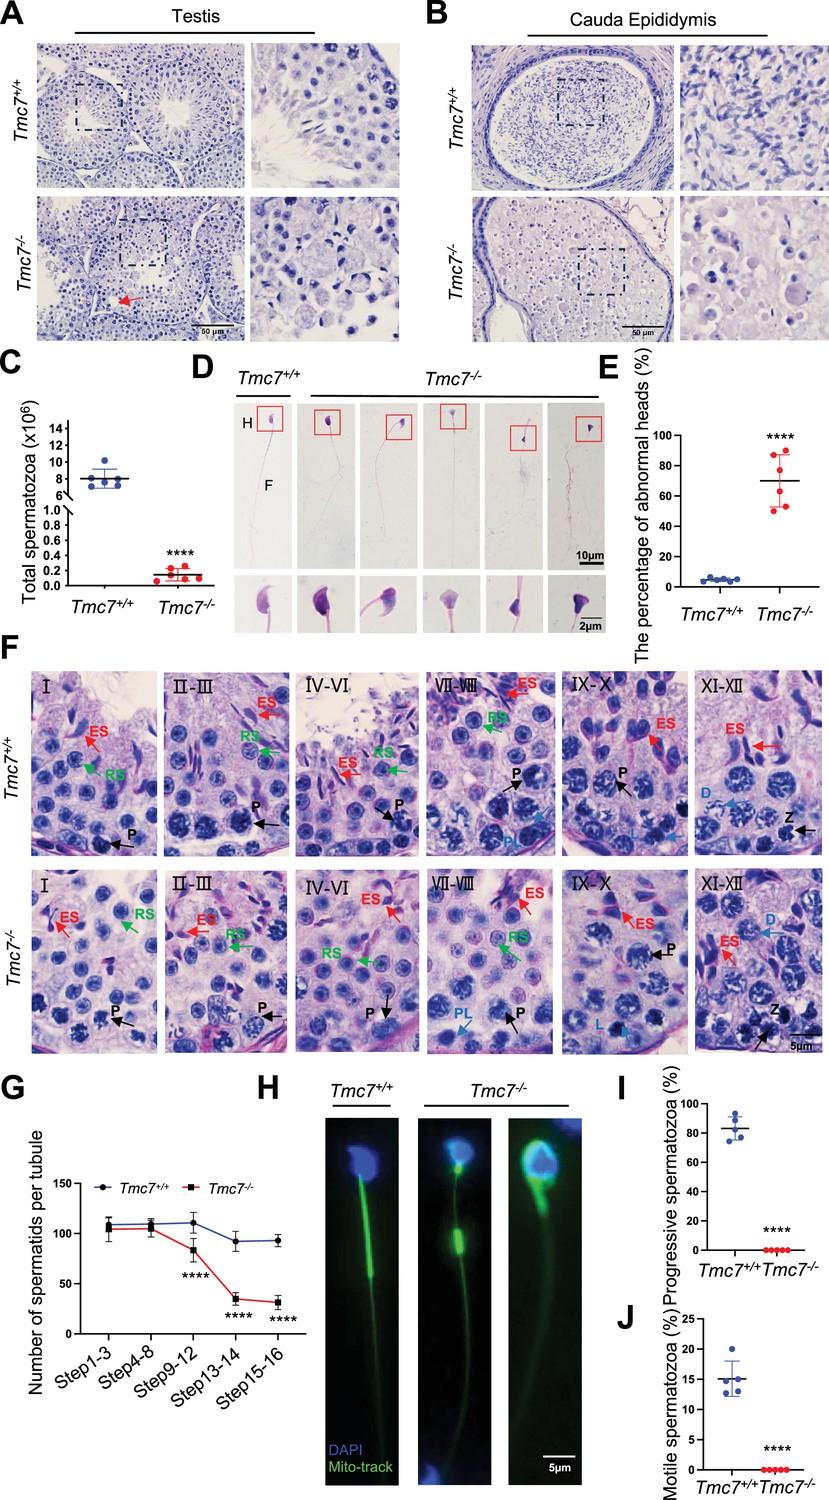
TMC7 deficiency leads to severe defects in spermiogenesis.
(A, B) Hematoxylin staining in testis and caudal epididymis sections of 9-week-old WT and Tmc7−/− male mice. Scale bar, 50 μm. (C) The total number of sperm in the caudal epididymis from 9-week-old WT and Tmc7−/− male mice. Six mice were used. (D) Hematoxylin-eosin staining of the spermatozoa isolated from the caudal epididymis in 9-week-old WT and Tmc7−/− male mice. H: head, F: flagella. Scale bar, 10 μm, 2 μm. (E) The percentage of spermatozoa with abnormal heads in the caudal epididymis from WT and Tmc7−/− male mice. Six mice were used. (F) Periodic acid Schiff (PAS) and hematoxylin staining in 9-week-old WT and Tmc7−/− mouse seminiferous tubules. The numbers represent the stages of spermatogenesis. P: pachytene spermatocyte, PL: preleptotene spermatocyte, L: leptotene spermatocyte, Z: zygotene spermatocyte, D: diplotene spermatocyte, RS: round spermatid, ES: elongating spermatid. Scale bar, 5 μm. (G) Quantification of spermatid numbers in seminiferous tubules from spermatid stages 1–16. N = 15 tubules per stage and per genotype; three mice per genotype were used and five tubules per stage and per mouse were counted. (H) Mitochondrial sheath staining by Mito-tracker in sperm collected from the caudal epididymis. Scale bar, 5 μm. (I, J) The percent of progressive and motile spermatozoa in 9-week-old WT and Tmc7−/− mice. Five mice were used. Images are representative of at least three independent experiments. The results are presented as the mean ± S.D., and two-sided unpaired Student’s t-tests were used to calculate the p-values (*p<0.05, **p<0.01, ***p<0.001).
Figure 2—figure supplement 1
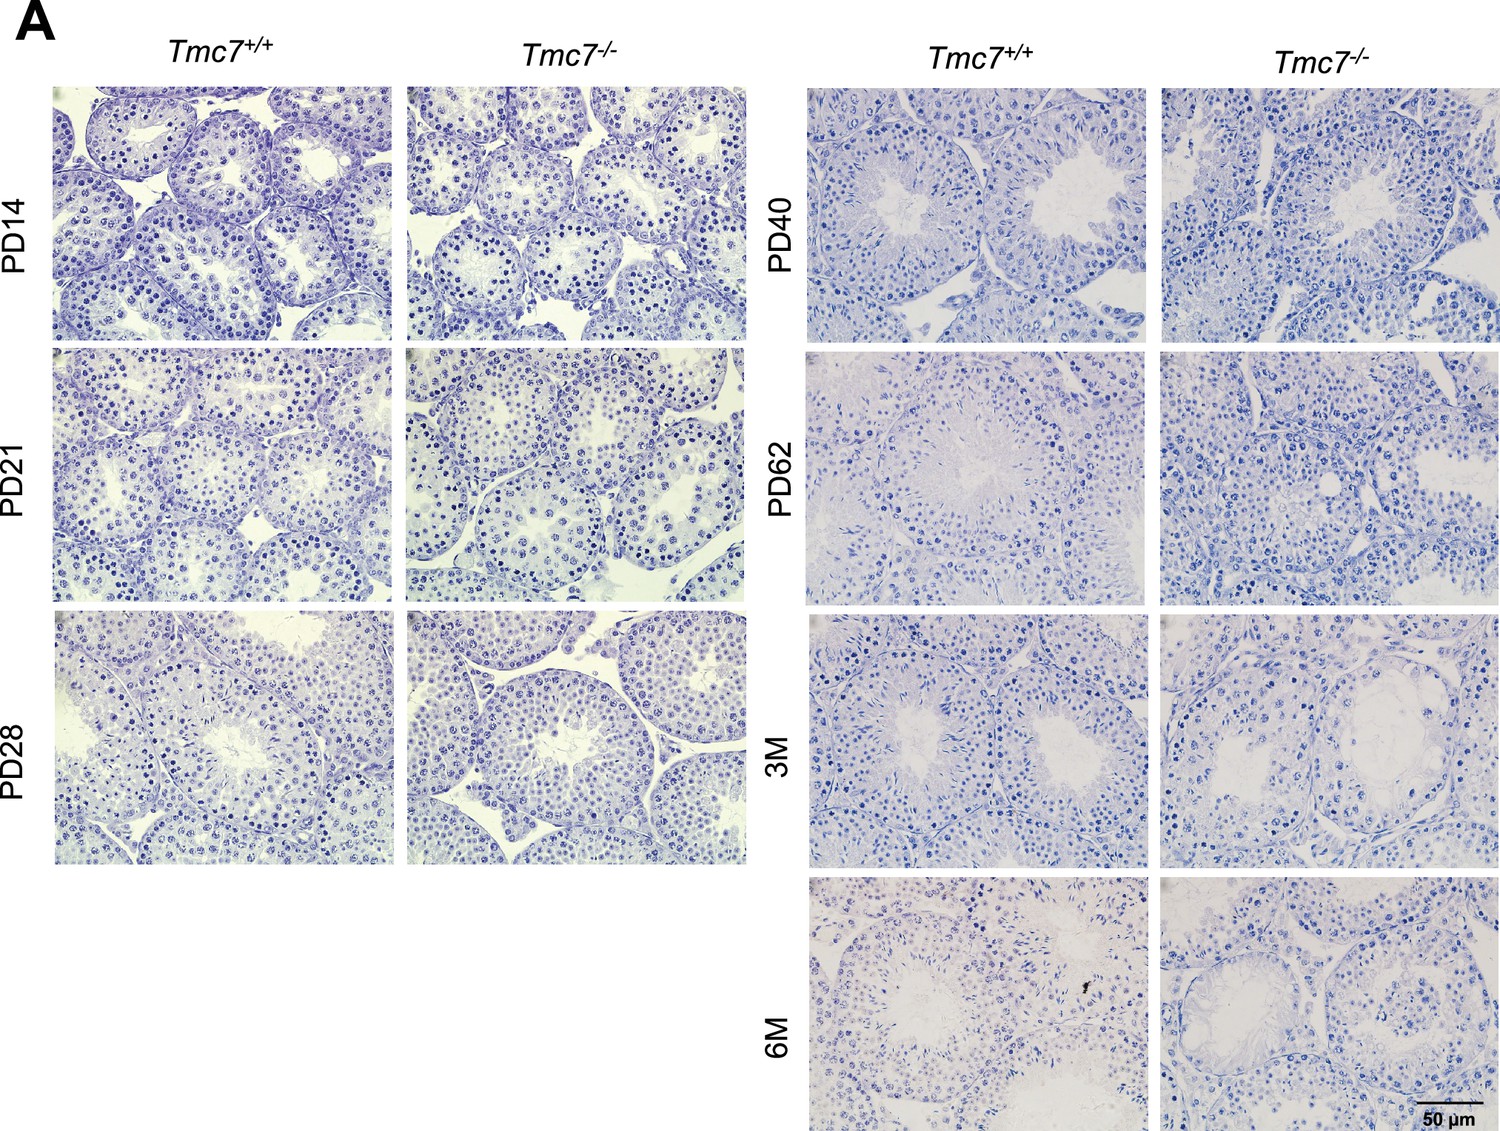
Histological detection in WT and Tmc7-/- mice.
(A) Hematoxylin staining in testis of WT and Tmc7-/- mice at different postnatal day points (PD14, PD21, PD28, PD40, PD62, 3M, and 6M). Scale bar, 50 μm.
Figure 2—figure supplement 2

TMC7 is not required for meiotic progression.
(A) IF staining with antibody against SYCP3 (red) and γ-H2AX (green), the marker of meiotic in chromosome spreads of spermatocytes from the testes in PD20 WT and Tmc7-/- mice. Scale bar, 5 μm.
Figure 3 with 1 supplement
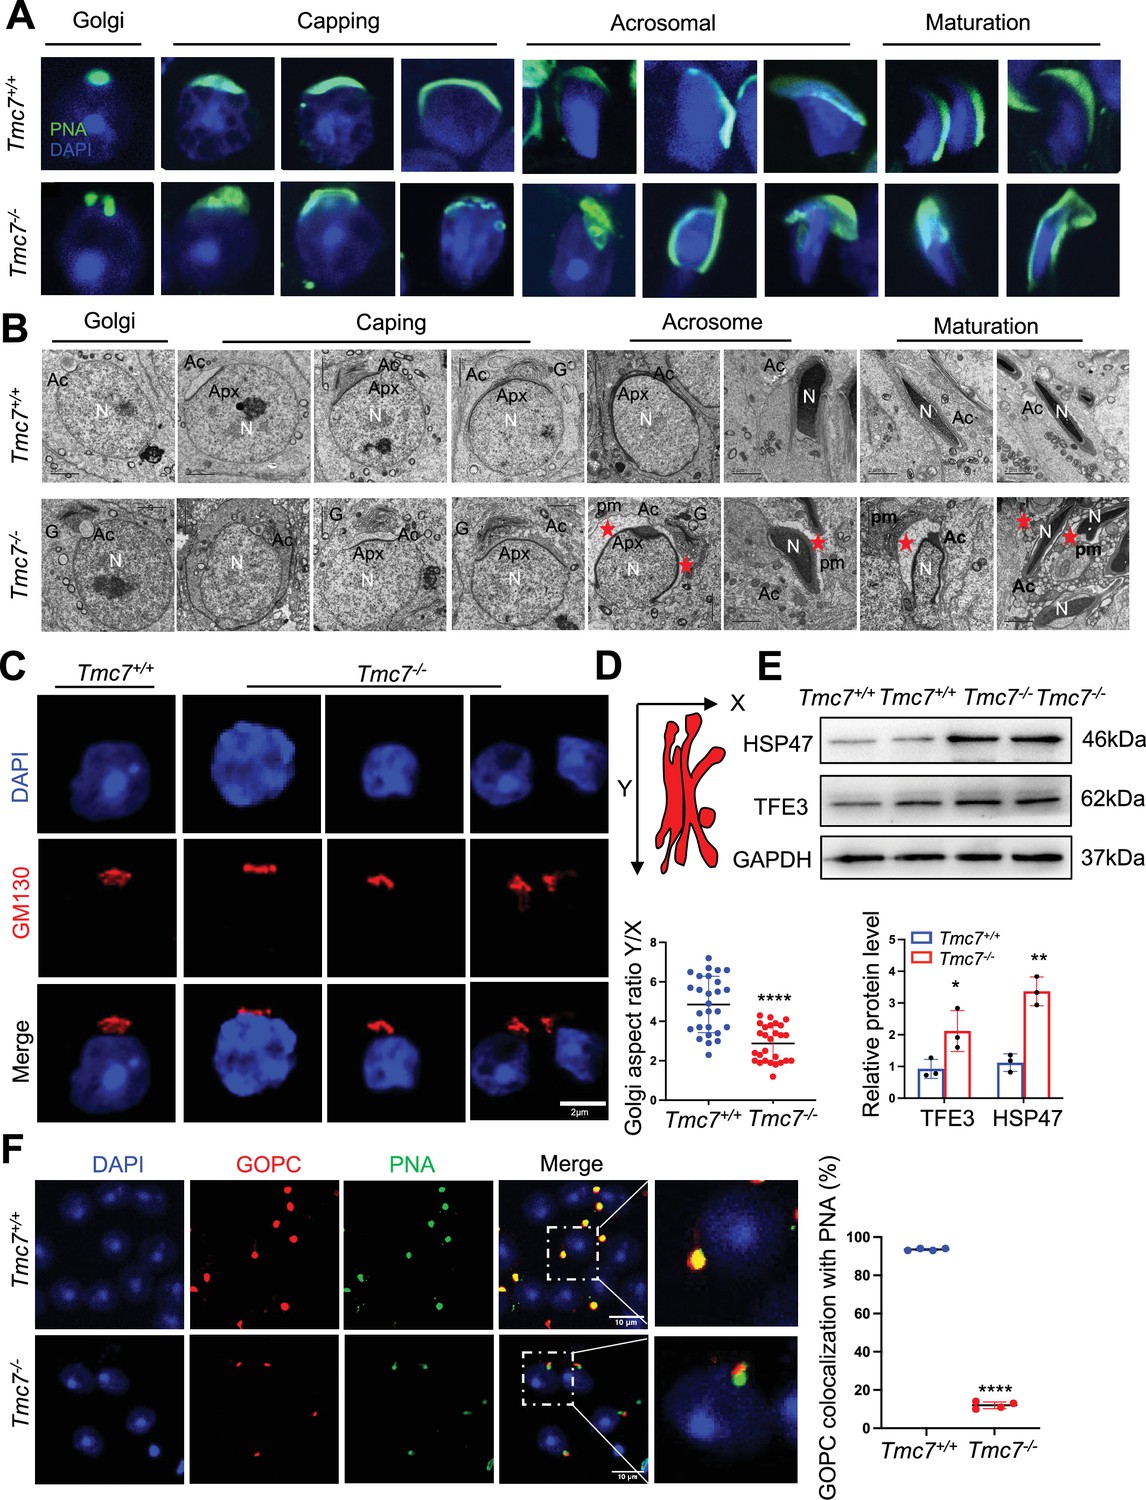
Acrosome biogenesis is impaired starting from the Golgi phase in Tmc7–/– spermatids.
(A) Immunofluorescence staining of PNA (green) in the phases of acrosome biogenesis in 9-week-old WT and Tmc7−/−spermatids. Nuclei were stained with DAPI (blue). The phases of acrosome biogenesis and corresponding spermiogenesis steps are the Golgi phase (steps 1–3), cap phase (steps 4–7), acrosome phase (steps 8–12), and maturation phase (steps 13–16). (B) Transmission electron microscopy (TEM) images of testicular sections of 9-week-old WT and Tmc7−/− mice. The red star represents the abnormal plasma membrane space and accumulated vesicles. N: nucleus, Ac: acrosome; Apx: acroplaxome; pm: plasma membrane. G: Golgi complex; Scale bar, 2 μm. (C) Immunofluorescence staining with the antibody against GM130 in spermatids from the testes of 9-week-old WT and Tmc7−/− mice. Scale bar, 2 μm. (D) Calculation of the aspect ratio (height [X] over width [Y]) of 9-week-old WT and Tmc7−/− Golgi apparatuses based on TEM images. N = 27, and nine tubules in each testis were counted from three mice. (E) Western blot analysis of protein levels of Golgi stress-associated proteins (HSP47, TFE3) in 3-week-old WT and Tmc7−/− testes. ImageJ was used to quantify the protein level. (F) Immunofluorescence staining of GOPC (red) and PNA (green) and the quantitative analysis of GOPC and PNA lectin colocalization in squashed tubules of 9-week-old WT and Tmc7−/− mice. Nuclei were stained with DAPI (blue). Scale bar, 10 μm. Four mice were used, and 200 cells were counted per mouse. Images are representative of at least three independent experiments. The results are presented as the mean ± S.D., and two-sided unpaired Student’s t-tests were used to calculate the p-values (*p<0.05, **p<0.01, ***p<0.001).
-
Figure 3—source data 1
Uncropped and labeled gels for Figure 3.
- https://cdn.elifesciences.org/articles/95888/elife-95888-fig3-data1-v1.zip
-
Figure 3—source data 2
Raw unedited gels for Figure 3.
- https://cdn.elifesciences.org/articles/95888/elife-95888-fig3-data2-v1.zip
Figure 3—figure supplement 1
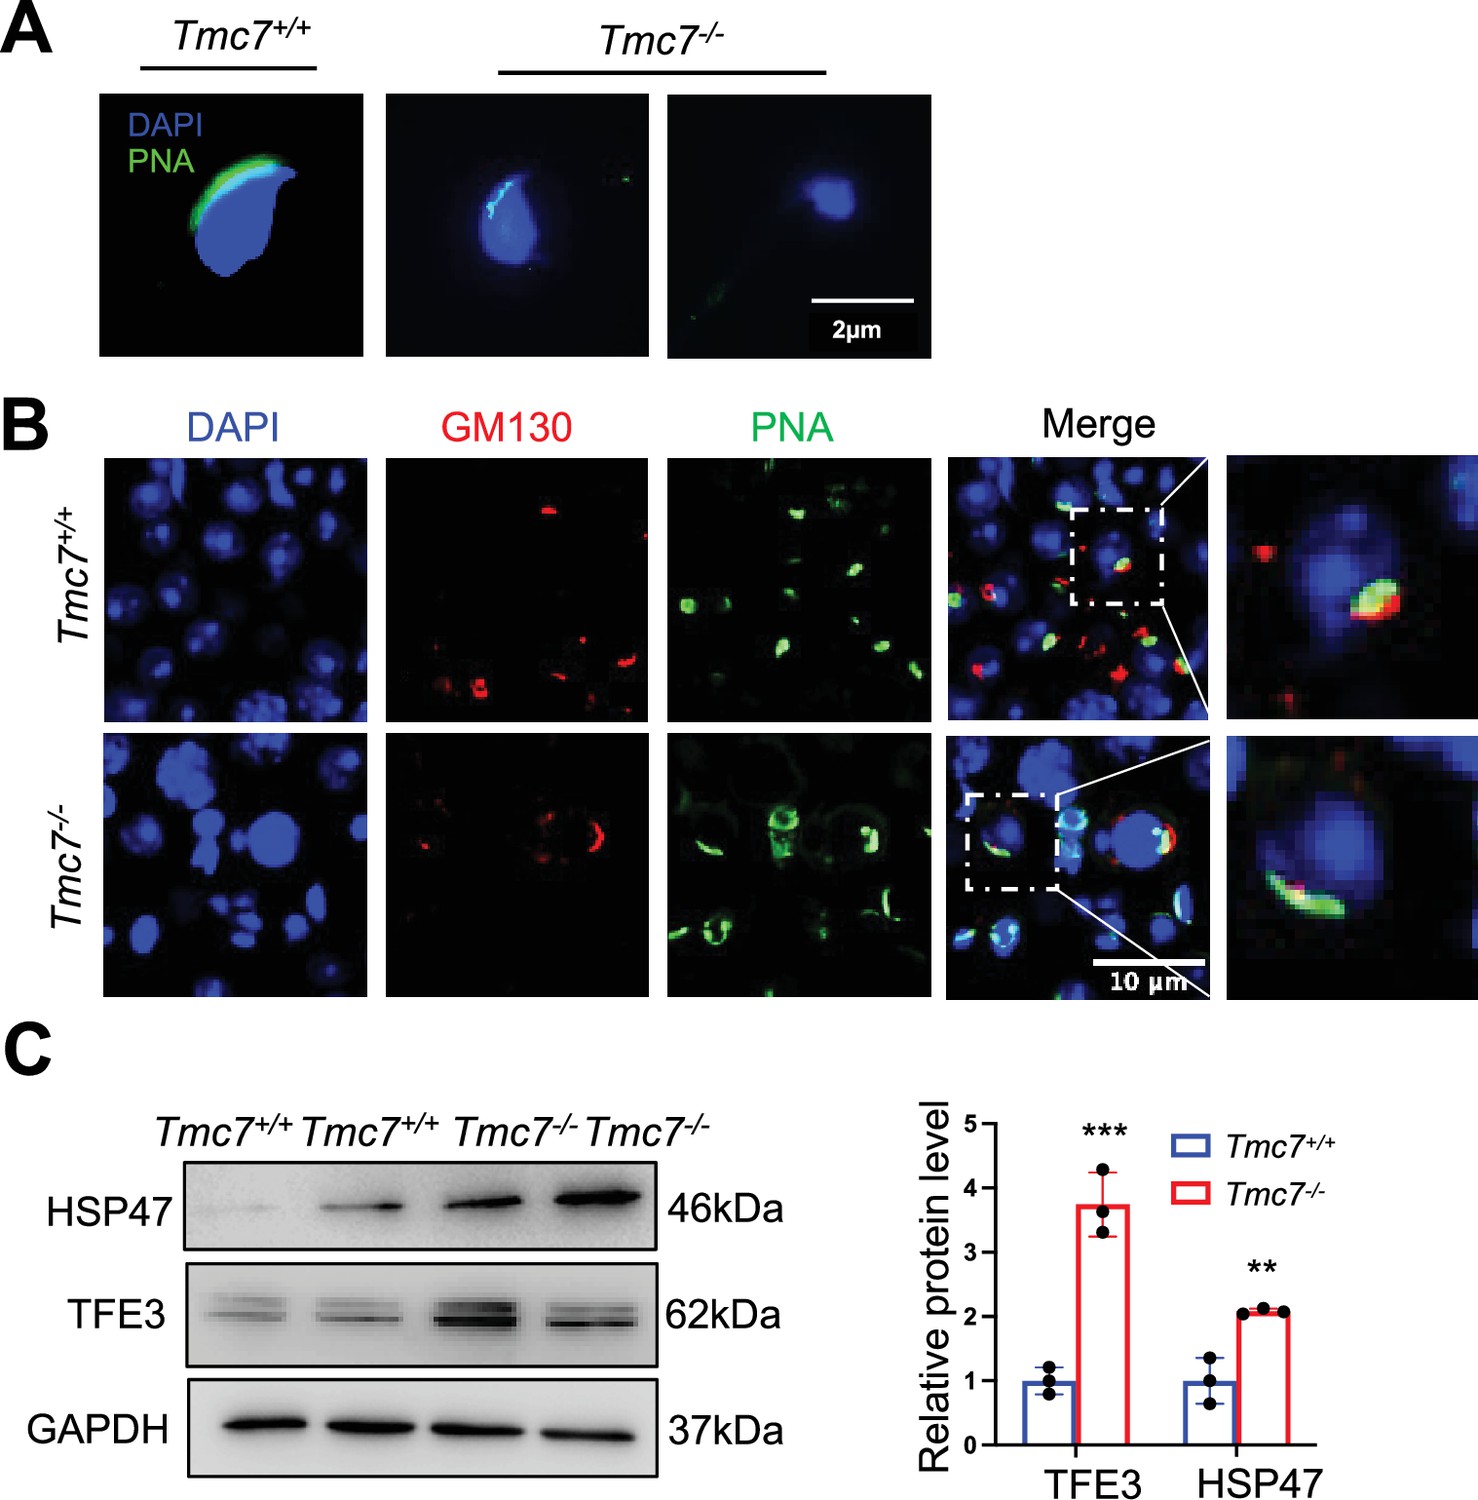
The defects of acrosome and Golgi apparatus in Tmc7-/- spermatozoa.
(A) Acrosome staining by using fluorescein-conjugated peanut agglutinin (PNA), a protein that binds to the outer acrosomal membrane in sperm collected from caudal epididymis. Scale bar, 2 μm. (B) IF staining of GM130 (red) and PNA (green) in squashing tubules of 9-week WT and Tmc7-/- mice. Nuclei were stained with DAPI (blue). Scale bar, 10 μm. (C) Western blot analysis of protein levels of Golgi stress-associated proteins (HSP47, TFE3) in 9-week-old WT and Tmc7-/- testes. ImageJ was used to quantify the protein level. Images are representative of at least three independent experiments. The results are presented as the mean ± S.D., and two-sided unpaired Student’s t-tests were used to calculate the p-values (*p<0.05, **p<0.01, ***p<0.001).
-
Figure 3—figure supplement 1—source data 1
Uncropped and labeled gels for Figure 3—figure supplement 1.
- https://cdn.elifesciences.org/articles/95888/elife-95888-fig3-figsupp1-data1-v1.zip
-
Figure 3—figure supplement 1—source data 2
Raw unedited gels for Figure 3—figure supplement 1.
- https://cdn.elifesciences.org/articles/95888/elife-95888-fig3-figsupp1-data2-v1.zip
Figure 4 with 1 supplement
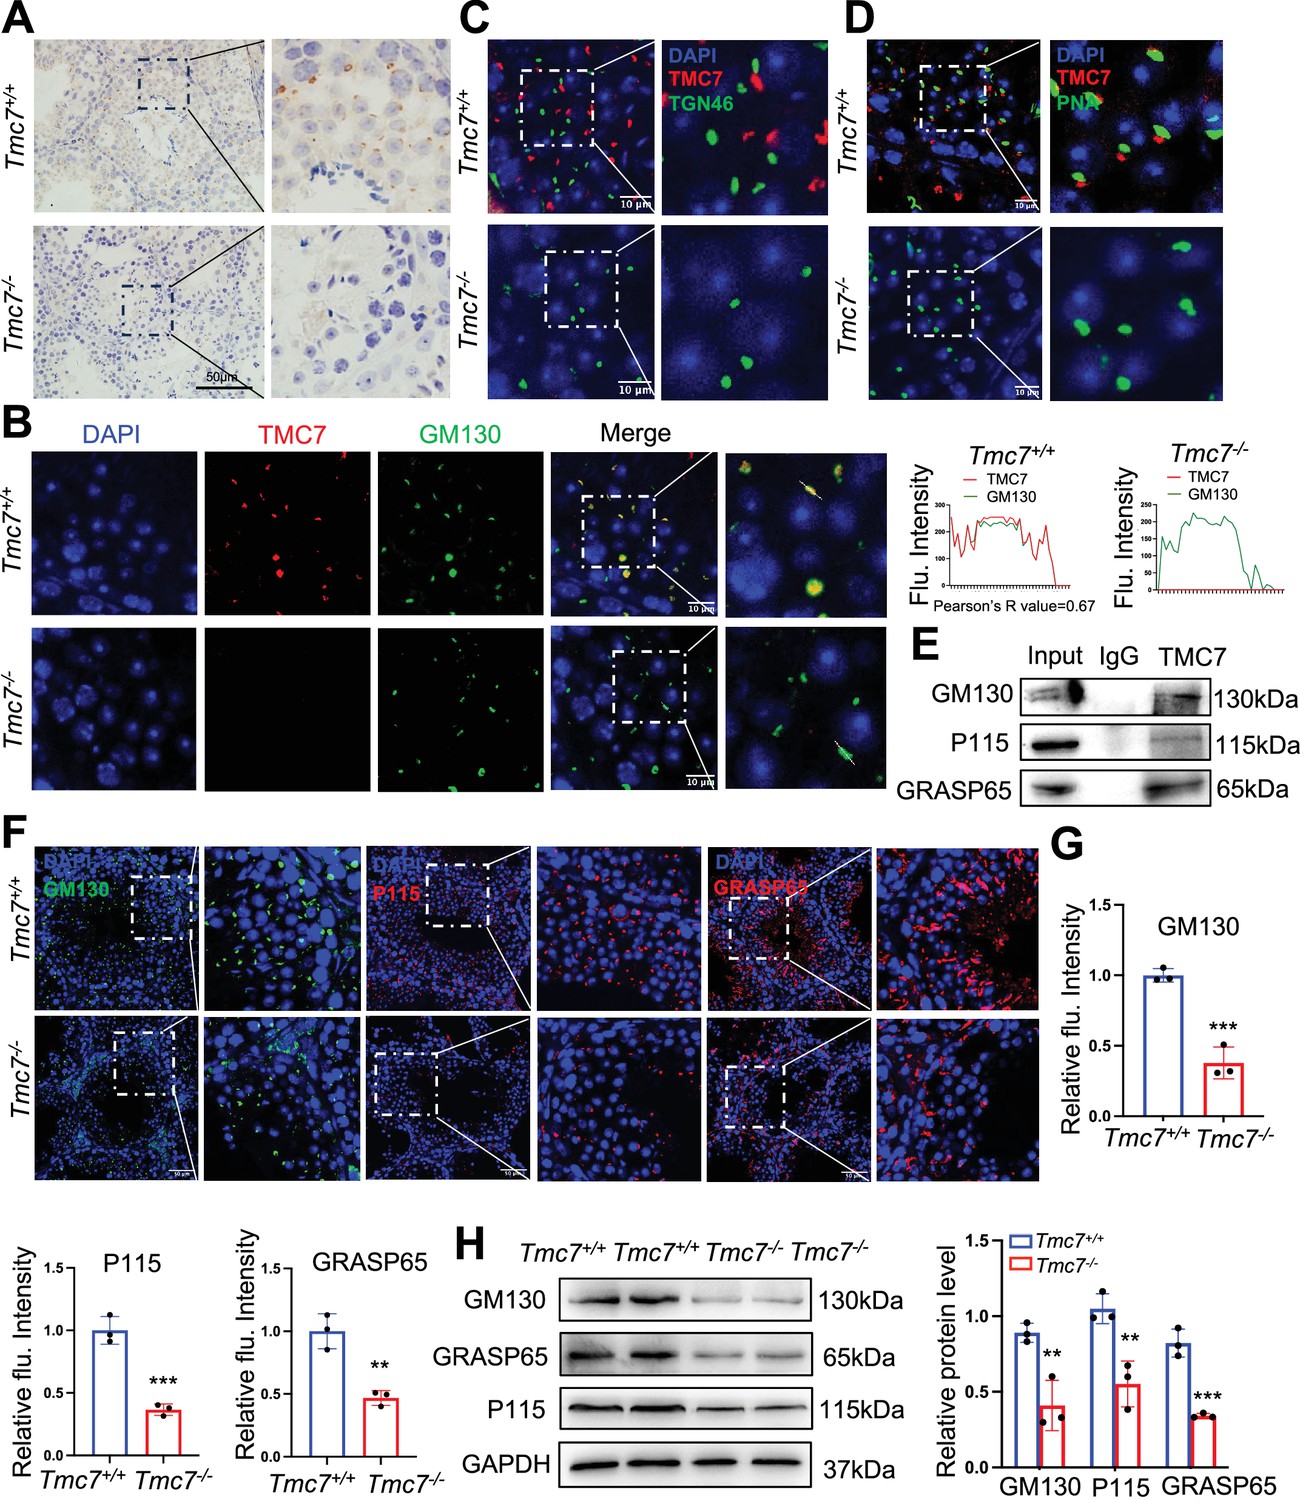
TMC7 localizes to the cis-Golgi, and this is required for maintaining Golgi integrity.
(A) Immunohistochemical staining with an antibody against TMC7 in seminiferous tubules of 9-week-old mouse testes. Scale bar, 50 μm. (B) Immunofluorescence staining of TMC7 (red) and GM130 (green, a marker of the cis-Golgi), with DAPI indicating the nuclei in seminiferous tubules of 9-week-old WT and Tmc7−/− testis. Scale bar, 10 μm. Colocalization was quantified by ImageJ, and 20 cells were analyzed for the Pearson’s R-value. (C) Immunofluorescence staining of TMC7 (red) and TGN46 (green, a marker of the trans-Golgi), with DAPI indicating the nuclei in the seminiferous tubule. Scale bar, 10 μm. (D) Immunofluorescence staining of TMC7 (red) and PNA (green, a marker of the acrosome), with DAPI indicating the nuclei in the seminiferous tubule. Scale bar, 10 μm. (E) Western blot was used to analyze the results of co-immunoprecipitation and showed the interaction between TMC7 and GM130, P115, and GRASP65 in 9-week-old WT testes. (F, G) Immunofluorescence staining and quantification of GM130 (green), P115 (red), and GRASP65 (red) in testicular sections (II–III stage) of 9-week-old WT and Tmc7−/− mice. Scale bar, 50 μm. (H) Western blots of the protein levels of GM130 and the GM130-interacting proteins P115 and GRASP65 in 3-week-old WT and Tmc7−/− testes. ImageJ was used to quantify the protein level. Images are representative of at least three independent experiments. The results are presented as the mean ± S.D., and two-sided unpaired Student’s t-tests were used to calculate the p-values (*p<0.05, **p<0.01, ***p<0.001).
-
Figure 4—source data 1
Uncropped and labeled gels for Figure 4.
- https://cdn.elifesciences.org/articles/95888/elife-95888-fig4-data1-v1.zip
-
Figure 4—source data 2
Raw unedited gels for Figure 4.
- https://cdn.elifesciences.org/articles/95888/elife-95888-fig4-data2-v1.zip
Figure 4—figure supplement 1
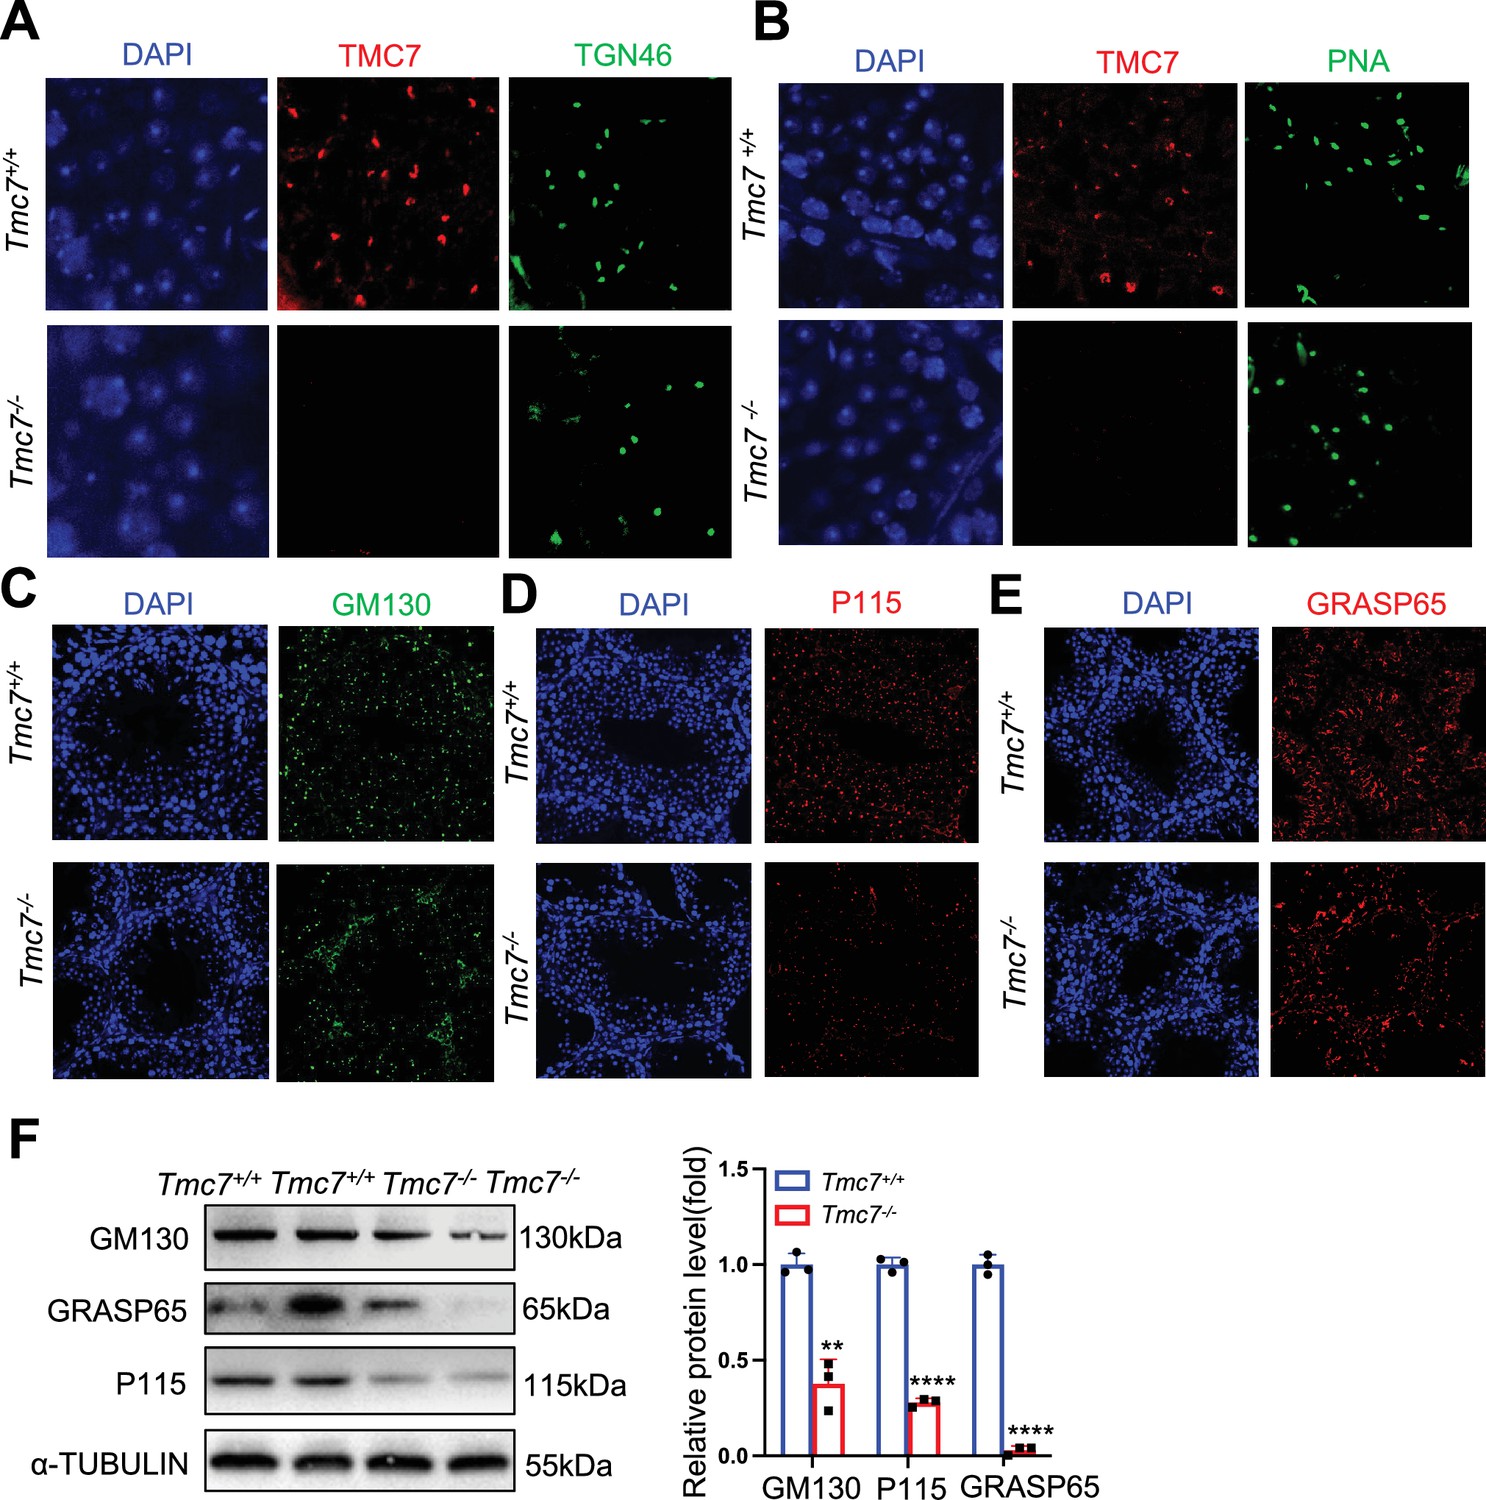
The location of TMC7 in testis.
(A) IF staining of TMC7 (red) and TGN46 (green), DAPI indicates the nucleus in seminiferous tubule. (B) IF staining of TMC7 (red) and PNA (green), DAPI indicates the nucleus in seminiferous tubule. (C) IF staining GM130 (green), DAPI indicates the nucleus in seminiferous tubule. (D) IF staining P115 (red), DAPI indicates the nucleus in seminiferous tubule. (E) IF staining GRASP65 (red), DAPI indicates the nucleus in seminiferous tubule. (F) Western blots of the protein levels of GM130 and the GM130-interacting proteins P115 and GRASP65 in 9-week-old WT and Tmc7-/- testes. ImageJ was used to quantify the protein level. Images are representative of at least three independent experiments. The results are presented as the mean ± S.D., and two-sided unpaired Student’s t-tests were used to calculate the p-values (*p<0.05, **p<0.01, ***p<0.001).
-
Figure 4—figure supplement 1—source data 1
Uncropped and labeled gels for Figure 4—figure supplement 1.
- https://cdn.elifesciences.org/articles/95888/elife-95888-fig4-figsupp1-data1-v1.zip
-
Figure 4—figure supplement 1—source data 2
Raw unedited gels for Figure 4—figure supplement 1.
- https://cdn.elifesciences.org/articles/95888/elife-95888-fig4-figsupp1-data2-v1.zip
Figure 5 with 2 supplements
TMC7 depletion impairs cellular homeostasis and leads to spermatid apoptosis.
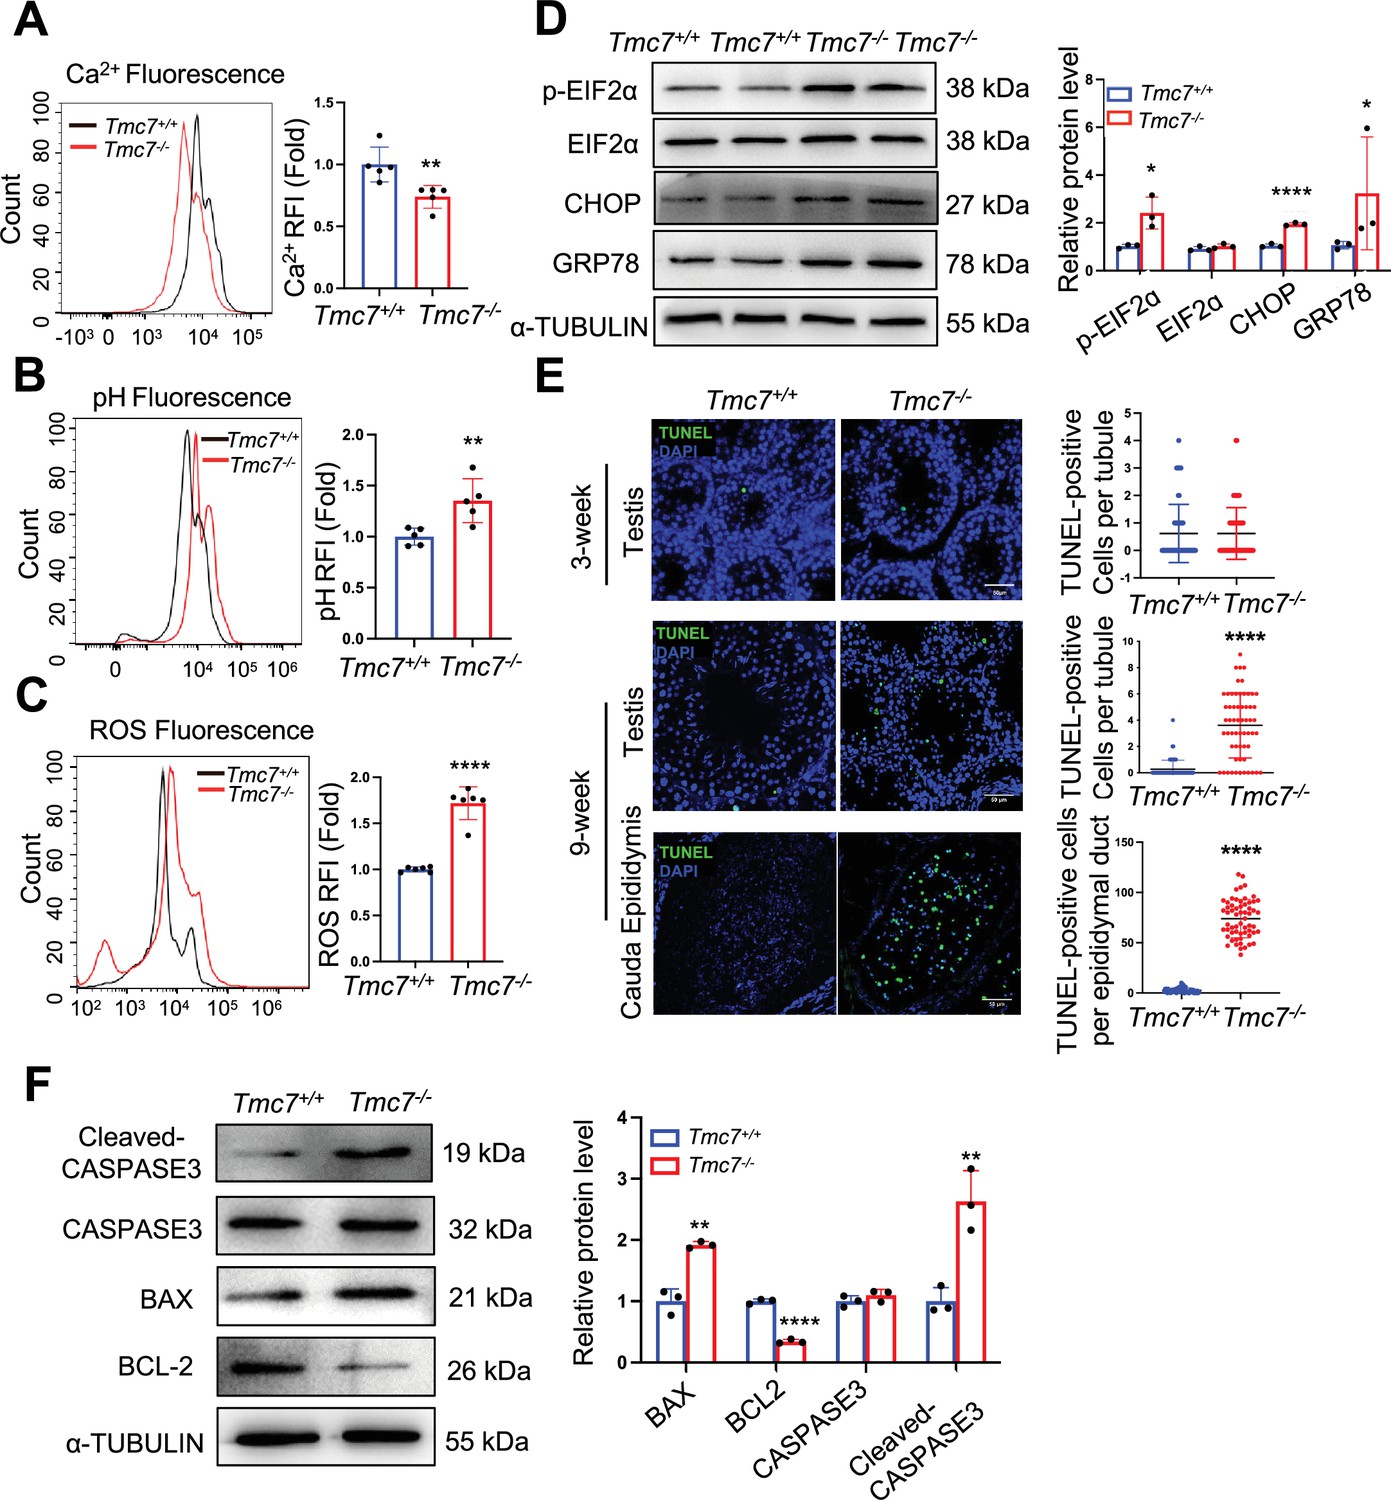
(A) The Ca2+ levels were measured by flow cytometry in WT and Tmc7−/− germ cells isolated from 3-week-old testes. Five mice were used. (B) The pH levels were measured by flow cytometry in WT and Tmc7−/− germ cells isolated from 3-week-old testes. Five mice were used. (C) The reactive oxygen species (ROS) levels were measured by flow cytometry in WT and Tmc7−/− germ cells isolated from 3-week-old testes. Six mice were used. (D) Western blot analysis of protein levels of endoplasmic reticulum (ER) chaperone-associated proteins (p-EIF2α, EIF2α, CHOP, and GRP78) in 3-week-old WT and Tmc7−/− testes. ImageJ was used to quantify the protein level. (E) TUNEL assay and the number of TUNEL-positive cells per tubule in seminiferous tubules and cauda epididymis of 3- and 9-week-old WT and Tmc7−/− male mice. Scale bar, 50 μm. N = 60, 20 tubules in each testis and cauda epididymis were counted, and three mice were used. (F) Apoptosis-related proteins (Cleaved-CASPASE3, CASPASE3, BAX, BCL2) were detected by western blotting in 9-week-old WT and Tmc7−/− testes. ImageJ was used to quantify the protein level. Images are representative of at least three independent experiments. The results are presented as the mean ± S.D., and two-sided unpaired Student’s t-tests were used to calculate the p-values (*p<0.05, **p<0.01, ***p<0.001).
-
Figure 5—source data 1
Uncropped and labeled gels for Figure 5.
- https://cdn.elifesciences.org/articles/95888/elife-95888-fig5-data1-v1.zip
-
Figure 5—source data 2
Raw unedited gels for Figure 5.
- https://cdn.elifesciences.org/articles/95888/elife-95888-fig5-data2-v1.zip
Figure 5—figure supplement 1
Intracellular homeostasis was impaired in Tmc7-/- testis.
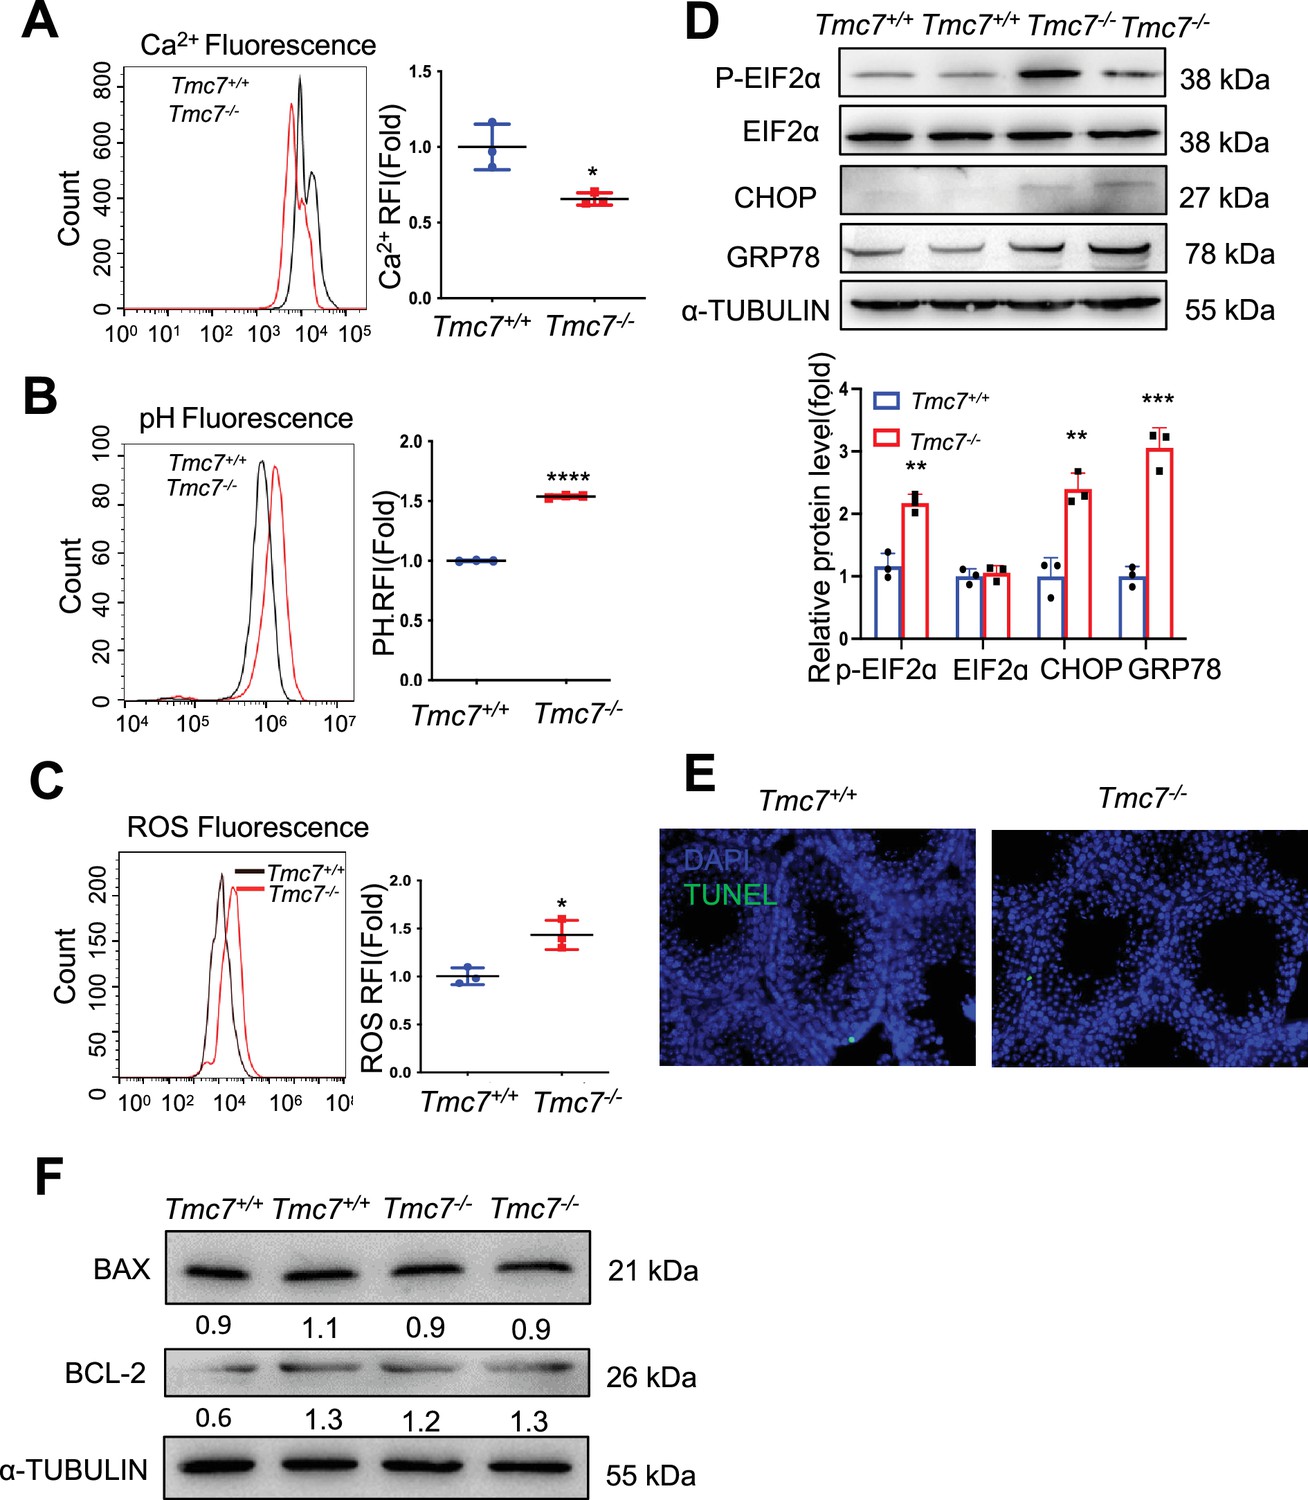
(A) The Ca2+ levels were measured by flow cytometry in WT and Tmc7-/- germ cells isolated from PD30 testes. There mice were used. (B) The pH levels were measured by flow cytometry in WT and Tmc7-/- germ cells isolated from PD30 testes. There mice were used. (C) The reactive oxygen species (ROS) levels were measured by flow cytometry in WT and Tmc7-/- germ cells isolated from PD30 testes. There mice were used. (D) Western blot analysis of protein levels of endoplasmic reticulum (ER) chaperone-associated proteins (p-EIF2α, EIF2α, Chop, and GRP78) in 9-week-old WT and Tmc7-/- testes. ImageJ was used to quantify the protein level. Images are representative of at least three independent experiments. (E) TUNEL assay of PD30 WT and Tmc7-/- male mice. (F) Apoptosis-related proteins (BAX, BCL2) were detected by western blotting in PD30 WT and Tmc7-/- testes. ImageJ was used to quantify the protein level. The results are presented as the mean ± S.D., and two-sided unpaired Student’s t-tests were used to calculate the p-values (*p<0.05, **p<0.01, ***p<0.001).
-
Figure 5—figure supplement 1—source data 1
Uncropped and labeled gels for Figure 5—figure supplement 1.
- https://cdn.elifesciences.org/articles/95888/elife-95888-fig5-figsupp1-data1-v1.zip
-
Figure 5—figure supplement 1—source data 2
Raw unedited gels for Figure 5—figure supplement 1.
- https://cdn.elifesciences.org/articles/95888/elife-95888-fig5-figsupp1-data2-v1.zip
Figure 5—figure supplement 2
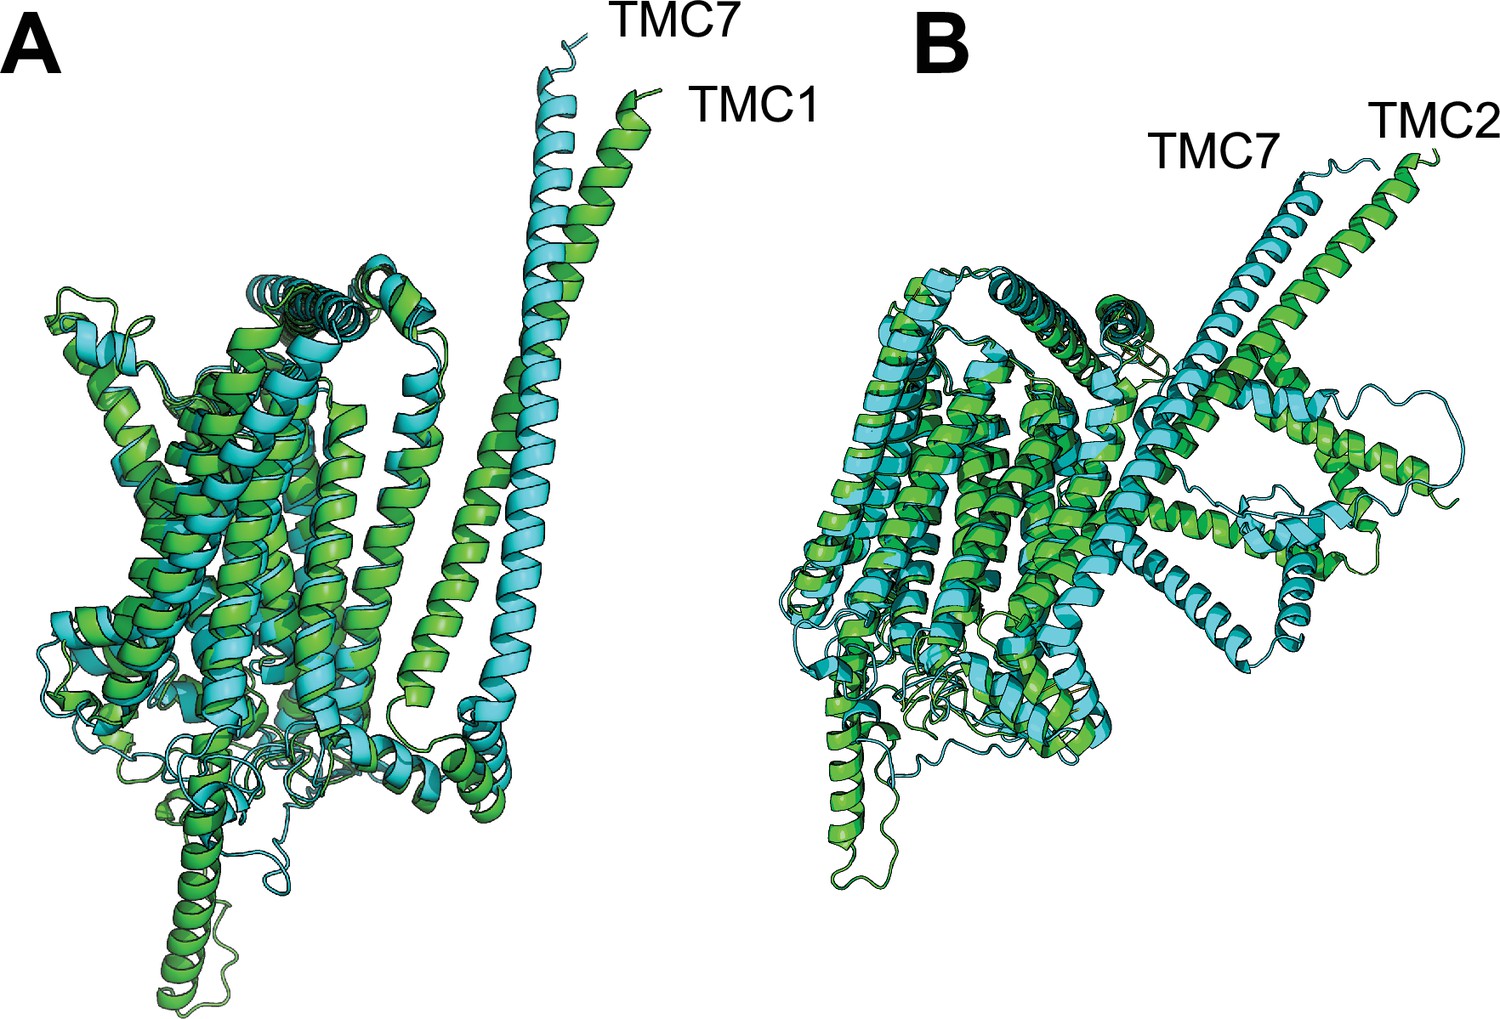
Structure comparison of TMC1/2 with TMC7.
(A) The structure of TMC1 with TMC7. (B) The structure of TMC2 with TMC7.
Additional files
-
Supplementary file 1
Fertility testing of Tmc7+/-, Tmc7-/- male mice and Tmc7-/- female mice.
- https://cdn.elifesciences.org/articles/95888/elife-95888-supp1-v1.docx
-
MDAR checklist
- https://cdn.elifesciences.org/articles/95888/elife-95888-mdarchecklist1-v1.docx
Download links
A two-part list of links to download the article, or parts of the article, in various formats.
Downloads (link to download the article as PDF)
Open citations (links to open the citations from this article in various online reference manager services)
Cite this article (links to download the citations from this article in formats compatible with various reference manager tools)
TMC7 deficiency causes acrosome biogenesis defects and male infertility in mice
eLife 13:RP95888.
https://doi.org/10.7554/eLife.95888.4


