Unveiling chemotherapy-induced immune landscape remodeling and metabolic reprogramming in lung adenocarcinoma by scRNA-sequencing
- Department of Thoracic Surgery, Zhongshan Hospital, Fudan University, China
- Department of Pathology, Albert Einstein College of Medicine, United States
- Department of Thoracic Surgery, Sichuan Cancer Hospital, University of Electronic Science and Technology of China, China
Figures
Figure 1 with 1 supplement
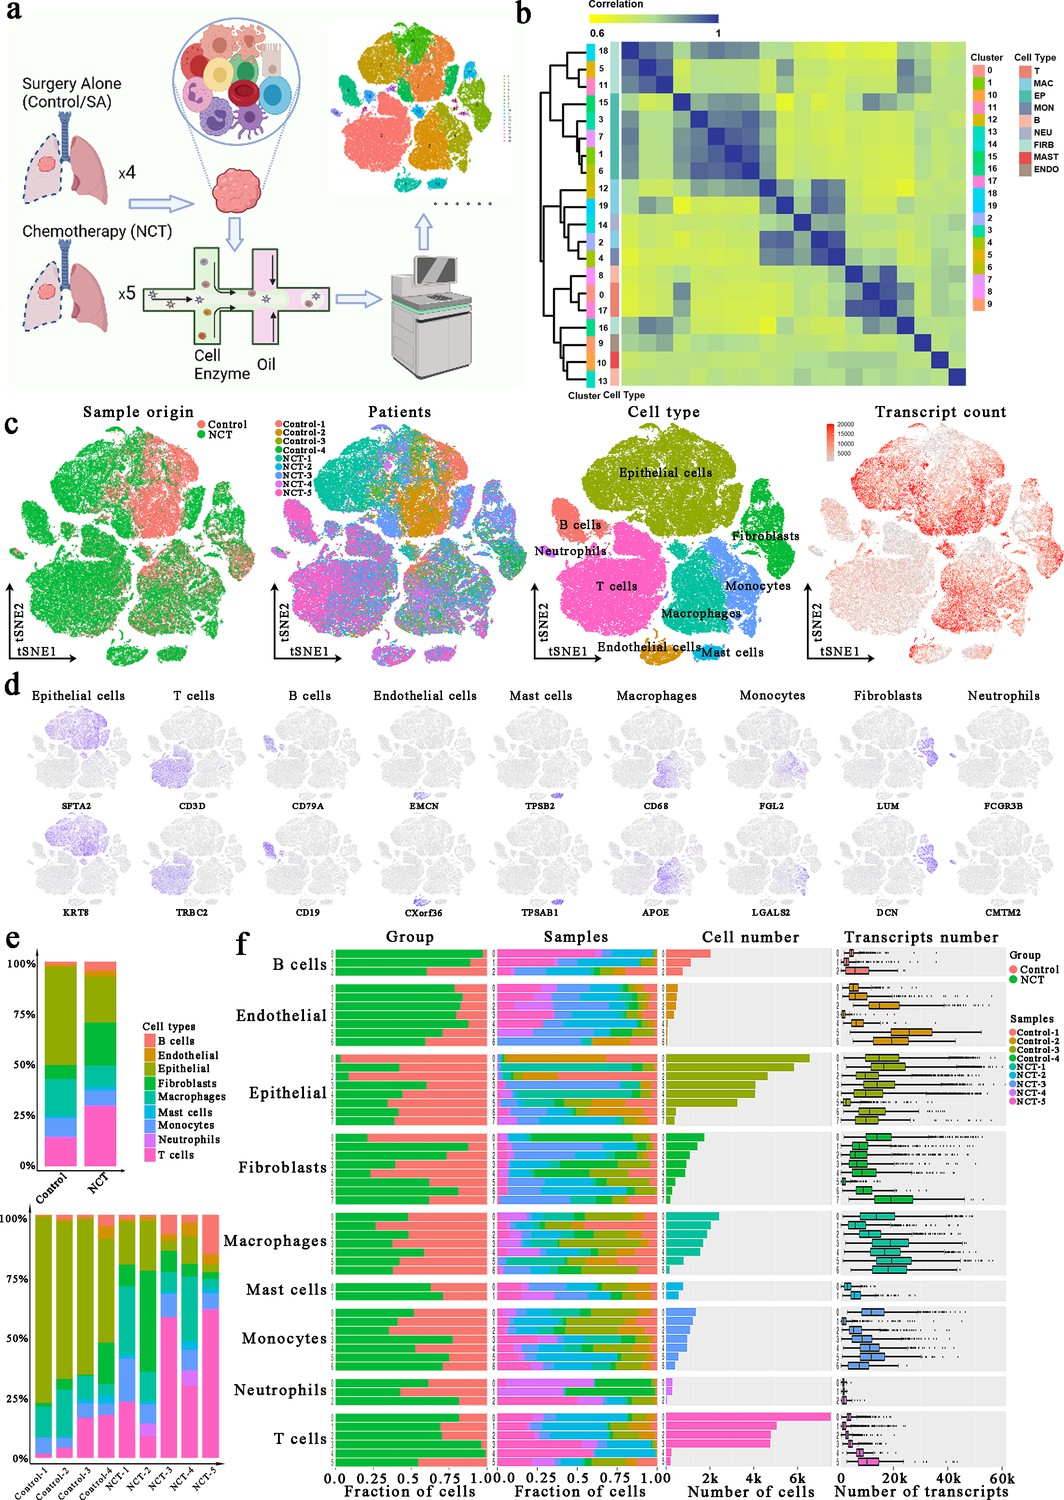
Single-cell atlas of lung adenocarcinoma (LUAD) tissues from the control and neoadjuvant chemotherapy (NCT) group.
(a) Workflow depicting collection and processing of LUAD samples for scRNA-seq analysis. (b) Consensus clustering based on the correlations among the 20 clusters identified through the t-distributed random neighborhood embedding (TSNE) algorithm. (c) tSNE of the 83,622 cells enrolled here, with each cell color indicating: its sample type of origin, the corresponding patient, predicted cell type, and the transcript counts. (d) Expression of marker genes for the cell types defined above each panel. (e) The proportion of each cell type in different groups and samples. (f) For each of the 8 epithelial subclusters and 43 non-epithelial clusters (left to right): the fraction of cells originating from the three groups, the fraction of cells originating from each of the nine patients, the number of cells and box plots of the number of transcripts (with plot center, box, and whiskers corresponding to the median, IQR and 1.5× IQR, respectively).
Figure 1—figure supplement 1
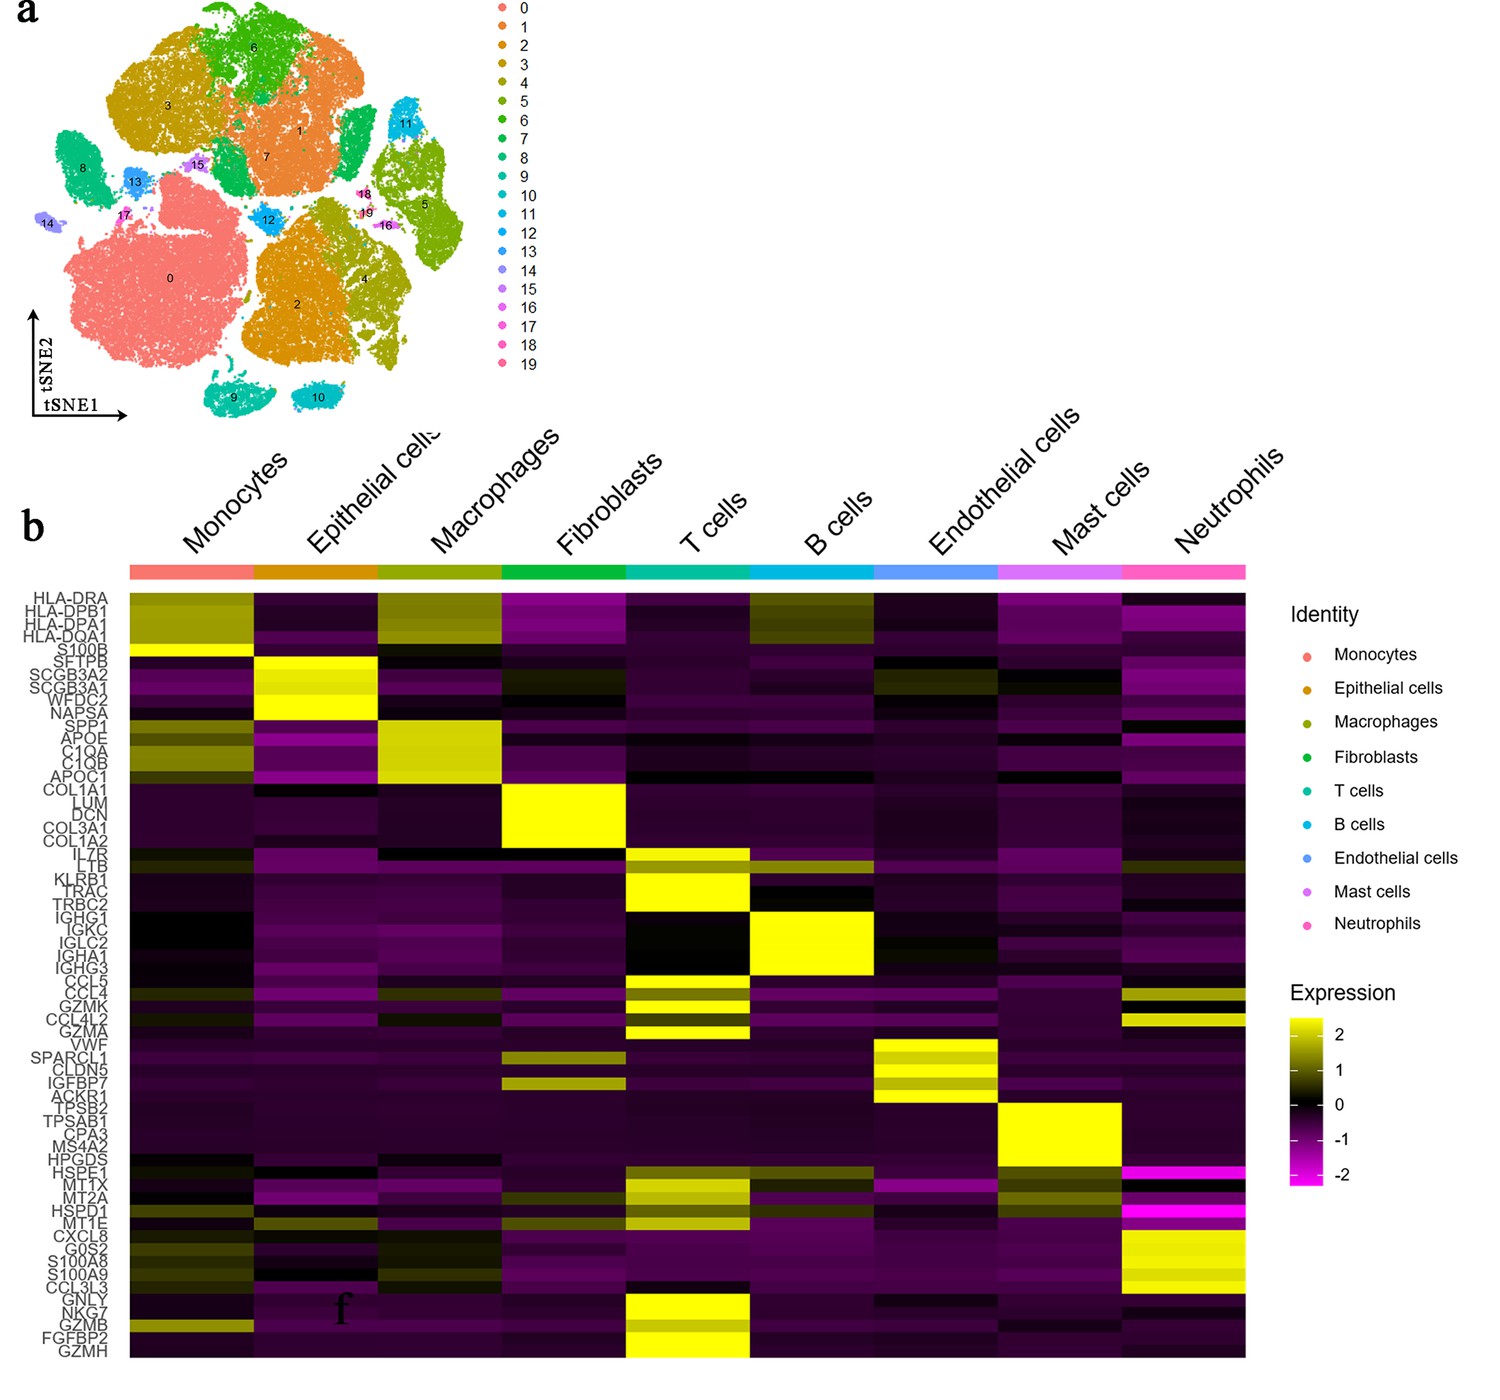
tSNE clusters and marker genes across cell types.
(a) The t-distributed random neighborhood embedding (TSNE) plots of all clusters in this research. (b) The heatmap shows the marker genes in the different cell types.
Figure 2
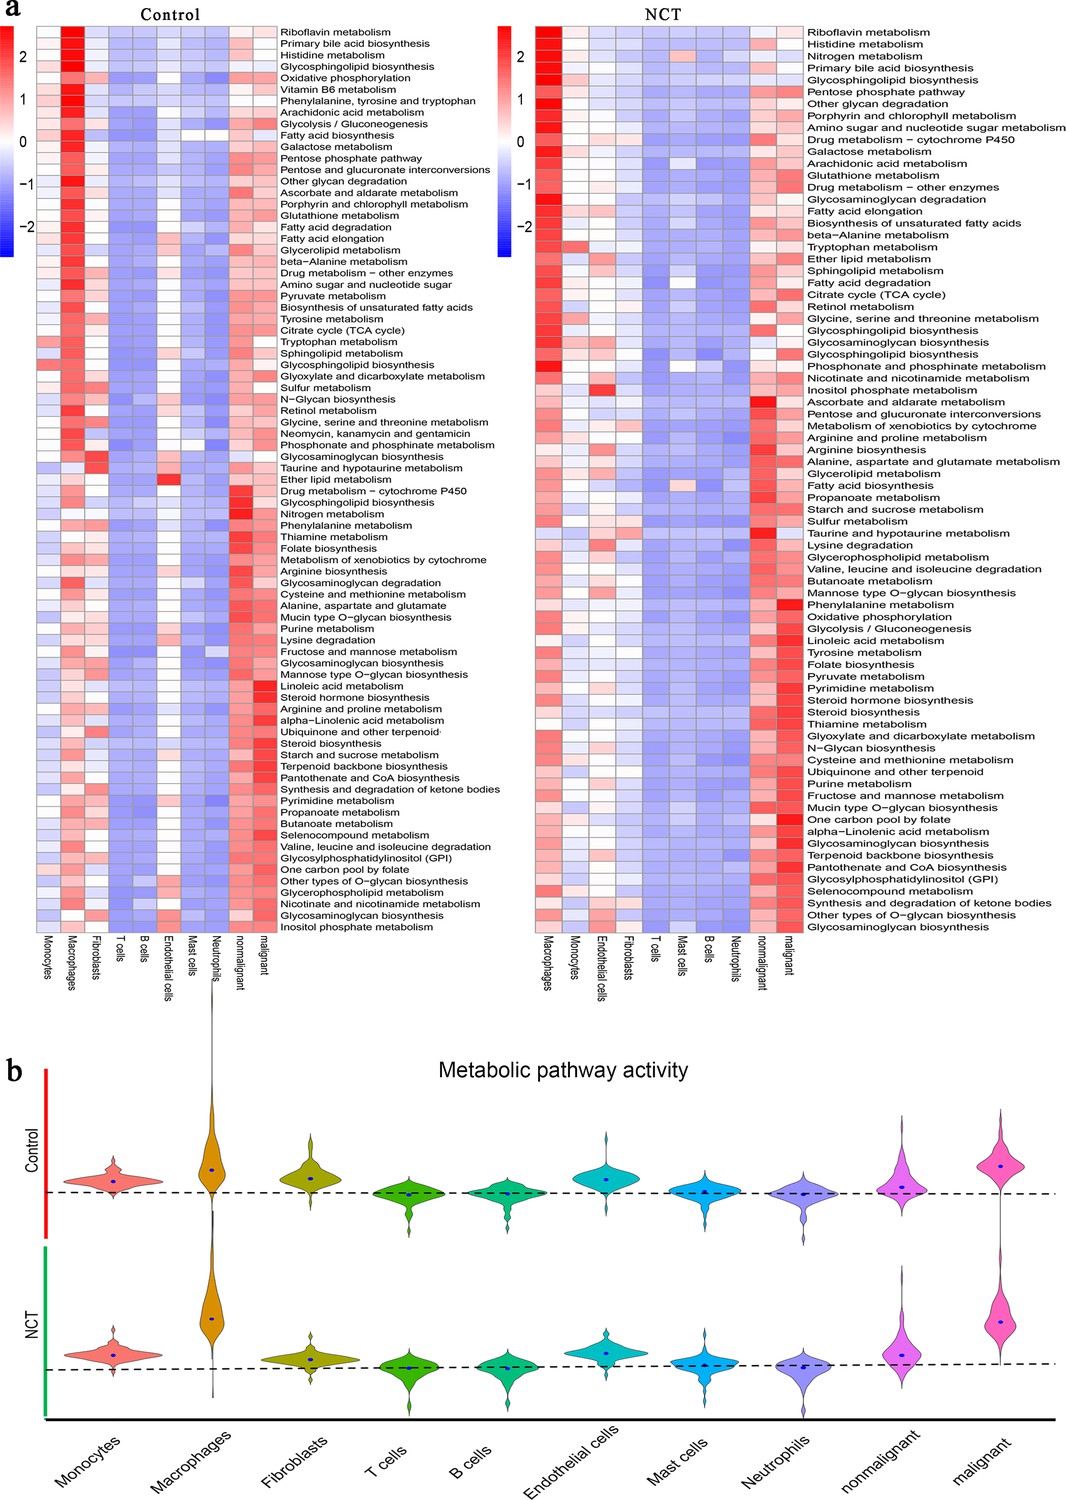
Metabolic reprogramming in lung adenocarcinoma driven by neoadjuvant chemotherapy (NCT).
(a) The metabolic pathway activities of different cells from the control group and NCT group showed significant differences. (b) The metabolic pathway activity of macrophages and malignant cells increased significantly after chemotherapy.
Figure 3 with 1 supplement
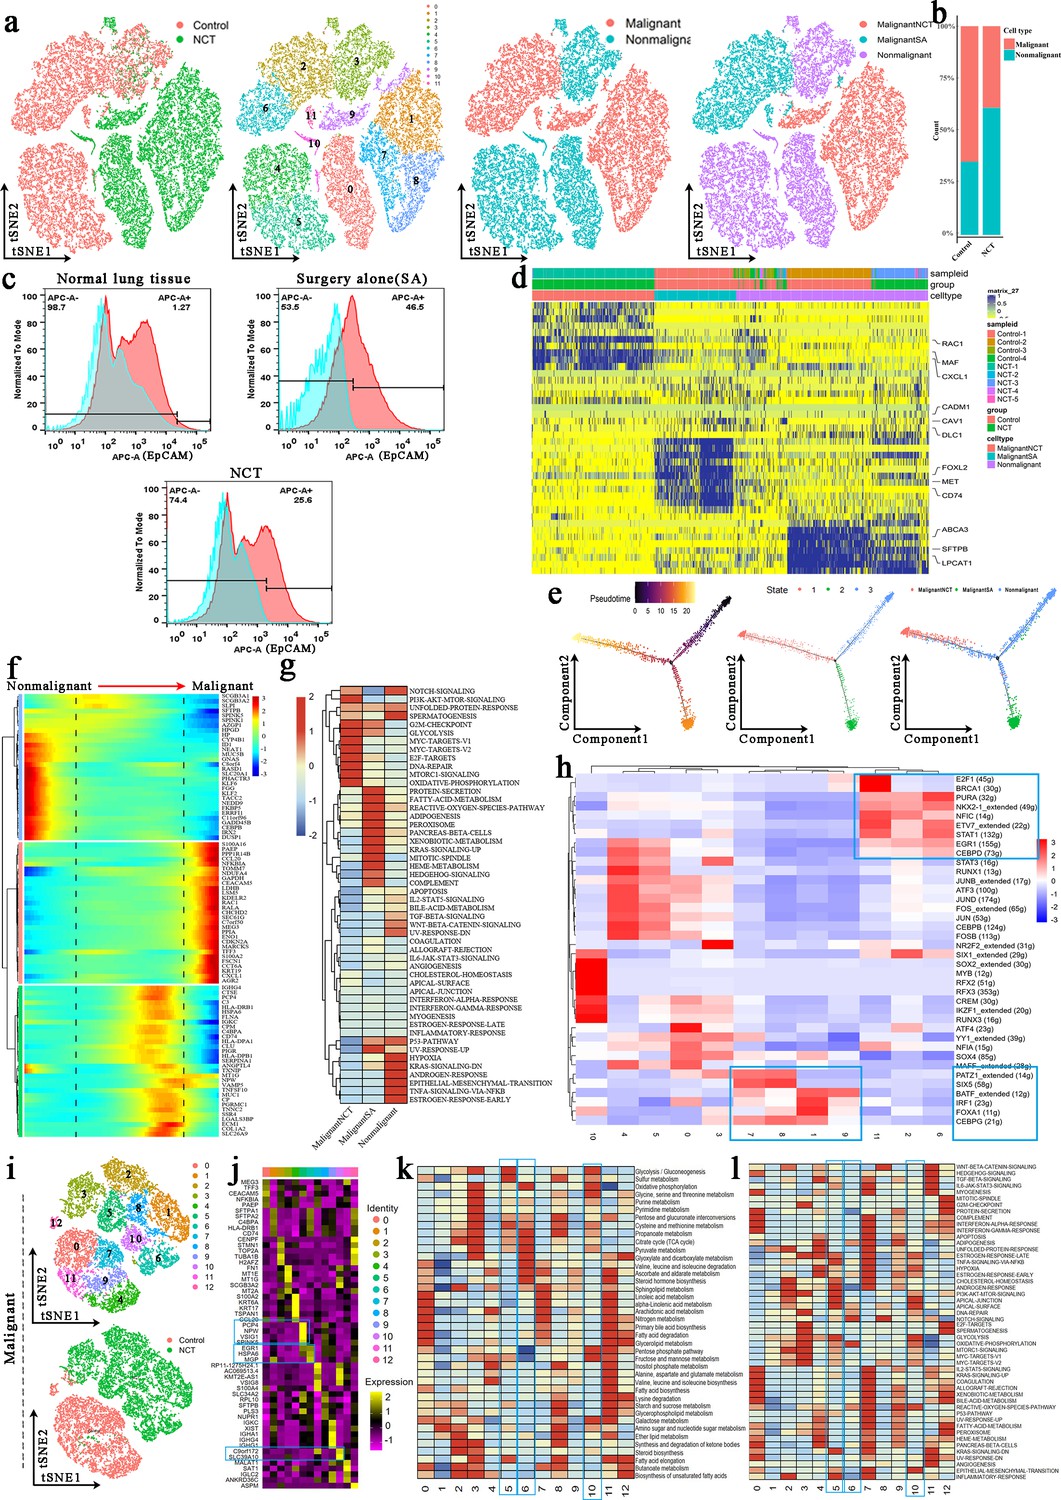
Tumor cells and epithelial cells had significant phenotypic changes before and after chemotherapy.
(a) The t-distributed random neighborhood embedding (TSNE) plots and overview of the tumor cells and epithelial cells. (b) The proportion of malignant cells and nonmalignant cells in the control group and neoadjuvant chemotherapy (NCT) group. (c) Flow cytometry showed that the proportion of malignant cells was significantly reduced after chemotherapy and immunotherapy. (d) Marker genes of MalignantSA cells, MalignantNCT cells, and nonmalignant cells. (e) Pseudotime analysis showed that nonmalignant cells evolved in two directions. (f) The heatmap shows that a series of genes play an important role in transforming epithelial cells into tumor cells. (g) Gene Set Variation Analysis (GSVA) was performed for malignant and nonmalignant cells. (h) Single-Cell Regulatory Network Inference and Clustering (SCENIC) analysis revealed the hub genes in the malignant transformation of epithelial cells. (i) The tSNE plots for reclustered malignant cells. (j) Marker genes of 13 subclusters from malignant cells. (k) Metabolic characteristics in different malignant cell subclusters. (l) GSVA reveals the characteristics of pathway activity in different malignant cell subclusters.
Figure 3—figure supplement 1
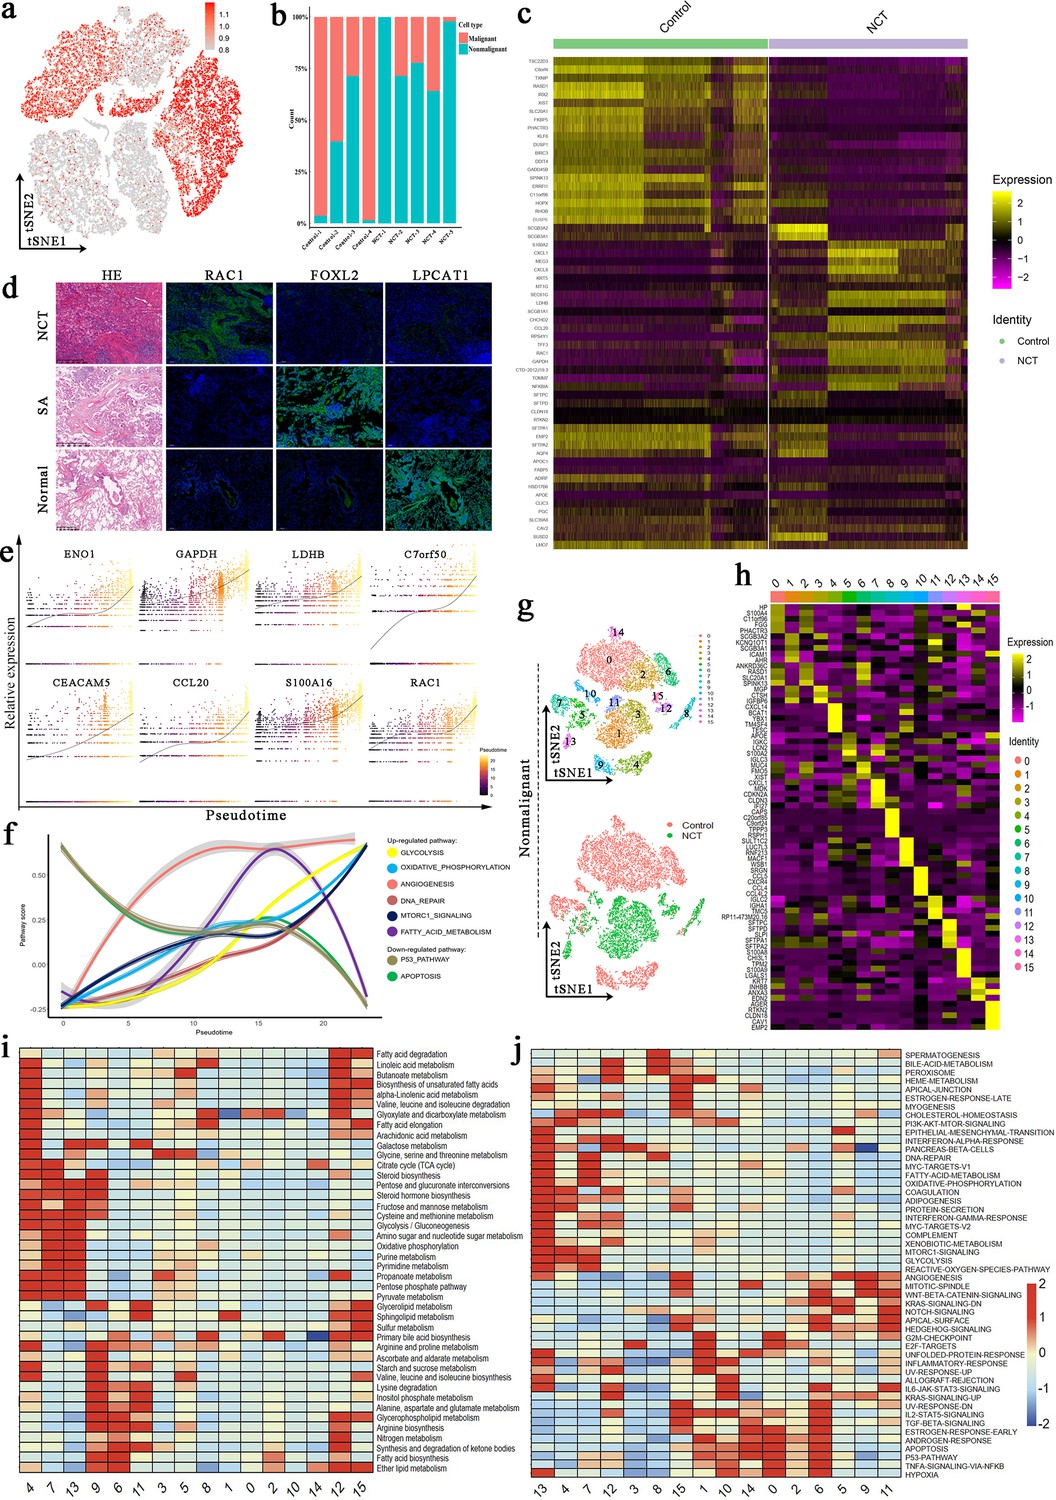
CNVs, gene expression, and pathway activity of malignant and nonmalignant epithelial cells.
(a) Copy number variations (CNVs) of malignant and nonmalignant epithelial cells. (b) The proportion of malignant cells and nonmalignant cells from different patients. (c) The heatmap shows differentially expressed genes of epithelial cells in the control group and neoadjuvant chemotherapy (NCT) group. (d) Immunofluorescence shows LPCAT1, FOXL2, and RAC1 were highly expressed in normal lung tissues, the control group, and the NCT group, respectively. (e) Some genes played an important role in the transformation of epithelial cells into tumor cells. (f) Changes in the activity of several important pathways during the transformation of epithelial cells to tumor cells. (g) The t-distributed random neighborhood embedding (TSNE) plots and overview of the nonmalignant cells. (h) Heatmap of marker genes for nonmalignant cells subclusters. (i) Metabolic characteristics in different nonmalignant cell subclusters. (j) Gene Set Variation Analysis (GSVA) reveals the characteristics of pathway activity in different nonmalignant cell subclusters.
Figure 4 with 1 supplement

The scRNA profile of stromal cells derived from lung adenocarcinoma (LUAD) samples in the control and neoadjuvant chemotherapy (NCT) groups.
(a) The t-distributed random neighborhood embedding (TSNE) plots an overview of the six clusters of stromal cells. (b) Proportions of the six predicted clusters of stromal cells in different groups and samples. (c) Heatmap exhibiting the expression level of marker genes in each stromal cell cluster. (d) Gene Set Variation Analysis (GSVA) estimated the pathway activation levels of different stromal cell subtypes. The scores have been normalized. (e) GSVA revealed the activation level of hallmark pathways in stromal cells (control vs. NCT groups) (f) Heatmap exhibiting the expression level of marker genes in each fibroblast cluster. (g, h) The tSNE plots reveal the group origins (g) and predicted subclusters (h) of fibroblast. (i, j) GSVA estimated the pathway activation levels of different fibroblast subtypes.
Figure 4—figure supplement 1
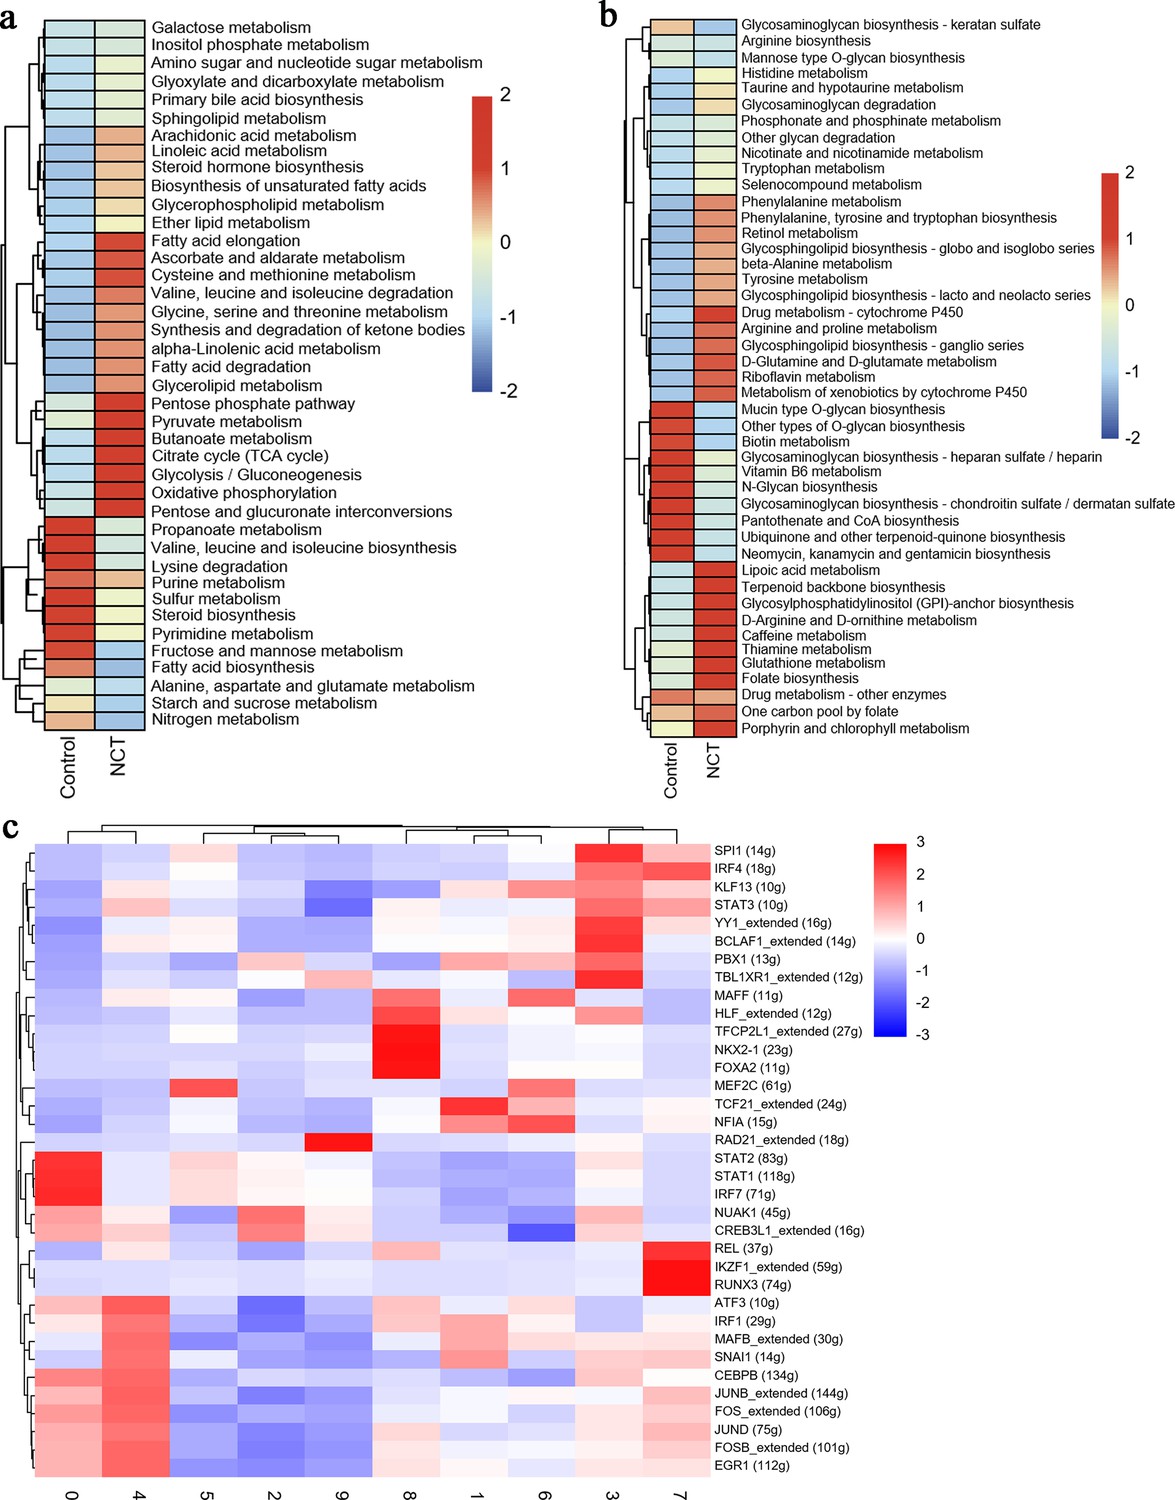
Metabolic and transcriptional analysis of fibroblasts.
(a) The activity of various metabolic processes in fibroblasts from the control group and neoadjuvant chemotherapy (NCT) group. (b) Gene Set Variation Analysis (GSVA) was performed for fibroblasts from the control group and NCT group. (c) Single-Cell Regulatory Network Inference and Clustering (SCENIC) analysis revealed the hub genes in fibroblast.
Figure 5
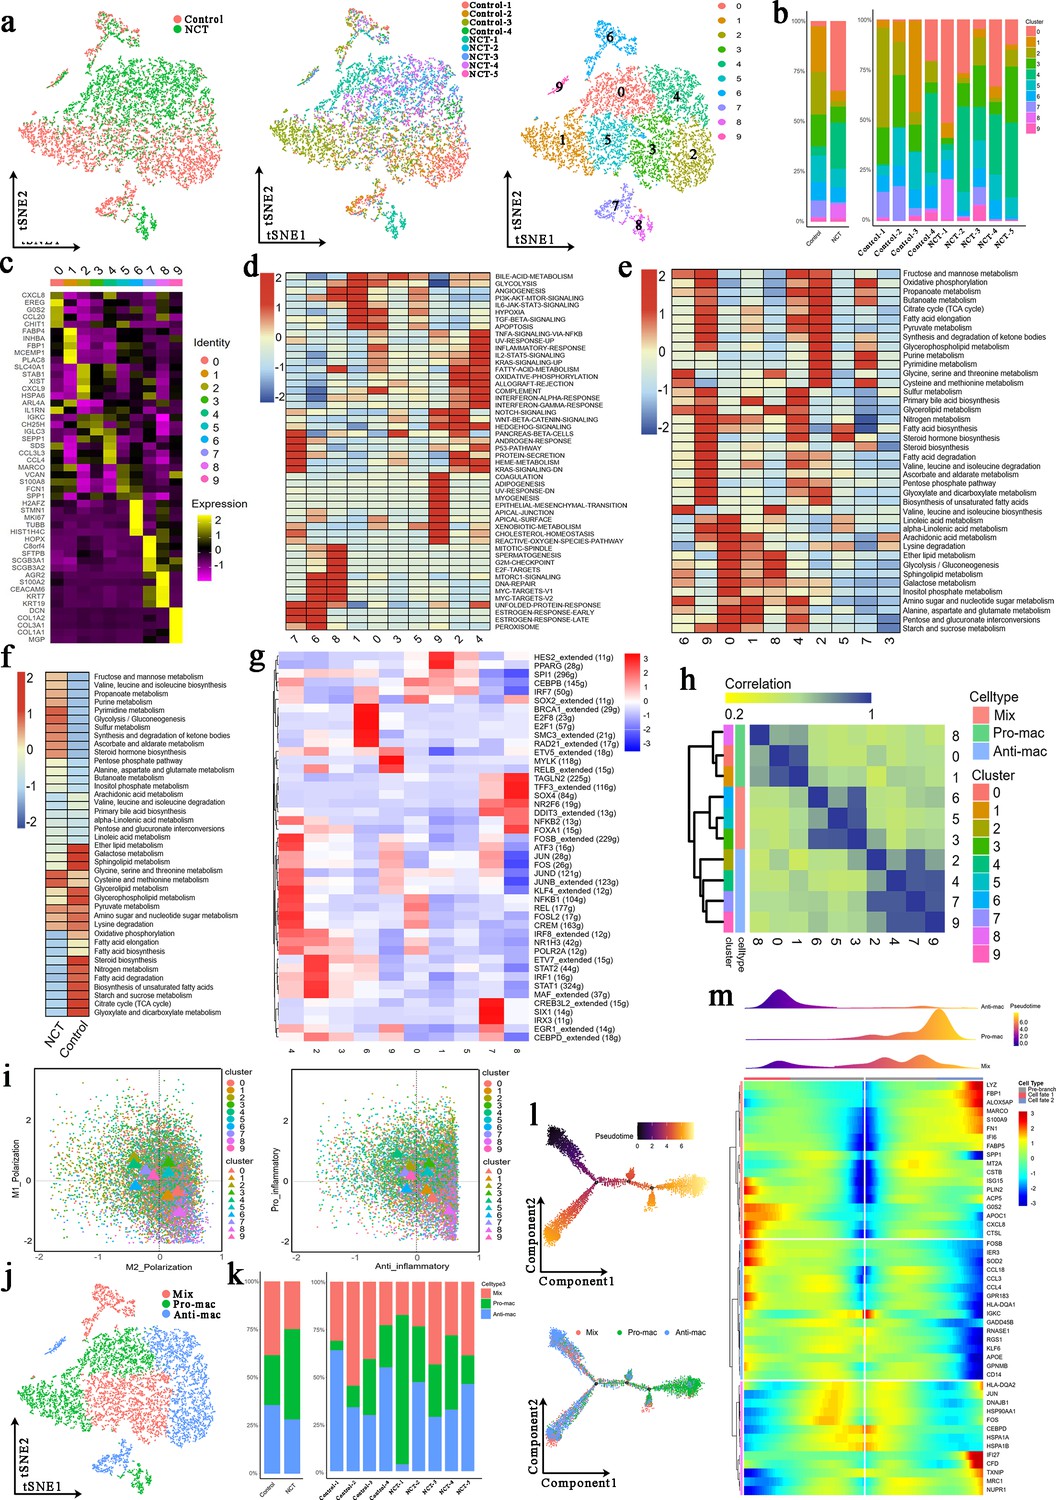
Three newly identified subtypes of tumor-associated macrophages (TAMs) display distinct genetic and metabolic features.
(a) The t-distributed random neighborhood embedding (TSNE) plots show the group origins, sample origins, and clusters of TAMs. (b) Proportions of the 10 clusters of TAMs in different groups and samples. (c) Marker genes of the 10 clusters of TAMs. (d) Gene Set Variation Analysis (GSVA) was performed for the 10 clusters of TAMs. (e) The activity of various metabolic processes in the 10 clusters of TAMs. (f) GSVA was performed for TAMs from the control group and neoadjuvant chemotherapy (NCT) group. (g) Single-Cell Regulatory Network Inference and Clustering (SCENIC) analysis was performed for the 10 clusters of TAMs. (h) Consensus clustering based on the correlations among the 10 clusters of TAMs identified through the tSNE algorithm. (i) Polarization score (left) and inflammatory score (right) for 10 clusters of TAMs based on the expression of polarization marker genes and inflammatory genes. (j) The tSNE plots for three types of TAMs. (k) Proportions of the three subtypes of TAMs in different groups and samples. (l) Development trajectory analysis for the three subtypes of TAMs. (m) Pseudotime analysis revealed a series of genes that affect the differentiation and development of macrophages.
Figure 6 with 4 supplements
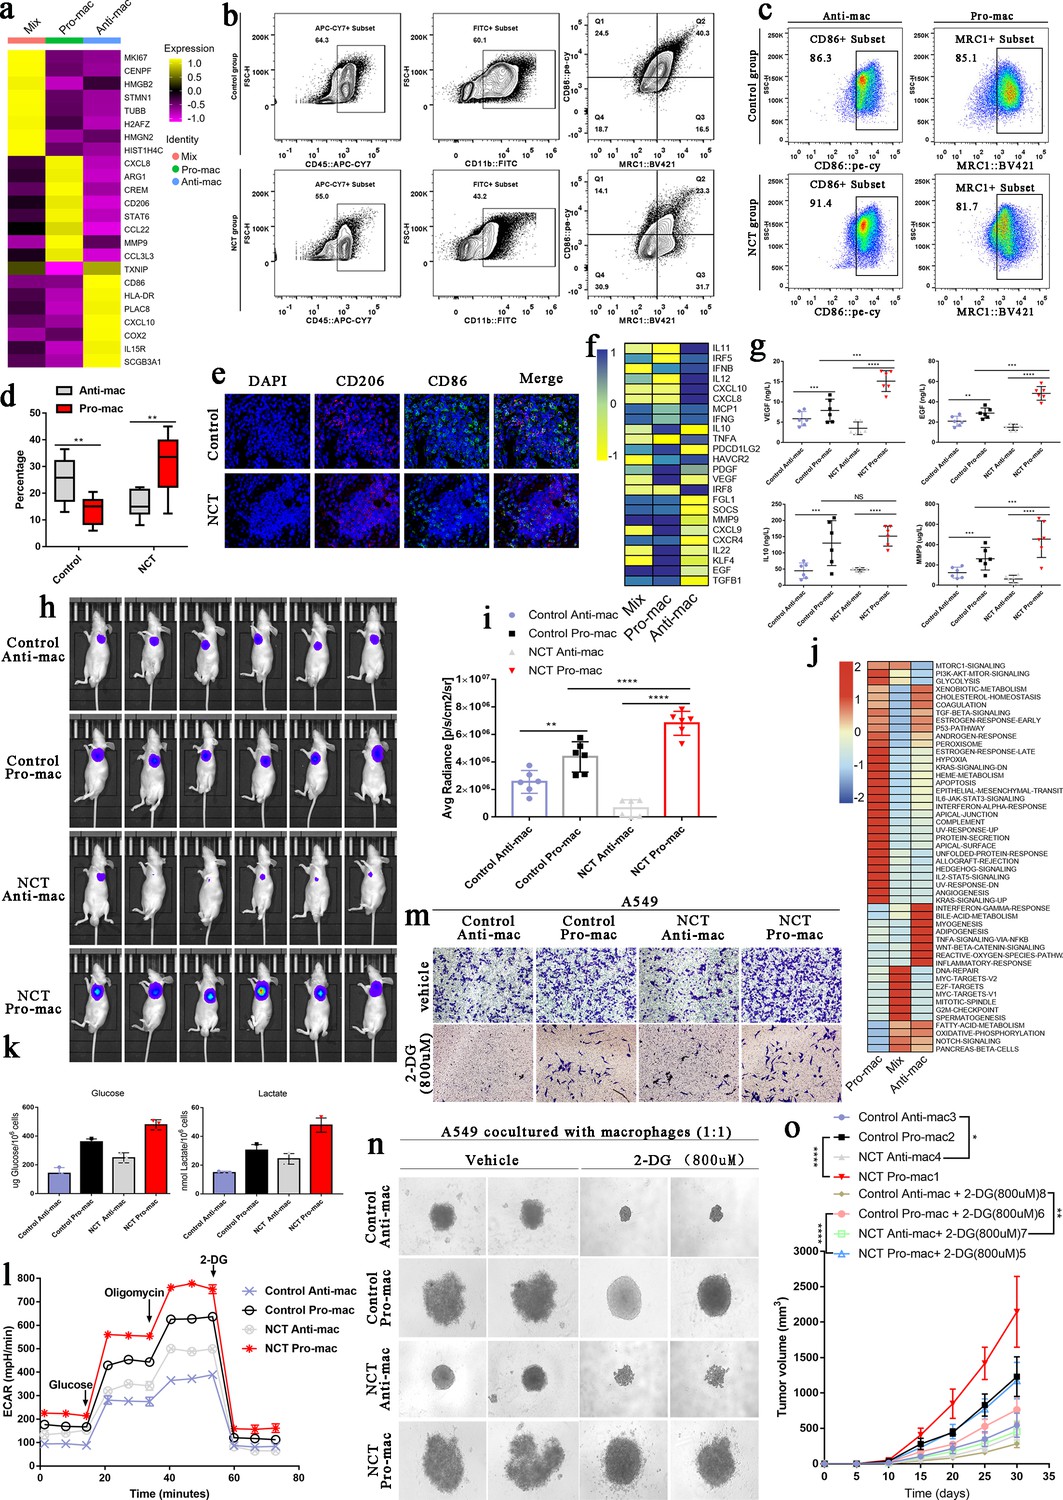
Metabolic switching in tumor-associated macrophages (TAMs) contributed to diametrical effects on tumor cells.
(a) The heatmap shows the essential marker genes for three subtypes of TAMs. (b) Based on Pro-mac and Anti-mac marker genes, these two types of cells were sorted by flow cytometry from lung adenocarcinoma tissue. (c) Flow cytometry verified the sorted cells. (d) The proportion changes of Pro-mac and Anti-mac cells in lung adenocarcinoma tissues before and after chemotherapy. (e) Immunofluorescence showed the changes in the proportion of TAMs with high CD206 and CD86 after neoadjuvant therapy. (f) The heatmap shows the differences in the cytokines secreted by the three subtypes of macrophages. (g) ELISA detected the secretion of VEGF, EGF, IL10, and MMP9. (h) The intensity of fluorescence changes in Luciferase-labeled A549 cells mixed with different TAMs. (i) The histogram shows the average fluorescence intensity emitted by the subcutaneous tumor. (j) Gene Set Variation Analysis (GSVA) performed for Pro-mac, Anti-mac, and Mix. (k) Glucose uptake and lactate production in the TAMs cell subtypes. (l) Seahorse XFe96 cell outflow analyzer detected the glycolysis level of TAMs cell subtypes (extracellular acidification rate: ECAR). (m) Transwell experiment detected the influence of TAMs subtypes on the invasion ability of A549 cells. (n) The 3D cell culture experiment detected the effect of 2-DG on the spheroidization ability of A549 cells when cultured with subtypes of TAMs. (o) In vivo experiments verified the effect of 2-DG on the tumorigenesis ability of A549 after inhibiting glycolysis of TAMs. All error bars are mean ± SD. NS, not significant. ***p<0.001, **p<0.01, *p<0.05; determined by two-tailed Student’s t-test (95% CI).
Figure 6—figure supplement 1
The scRNA profile of T cells derived from lung adenocarcinoma (LUAD) samples in the control, neoadjuvant chemotherapy, and immunotherapy groups.
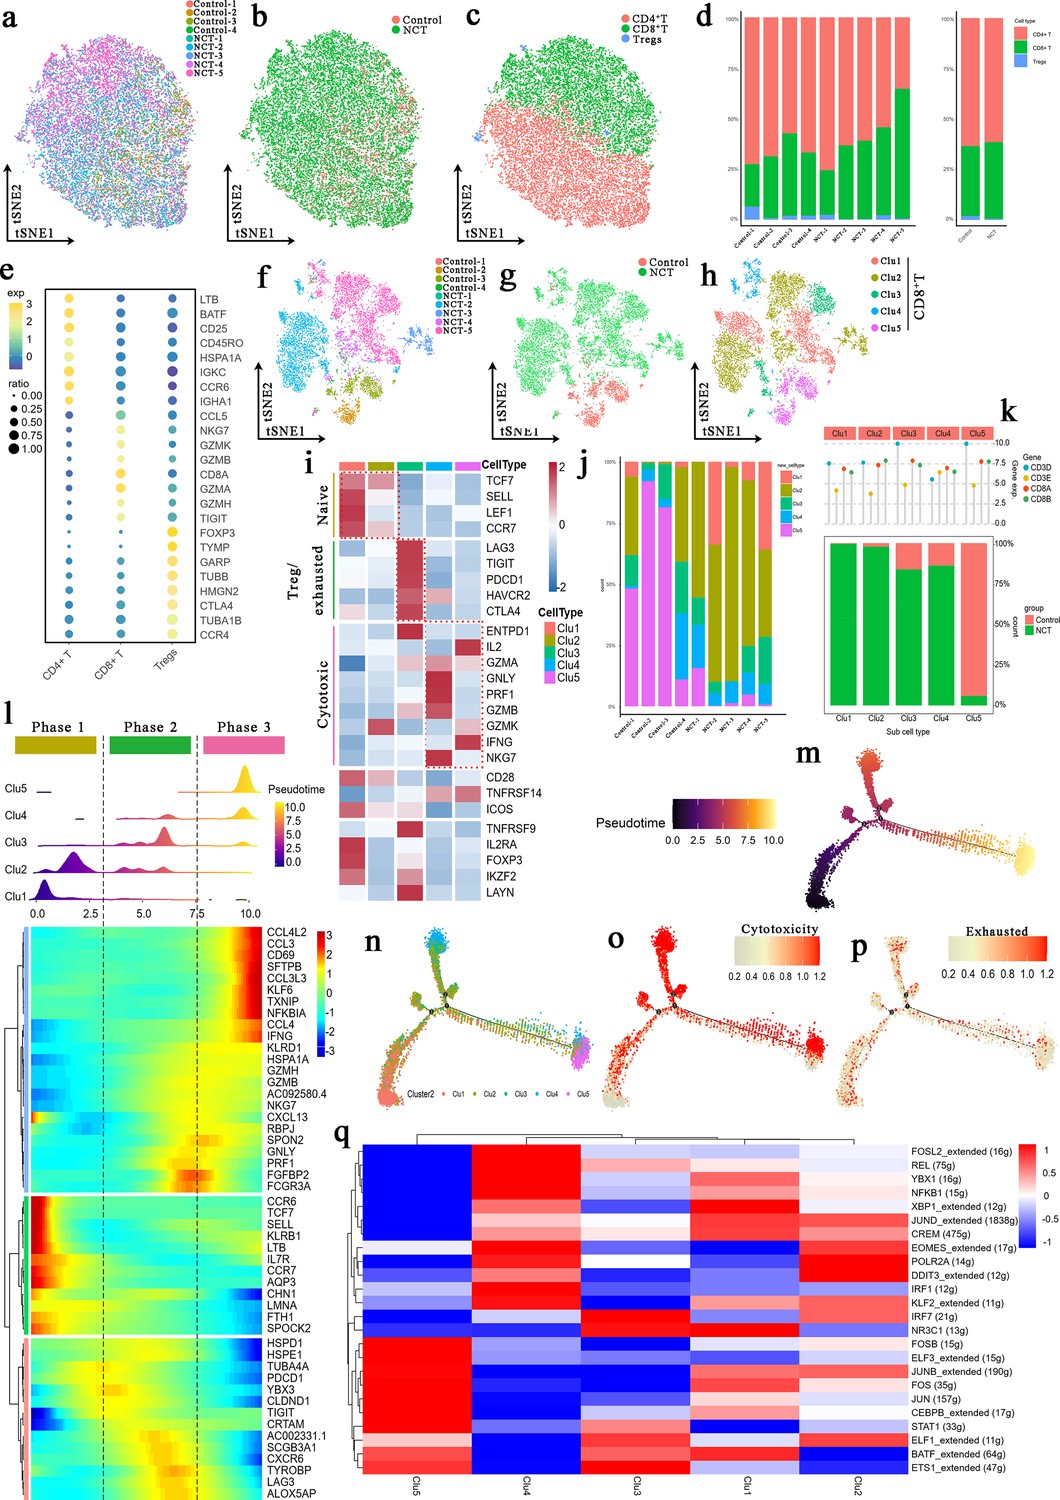
(a–c) The t-distributed random neighborhood embedding (TSNE) plots reveal the sample origins (a), group origins (b), and predicted clusters (c) of T cells. (d) The three indicated clusters of T cells (CD4+ T, CD8+ T, and Tregs) were reported in different groups and samples. (e) Bubble plot exhibiting the expression level of marker genes in each T cell cluster. (f–h) The tSNE plots reveal the sample origins (f), group origins (g), and predicted subclusters (h) of CD8+ T cells. (i) Heatmap exhibiting the expression level of marker genes corresponding to naïve, Treg/exhausted, and cytotoxic phenotypes in each CD8+ T cell subcluster. (j, k) Proportions of the five predicted clusters of CD8+ T cells in different samples (j) and groups (k). (l) Dynamic changes in gene expression of CD8+ T cells during the transition (divided into three phases). (m–p) Pseudotime-ordered analysis of CD8+ T cells (m–n) revealing the dynamics of their cytotoxic (o) and exhausted levels (p). (l) Single-Cell Regulatory Network Inference and Clustering (SCENIC) analysis of CD8+ T cells.
Figure 6—figure supplement 2
The scRNA profile of B cells derived from lung adenocarcinoma (LUAD) samples in the control, neoadjuvant chemotherapy, and immunotherapy groups.
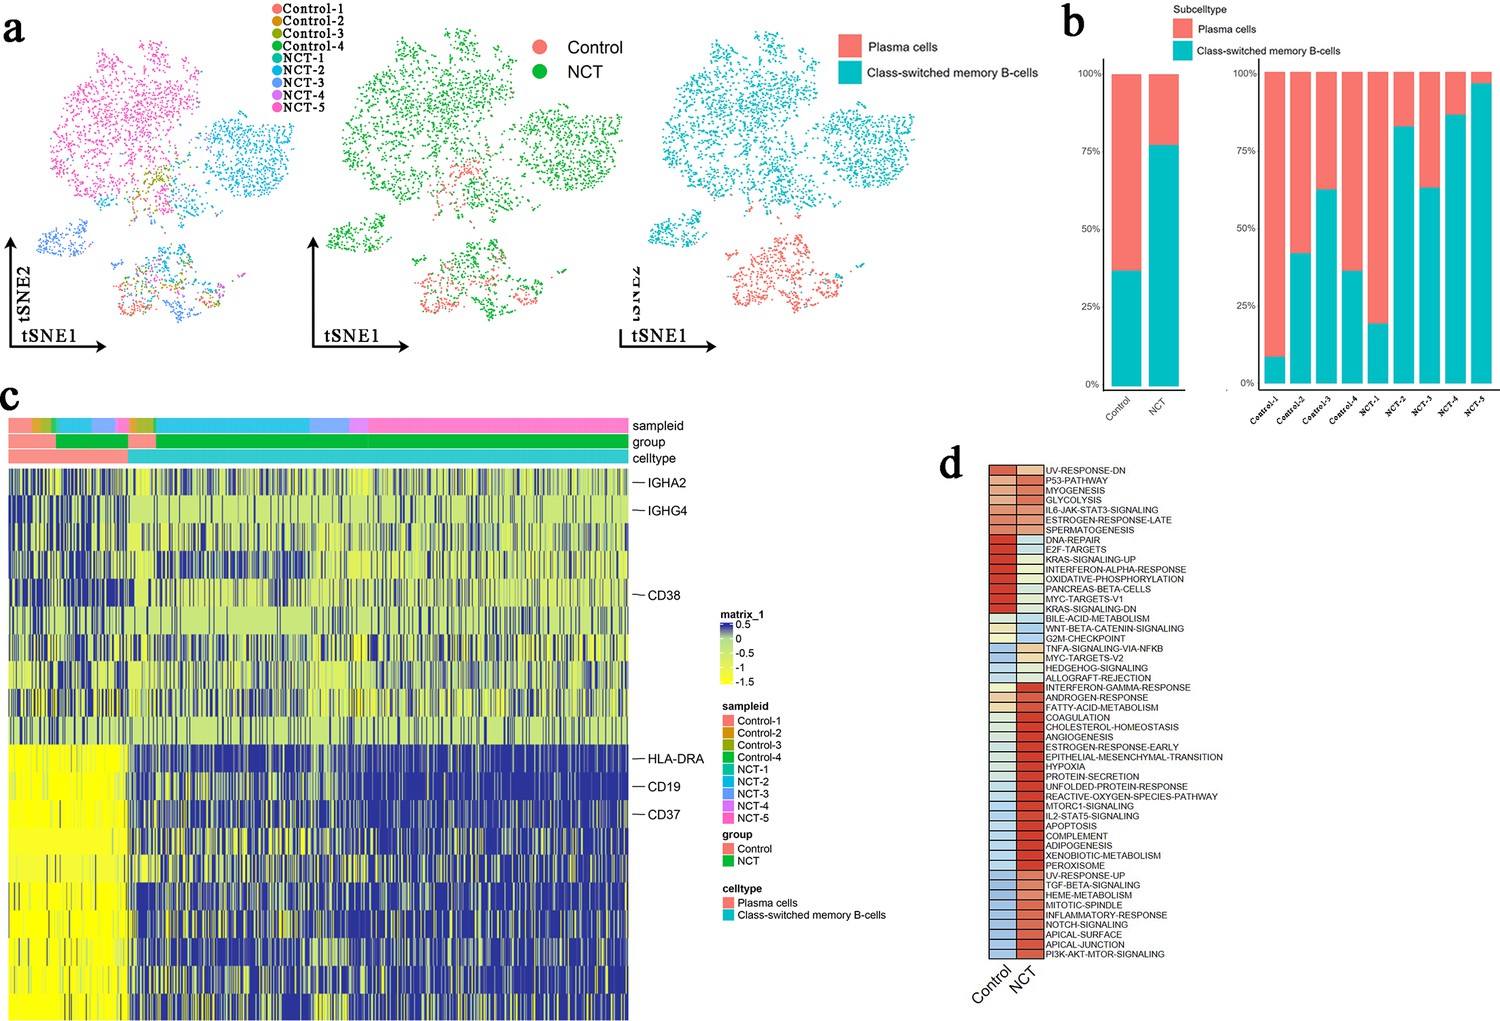
(a) The t-distributed random neighborhood embedding (TSNE) plots reveal the sample origins, group origins, and predicted clusters of B cells. (b) The two predicted clusters of B cells (plasma cells, class-switched memory B-cells) were reported in different groups and samples. (c) Heatmap exhibiting the expression level of marker genes in each B cell cluster. (d) Gene Set Variation Analysis (GSVA) estimated the pathway activation levels of different B cell subtypes.
Figure 6—figure supplement 3
Crosstalk between cancer and immune cells.
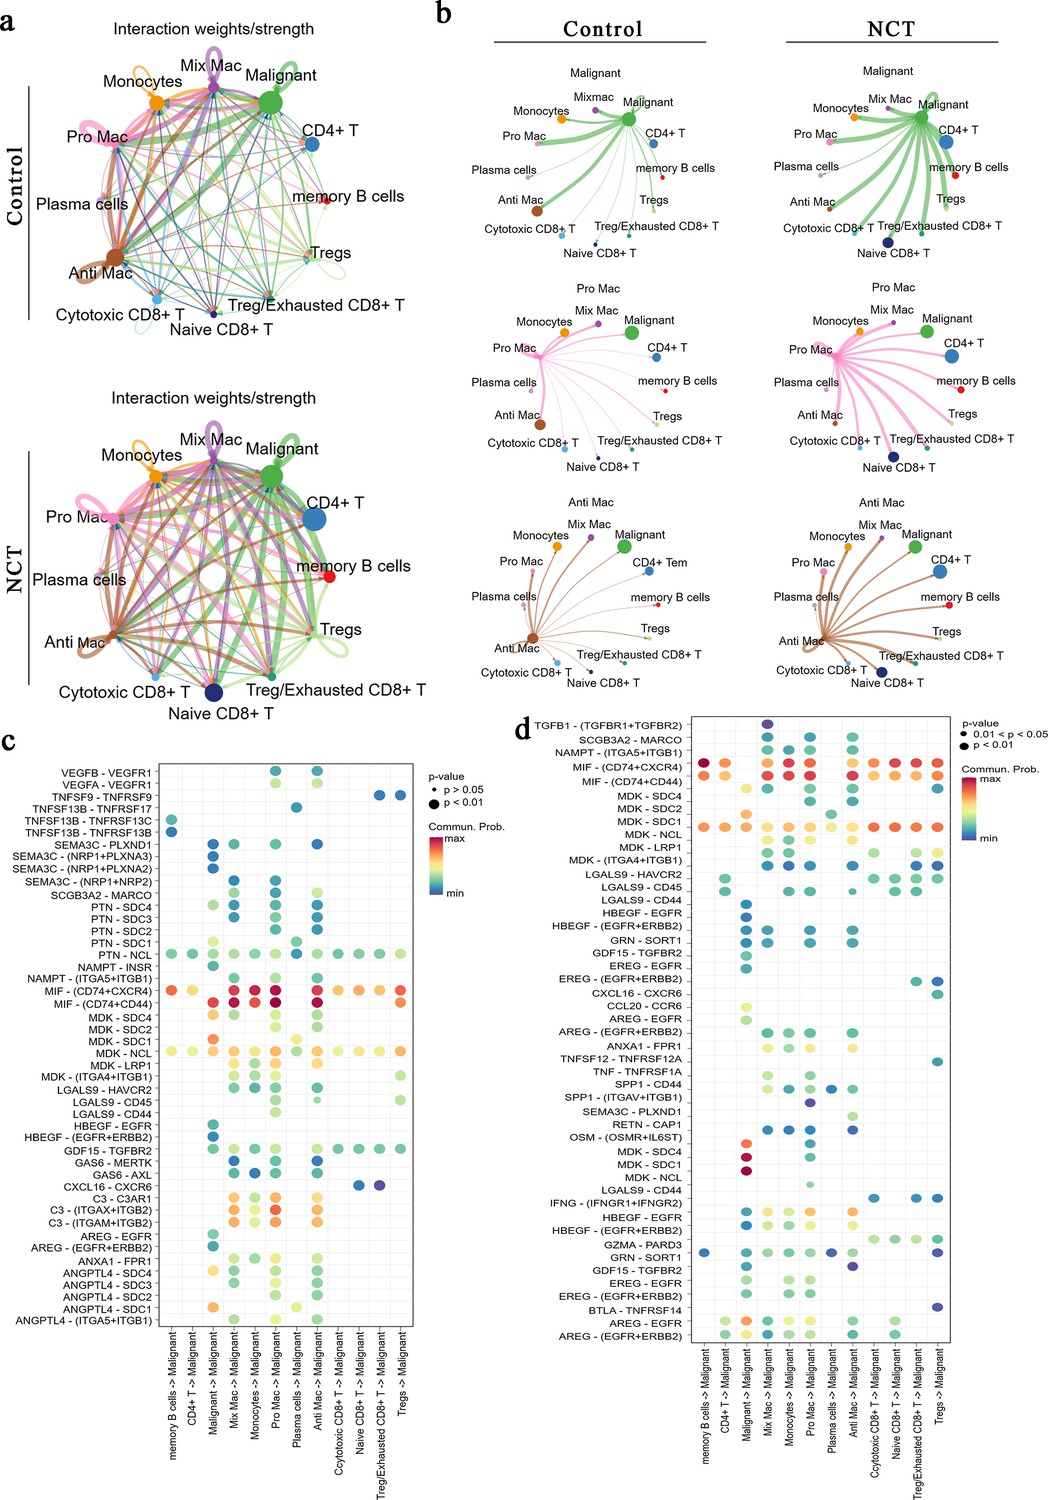
(a) Overview of selected ligand–receptor interactions of cancer cells and immune cells in the control and neoadjuvant chemotherapy (NCT) groups. The line thickness indicates the number of ligands when cognate receptors are present in the recipient cell type. The loops indicate autocrine circuits. (b) Detailed view of the ligands expressed by each cell type and the other cell types. (c, d) Bubble plot revealing the specific ligand–receptor interactions between cancer cells and immune cells in the NCT group. The circle size indicates p values, with the scale to the right (permutation test), and color indicates communication probability.
Figure 6—figure supplement 4
Crosstalk between cancer and immune cells.
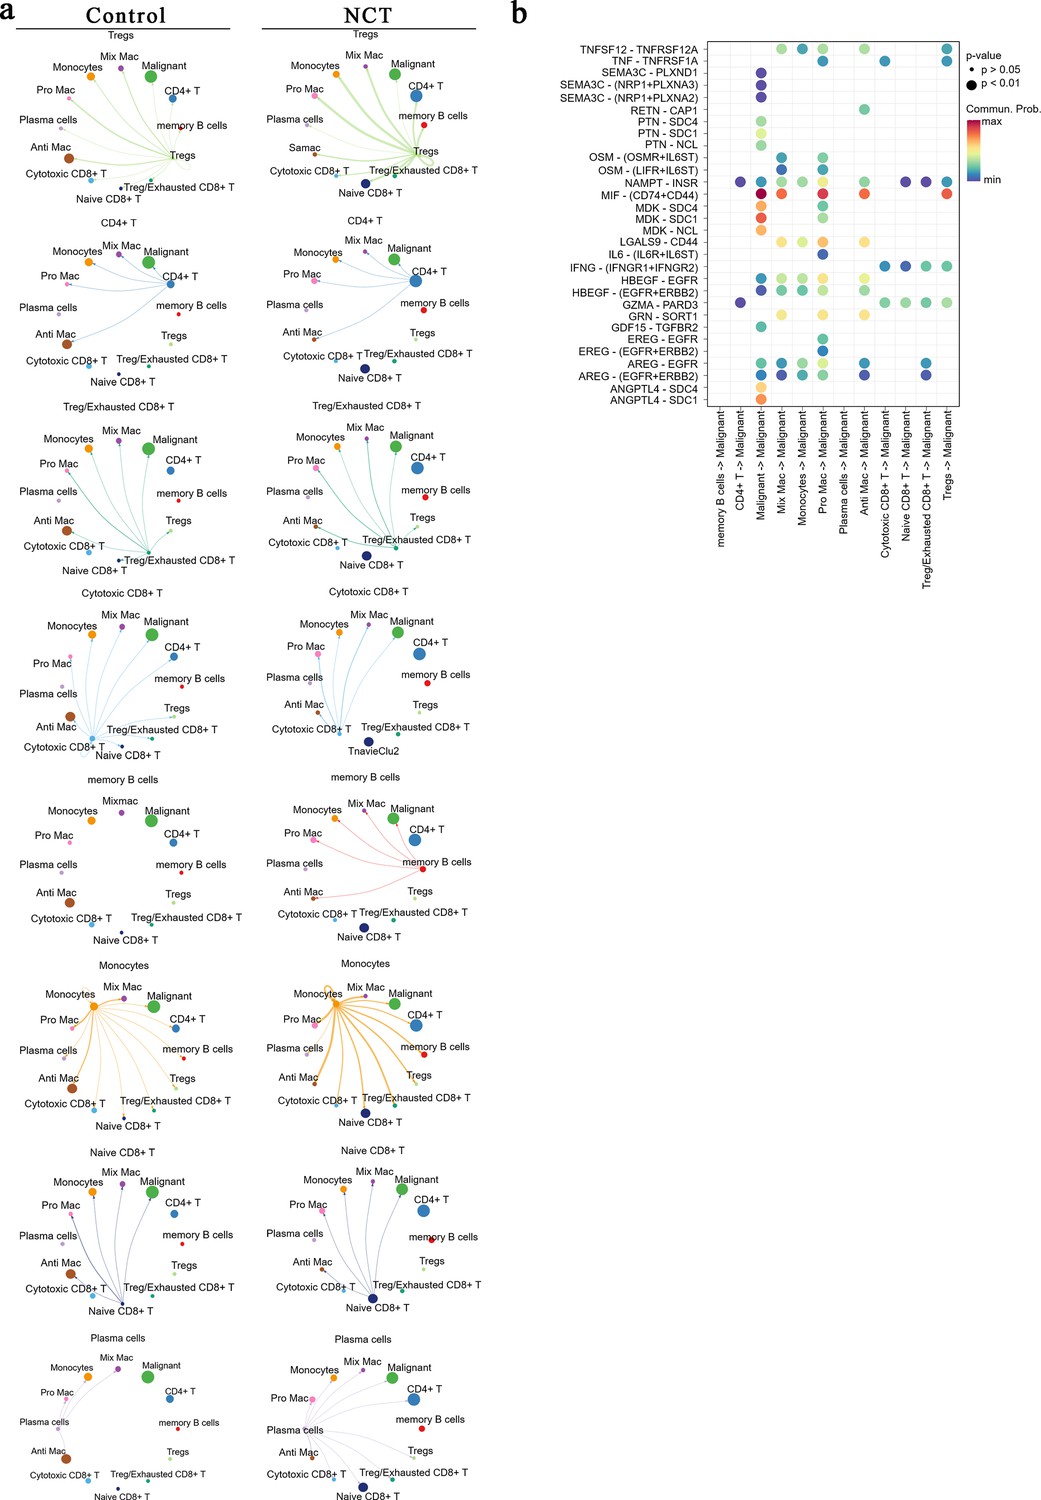
(a) Each cell type and the other cell types expressed some of the ligands. (b) Bubble plot revealing the specific ligand–receptor interactions between cancer cells and immune cells in the control group. The circle size indicates p-values, with the scale to the right (permutation test), and color indicates communication probability.
Additional files
-
Supplementary file 1
The table shows the comparative analysis of differences in genetic testing results for all samples in this study.
- https://cdn.elifesciences.org/articles/95988/elife-95988-supp1-v1.docx
-
Supplementary file 2
Clinical characteristics of the patients included in this study.
- https://cdn.elifesciences.org/articles/95988/elife-95988-supp2-v1.docx
-
MDAR checklist
- https://cdn.elifesciences.org/articles/95988/elife-95988-mdarchecklist1-v1.pdf
Download links
A two-part list of links to download the article, or parts of the article, in various formats.
Downloads (link to download the article as PDF)
Open citations (links to open the citations from this article in various online reference manager services)
Cite this article (links to download the citations from this article in formats compatible with various reference manager tools)
Unveiling chemotherapy-induced immune landscape remodeling and metabolic reprogramming in lung adenocarcinoma by scRNA-sequencing
eLife 13:RP95988.
https://doi.org/10.7554/eLife.95988.3


