Activation of polycystin-1 signaling by binding of stalk-derived peptide agonists
- Center for Computational Biology and Department of Molecular Biosciences, University of Kansas, United States
- Clinical Laboratory Sciences, University of Kansas Medical Center, United States
- The Jared Grantham Kidney Institute, University of Kansas Medical Center, United States
- Department of Pharmacology and Computational Medicine Program, University of North Carolina, United States
- Department of Physics, and Center for Biophysics and Computational Biology, Temple University, United States
- Department of Biochemistry and Molecular Biology, University of Kansas Medical Center, United States
Figures
Figure 1 with 2 supplements
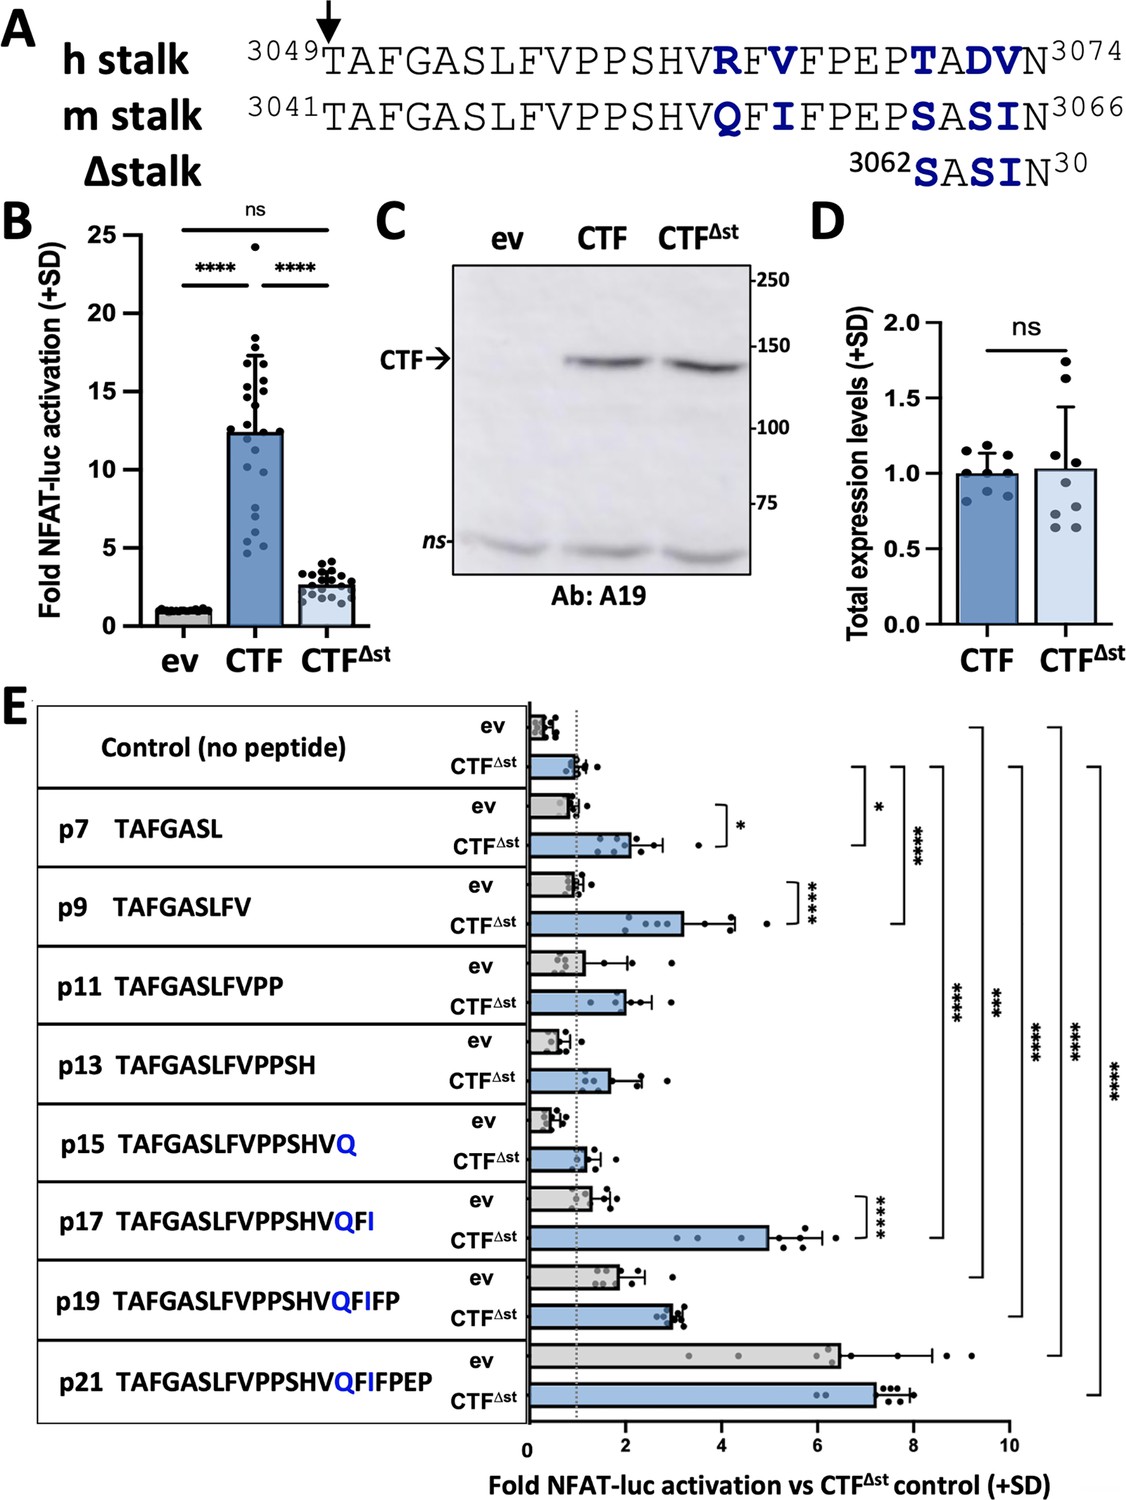
Synthetic peptides derived from the stalk sequence of polycystin-1 (PC1) can stimulate the signaling of stalkless PC1 C-terminal fragment (CTF).
(A) Alignment of CTF stalk sequences from human (h) and mouse (m) PC1. CTF∆st has a 21-residue deletion from the N-terminal end of the stalk region. Arrow, GPCR proteolysis site (GPS) cleavage site. Non-identical residues are shown in bolded blue. (B) Activation of the NFAT-luc reporter by transfected mCTF or mCTF∆st expression constructs shown relative to empty expression vector (ev) as means (+ standard deviation, SD) of three wells/construct from each of seven independent experiments. (C) Representative Western blot of total cell lysates from one of the experiments in (B), probed with antisera A19 against mouse PC1 C-tail. ns, non-specific. (D) Summary of the total expression levels (means + SD) of CTF∆st relative to CTF from the experiments in (B). (E) Stalk peptide treatment of expression vector (ev)- or mCTF∆st-transfected cells. Sequences of stalk-derived peptides p7-p21 are shown. Graph represents the fold NFAT-luc activation for both ev- (gray bars) and CTF∆st- (blue bars) transfected cells relative to the CTF∆st control after 24 hr treatment with or without peptide. Results are the means (+ SD) of three separate experiments, each with three wells/conditions. *p<0.05; ***p=0.0001; ****p<0.0001. Analysis by one-way ANOVA with Tukey-Kramer post-test.
-
Figure 1—source data 1
Uncropped and labeled Western blot data for Figure 1C.
- https://cdn.elifesciences.org/articles/95992/elife-95992-fig1-data1-v1.zip
-
Figure 1—source data 2
Raw unedited Western blot data for Figure 1C.
- https://cdn.elifesciences.org/articles/95992/elife-95992-fig1-data2-v1.zip
Figure 1—figure supplement 1
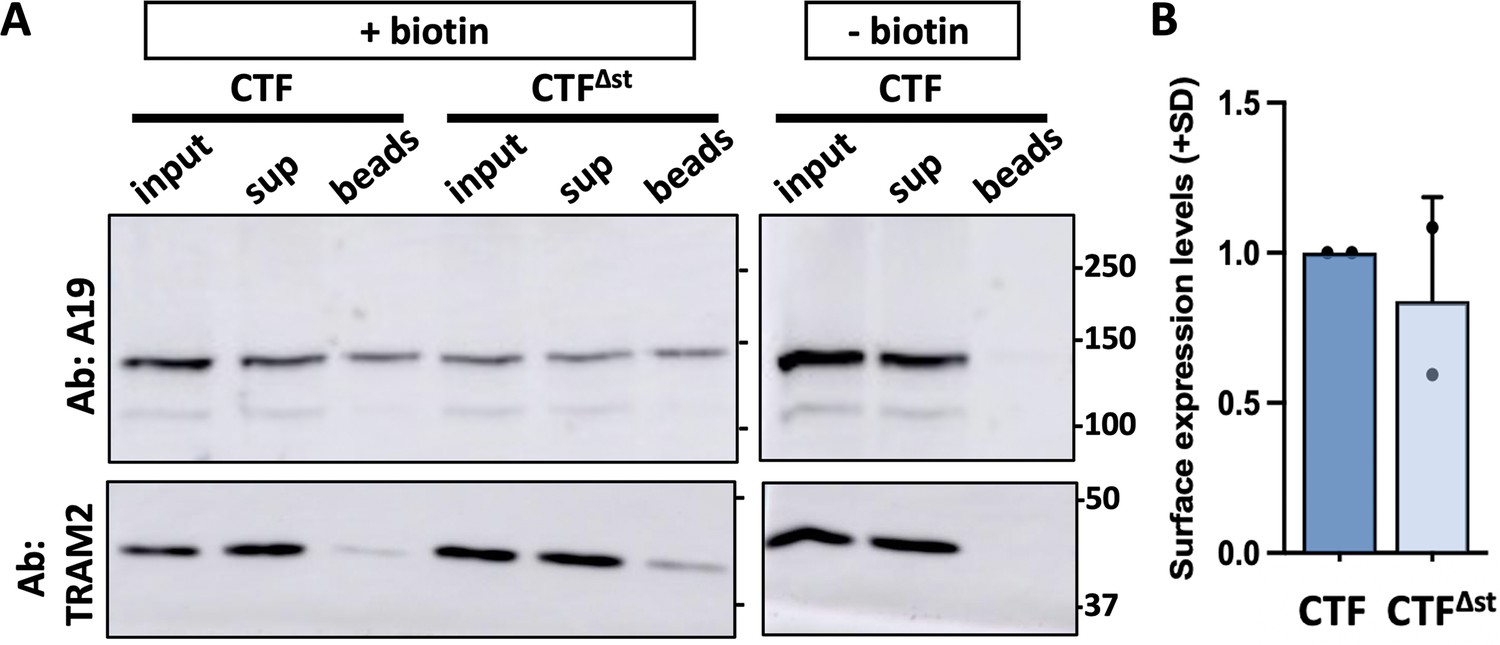
Cell surface expression of mouse polycystin-1 (PC1) C-terminal fragment (CTF), and mCTF∆stk.
Representative Western blot of a surface biotinylation experiment with mCTF and mCTF∆stk. (A) ‘- biotin’ control was included using CTF-transfected cells for which the NHS-biotin reagent was omitted from the procedure. Aliquots of the total cell lysate (input; after biotinylation and before neutravidin pulldown), supernatant (sup; following neutravidin bead removal), and biotinylated cell surface proteins bound to neutravidin beads (beads) representing 10%, 10%, and 70% of each sample, respectively, were analyzed. Blots were probed with A19 and then stripped and reprobed for NaKATPase or the resident ER protein, TRAM2. (B) Summary of cell surface expression levels of CTF∆stk relative to CTF (means + SD) from two separate experiments.
-
Figure 1—figure supplement 1—source data 1
Uncropped and labeled Western blot data for Figure 1—figure supplements 1 and 2.
- https://cdn.elifesciences.org/articles/95992/elife-95992-fig1-figsupp1-data1-v1.zip
-
Figure 1—figure supplement 1—source data 2
Raw unedited Western blot data for Figure 1—figure supplements 1 and 2.
- https://cdn.elifesciences.org/articles/95992/elife-95992-fig1-figsupp1-data2-v1.zip
Figure 1—figure supplement 2
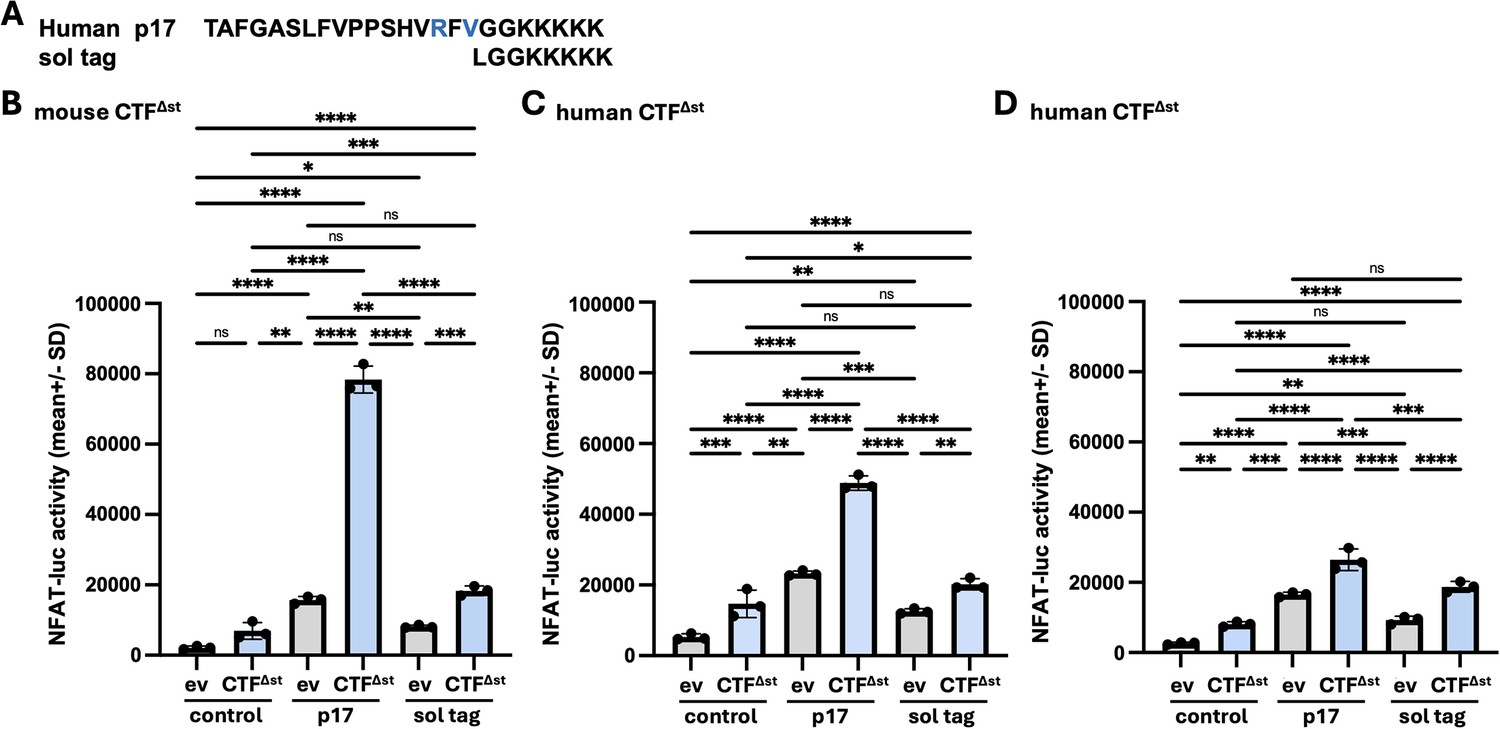
Solubility tag peptide treatment of ev- or CTF∆st-transfected cells.
(A) Sequences of the p17 stalk peptide derived from human polycystin-1 (PC1) and the solubility tag peptide (sol tag). Residues differing from the mouse PC1 stalk sequence are shown in blue. (B–D) HEK293T cells were transfected with an empty expression vector (ev) or the CTF∆st expression construct from either mouse (B) or mouse PC1, and transfected cells were treated either without (negative control; culture medium only) or with human p17 peptide (positive control) or sol tag peptide. Graphs show the NFAT-luc activity for ev- (gray bars) and CTF∆st- (blue bars) transfected cells after 24 hr treatment with or without peptide for each experiment. Results are the means (+ SD) of reporter activity from three wells/conditions in each experiment. *p<0.05, **p<0.01, ***p<0.001; ****p<0.0001; ns = not significant. Analysis by one-way ANOVA with Tukey-Kramer post-test. In each of the experimental replicates, treatment with the sol tag peptide led to a nominal ~2 fold increase in reporter activity with CTF∆st- versus ev-transfected cells (2.24-, 1.60-, and 2.02-fold for B-D, respectively). Although the level of NFAT reporter activity stimulated by the positive control p17 in CTF∆st-transfected cells varied between the three experiments, the effect of the sol tag peptide on CTF∆st- (and ev-) transfected cells was consistent and differed significantly in comparison to CTF∆st-transfected cells with p17 treatment in all three experiments (regardless of PC1 origin). Furthermore, the NFAT-luc activity of CTF∆st+ sol tag-treated cells did not differ from ev + p17-treated cells for each experiment, suggesting that the ‘background’ reporter activation observed with ev + stalk peptide versus ev + no peptide control may be due to the solubility tag. Altogether, these results support the rescue of CTF∆st signaling by certain stalk-derived peptides is specific to the stalk sequence itself.
Figure 2 with 3 supplements
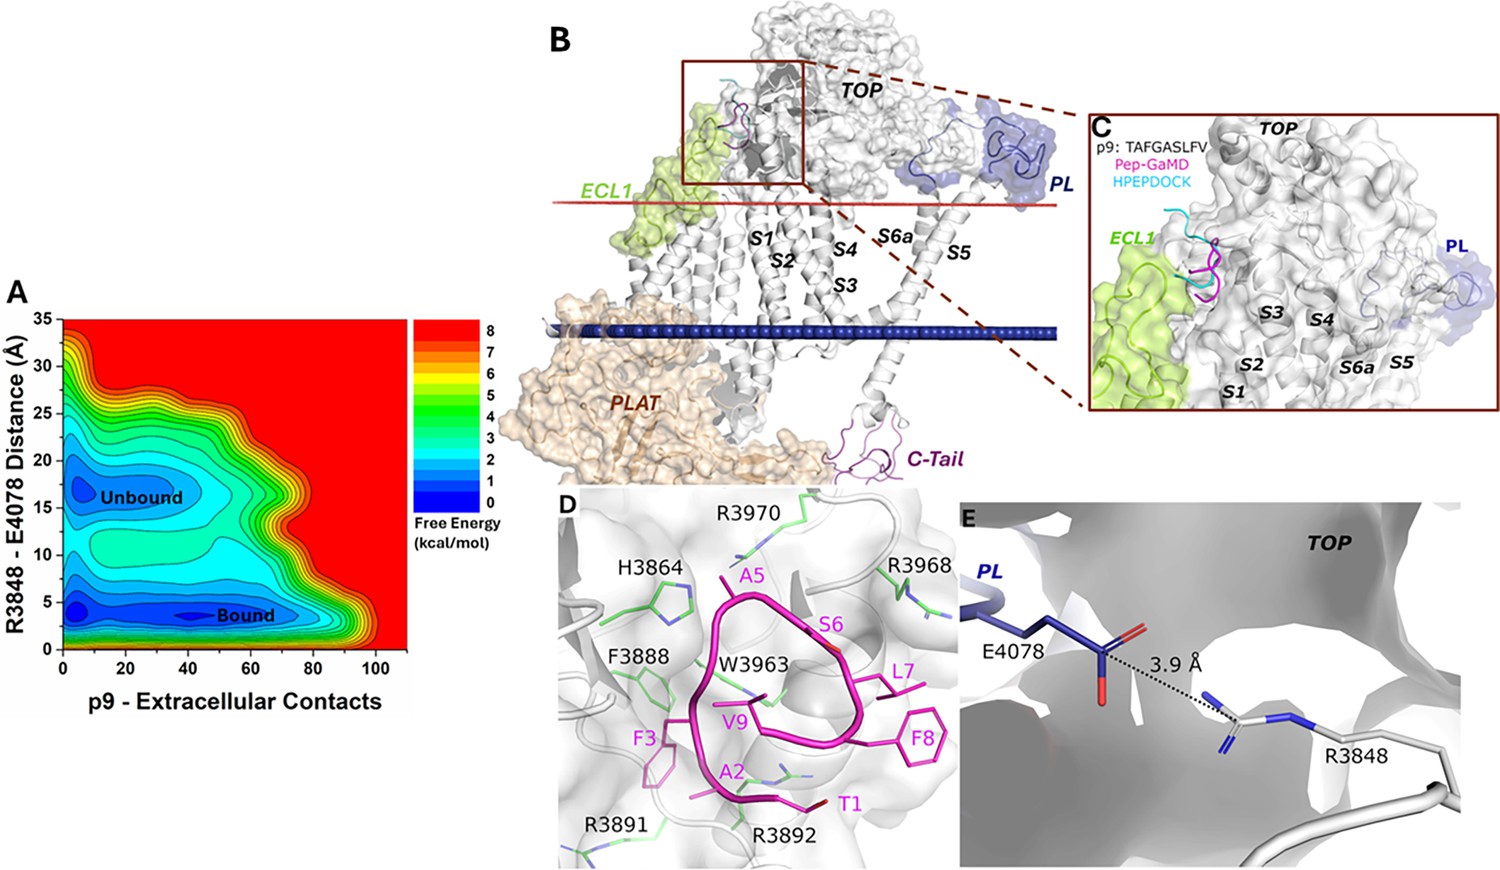
Free energy profile and low-energy conformations of the p9-bound ΔStalk CTF obtained from Pep-GaMD simulations.
(A) Free energy profile of the p9-bound ΔStalk CTF regarding the number of atom contacts between p9 and extracellular domains of CTF and the distance between the CZ atom of R3848 and the CD atom of R4078 in CTF. (B–C) Comparison of HPEPDOCK docking (cyan) and Pep-GaMD refined (magenta) conformations of peptide p9 in ΔStalk CTF. (D) Polar interactions between peptide-protein residues were observed in the top-ranked representative conformations of p9. Peptide residues are numbered relative to the N terminus of the stalk with the peptide starting from 1, while residues within ∆Stalk CTF are numbered according to the standard polycystin-1 (PC1) residue number. (E) Distance between the TOP domain residue R3848 and pore loop (PL) residue E4078 observed in p9-bound ΔStalk CTF.
Figure 2—figure supplement 1
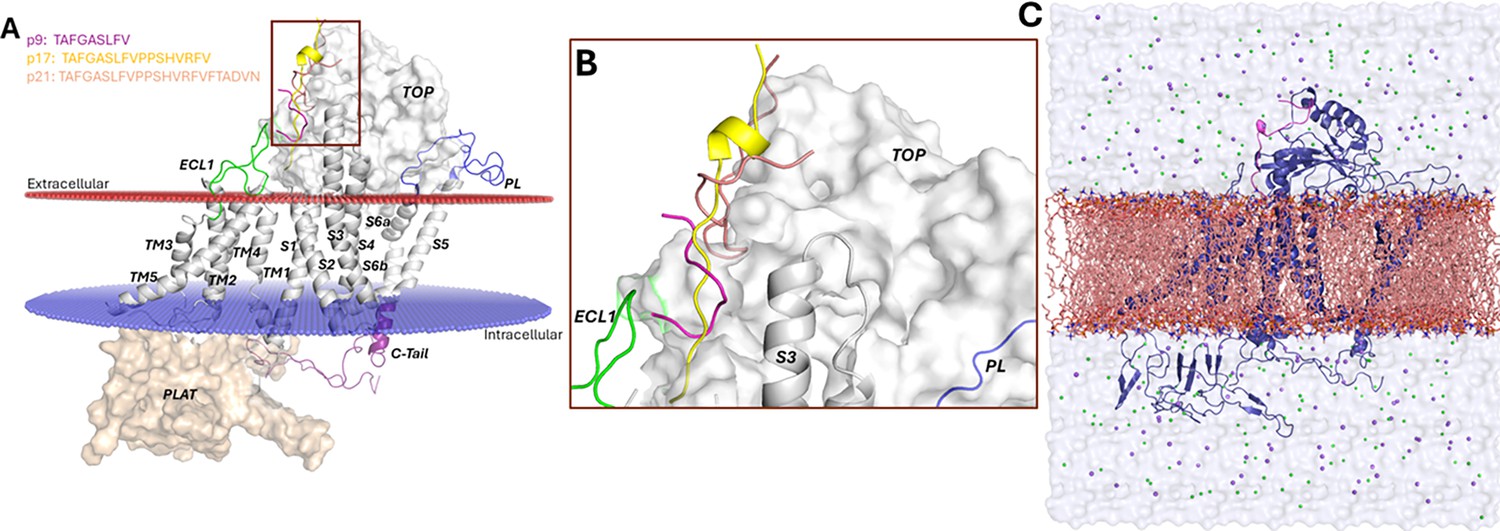
Peptide docking conformations and computational model for Peptide GaMD (Pep-GaMD) simulations.
(A–B) Docking conformations of p9, p17, and p21 to ΔStalk CTF. (C) Pep-GaMD simulation system of ΔStalk polycystin-1 (PC1) C-terminal fragment (CTF) (blue cartoon) embedded in a palmitoyl-oleoyl-phosphatidyl-choline (POPC) lipid bilayer (orange sticks) solvated in 0.15 M NaCl solution.
Figure 2—figure supplement 2
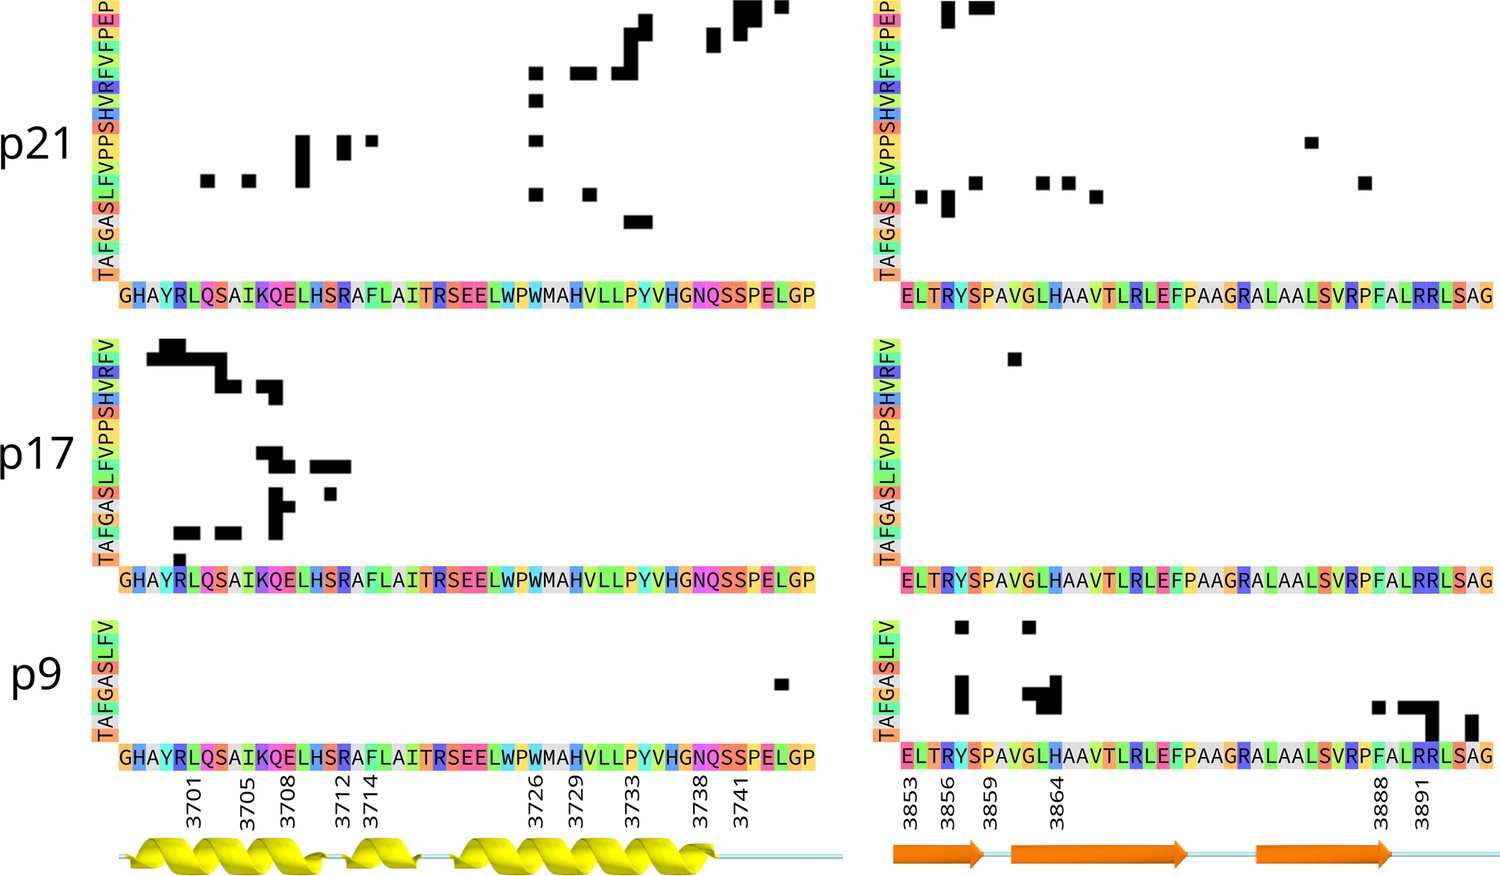
Contact maps showing residue-pairs in contact (black squares) between the peptide (y-axis) and the extracellular domains of C-terminal fragment (CTF) (x-axis), in the representative ‘Bound’ state for p21 (top), p17 (middle), and p9 (bottom).
Contacts were defined by a distance less than 4 Å between any atom in each residue pair. The secondary structure annotation is colored as in Figure 5, and the sequence is annotated with amino acids in ‘Taylor’ color scheme. For p9, an additional cluster of contacts with residues in helix S3 are not shown.
Figure 2—figure supplement 3
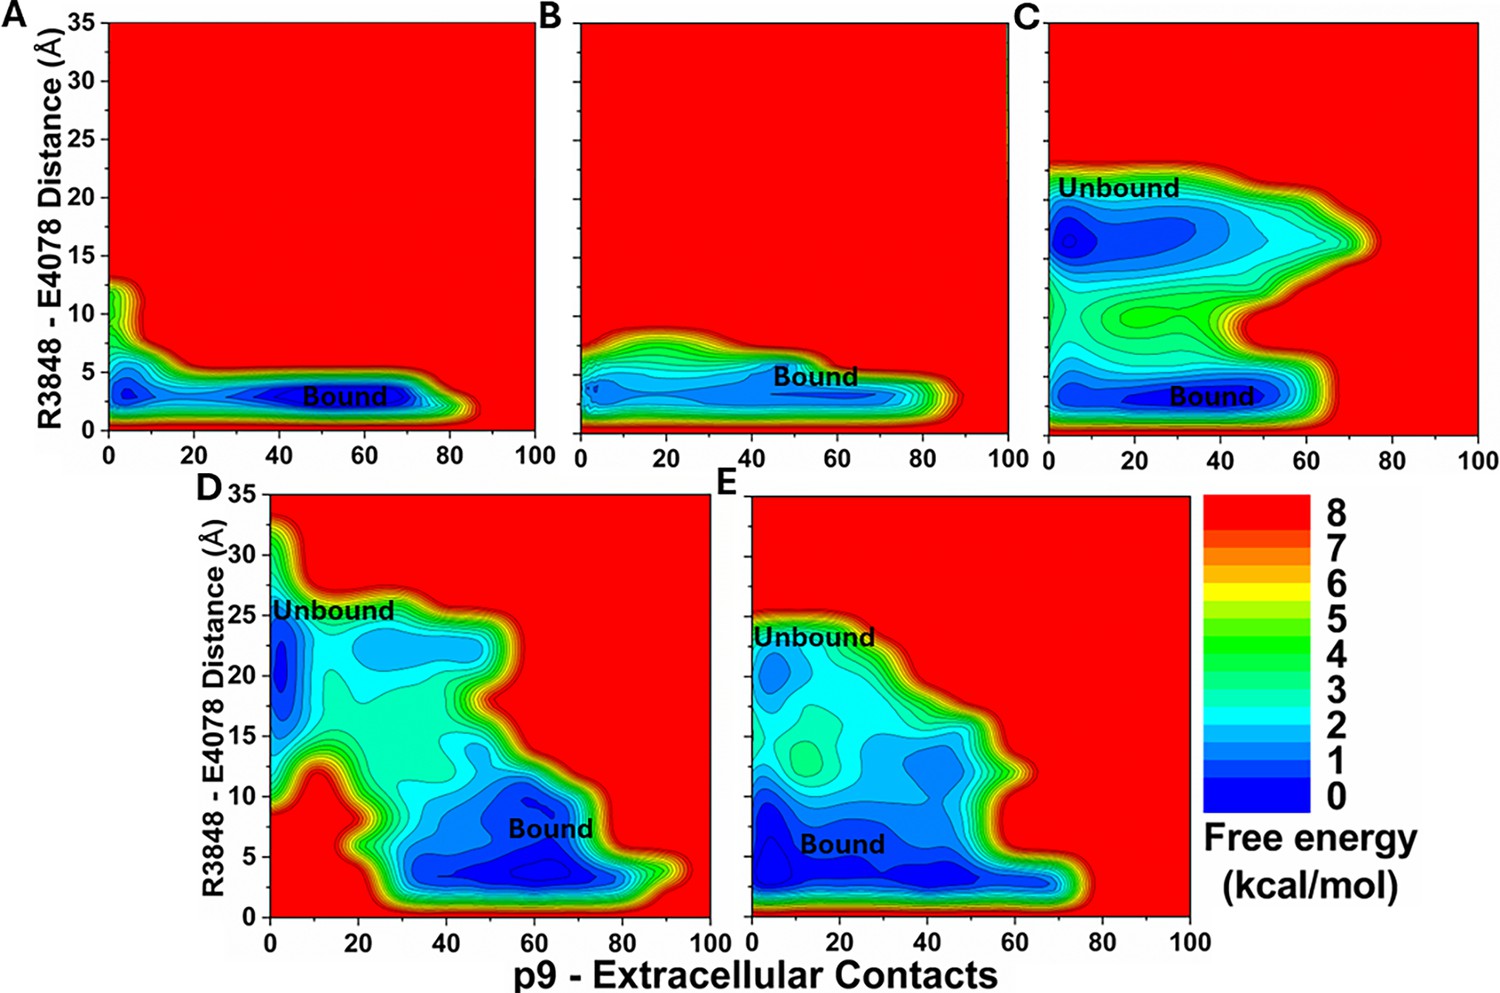
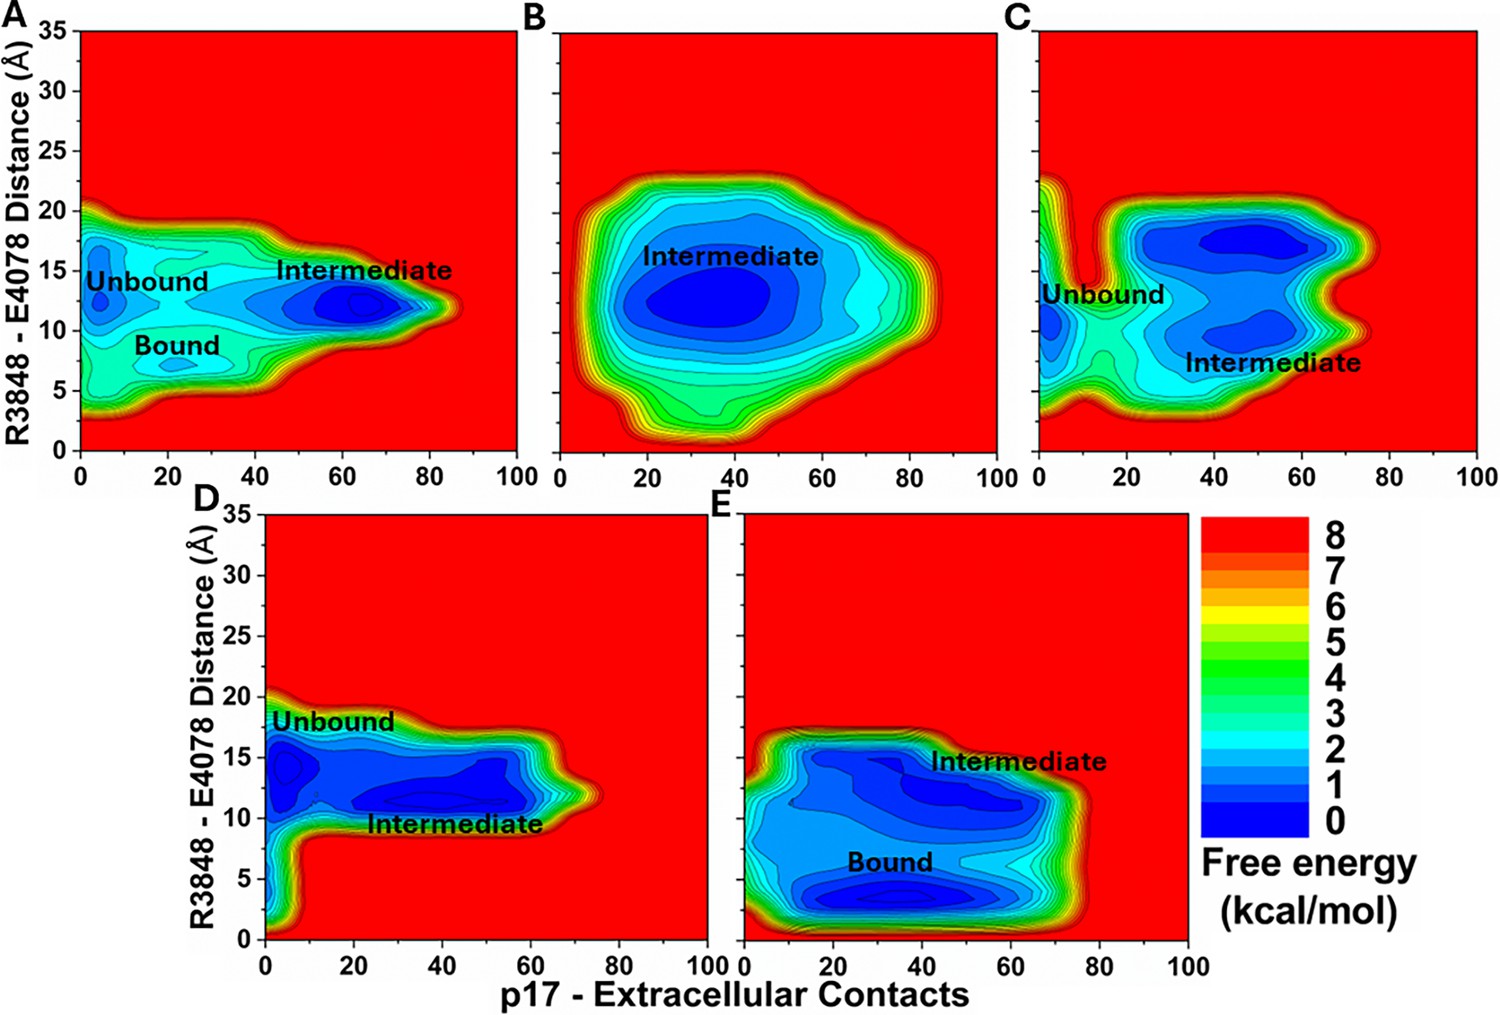
2D free energy profiles of the p9 system regarding the number of atom contacts between the p9 and protein extracellular domains and the R3848-E4078 distance (the CZ atom in R3848 and the CD atom in E4078) calculated from (A) Sim1, (B) Sim2, (C) Sim3, (D) Sim4, and (E) Sim5 of the Peptide GaMD (Pep-GaMD) simulations.
Important low-energy conformational states are identified, including the ‘Unbound’ and ‘Bound’.
Figure 3 with 1 supplement
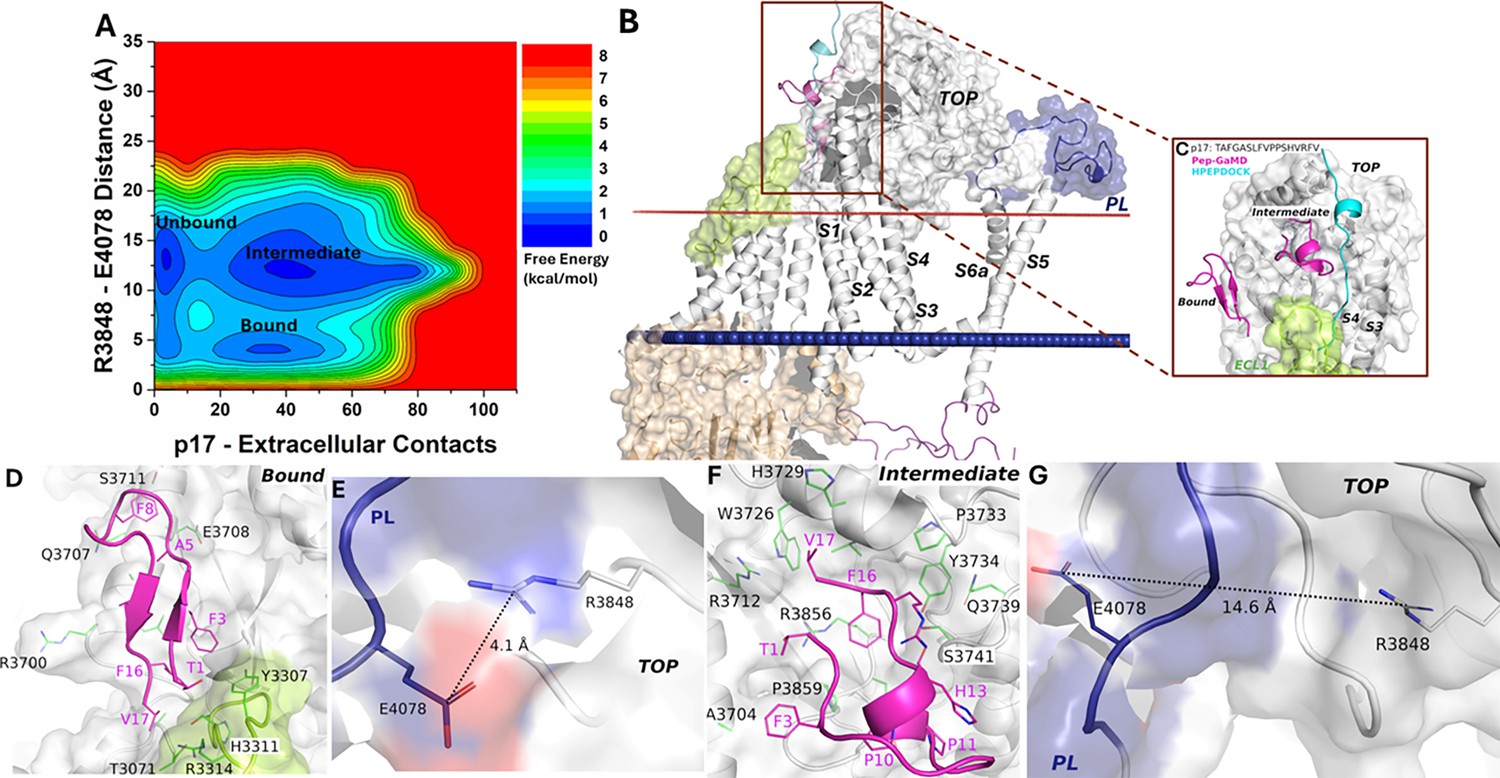
Free energy profile and low-energy conformations of the p17-bound ΔStalk CTF obtained from Pep-GaMD simulations.
(A) Free energy profile of the p17-bound ΔStalk CTF regarding the number of atom contacts between p17 and extracellular domains of CTF and the distance between the CZ atom of R3848 and the CD atom of R4078 in CTF. (B–C) Comparison of HPEPDOCK docking (cyan) and Pep-GaMD refined (magenta) conformations of peptide p17 in ΔStalk CTF. Hydrophobic interactions (red dashed lines) between peptide-protein residues were observed in the (D) 'Bound’ and (F) 'Intermediate’ low-energy conformations of p17-bound ΔStalk CTF. Distance between the TOP domain residue R3848 and pore loop (PL) residue E4078 observed in the (E) ‘Bound’ and (G) ‘Intermediate’ low-energy conformations of p17-bound ΔStalk CTF.
Figure 3—figure supplement 1
2D free energy profiles of the p17 system regarding the number of atom contacts between the p17 and protein extracellular domains and the R3848-E4078 distance (the CZ atom in R3848 and the CD atom in E4078) calculated from (A) Sim1, (B) Sim2, (C) Sim3, (D) Sim4, and (E) Sim5 of the Peptide GaMD (Pep-GaMD) simulations.
Important low-energy conformational states are identified, including the ‘Unbound’ ‘Intermediate,’ and ‘Bound’.
Figure 4 with 2 supplements
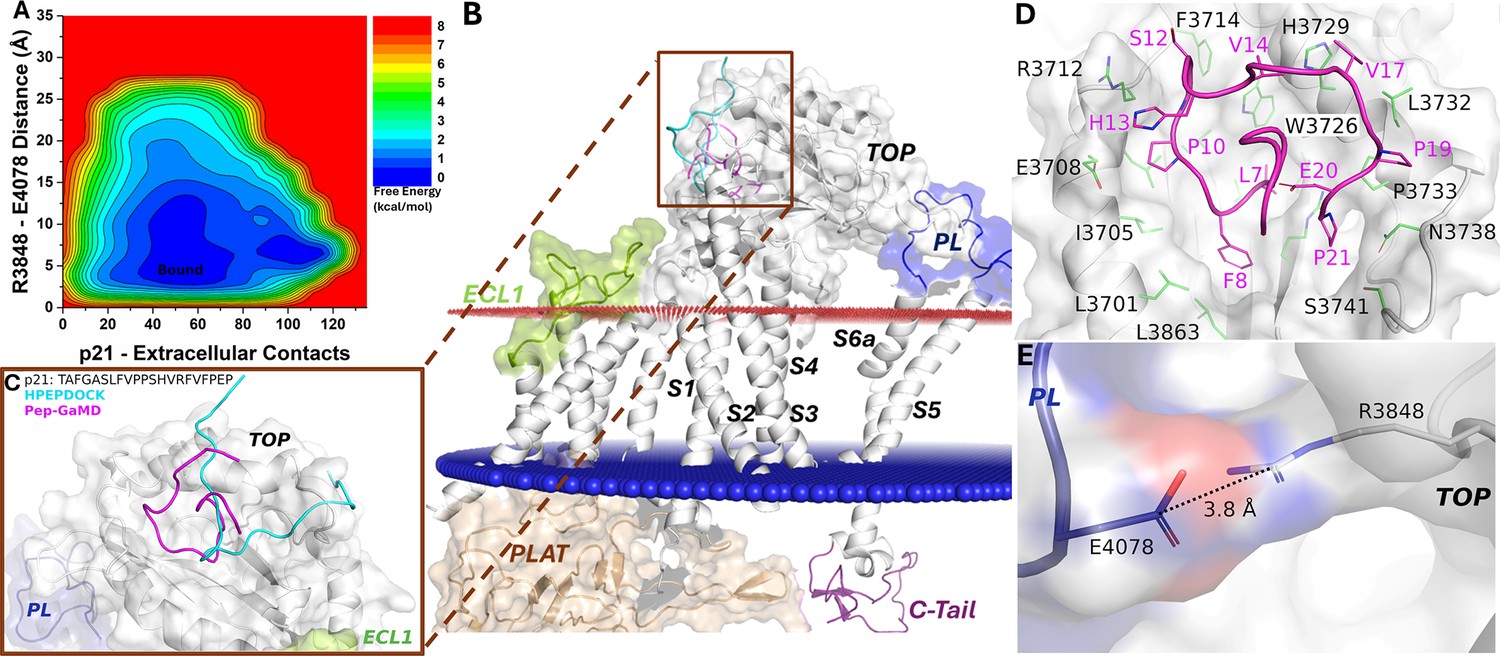
Free energy profile and low-energy conformations of the p21-bound ΔStalk CTF obtained from Pep-GaMD simulations.
(A) Free energy profile of the p21-bound ΔStalk CTF regarding the number of atom contacts between p21 and extracellular domains of CTF and the distance between the CZ atom of R3848 and the CD atom of R4078 in CTF. (B–C) Comparison of HPEPDOCK docking (cyan) and Pep-GaMD refined (magenta) conformations of peptide p21 in ΔStalk CTF. (D) Polar interactions between peptide-protein residues were observed in the top-ranked representative conformations of p21. (E) Distance between the TOP domain residue R3848 and pore loop (PL) residue E4078 observed in p21-bound ΔStalk CTF.
Figure 4—figure supplement 1
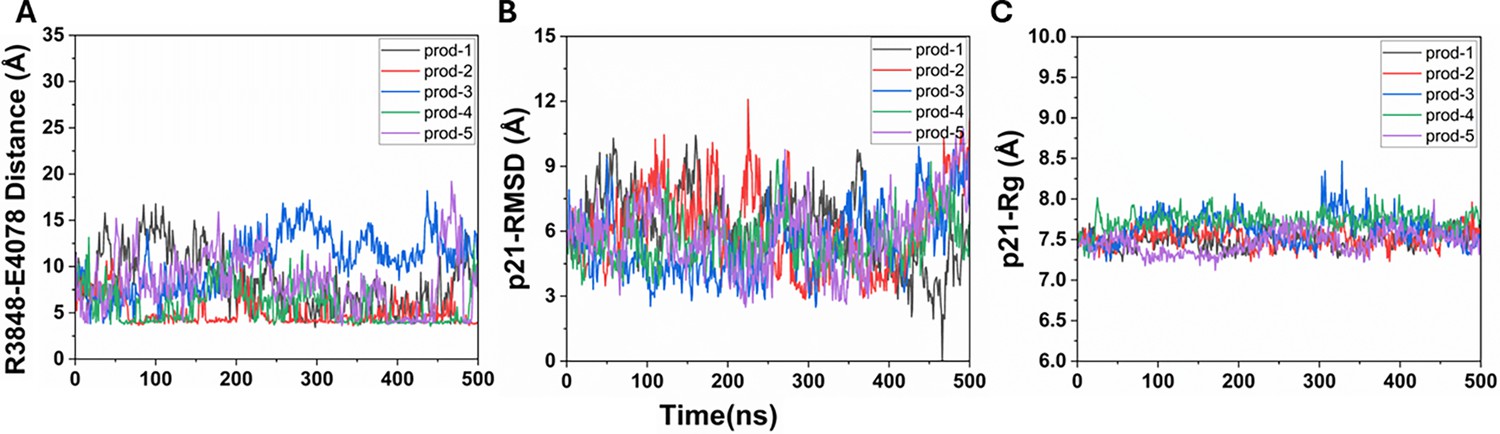
Time courses of the p21 system obtained from the five Peptide GaMD (Pep-GaMD) simulations.
(A) Time courses of the p21 system regarding the TOP-pore loop (PL) interaction distance between the CZ atom in R3848 and the CD atom in E4078. (B) Time courses of the root-mean-square deviation (RMSD) of p21 relative to the starting HPEPDOCK conformation of the peptide. (C) Time courses of the radius of gyration (Rg) of p21.
Figure 4—figure supplement 2
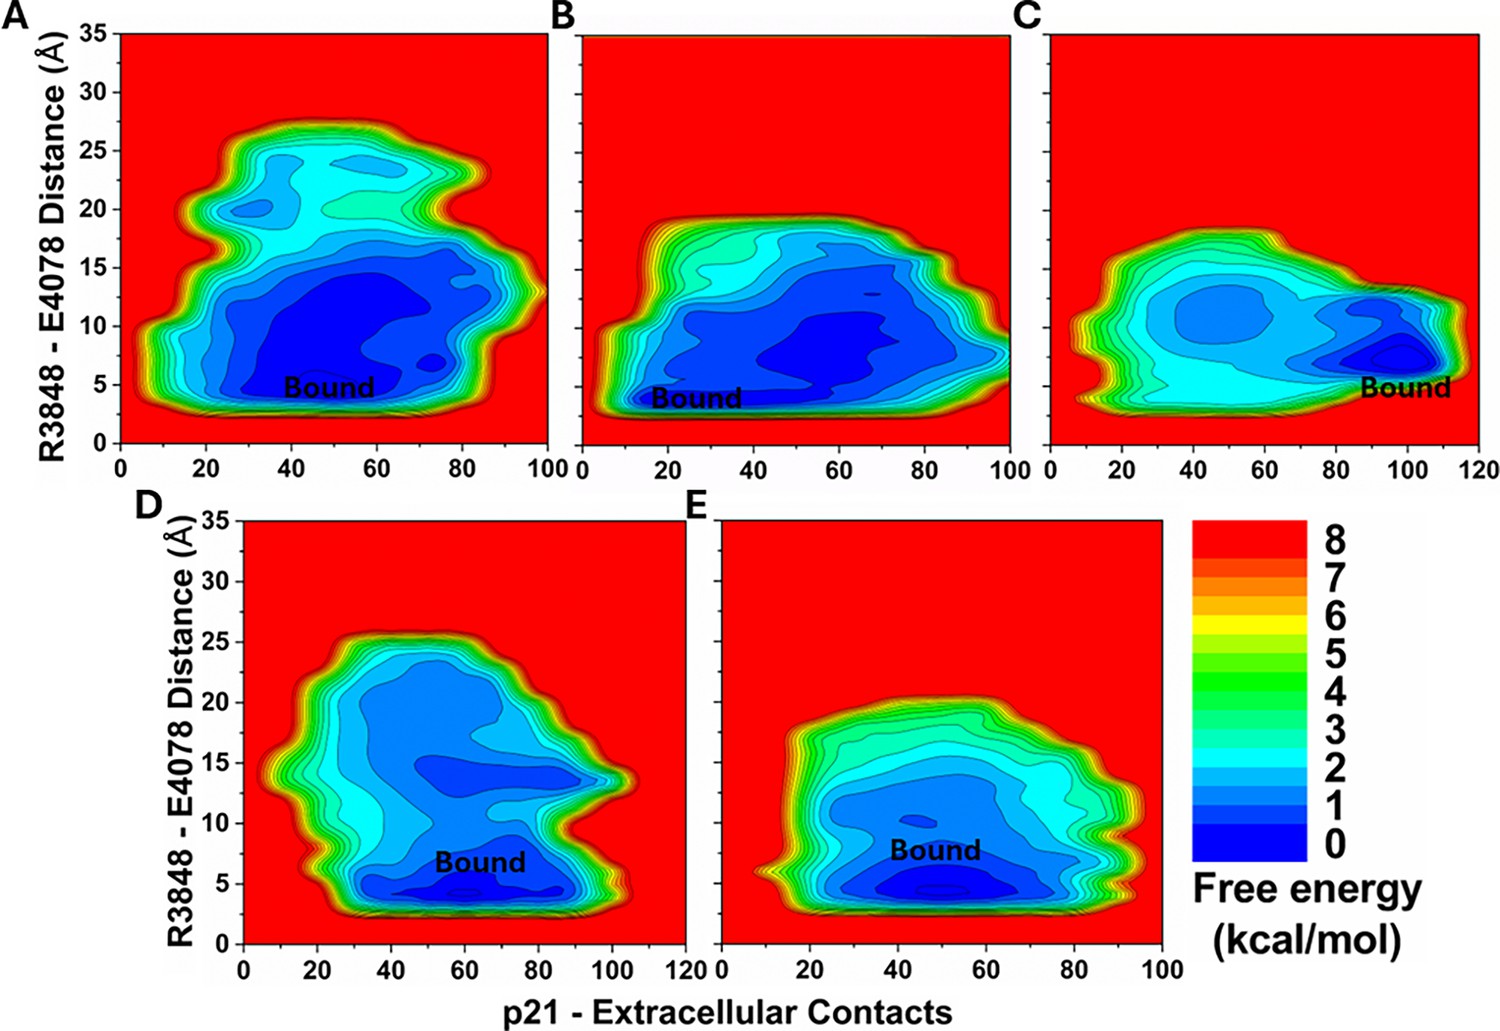
2D free energy profiles of the p21 system regarding the number of atom contacts between the p21 and protein extracellular domains and the R3848-E4078 distance (the CZ atom in R3848 and the CD atom in E4078) calculated from (A) Sim1, (B) Sim2, (C) Sim3, (D) Sim4, and (E) Sim5 of the Peptide GaMD (Pep-GaMD) simulations.
Important low-energy conformational state is identified, including the ‘Bound’.
Figure 5 with 2 supplements
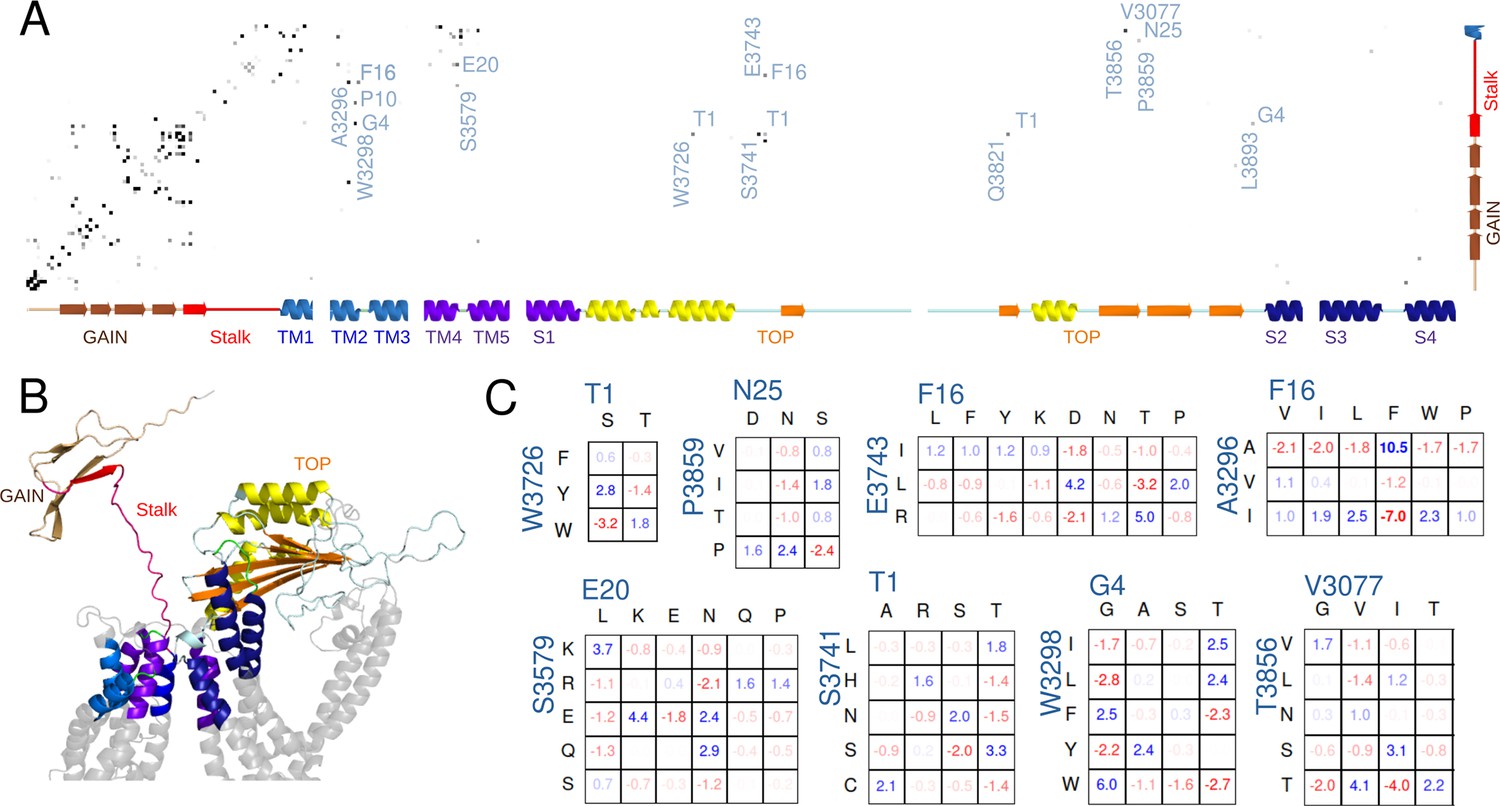
Potts covariation analysis of residue interactions in polycystin-1 (PC1).
(A) Potts interaction map based on the Polycystic Kidney Disease 1 (PKD1) multiple-sequence-alignment illustrated in Figure 5—figure supplement 2, showing interactions with the stalk. Gray dots are shown for residue position-pairs with Potts covariation scores above a threshold, colored darker for higher scores, and selected interacting pairs are annotated with the stalk residue (horizontal, numbered from the stalk N-terminus) and other residue (vertical, standard PC1 numbering) with the PC1 residue at each position. The secondary structure as a function of position is annotated along the axes. (B) Cartoon showing the subset of PC1 included in the Potts covariation analysis colored as in the secondary structure in panel A, using a structure predicted by AlphaFold. Gray regions were excluded from the Potts model. (C) Residue Covariation scores for selected position-pairs. The scores reflect the percentage excess frequency of the residue-pair relative to the null expected frequency if the multiple sequence alignment (MSA) columns were uncorrelated, with blue values reflecting excess and red dearth. Only the most common residue types are shown.
Figure 5—figure supplement 1
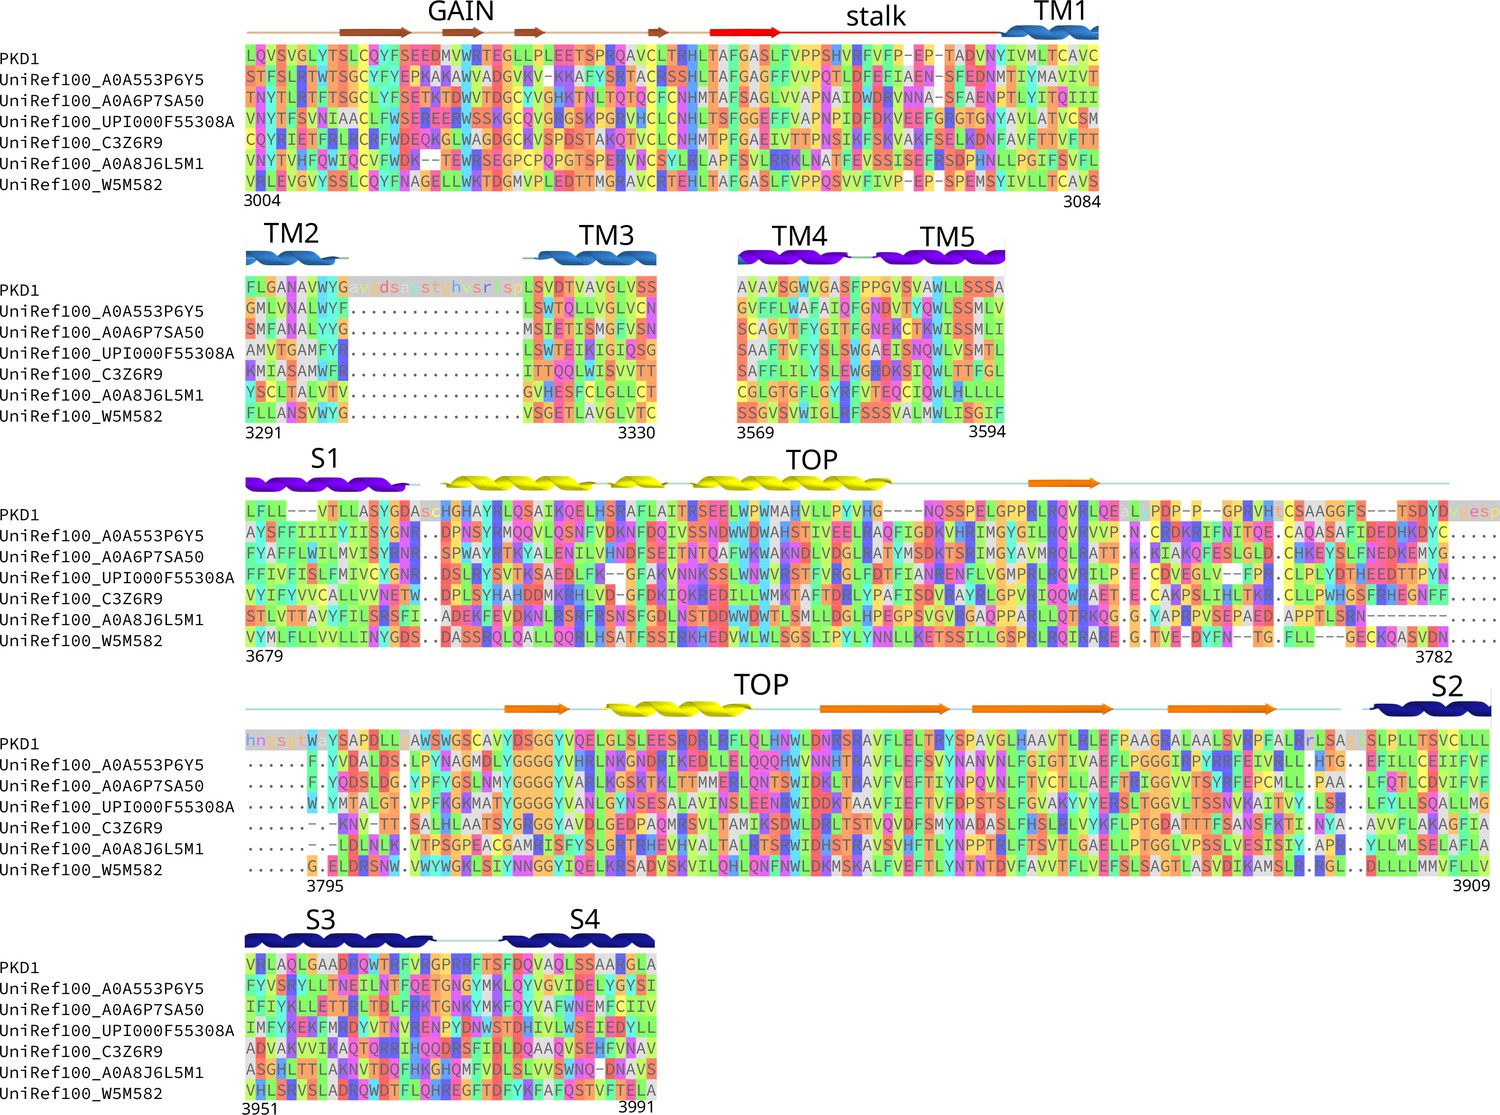
Sequence alignment of Polycystic Kidney Disease 1 (PKD1) homologs showing the 394-residue extracellular region included in the Potts model.
The full alignment includes 4383 sequences, and only six diverse homologs are shown for illustration. The polycystin-1 (PC1) sequence is shown including inserts relative to the alignment (lower case with a gray background, matched with ‘.’ in homologs), inserts are not shown for the six homologs. Gaps characters are indicated as ‘-,’ representing positions included in the alignment which were missing in that sequence. The human PC1 protein sequence residue numbering is indicated at the bottom ends of each aligned region.
Figure 5—figure supplement 2
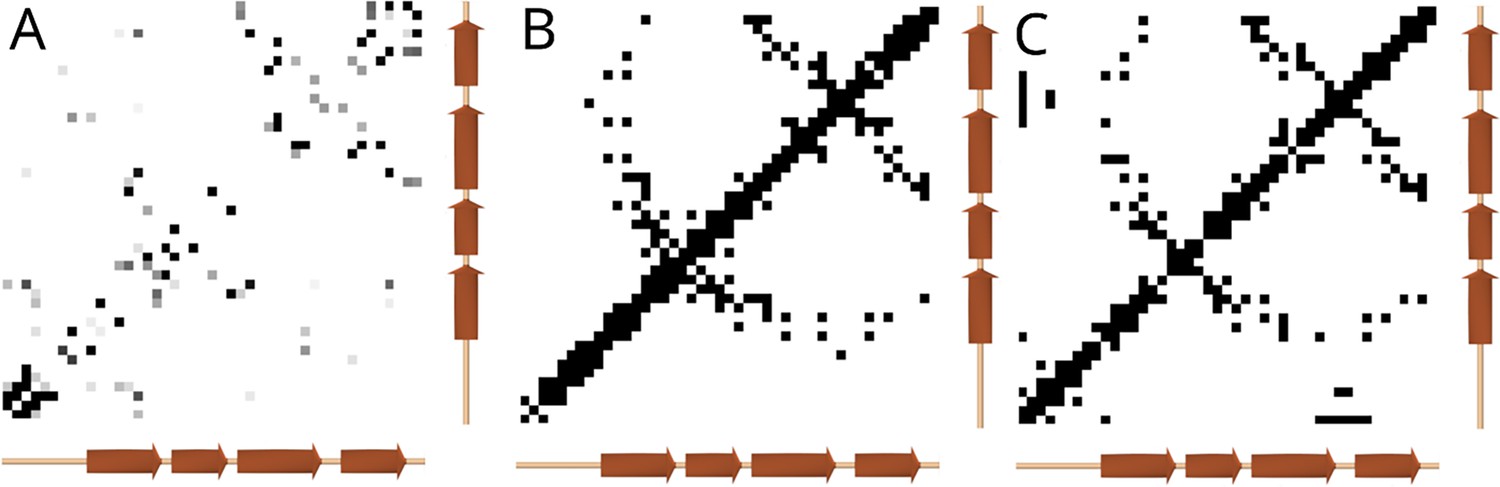
Comparison of residue-residue interactions within the end of the polycystin-1 (PC1) GPCR autoproteolysis inducing (GAIN) domain.
(A) Interactions predicted using the Potts model, shaded by interaction strength. Secondary structure elements predicted using an Alphafold structure is annotated along the axes. (B) Contacts observed in the rat latrophilin-1 GAIN domain crystal structure (PDB: 4DLQ Araç et al., 2012), showing contacts where the nearest side-chain heavy atom distance was under 8 Å. (C) Contacts observed in the structure of the Polycystic Kidney Disease 1 (PKD1) GAIN domain were predicted using Alphafold with the same distance criteria. The contacts predicted using the Potts model show correspondence with the structure-based contacts, detecting two antiparallel beta-sheet interactions extending from the diagonal (upper right and middle), plus a possible third antiparallel beta-sheet interface (lower left) not observed in the latrophilin structure as this region may have low similarity.
Author response image 1
Tables
Table 1
Summary of MM/PBSA binding free energy analysis for the peptides p9, p17 and p21 and polycystin-1 (PC1) C-terminal fragment (CTF) in the bound state sampled during Peptide GaMD (Pep-GaMD) simulations.
| System | ΔG (kcal/mol) |
|---|---|
| p21 | –40.29±6.94 |
| p9 | –17.30±4.50 |
| p17 | –12.74±5.62 |
Table 2
Summary of residue-wise energy decomposition analysis between the peptide p9 and polycystin-1 (PC1) C-terminal fragment (CTF) in the bound state sampled during Peptide GaMD (Pep-GaMD) simulations.
| Residue | ΔG (kcal/mol) |
|---|---|
| T1 | –10.47±6.92 |
| A2 | –3.28±2.18 |
| F3 | –2.62±2.62 |
| G4 | –0.30±2.38 |
| A5 | –1.61±2.67 |
| S6 | –0.59±4.49 |
| L7 | –0.28±2.96 |
| F8 | –1.51±1.84 |
| V9 | –10.14±5.68 |
| R3891 | –0.14±7.26 |
| R3892 | –0.31±7.85 |
| F3888 | –3.24±2.95 |
| H3864 | –0.03±3.86 |
| R3970 | –0.94±2.62 |
| R3968 | –0.27±1.67 |
Table 3
Summary of residue-wise energy decomposition analysis between the peptide p17 and polycystin-1 (PC1) C-terminal fragment (CTF) in the bound state sampled during Peptide GaMD (Pep-GaMD) simulations.
| Residue | ΔG (kcal/mol) |
|---|---|
| T1 | –10.98±2.32 |
| A2 | –0.36±2.34 |
| F3 | –0.23±3.82 |
| G4 | –0.03±3.83 |
| A5 | –0.86±3.08 |
| S6 | –0.48±4.06 |
| L7 | –0.05±2.90 |
| F8 | –0.21±4.42 |
| V9 | –0.19±3.41 |
| P10 | –0.72±2.64 |
| P11 | –0.09±3.23 |
| S12 | –0.29±4.92 |
| H13 | –1.19±7.37 |
| V14 | –1.25±3.08 |
| R15 | –10.63±3.76 |
| F16 | –0.93±5.52 |
| V17 | –10.20±3.83 |
| Y3307 | –0.11±2.68 |
| H3311 | –0.04±3.25 |
| R3314 | –8.90±1.65 |
| R3700 | –14.63±7.8 |
| Q3707 | –0.27±4.96 |
| S3711 | –0.08±4.06 |
| E3708 | –10.14±4.15 |
Table 4
Summary of residue-wise energy decomposition analysis between the peptide p21 and polycystin-1 (PC1) C-terminal fragment (CTF) in the bound state sampled during Peptide GaMD (Pep-GaMD) simulations.
| Residue | ΔG (kcal/mol) |
|---|---|
| T1 | –0.25±1.66 |
| A2 | –1.02±2.90 |
| F3 | –0.08±0.10 |
| G4 | –2.42±2.65 |
| A5 | –0.11±2.15 |
| S6 | –0.09±1.31 |
| L7 | –0.83±1.43 |
| F8 | –0.68±1.10 |
| V9 | –8.17±2.10 |
| P10 | –6.16±1.79 |
| P11 | –1.22±2.83 |
| S12 | –0.05±2.56 |
| H13 | –1.13±3.74 |
| V14 | –1.16±1.78 |
| R15 | –0.59±1.02 |
| F16 | –0.59±1.02 |
| V17 | –1.59±1.13 |
| F18 | –0.20±1.37 |
| P19 | –7.09±1.51 |
| E20 | –3.76±2.24 |
| P21 | –8.43±2.01 |
| L3863 | –0.33±2.28 |
| L3701 | –0.04±2.39 |
| I3705 | –0.51±2.16 |
| E3708 | –1.68±3.11 |
| R3712 | –3.85±1.56 |
| F3714 | –0.01±2.28 |
| W3726 | –2.93±2.11 |
| H3729 | –0.56±2.00 |
| L3732 | –0.26±2.49 |
| P3733 | –0.61±2.33 |
| N3738 | –0.07±4.91 |
| S3741 | –0.03±4.27 |
Additional files
Download links
A two-part list of links to download the article, or parts of the article, in various formats.
Downloads (link to download the article as PDF)
Open citations (links to open the citations from this article in various online reference manager services)
Cite this article (links to download the citations from this article in formats compatible with various reference manager tools)
Activation of polycystin-1 signaling by binding of stalk-derived peptide agonists
eLife 13:RP95992.
https://doi.org/10.7554/eLife.95992.3


