Cross-species alignment along the chronological axis reveals evolutionary effect on structural development of the human brain
- State Key Laboratory of Primate Biomedical Research, Institute of Primate Translational Medicine, Kunming University of Science and Technology, China
- School of Life Science and Technology, University of Electronic Science and Technology of China, China
- Brainnetome Center & National Laboratory of Pattern Recognition, Institute of Automation, Chinese Academy of Sciences, China
- Yunnan Key Laboratory of Primate Biomedical Research, China
Figures
Figure 1
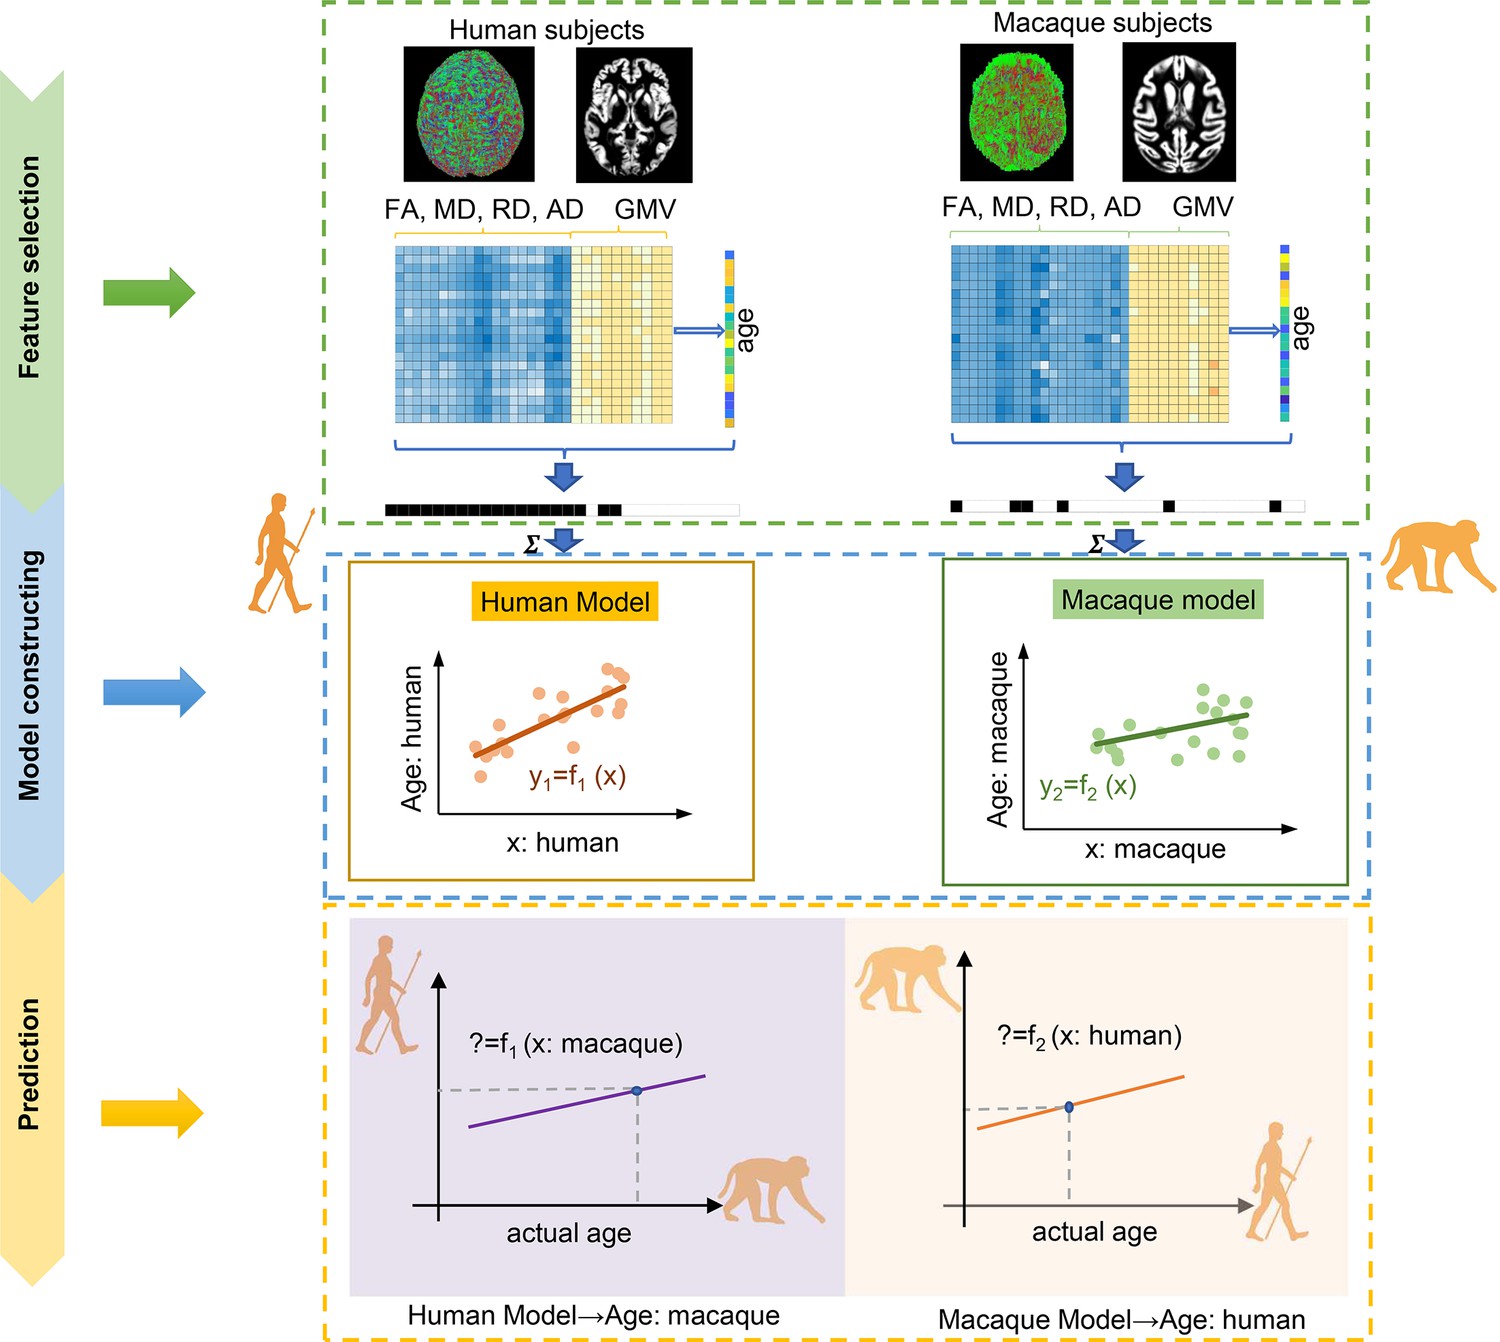
The flowchart for intra- and inter-/cross-species prediction using brain structure-based cross-species age prediction model.
Feature selection: the features with p<0.01 from Pearson’s correlation between features consisted of gray matter volume (GMV), fractional anisotropy (FA), mean diffusion (MD), radial diffusion (RD), and axial diffusion (AD), and ages were preliminarily selected. The ultimate features were selected using two criteria: common features and minimum mean absolute error (MAE) across 100 times repetitions. Model construction: using the selected features, tenfold cross-validation with nine-tenths was used to train the model. Prediction: tenfold cross-validation with one-tenth was used for prediction.
Figure 2 with 3 supplements
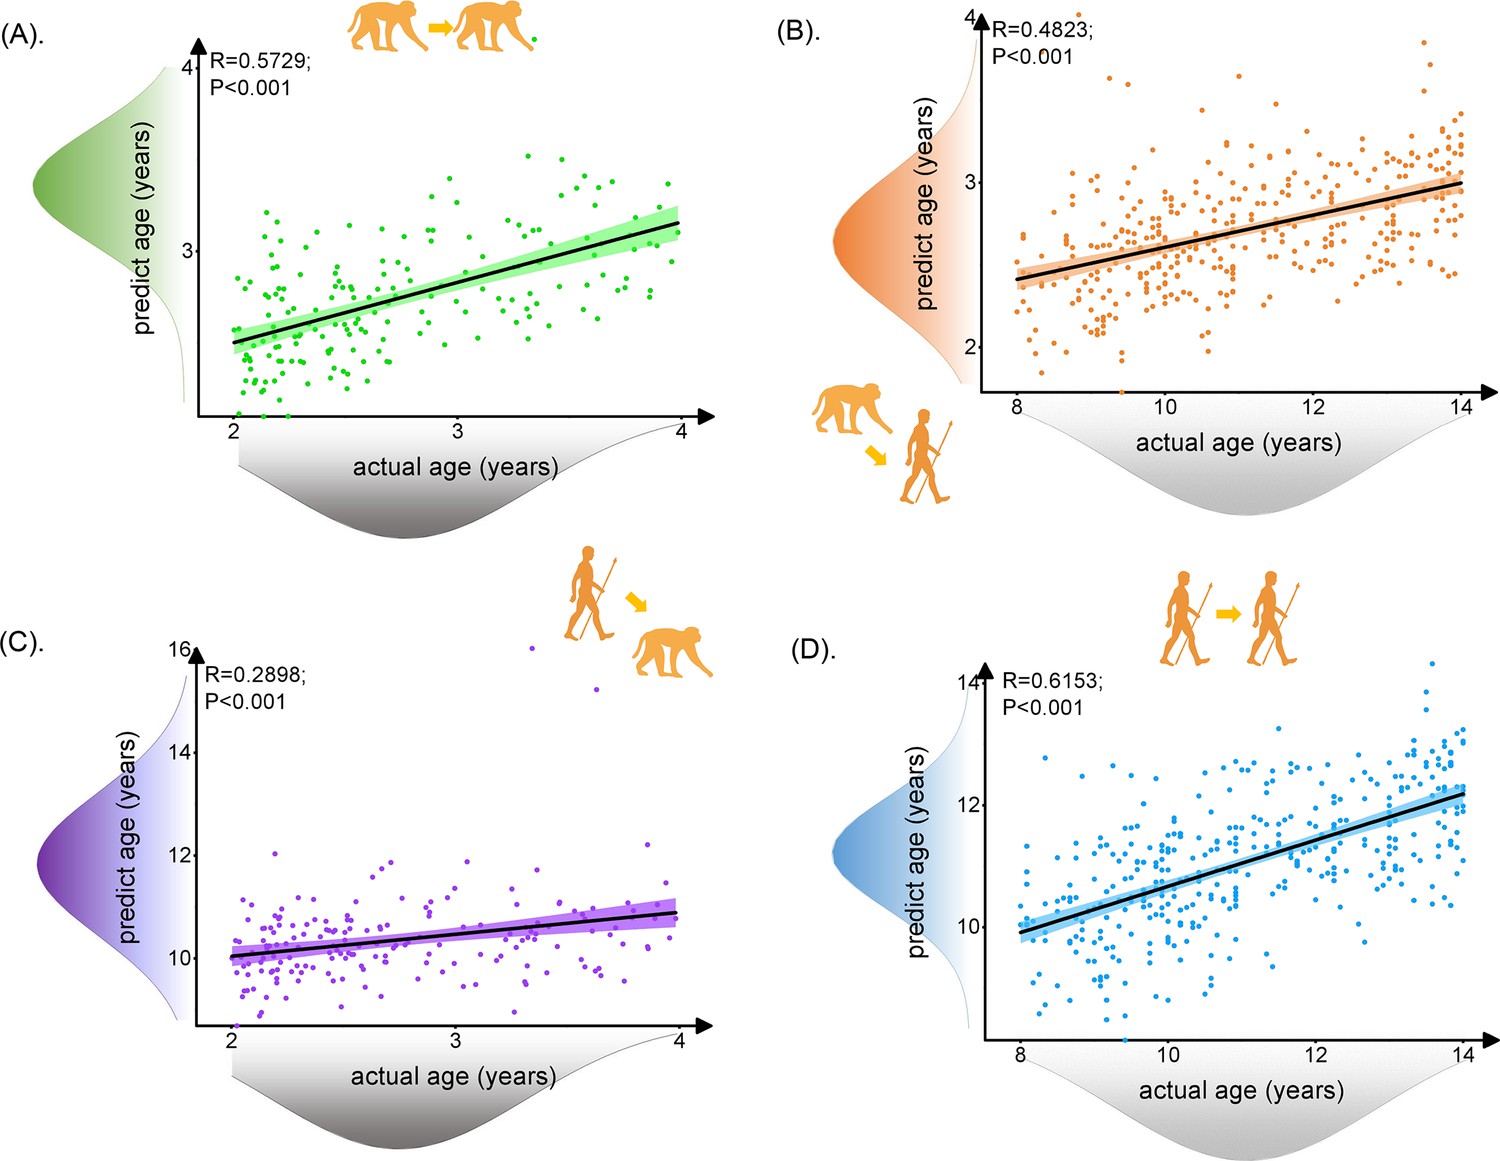
The prediction results for intra- and inter-/cross-species using brain structure-based cross-species age prediction model.
Each dot depicts data from an individual participant. The width of the curve denotes the 95% CI around the linear fitting curve (black line). The prediction model could well predict intra- and inter-species ages. The trained monkey prediction model could better predict human ages than using trained human prediction model to predict macaque ages. (A, D) Prediction results for intra-species with green for macaque and blue for human. (B, C) Prediction results for inter-species with orange for predicted human ages using macaque model and purple for predicted macaque ages using the human model.
-
Figure 2—source data 1
The information of 62 selected features of macaque.
The first column shows the four brain parameters, the second column shows selected white matter tracts and gray matter regions within the brain parameters, and the third column shows the R value using Pearson’s correlation between the second column and ages.
- https://cdn.elifesciences.org/articles/96020/elife-96020-fig2-data1-v1.xlsx
-
Figure 2—source data 2
The information of 225 selected features of human.
The first column shows the four brain parameters, the second column shows selected white matter tracts and gray matter regions within the brain parameters, and the third column shows the R value using Pearson’s correlation between the second column and ages.
- https://cdn.elifesciences.org/articles/96020/elife-96020-fig2-data2-v1.xlsx
Figure 2—figure supplement 1
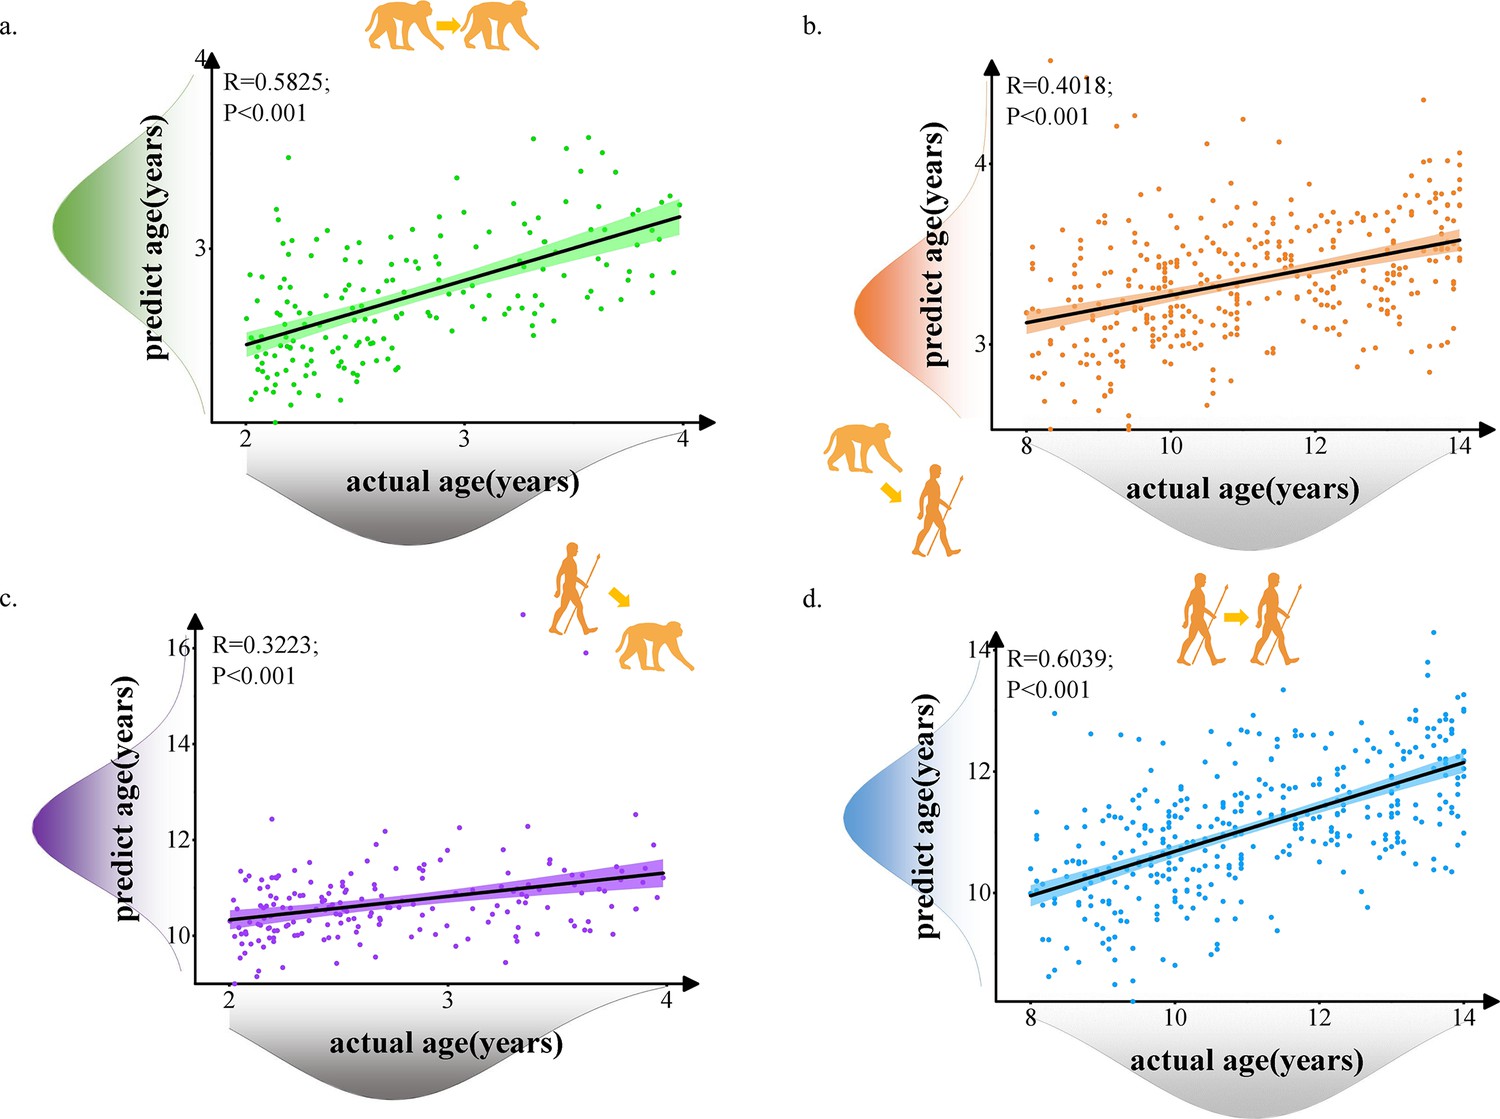
The prediction results of intra- and inter-species using prediction model with 117 selected macaque features and 239 selected human features.
Each dot depicts data from an individual participant. The width of the curve denotes the 95% confidence interval around the linear fitting curve (black line). (a, d). Prediction results for intra-species with green for macaque and blue for human. (b, c). Prediction results for inter-species with orange for predicted human ages using macaque model and purple for predicted macaque ages using human model.
-
Figure 2—figure supplement 1—source data 1
The information of 117 selected features of macaque.
The first column shows the four brain parameters, the second column shows selected white matter tracts and gray matter regions within the brain parameters, and the third column shows the R value using Pearson’s correlation between the second column and ages.
- https://cdn.elifesciences.org/articles/96020/elife-96020-fig2-figsupp1-data1-v1.xlsx
-
Figure 2—figure supplement 1—source data 2
The information of 239 selected features of human.
The first column shows the four brain parameters, the second column shows selected white matter tracts and gray matter regions within the brain parameters, and the third column shows the R value using Pearson’s correlation between the second column and ages.
- https://cdn.elifesciences.org/articles/96020/elife-96020-fig2-figsupp1-data2-v1.xlsx
Figure 2—figure supplement 2
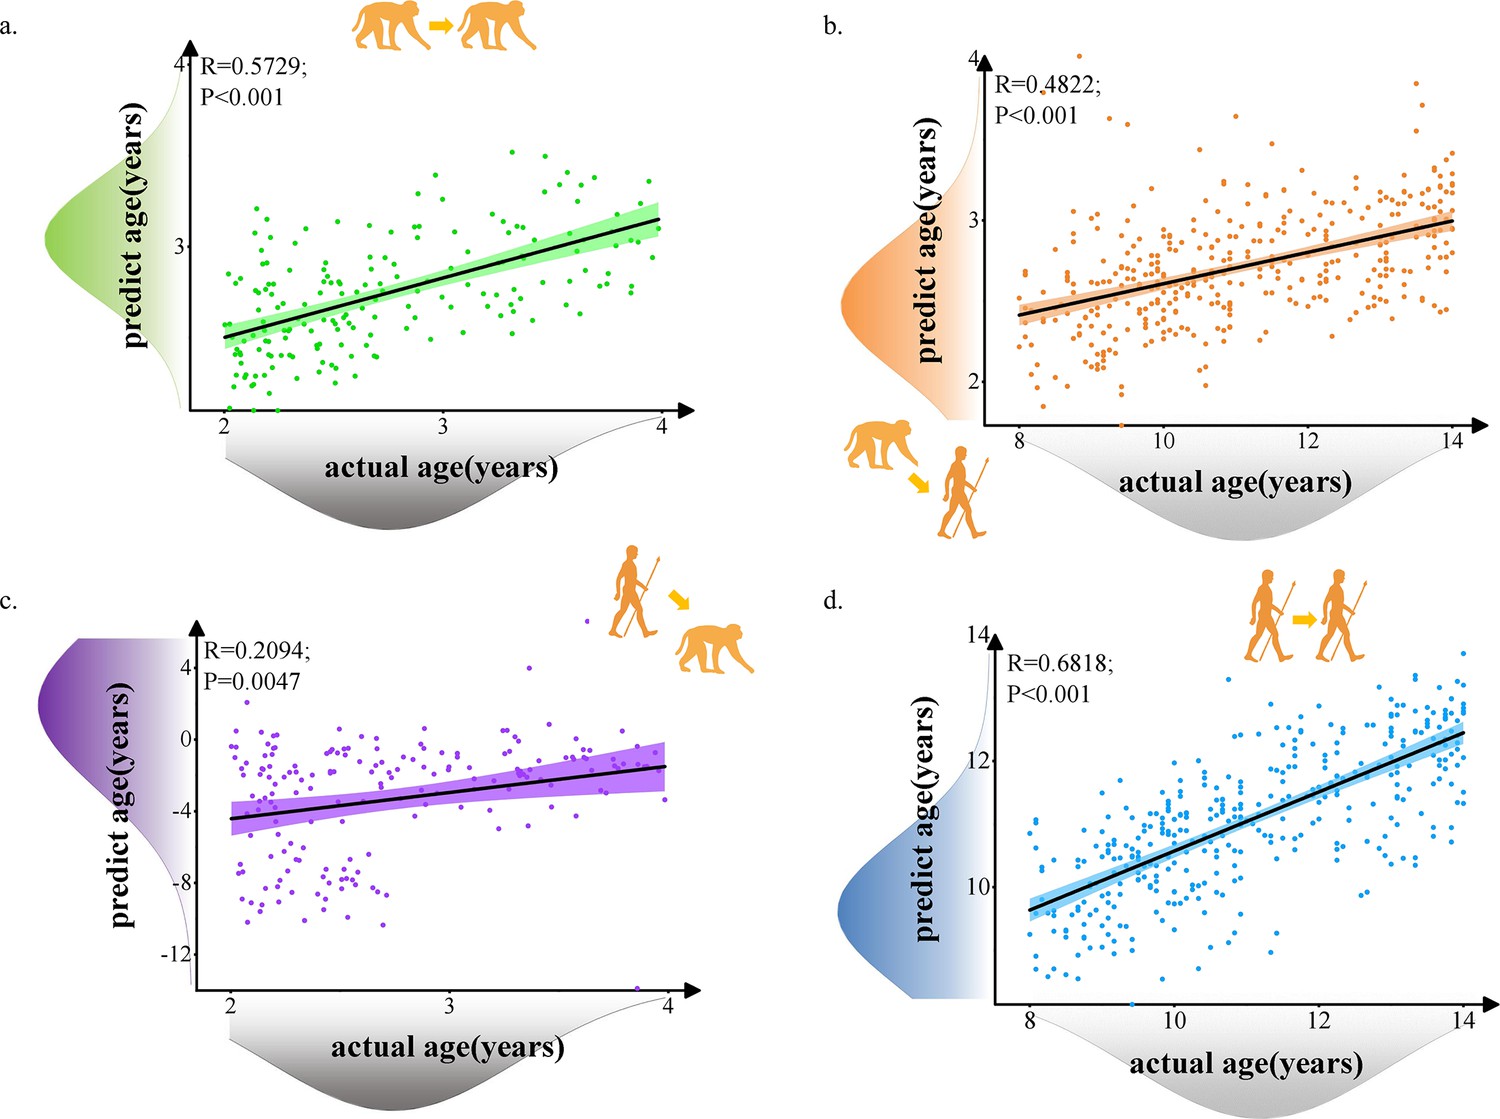
The prediction results of intra- and inter-species using prediction model with 62 selected macaque features and 62 selected human features.
Each dot depicts data from an individual participant. The width of the curve denotes the 95% confidence interval around the linear fitting curve (black line). (a, d). Prediction results for intra-species with green for macaque and blue for human. (b, c). Prediction results for inter-species with orange for predicted human ages using macaque model and purple for predicted macaque ages using human model.
Figure 2—figure supplement 3
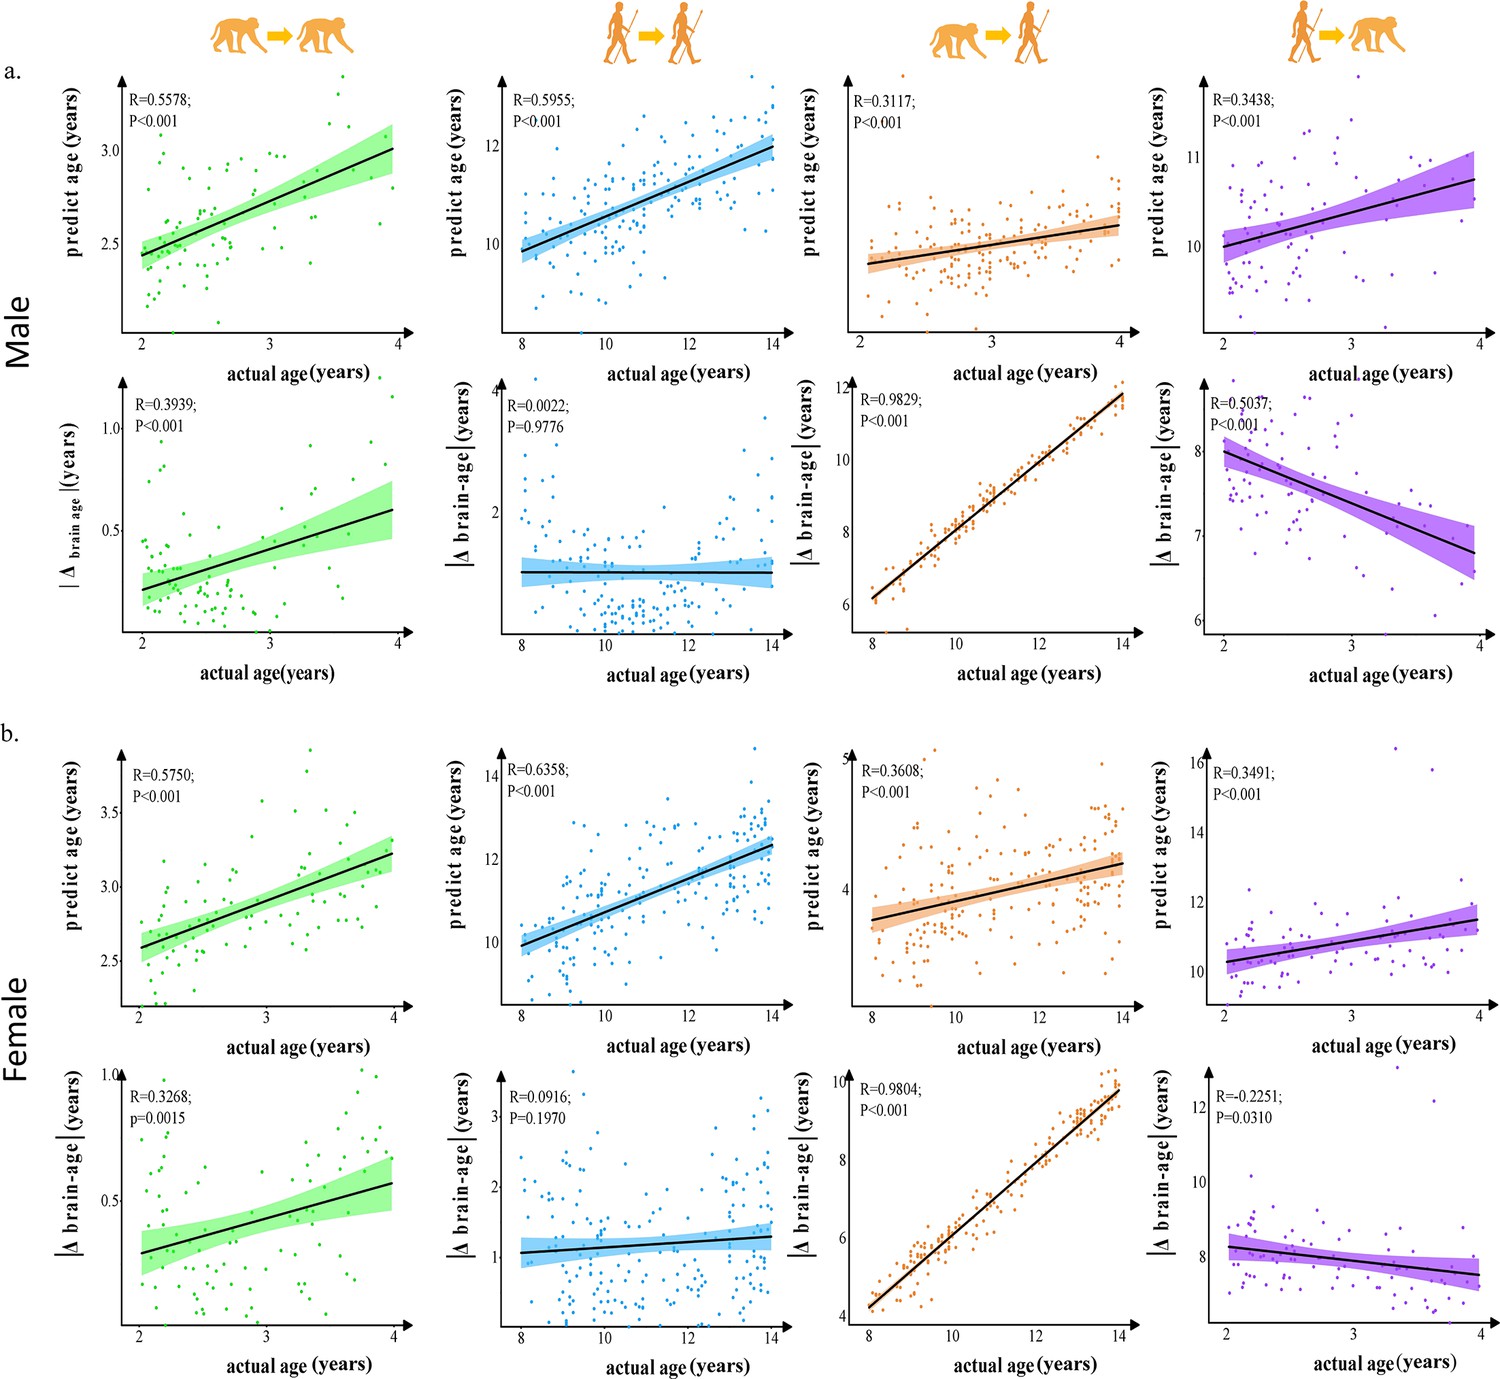
The prediction results of intra- and inter-species in males and females.
Each dot depicts data from an individual participant. The width of the curve denotes the 95% CI. The prediction in intra- and inter-species observed significant and no evolution differences between males and females. (a) The prediction results in males. (b) The prediction results in females.
Figure 3 with 2 supplements
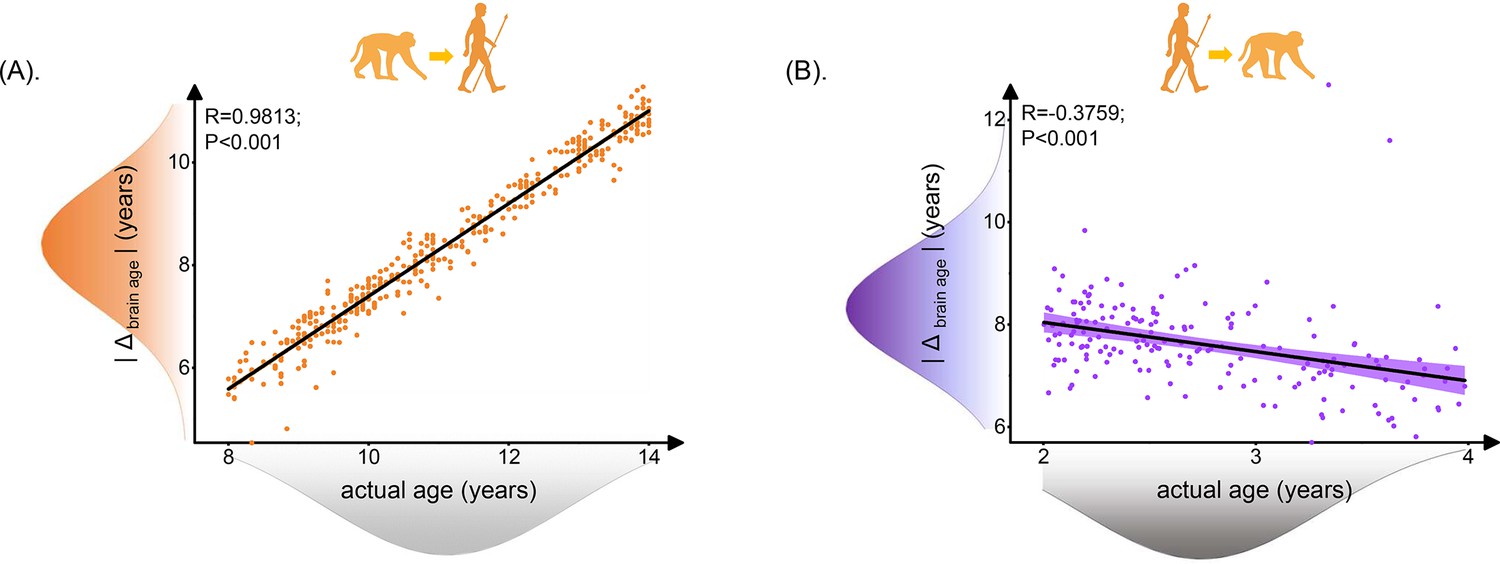
Relationship between brain age gap (|Δ brain age|) and actual ages in human.
Each dot depicts data from an individual participant. The width of the curve denotes the 95% CI. The human brain age gap (|Δ brain age|) is defined as predicted human age using macaque model minus human actual age. The macaque brain age gap (|Δ brain age|) is defined as predicted macaque age using the human model minus macaque actual age. (A) Positive association between |Δ brain age| and actual age in human ages was found (Pearson’s correlation: R = 0.9813, p<0.001, MAE = 2.7120). (B) Negative association between |Δ brain age| and actual ages in macaque was found (Pearson’s correlation: R = –0.3759, p<0.001, MAE = 4.8697). MAE: mean absolute error.
Figure 3—figure supplement 1
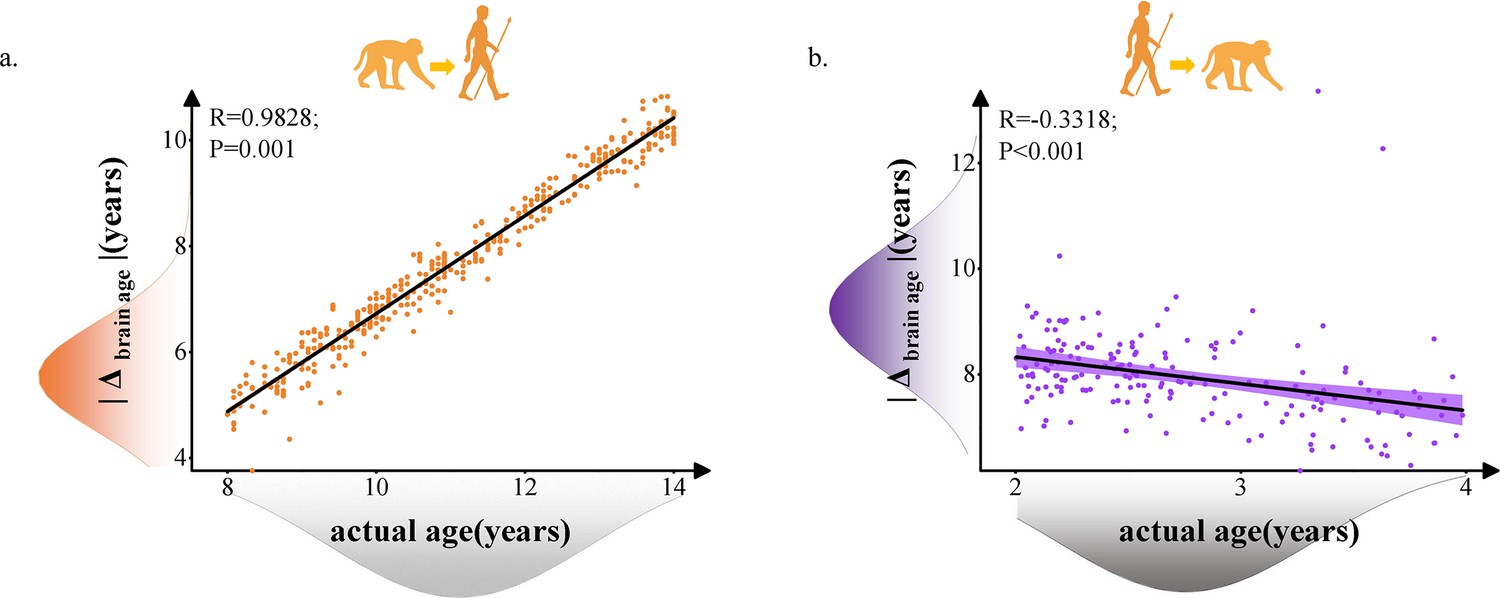
Relationship between brain age gap (|Δ brain age|) and actual ages in human and macaque with 117 selected macaque features and 239 selected human features.
Each dot depicts data from an individual participant. The width of the curve denotes the 95% CI. (a) Positive relationship between |Δ brain age| and actual age in macaque model predicted human ages (Pearson’s correlation: R = 0.9828, p=0.001, MAE = 3.3545). (b) Negative relationship between |Δ brain age| and actual age in macaque model predicted human ages (Pearson’s correlation: R = –0.3318, p<0.001, MAE = 5.2055). MAE: mean absolute error.
Figure 3—figure supplement 2
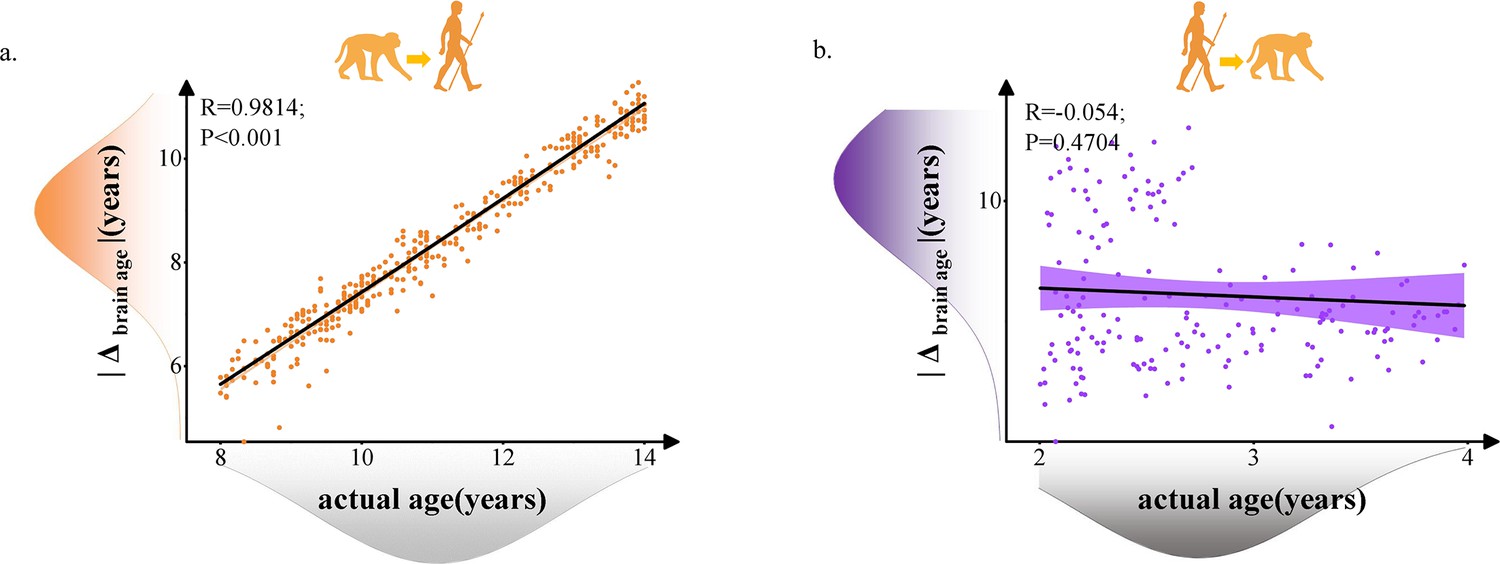
Relationship between brain age gap (|Δ brain age|) and actual ages in human and macaque with 62 selected macaque features and 62 selected human features.
Each dot depicts data from an individual participant. The width of the curve denotes the 95% CI. (a) Positive relationship between |Δ brain age| and actual age in macaque model predicted human ages (Pearson’s correlation: R = 0.9814, p<0.001, MAE = 2.7123). (b) Negative relationship between |Δ brain age| and actual age in macaque model predicted human ages (Pearson’s correlation: R = –0.054, p=0.4704, MAE = 3.4821). MAE: mean absolute error.
Figure 4 with 2 supplements
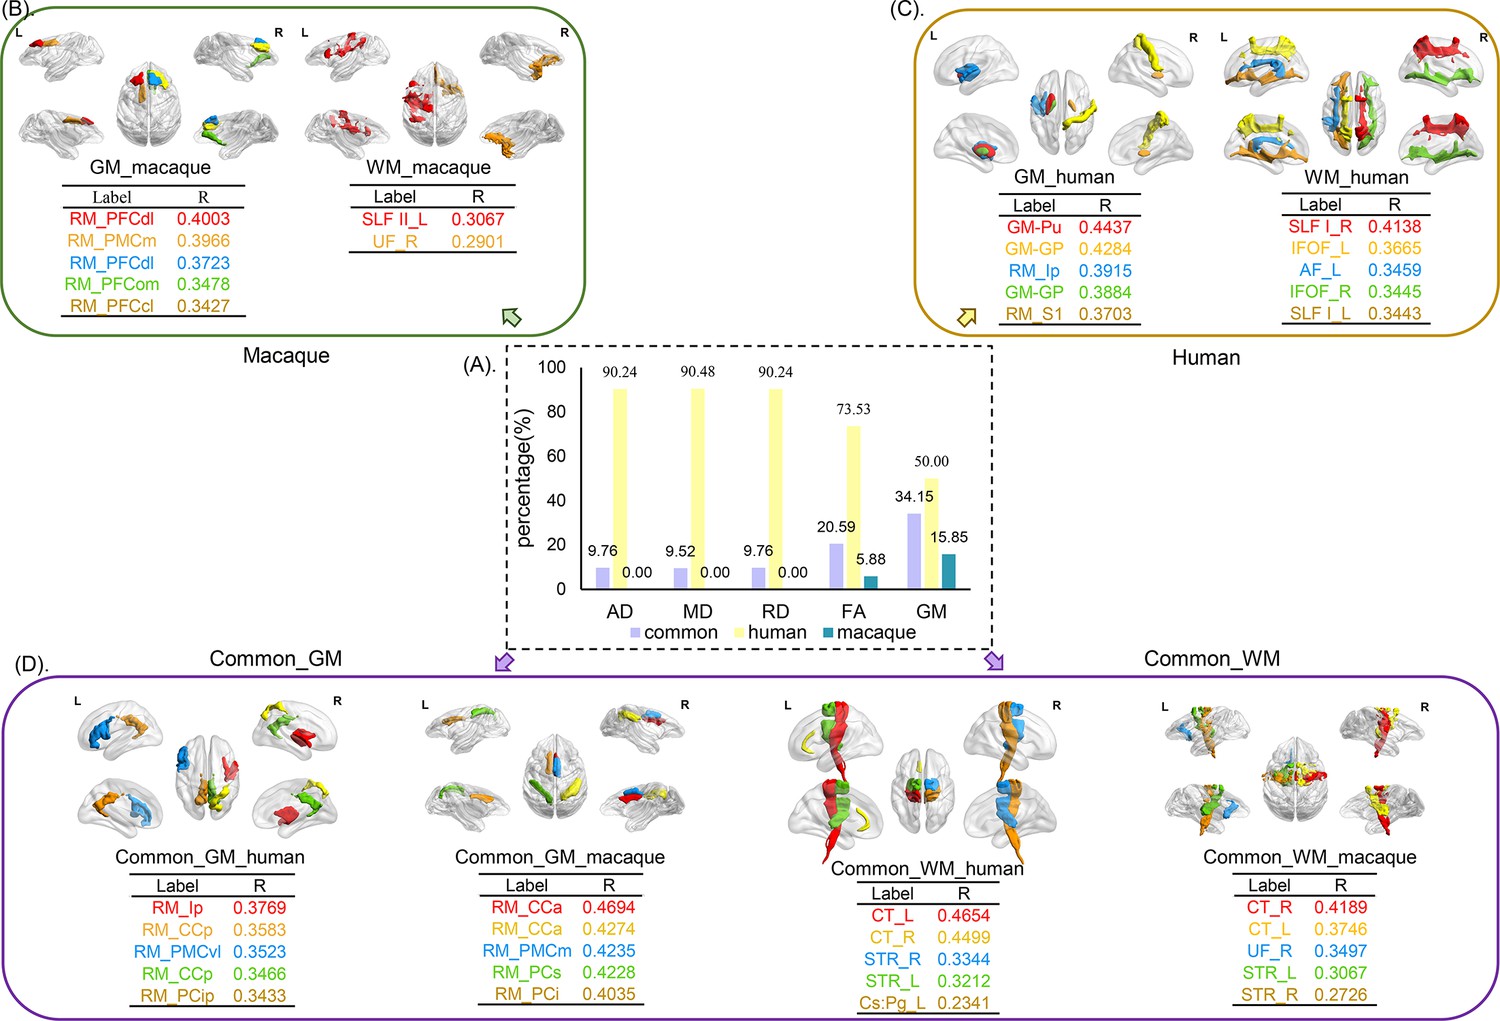
The distribution of selected features for prediction.
The selected features were analyzed based on five parameters (GMV, FA, MD, RD, and AD) and three groups (human-specific, macaque-specific, and common features in human and macaque). (A) The percentage of each group in each parameter. The macaque-specific features are only located in FA and GMV. (B––D) The top five features of macaque-specific, human-specific, and common in human and macaque in gray matter and white matter tracts are shown. FA: fractional anisotropy; MD: mean diffusivity; RD: radial diffusivity; AD: axial diffusivity; GMV: gray matter volumes.
Figure 4—figure supplement 1
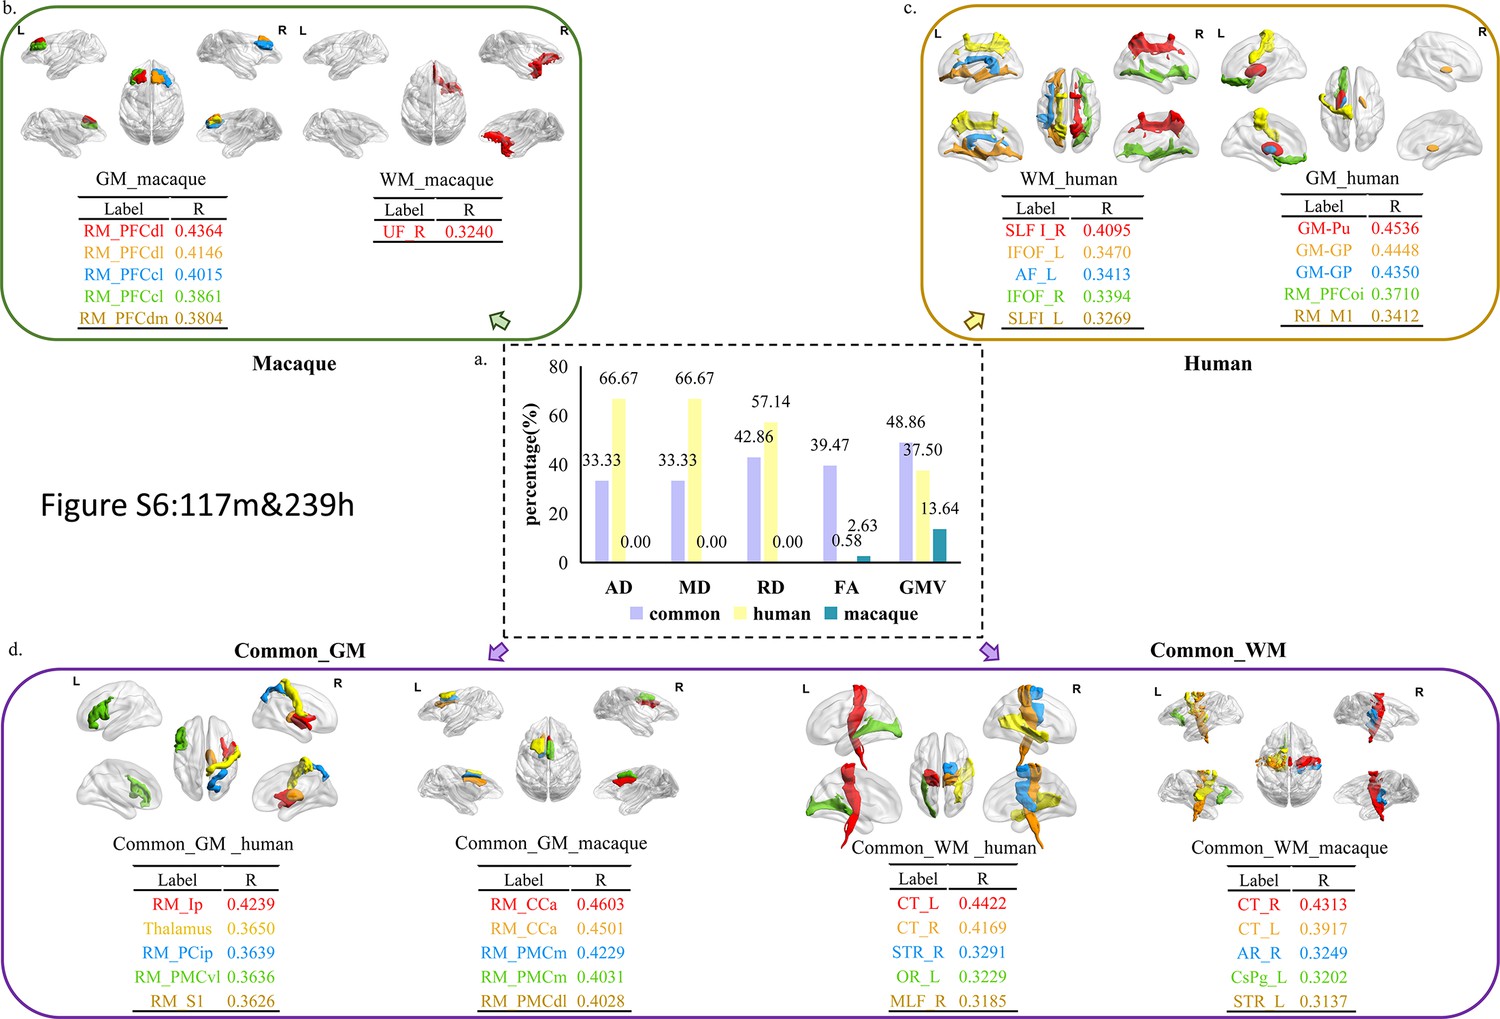
The distribution of features with 117 selected macaque features and 239 selected human features.
The selected features were analyzed based on five parameters (GMV, FA, MD, RD, and AD) and three groups (human-specific, macaque-specific, and common features in human and macaque). (a) The percentage of each group in each parameter. The macaque-specific features are only located in FA and GMV. (b–d) The top five features of macaque-specific, human-specific, and common in human and macaque in gray matter and white matter tracts except only one macaque-specific feature in white matter tracts. FA: fractional anisotropy; MD: mean diffusivity; RD: radial diffusivity; AD: axial diffusivity; GMV: gray matter volumes.
Figure 4—figure supplement 2
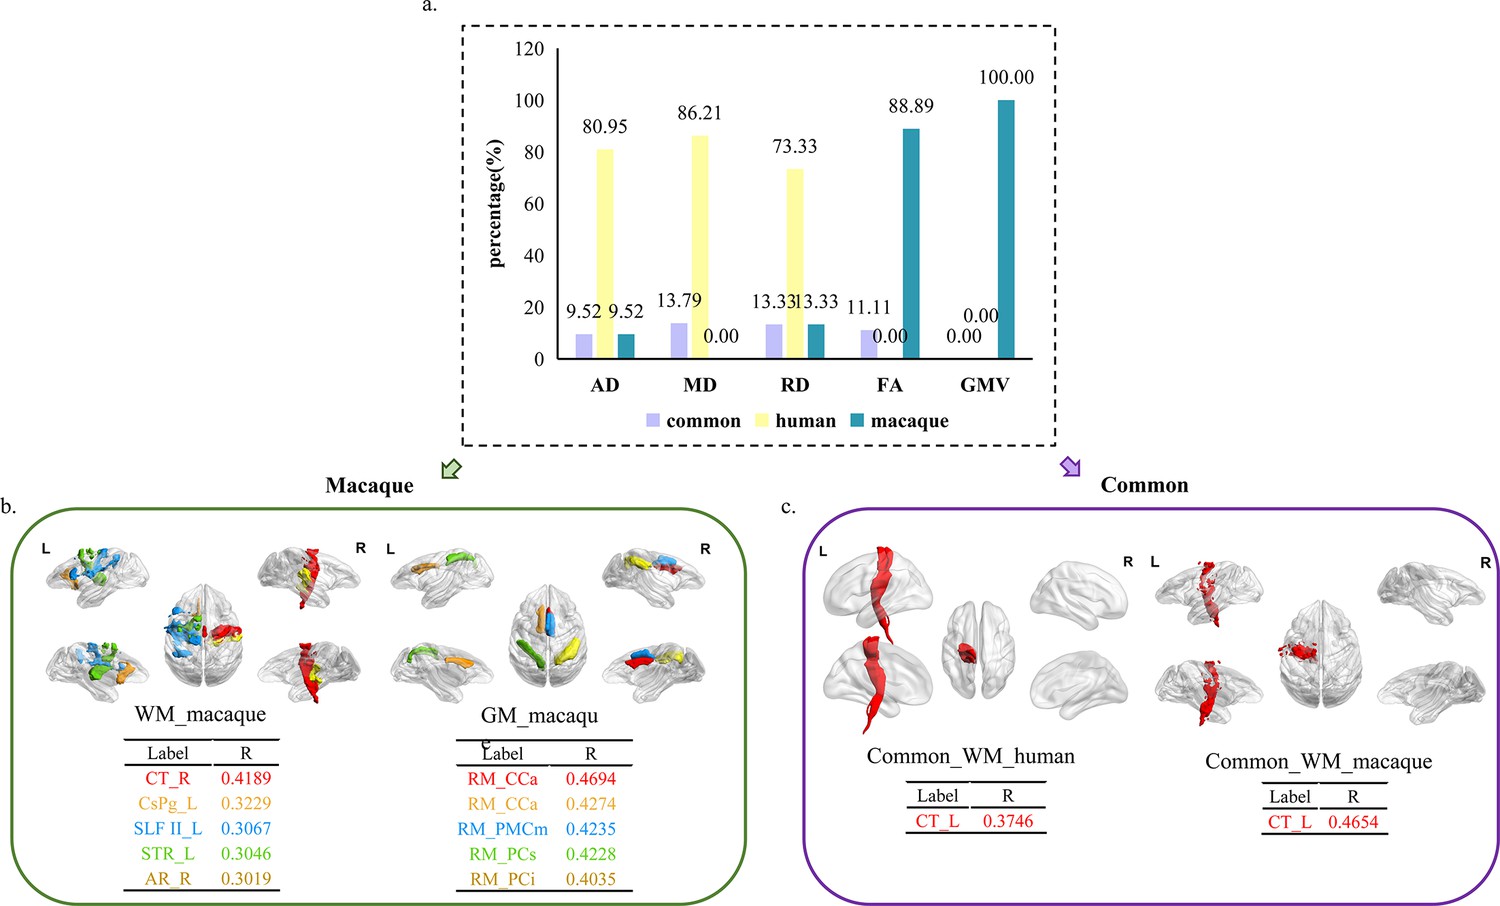
The distribution of features with 62 selected macaque features and 62 selected human features.
The selected features were analyzed based on five parameters (GMV, FA, MD, RD, and AD) and three groups (human-specific, macaque-specific, and common features in human and macaque). (a) The percentage of each group in each parameter. The macaque-specific features are only located in FA and GMV. (b, c) The top five features of macaque-specific in gray matter and white matter tracts and only one common feature in human and macaque. FA: fractional anisotropy; MD: mean diffusivity; RD: radial diffusivity; AD: axial diffusivity; GMV: gray matter volumes.
Figure 5 with 1 supplement
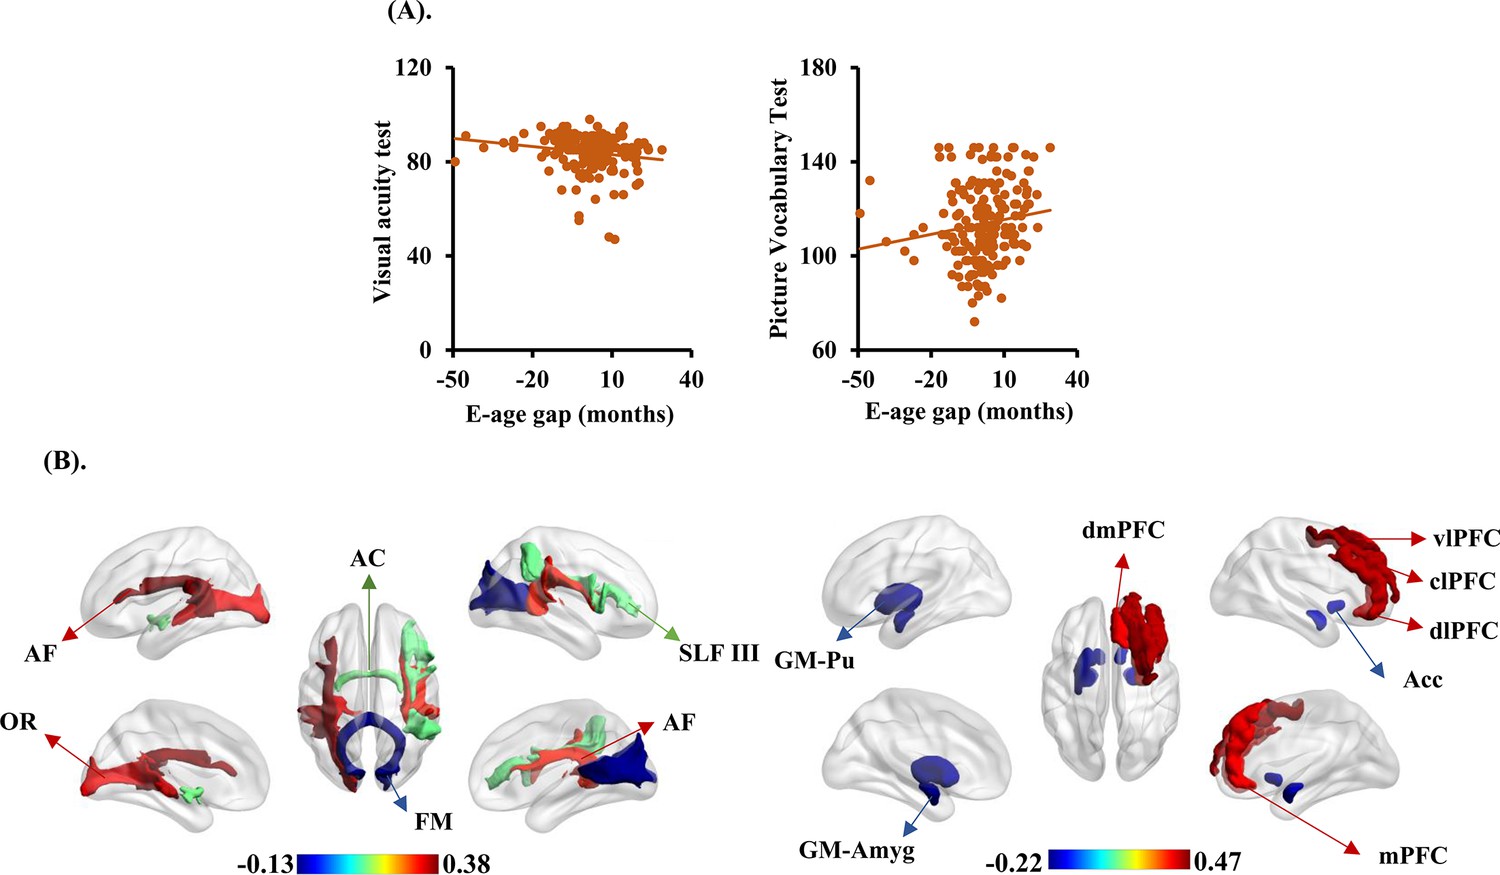
The brain cross-species age gap (BCAP) correlations with behavioral phenotypes, gray matter, and white matter tracts.
(A) Each dot depicts data from an individual participant. Visual acuity test and picture vocabulary test showed negative and positive correlations with BCAP, respectively. (B) The top three and last three features associated to BCAP in white matter tracts on the left, and top five and last five features associated to BCAP in gray matter on the right. These white matter tracts and gray matter related to the language pathways, emotion, and higher-order cognitive functions. AF: arcuate fasciculus; OR: optic radiation; AC: anterior commissure; FM: forceps major; SLF III: superior longitudinal fasciculus III; Pu: putamen; Acc: accumbens nucleus; Amyg: amygdala; dmPFC: dorsomedial prefrontal cortex; vlPFC: ventrolateral prefrontal cortex; mPFC: medial prefrontal cortex; dlPFC: dorsolateral prefrontal cortex; clPFC: centrolateral prefrontal cortex.
-
Figure 5—source data 1
The information of available behavioral phenotypes and their Pearson’s correlation results with BCAP (not all the participants have all the behavioral tests).
The significant results (p<0.05) corrected using FDR-BH are in bold.
- https://cdn.elifesciences.org/articles/96020/elife-96020-fig5-data1-v1.xlsx
Figure 5—figure supplement 1
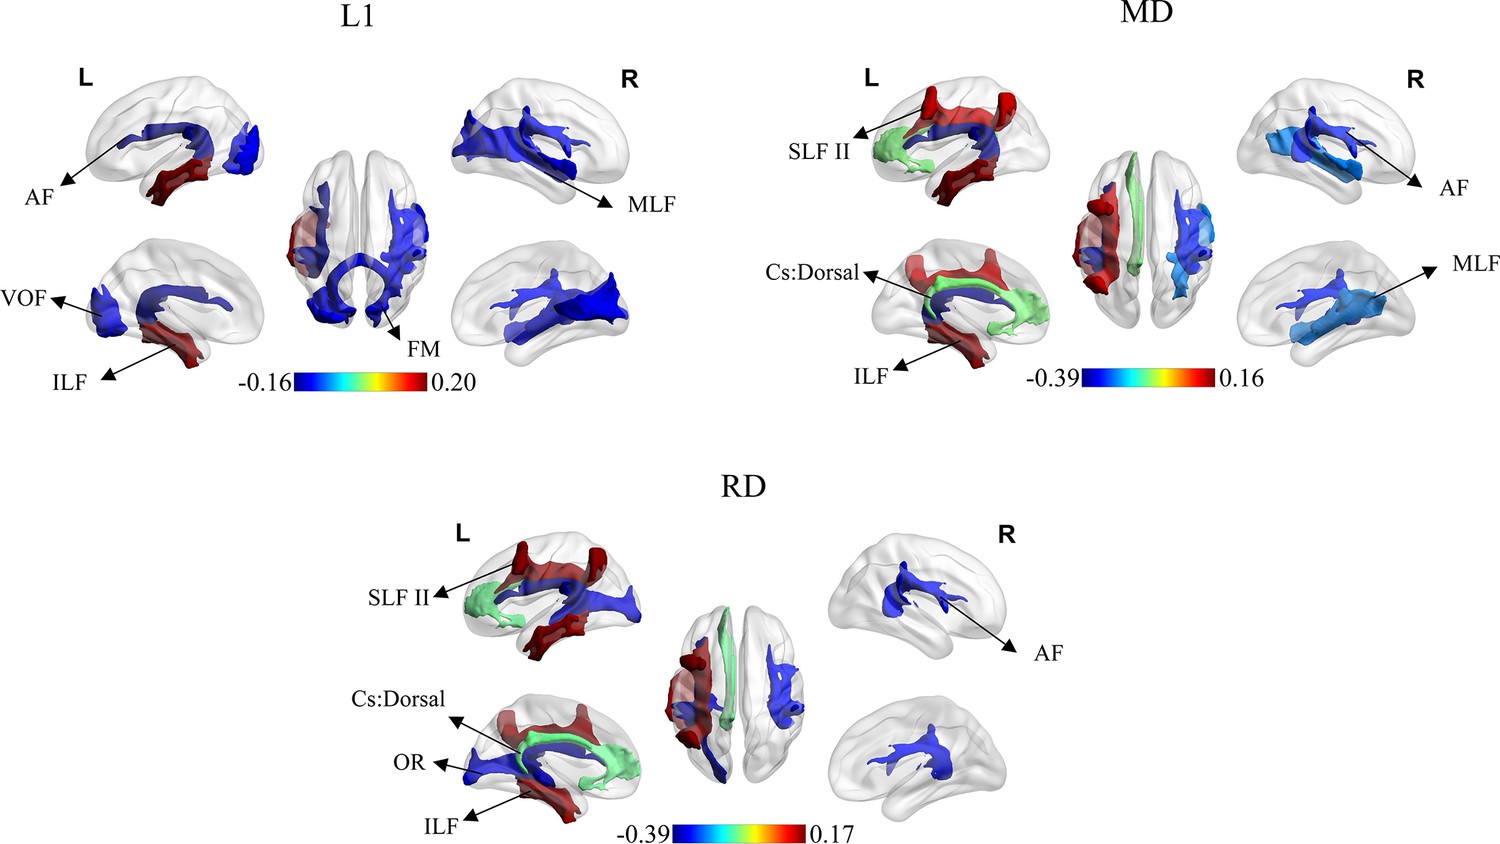
The top three and last three features associated with E-age gap in mean diffusion (MD), radial diffusion (RD), and axial diffusion (AD).
AF: arcuate fasciculus; VOF: vertical occipital fasciculus; ILF: inferior longitudinal fasciculus; FM: forceps major; MLF: middle longitudinal fasciculus; SLF II: superior longitudinal fasciculus II; Cs: dorsal: cingulum subsection: dorsal; OR: optic radiation.
Tables
Table 1
Demographic information for human and macaque in this study.
| Subjects | Human(8–14 years) | Macaque(2–4 years) |
|---|---|---|
| Number of subjects | 370 | 181 |
| Gender (male:female) | 170/200 | 89/92 |
| Age (mean ± SD) | 11.07 ± 1.75 | 2.75 ± 0.57 |
| Male age (mean ± SD) | 10.89 ± 1.61 | 2.62 ± 0.51 |
| Female age (mean ± SD) | 11.23 ± 1.85 | 2.87 ± 0.60 |
Additional files
Download links
A two-part list of links to download the article, or parts of the article, in various formats.
Downloads (link to download the article as PDF)
Open citations (links to open the citations from this article in various online reference manager services)
Cite this article (links to download the citations from this article in formats compatible with various reference manager tools)
Cross-species alignment along the chronological axis reveals evolutionary effect on structural development of the human brain
eLife 13:e96020.
https://doi.org/10.7554/eLife.96020


