A modified BPaL regimen for tuberculosis treatment replaces linezolid with inhaled spectinamides
- Mycobacteria Research Laboratories, Colorado State University, United States
- Microbiology, Immunology and Pathology, Colorado State University, United States
- Program in Cell & Molecular Biology, Colorado State University, United States
- Department of Chemical Biology and Therapeutics, St. Jude Children’s Research Hospital, United States
- Technology Advancement and Commercialization, RTI International, United States
- Department of Pharmaceutical Sciences, University of Tennessee Health Science Center, United States
Figures
Figure 1 with 12 supplements
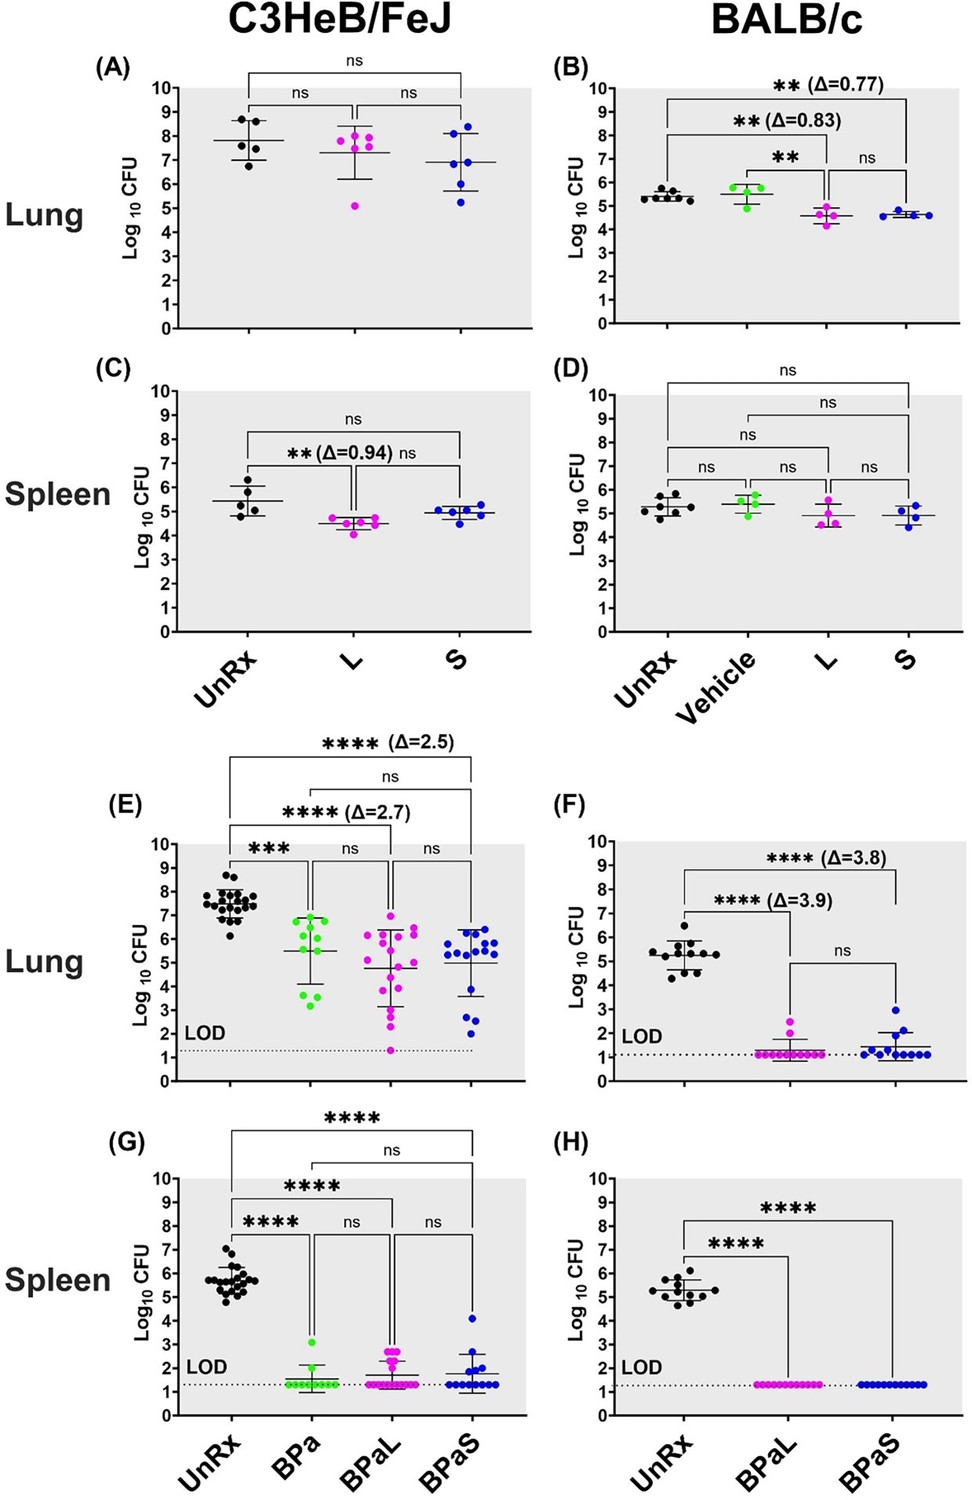
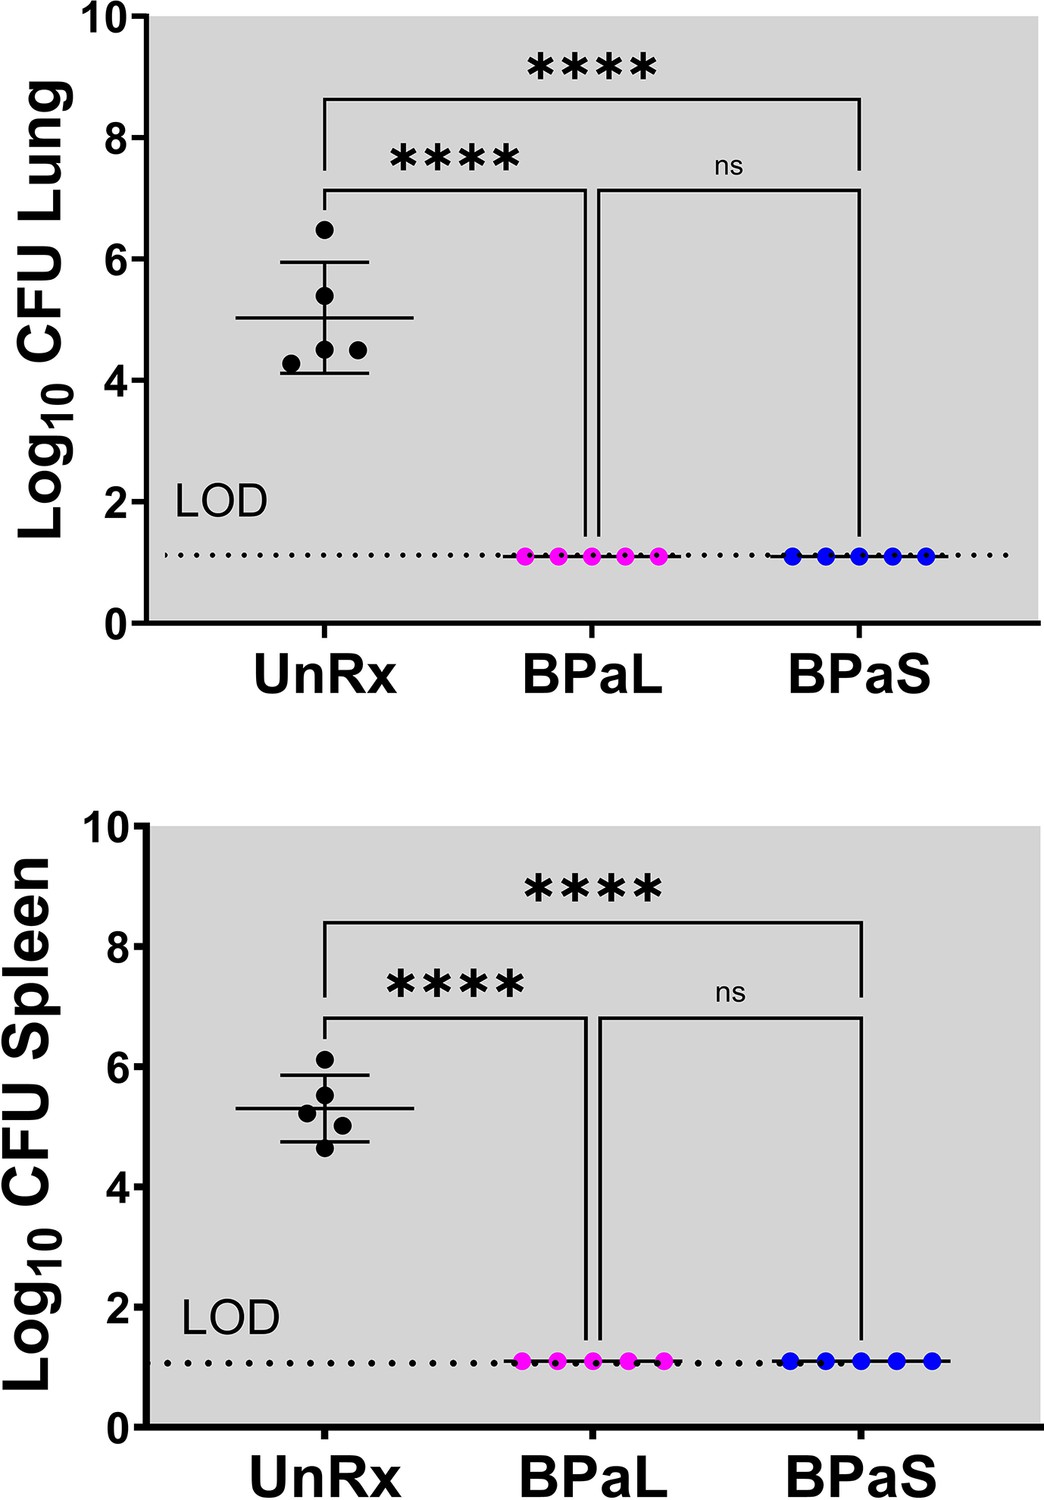
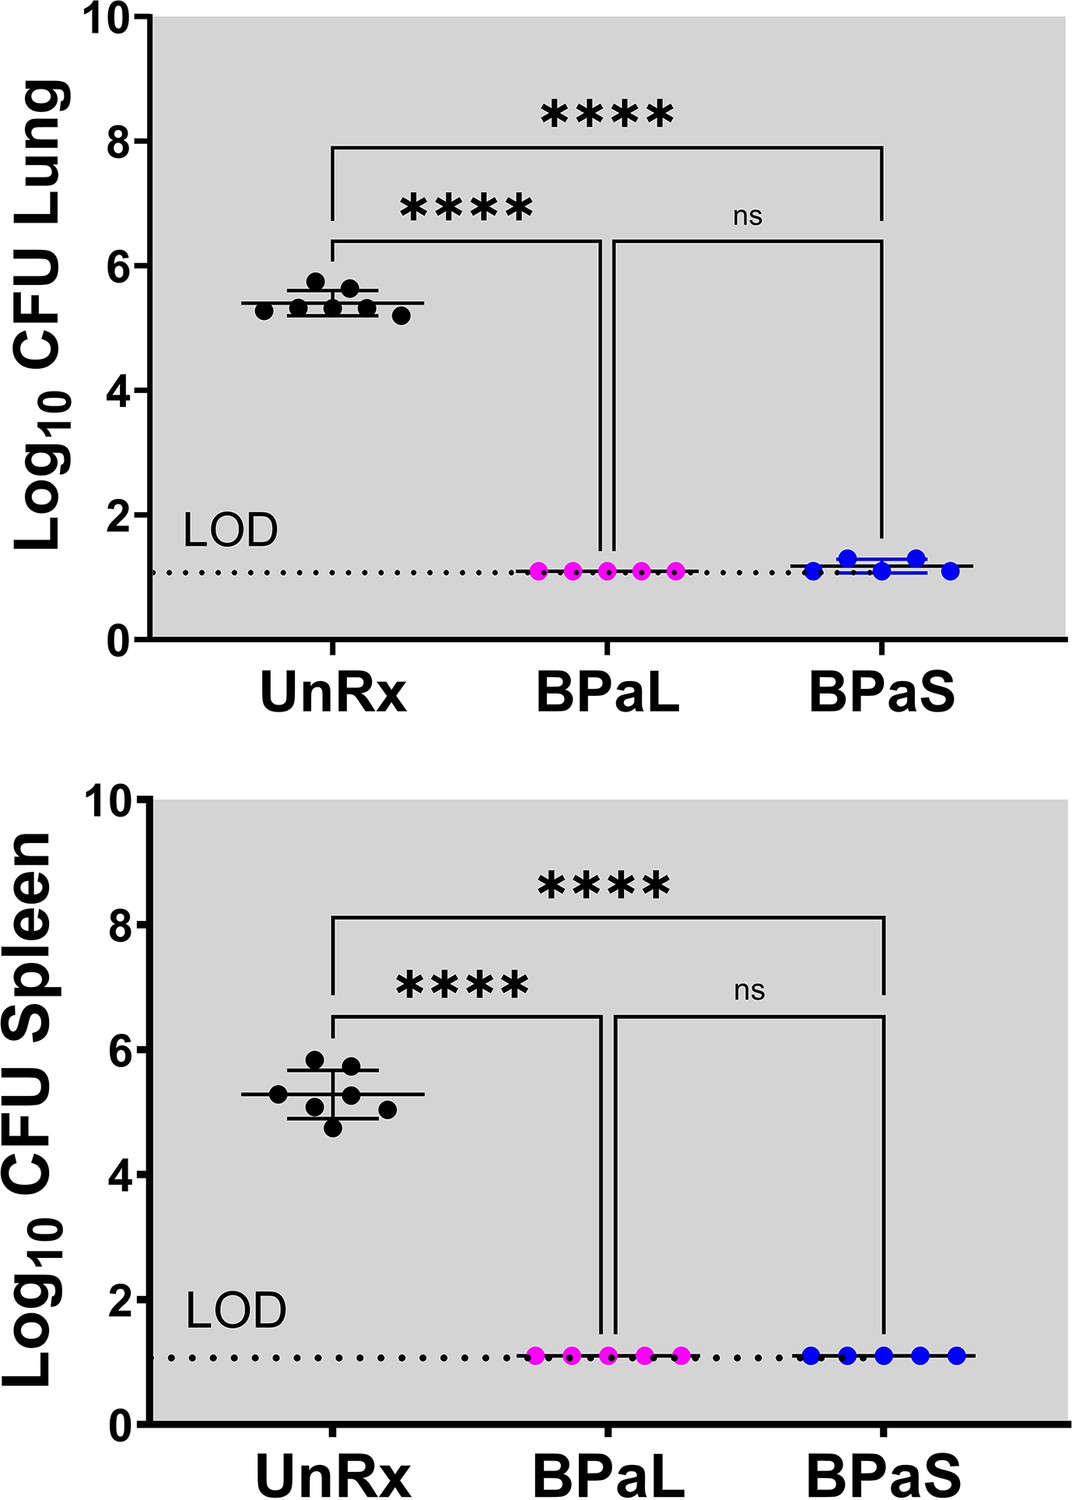
Bactericidal effect of BPaL and BPaS in TB mouse models after 4-weeks of treatment.
BALB/c and C3HeB/FeJ female mice were chronically infected with a low dose aerosol infection of Mtb Erdman strain to deliver ∼75 and ∼100 bacilli respectively. Post-infection, BALB/c and C3HeB/FeJ mice were rested for 4 and 8-9 weeks respectively until they were randomly assigned to the study groups. The mice were treated with monotherapy of linezolid or spectinamide 1599 or combination therapy of BPaL, BPa or BPaS for 4 weeks. Bedaquiline (B), pretomanid (Pa) and linezolid (L) were administered at 25, 100 and 100 mg/kg respectively by oral gavage for 5/7 a week while spectinamide 1599 at 50 and 100 mg/kg in BALB/c and C3HeB/FeJ TB models respectively for 3/7 a week on the alternate days via intrapulmonary aerosol delivery. On the third day of the last treatment, the mice were euthanized, and their lungs and spleen were collected. The organs were homogenized, serially diluted and plated on 7H11 agar with 4% charcoal (to avoid drug carry-over effect) to determine bacterial burden in the form of colony forming units (CFU) in each sample. CFU were enumerated after 4-6 weeks of incubation at 37 °C and expressed as log10.C3HeB/FeJ and BALB/c TB models showing efficacy of monotherapy (A-D) and combination therapy (E-H). The C3HeB/FeJ graphs (E, G) represent the pooled data from three independent studies (n=3-8, Figure 1—figure supplements 1–3) and two of the three studies contained BPa as a reference control. The BALB/c graphs (F, H) represent the pooled data from two independent studies (n=5, Figure 1—figure supplements 8 and 9). Statistical significance was calculated using one-way ANOVA with Tukey’s multiple comparison test, p < 0.05 was considered significant and ** = p<0.001, *** = p<0.0001, **** = P<0.0001. UnRx = untreated, L = linezolid, S = spectinamide 1599, LOD: limit of detection.
-
Figure 1—source data 1
cfu of monotherapy in C3HeB/FeJ mice.
- https://cdn.elifesciences.org/articles/96190/elife-96190-fig1-data1-v1.xlsx
-
Figure 1—source data 2
cfu of monotherapy in BALB/c mice.
- https://cdn.elifesciences.org/articles/96190/elife-96190-fig1-data2-v1.xlsx
-
Figure 1—source data 3
cfu of combination therapy in C3HeB/FeJ mice (combined data).
- https://cdn.elifesciences.org/articles/96190/elife-96190-fig1-data3-v1.xlsx
-
Figure 1—source data 4
cfu of combination therapy in BALB/c mice (combined data).
- https://cdn.elifesciences.org/articles/96190/elife-96190-fig1-data4-v1.xlsx
Figure 1—figure supplement 1
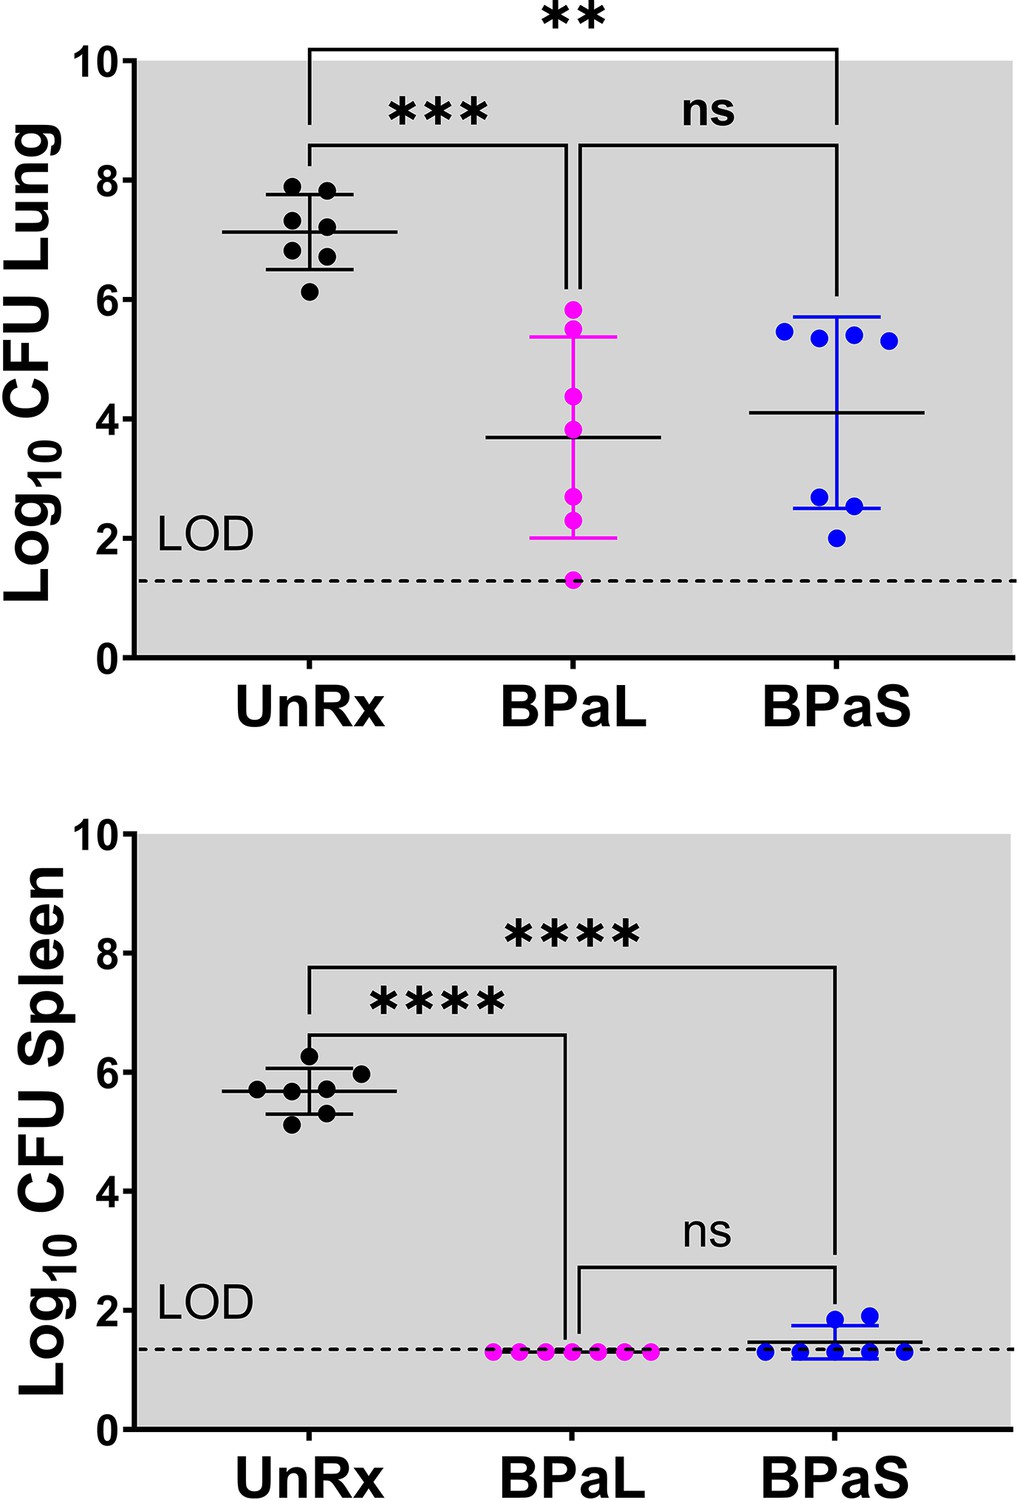
C3HeB/FeJ Study 1, bacterial burden (CFU) in Mycobacterium tuberculosis infected C3HeB/FeJ mice treated with BPaL and BPaS regimen for 4 weeks CFU data.
Bacterial burden (colony-forming units, CFU) in Mycobacterium tuberculosis infected C3HeB/FeJ mice treated with BPaL and BPaS regimen for 4weeks. n=7, LOD: limit of detection, p<0.05.
-
Figure 1—figure supplement 1—source data 1
Numerical values of CFU in Figure 1—figure supplement 1.
- https://cdn.elifesciences.org/articles/96190/elife-96190-fig1-figsupp1-data1-v1.xlsx
Figure 1—figure supplement 2
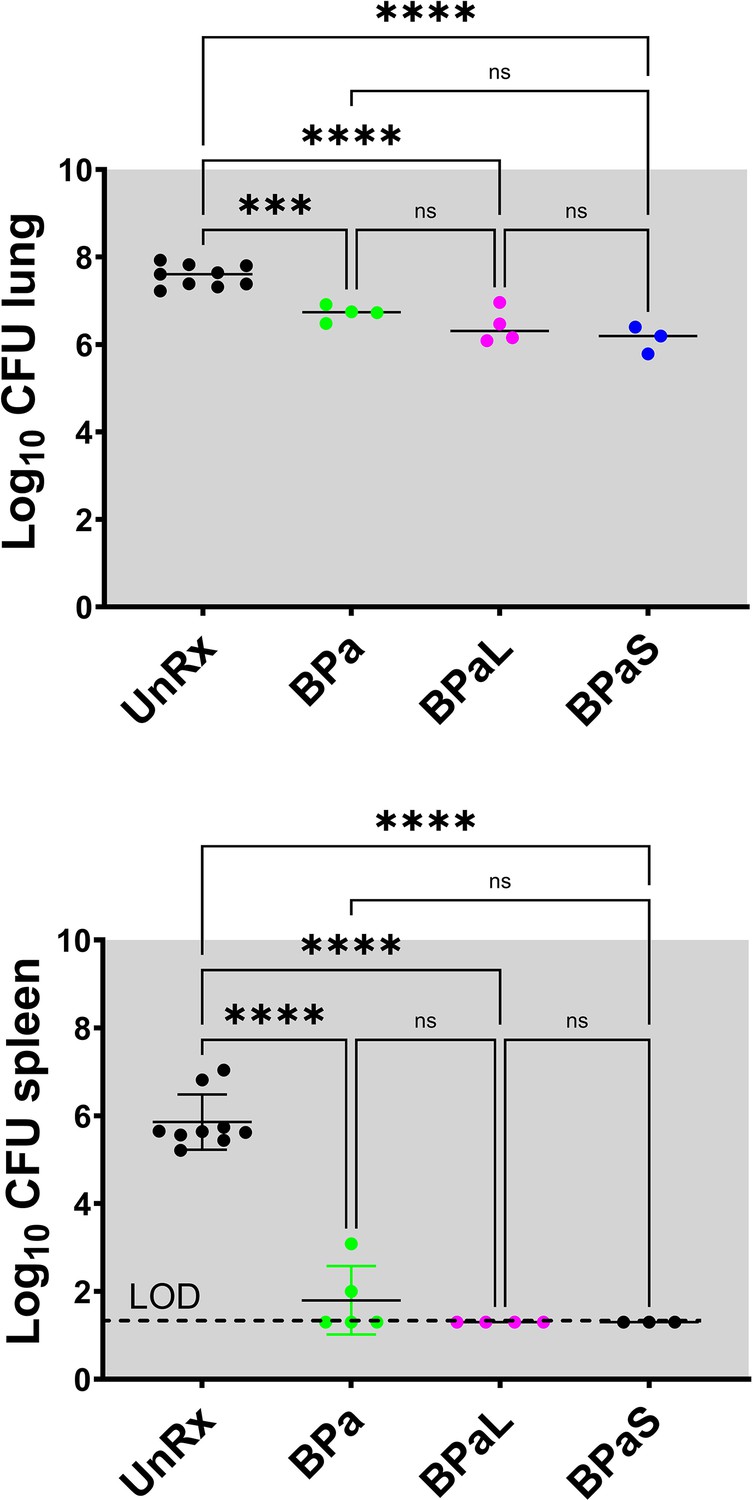
C3HeB/FeJ Study 2, bacterial burden (CFU) in Mycobacterium tuberculosis infected C3HeB/FeJ mice treated with BPa, BPaL and BPaS regimen for 4 weeks CFU data.
Bacterial burden (colony-forming units, CFU) in Mycobacterium tuberculosis infected C3HeB/FeJ mice treated with BPa, BPaL, and BPaS regimen for 4 weeks. n=3–9, LOD: limit of detection, p<0.05.
-
Figure 1—figure supplement 2—source data 1
Numerical values of CFU for Figure 1—figure supplement 2.
- https://cdn.elifesciences.org/articles/96190/elife-96190-fig1-figsupp2-data1-v1.xlsx
Figure 1—figure supplement 3
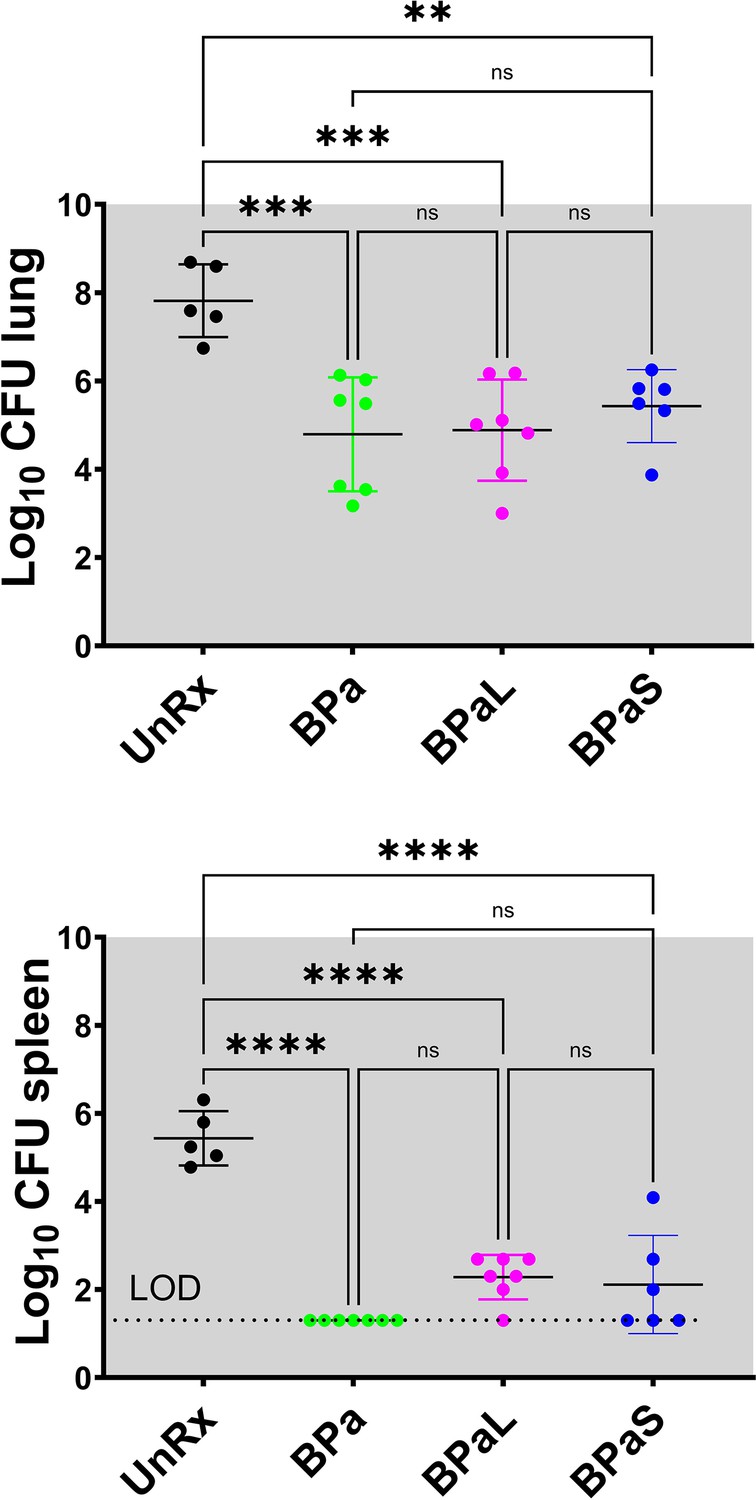
C3HeB/FeJ Study 3, bacterial burden (CFU) in Mycobacterium tuberculosis infected C3HeB/FeJ mice treated with BPa, BPaL and BPaS regimen for 4 weeks.
Bacterial burden (colony-forming unit CFU) in Mycobacterium tuberculosis infected C3HeB/FeJ mice treated with BPa, BPaL, and BPaS regimen for 4 weeks. n=5–7, LOD: limit of detection, p<0.05.
-
Figure 1—figure supplement 3—source data 1
Numerical values of CFU for Figure 1—figure supplement 3.
- https://cdn.elifesciences.org/articles/96190/elife-96190-fig1-figsupp3-data1-v1.xlsx
Figure 1—figure supplement 4
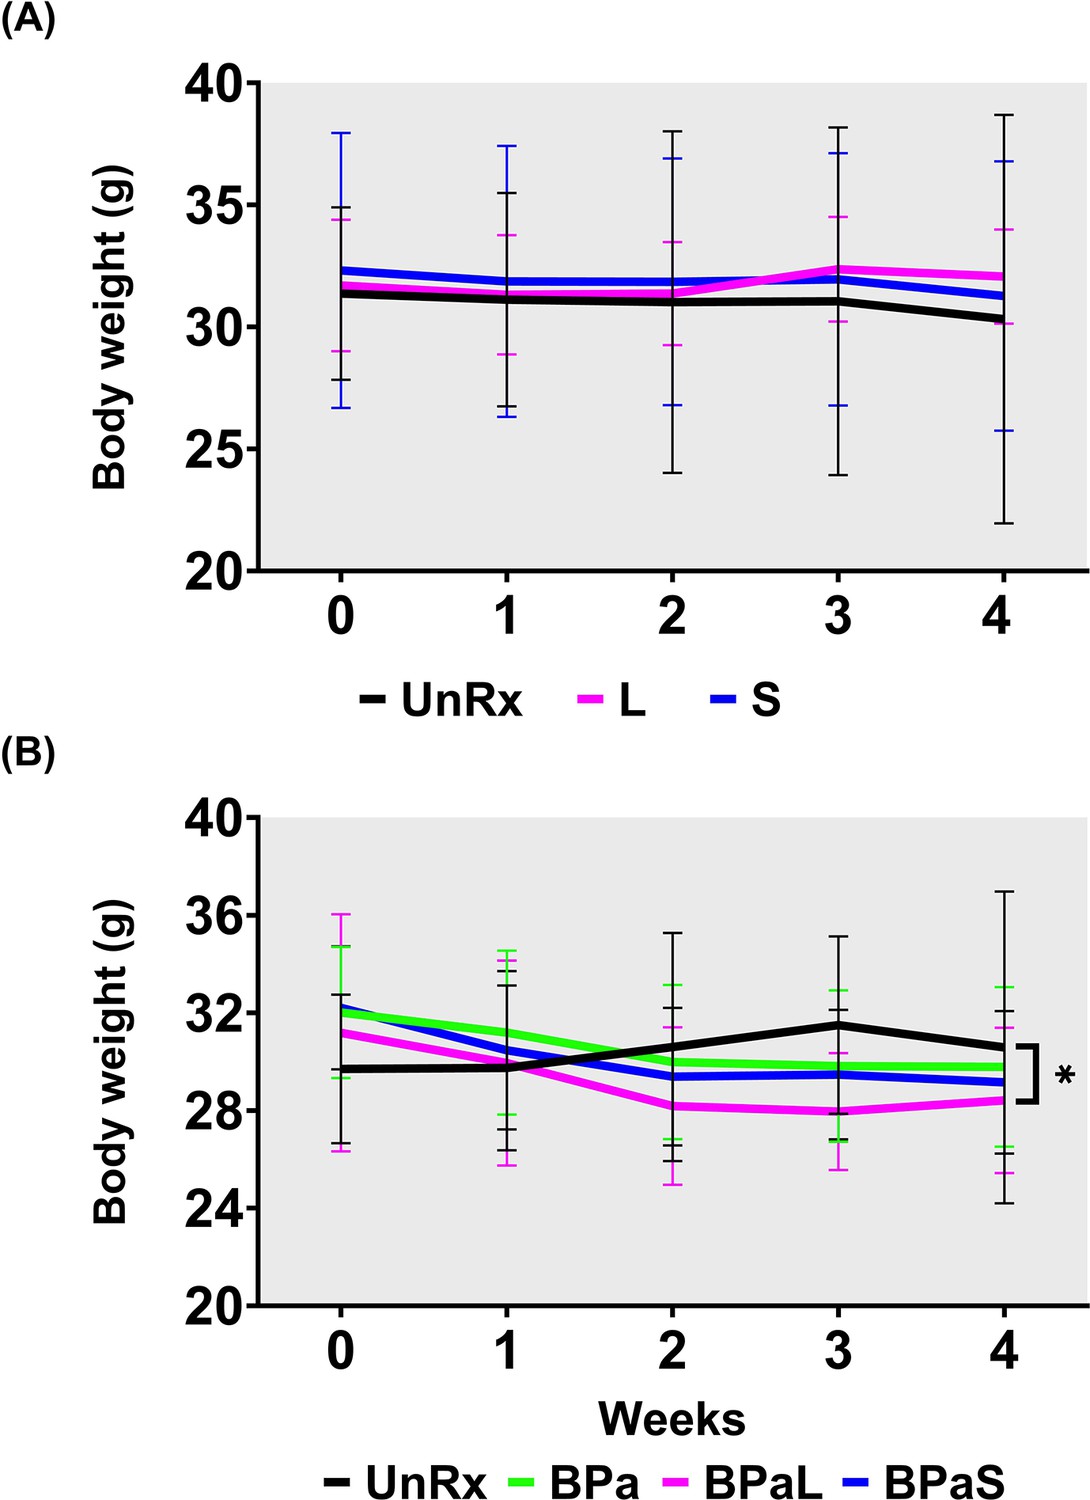
Combined data for change in body weight during monotherapy and combination therapy in C3HeB/Fej mice .
Change in the average body weight of Mycobacterium tuberculosis infected C3HeB/FeJ mice during drug treatment. (A) Represents the change during monotherapy of linezolid (L) and spectinamide 1599 (S) compared to untreated (UnRx) control while (B) represents the combined data from three independent studies during combination treatment with BPa, BPaL, and BPaS. p<0.05.
-
Figure 1—figure supplement 4—source data 1
Numerical values for body weight.
- https://cdn.elifesciences.org/articles/96190/elife-96190-fig1-figsupp4-data1-v1.xlsx
Figure 1—figure supplement 5

C3HeB/FeJ Study 1 change in body weight during combination therapy in C3HeB/Fej mice, weight data.
Change in the average body weight of Mycobacterium tuberculosis infected C3HeB/FeJ mice during drug treatment. n=7, p<0.05.
-
Figure 1—figure supplement 5—source data 1
Numerical values of body weight.
- https://cdn.elifesciences.org/articles/96190/elife-96190-fig1-figsupp5-data1-v1.xlsx
Figure 1—figure supplement 6

C3HeB/FeJ Study 2 change in body weight during combination therapy in C3HeB/Fej mice, weight data.
Change in the average body weight of Mycobacterium tuberculosis infected C3HeB/FeJ mice during drug treatment. n=3–9, p<0.05.
-
Figure 1—figure supplement 6—source data 1
Numerical values of body weight.
- https://cdn.elifesciences.org/articles/96190/elife-96190-fig1-figsupp6-data1-v1.xlsx
Figure 1—figure supplement 7

C3HeB/FeJ Study 3 change in body weight during combination therapy in C3HeB/Fej mice, weight data.
Change in the average body weight of Mycobacterium tuberculosis infected C3HeB/FeJ mice during drug treatment. n=5–7, p<0.05.
-
Figure 1—figure supplement 7—source data 1
Numerical values of body weight.
- https://cdn.elifesciences.org/articles/96190/elife-96190-fig1-figsupp7-data1-v1.xlsx
Figure 1—figure supplement 8
BALB/c Study 1, CFU data.
Bacterial burden (colony-forming units, CFU) in Mycobacterium tuberculosis infected BALB/c mice treated with BPaL and BPaS regimen for 4 weeks. n=5, LOD: limit of detection, p<0.05.
-
Figure 1—figure supplement 8—source data 1
Numerical values for CFU in Balb/c mice.
- https://cdn.elifesciences.org/articles/96190/elife-96190-fig1-figsupp8-data1-v1.xlsx
Figure 1—figure supplement 9
BALB/c Study 2, CFU data.
Bacterial burden (colony-forming units, CFU) in Mycobacterium tuberculosis infected BALB/c mice treated with BPaL and BPaS regimen for 4 weeks. n=5–7, LOD: limit of detection, p<0.05.
-
Figure 1—figure supplement 9—source data 1
Numerical values for CFU in Balb/c mice.
- https://cdn.elifesciences.org/articles/96190/elife-96190-fig1-figsupp9-data1-v1.xlsx
Figure 1—figure supplement 10
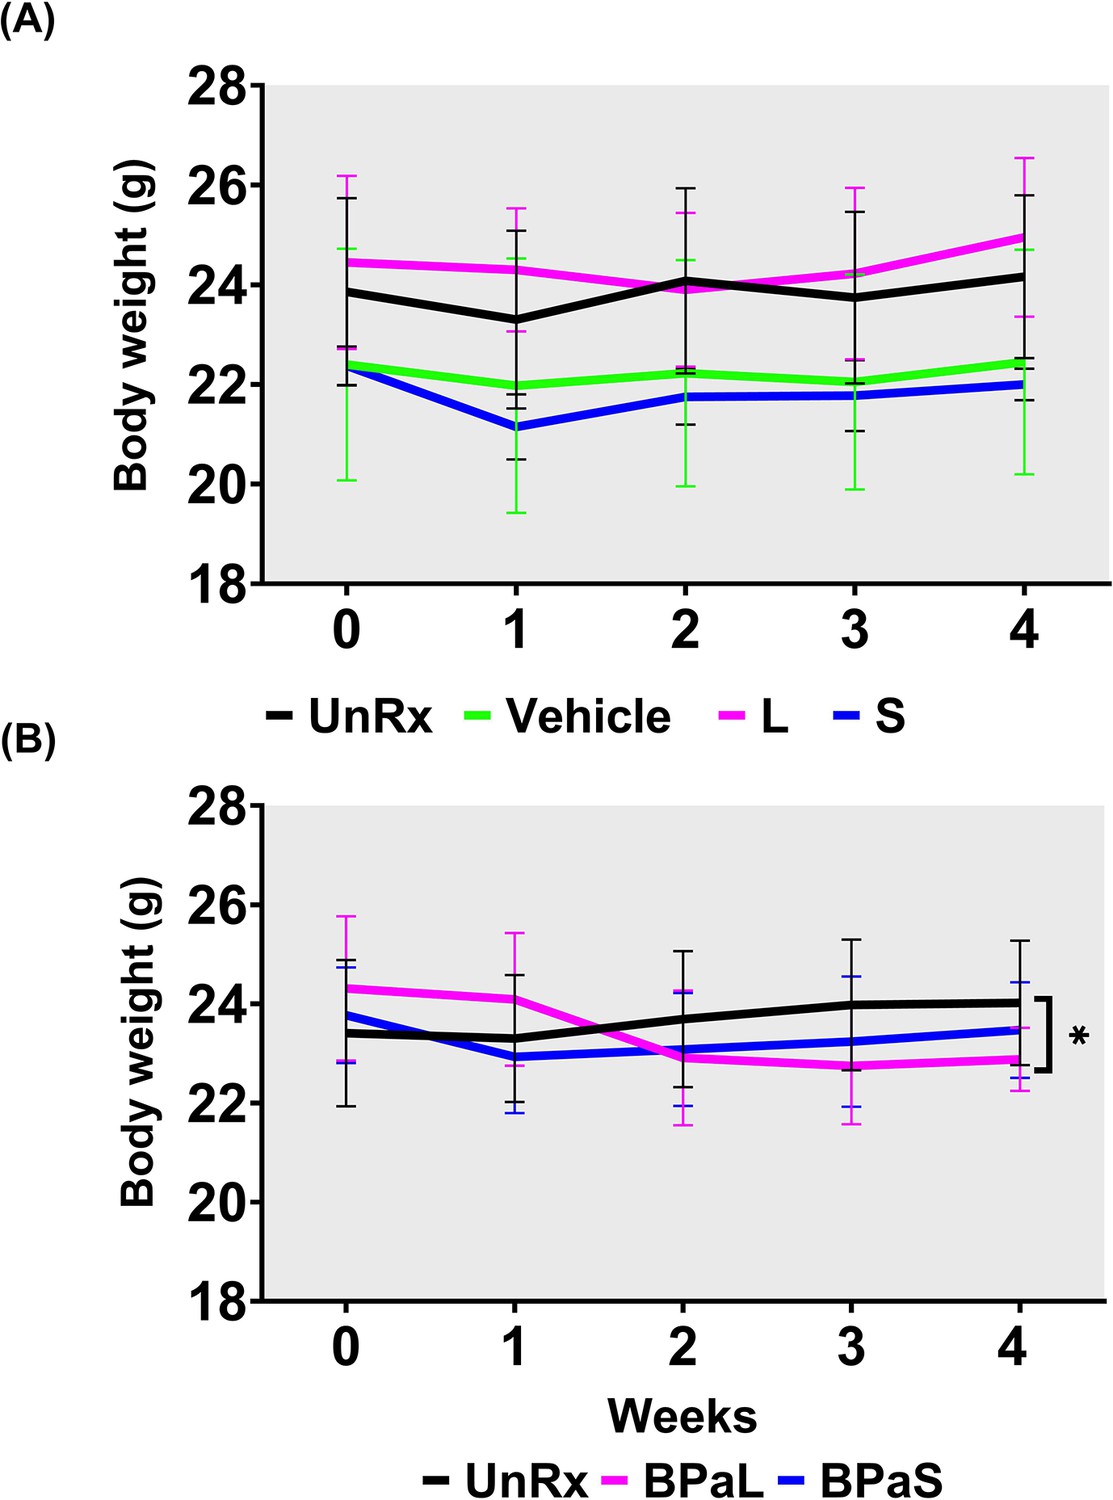
Combined data for change in body weight during monotherapy and combination therapy in Balb/c mice.
Change in the average body weight of Mycobacterium tuberculosis infected BALB/c mice during drug treatment. (A) represents the change during monotherapy of linezolid (L) and spectinamide 1599 (S) compared to untreated (UnRx) and vehicle control while (B) represents the combined data from two independent studies during combination treatment with BPaL and BPaS. p<0.05.
-
Figure 1—figure supplement 10—source data 1
Numerical values for body weight in Balb/c mice.
- https://cdn.elifesciences.org/articles/96190/elife-96190-fig1-figsupp10-data1-v1.xlsx
Figure 1—figure supplement 11

BALB/c Study 1 change in body weight during combination therapy in Balb/c mice, weight data.
Change in the average body weight of Mycobacterium tuberculosis infected BALB/c mice during drug treatment. n=5, p<0.05.
-
Figure 1—figure supplement 11—source data 1
Numerical values for CFU in Balb/c mice.
- https://cdn.elifesciences.org/articles/96190/elife-96190-fig1-figsupp11-data1-v1.xlsx
Figure 1—figure supplement 12

BALB/c Study 2 change in body weight during combination therapy in Balb/c mice, weight data.
Change in the average body weight of Mycobacterium tuberculosis infected BALB/c mice during drug treatment. n=5–7, p<0.05.
-
Figure 1—figure supplement 12—source data 1
Numerical values for CFU in Balb/c mice.
- https://cdn.elifesciences.org/articles/96190/elife-96190-fig1-figsupp12-data1-v1.xlsx
Figure 2
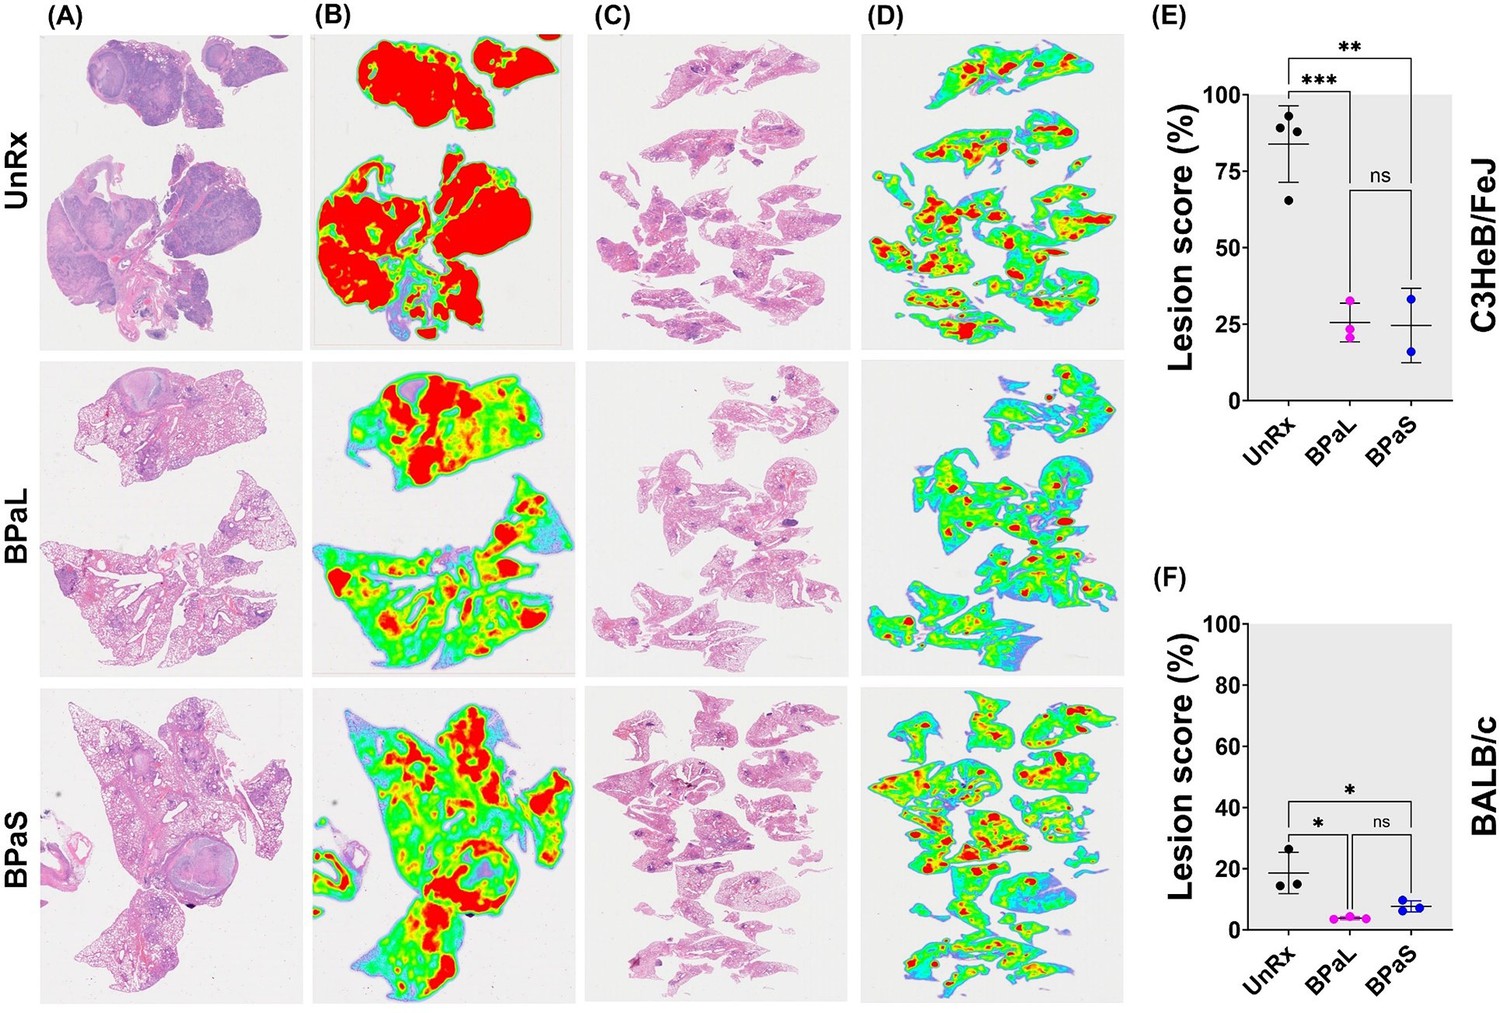
Effect of therapy on lung histopathology of TB mouse models after 4-weeks of treatment.
At the end of therapy, the mice were euthanized, and their lungs were collected and processed for histopathology and lesion scoring. FFPE sections were cut at 5 µm, stained with hematoxylin and eosin (H and E) and imaged at 40x (A: C3HeB/FeJ, C: BALB/c). Lesion maps (B: C3HeB/FeJ, D: BALB/c) show the infected areas in red color while green color represents the uninvolved parenchymal tissue. Lesion scores (E: C3HeB/FeJ, F: BALB/c) were calculated as the proportion of infected area over the total lung area per animal. Statistical significance was calculated using one-way ANOVA with Tukey’s multiple comparison test, and p < 0.05 was considered significant and ** = p<0.001, *** P<0.0001. UnRx = untreated.
-
Figure 2—source data 1
Lesion score for C3HeB/FeJ mice.
- https://cdn.elifesciences.org/articles/96190/elife-96190-fig2-data1-v1.xlsx
-
Figure 2—source data 2
Lesion score for BALB/c mice.
- https://cdn.elifesciences.org/articles/96190/elife-96190-fig2-data2-v1.xlsx
Figure 3
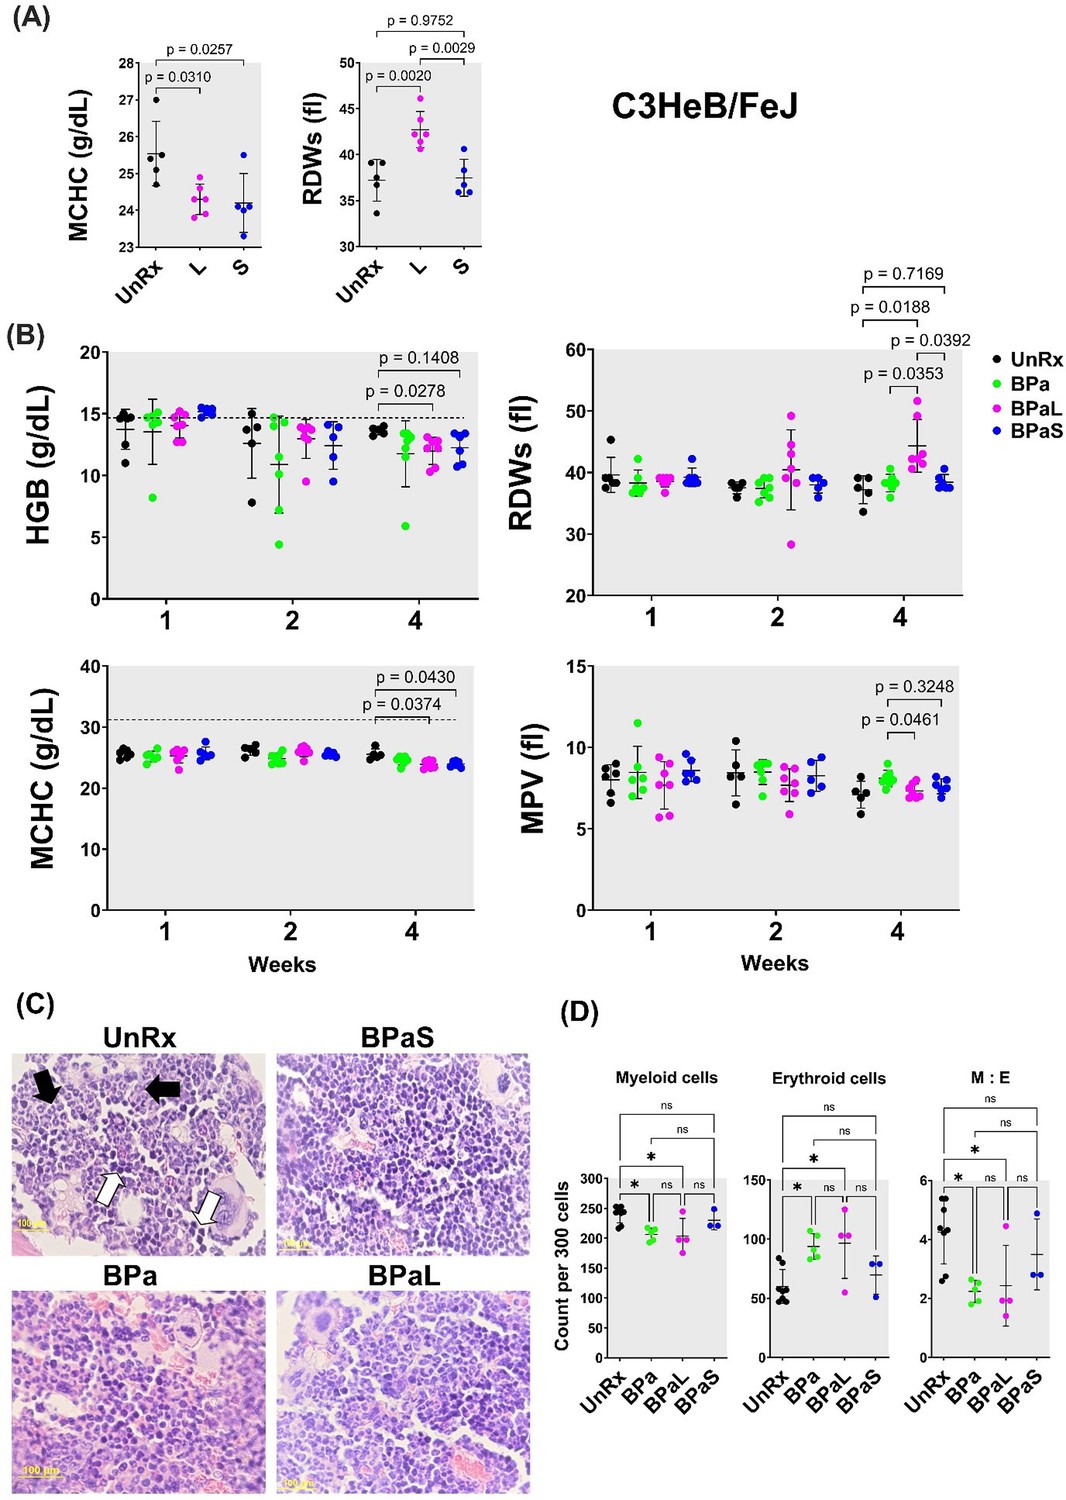
Complete blood count profiling and bone marrow histopathology in C3HeB/FeJ TB mouse model during 4-weeks of therapy.
During therapy of mice in Figure 1, the blood was collected at 1-, 2- and 4-weeks of treatment. The complete blood count was collected in VETSCAN HM5 hematology analyzer (Zoetis). (A) Monotherapy, (B) multidrug therapy. The MCHC (mean corpuscular hemoglobin concentration) and RDWs (red blood cell distribution width-standard deviation) along with the HGB (hemoglobin concentration) and MPV (mean platelet volume) are shown. A horizontal dotted line indicates the lower end of the reference interval for C3HeB/FeJ mice. The sternum, femur and tibias bones from each mouse were collected, fixed in 4% PFA, and processed for histology (C and D). Sections were cut at 5 µm, stained with hematoxylin and eosin (H and E) and imaged at 40x. (C) Representative photos of bone marrow sections showing myeloid (black arrows) and erythroid (white arrows) cells in bone marrow of untreated (UnRx) and treatment (BPa, BPaS and BPaS) groups. (D) The number of myeloid (M) and erythroid (E) among a total of 300 cells in 5 different regions were counted for each group and M:E was calculated. Statistical significance was calculated using one-way ANOVA with Tukey’s test for multiple comparisons. p < 0.05 was considered significant and ** = p<0.001, *** = P<0.0001.
-
Figure 3—source data 1
Complete blood count for C3HeB/FeJ data.
- https://cdn.elifesciences.org/articles/96190/elife-96190-fig3-data1-v1.xlsx
-
Figure 3—source data 2
Bone marrow histopathology in C3HeB/FeJ TB mice.
- https://cdn.elifesciences.org/articles/96190/elife-96190-fig3-data2-v1.xlsx
Figure 4 with 3 supplements
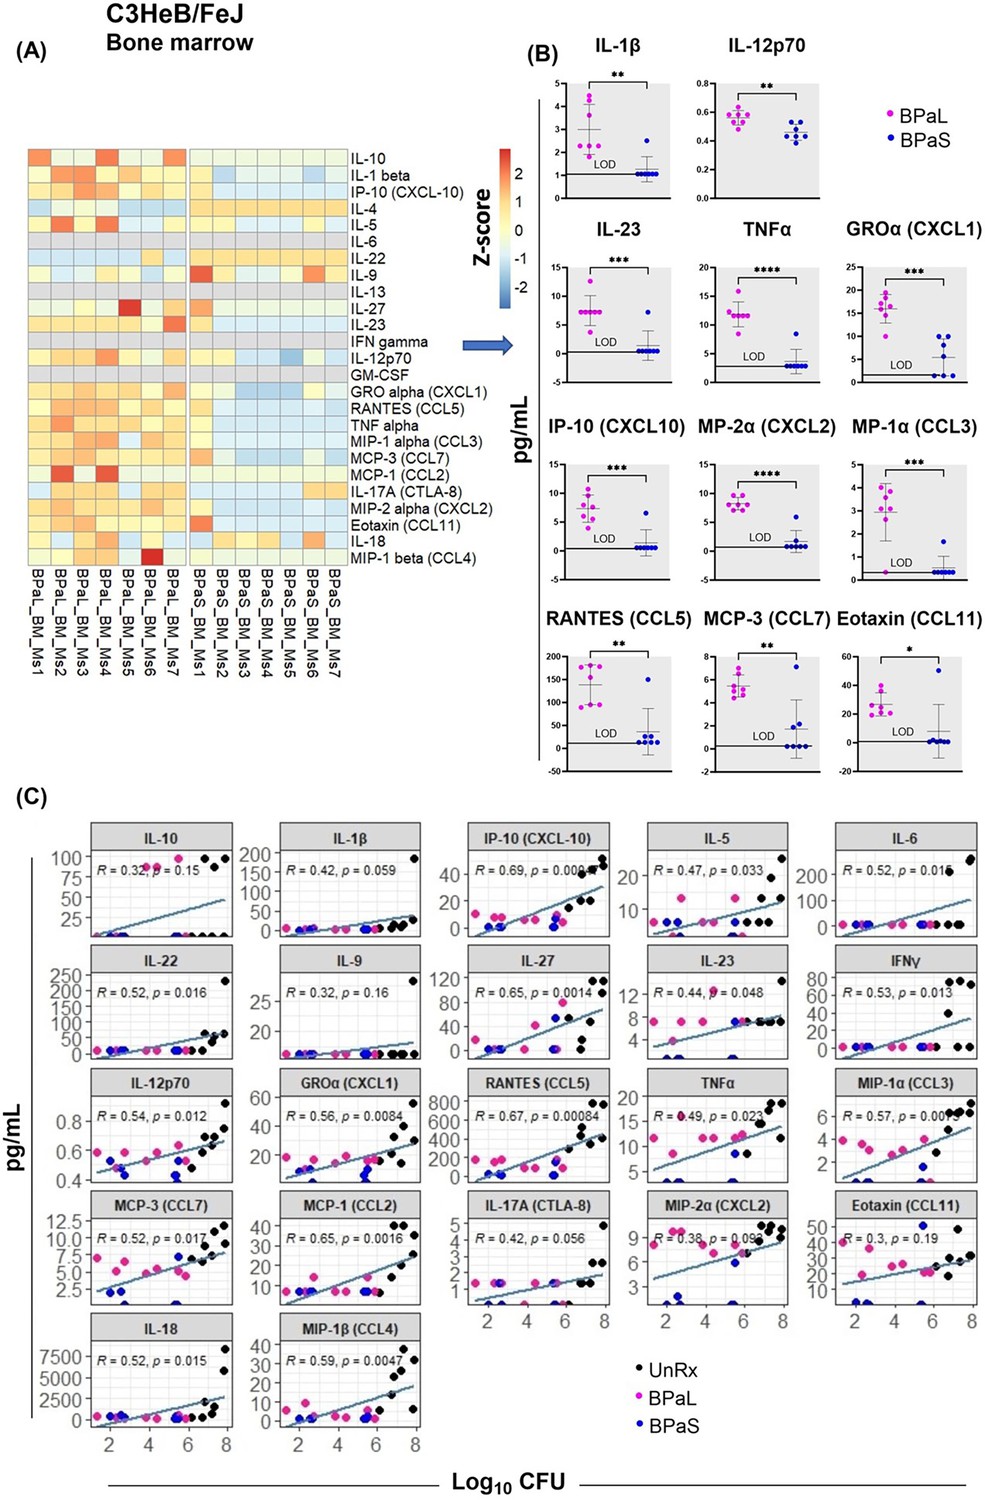
Bone marrow cytokine and chemokine profiling in C3HeB/FeJ TB mouse model after 4-weeks of treatment.
Femur bones from selected studies in mice in Figure 1 were collected to harvest the bone marrow. The bone marrow was resuspended in PBS, centrifuged and the supernatant was collected for the evaluation of cytokine’s content. BPaL and BPaS therapy showed profile of 26 cytokines and chemokines in bone marrow and the data were converted to Z score and represented as a heatmap (A) and graphically (B). (C) Spearman’s correlation analysis of bone marrow cytokines and chemokines (Y axis: pg/ml) with the lung bacterial burden (X axis; log10CFU). Statistical significance was calculated using the t test. p < 0.05 was considered significant and ** = p<0.001*** = p<0.0001, **** = P<0.00001.
-
Figure 4—source data 1
Numerical values of bone marrow cytokine and chemokine profiling in C3HeB/FeJ TB mouse model after 4-weeks of treatment.
- https://cdn.elifesciences.org/articles/96190/elife-96190-fig4-data1-v1.csv
Figure 4—figure supplement 1
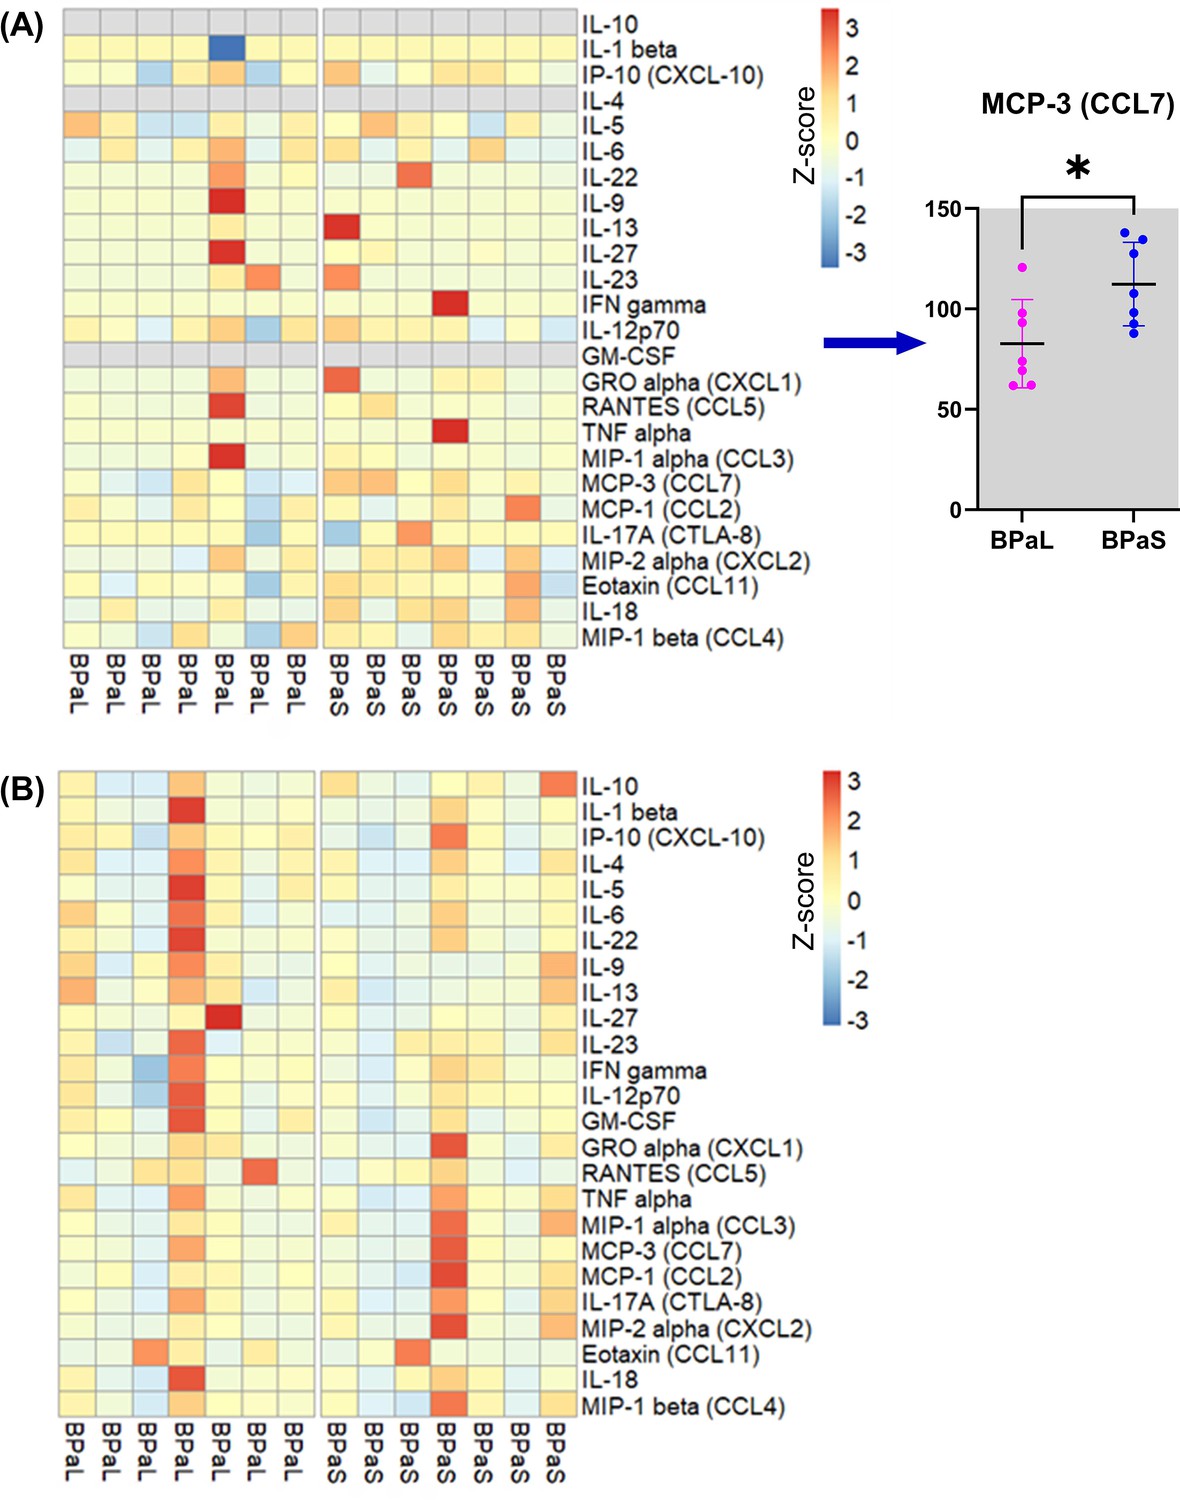
Change in the cytokines and chemokines profile in Mycobacterium tuberculosis infected C3HeB/FeJ mice during drug treatment.
(A) Plasma and (B) lung cytokine and chemokine contents in mice treated with BPaL or BPaS.
Figure 4—figure supplement 2
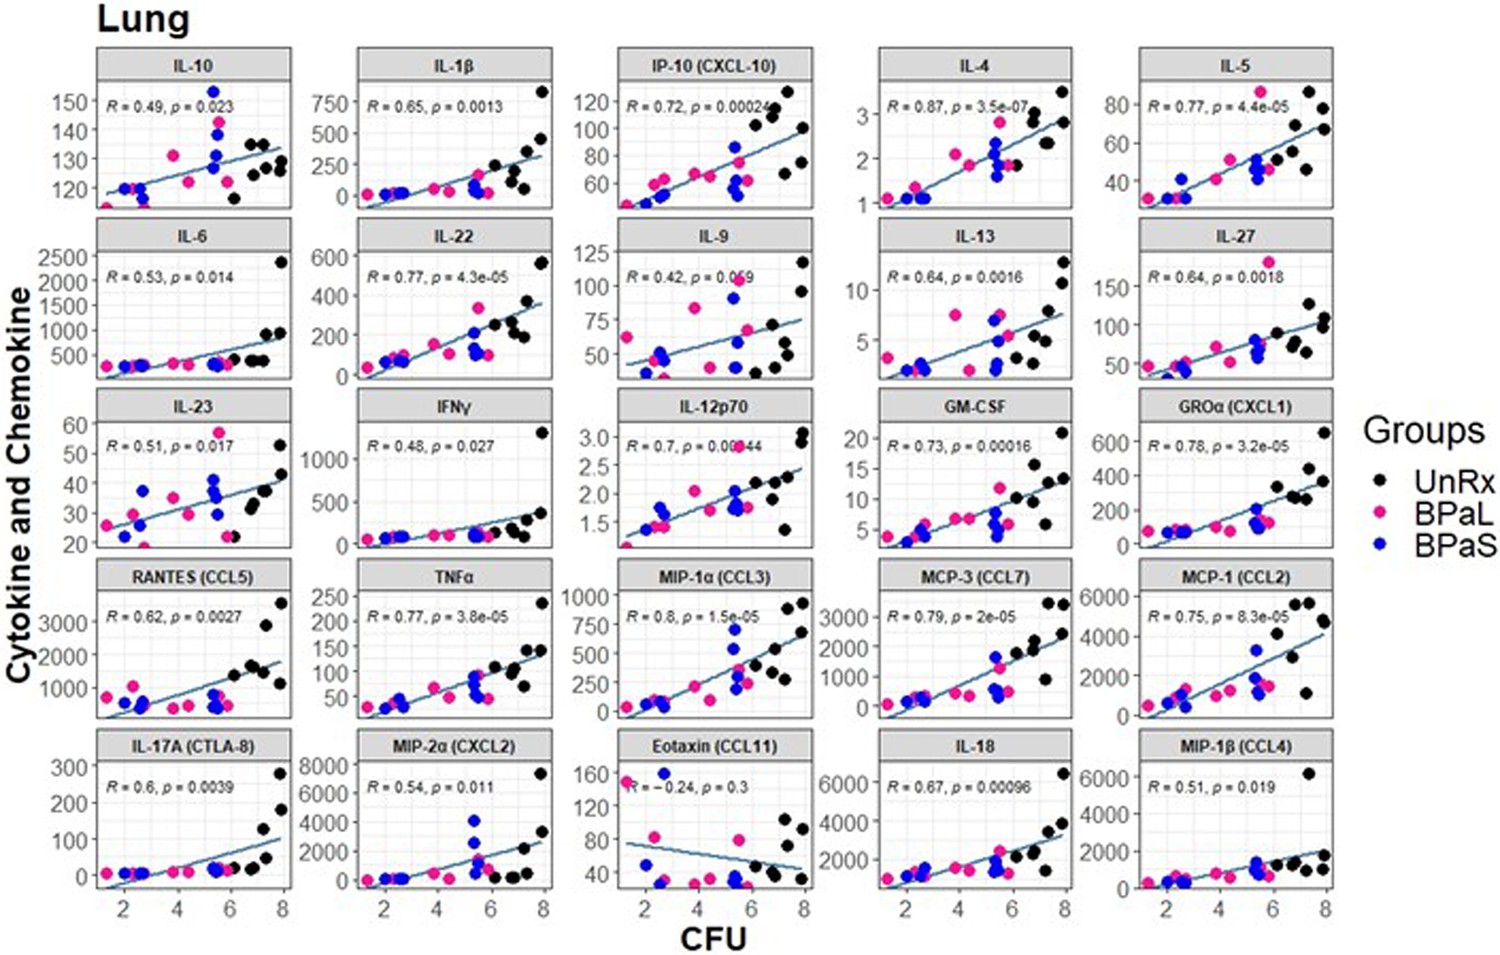
Spearman’s correlation analysis between bacterial burden colony-forming units (CFU) and cytokine and chemokine profile in the lungs of Mycobacterium tuberculosis infected C3HeB/FeJ mice treated with BPaL and BPaS regimen.
Figure 4—figure supplement 3
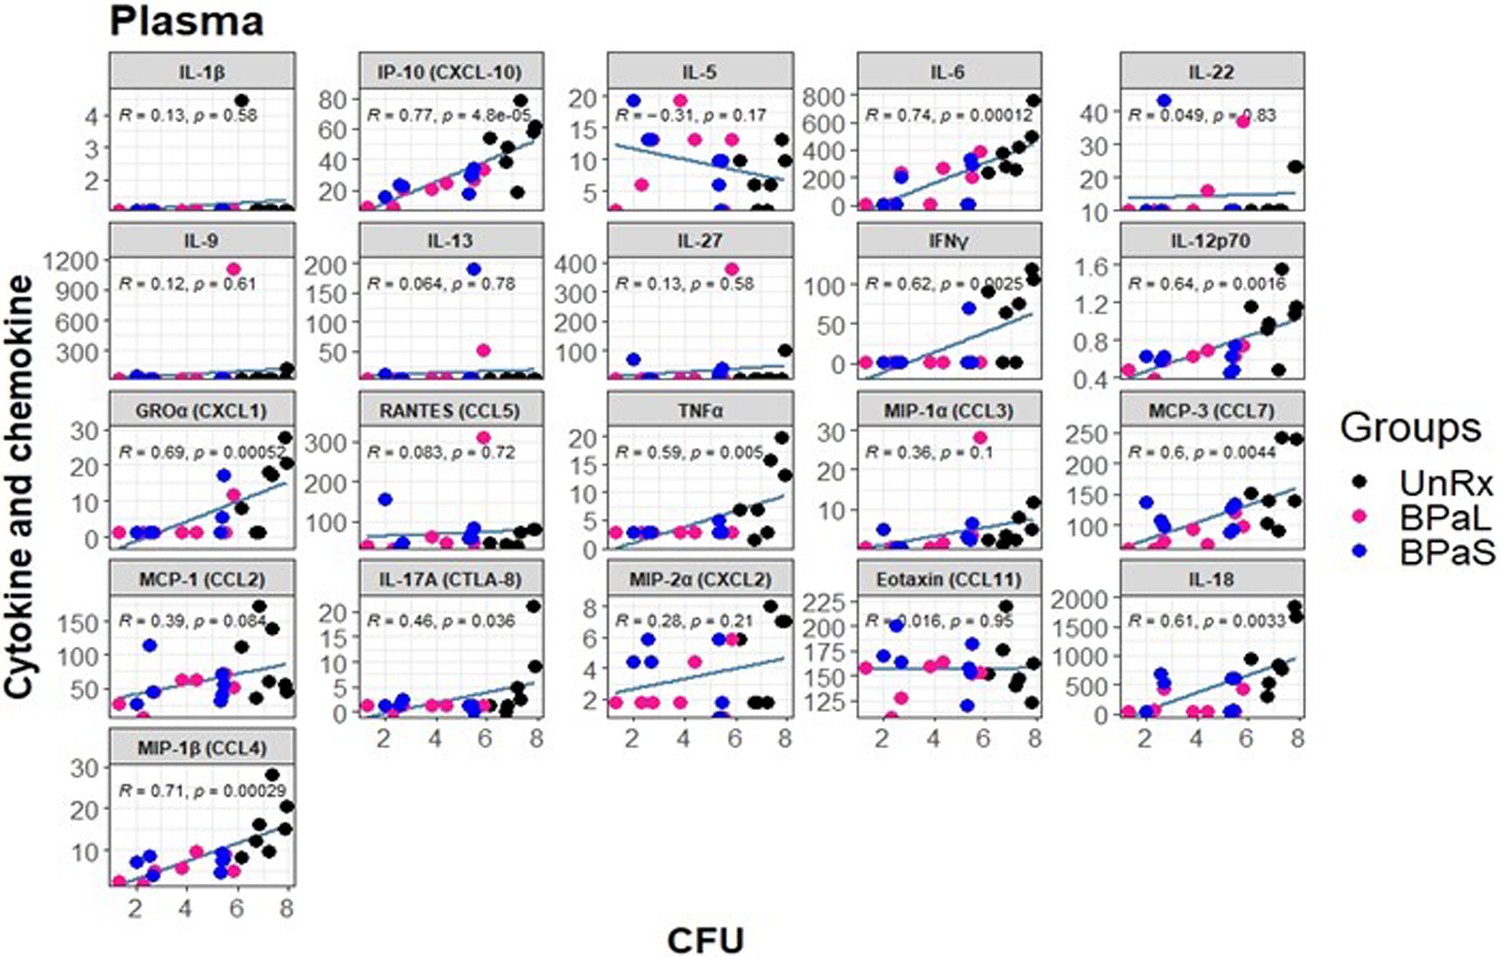
Spearman’s correlation analysis between lung bacterial burden colony-forming units (CFU) and plasma cytokine and chemokine profile in Mycobacterium tuberculosis infected C3HeB/FeJ mice treated with BPaL and BPaS regimen.
Figure 5
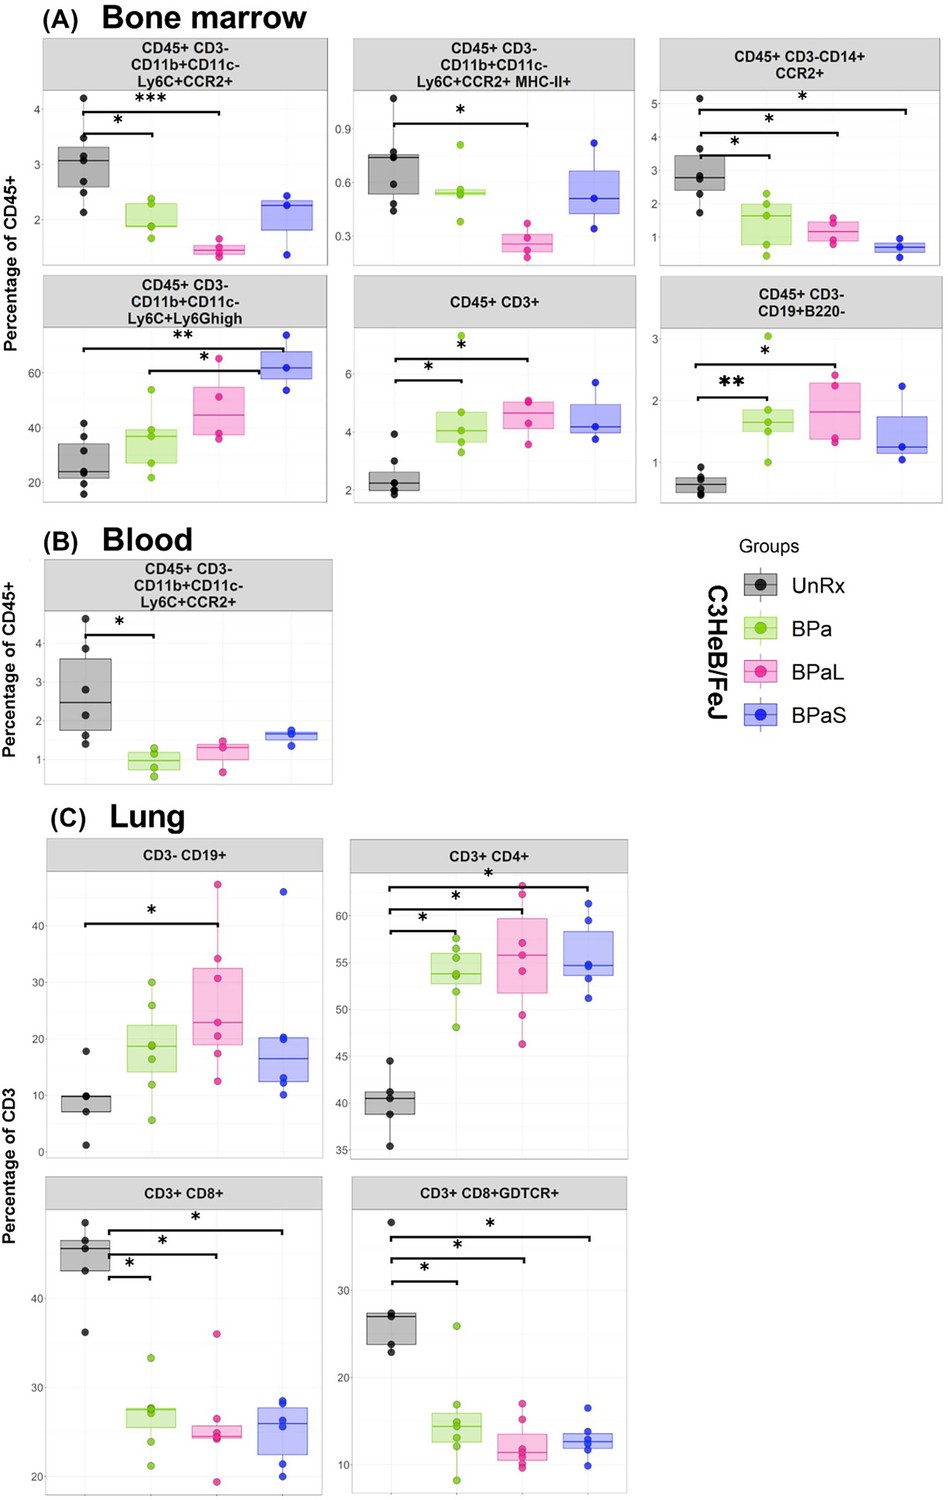
Immune cell populations in the bone marrow, lung and blood of C3HeB/FeJ TB mouse model after 4-weeks of treatment.
The bone marrow, lung and blood from selected studies from Figure 1 were evaluated by flow cytometry. The samples were processed for a panel of 17-color antibodies and the data were analyzed by FlowJo software using manual gating strategy. The myeloid and lymphoid phenotypes present in the untreated (UnRx) and treatment (BPa, BPaL or BPaS) groups are shown. Statistical significance was calculated using one-way ANOVA with Tukey’s test for multiple comparisons. p < 0.05 was considered significant and ** = p<0.001*** = p<0.0001, **** = P<0.00001.
-
Figure 5—source data 1
Numerical values for immune cell populations in the bone marrow, lung and blood of C3HeB/FeJ TB mouse model after 4-weeks of treatment.
- https://cdn.elifesciences.org/articles/96190/elife-96190-fig5-data1-v1.xlsx
Figure 6 with 1 supplement
Immune cell populations in the lungs of C3HeB/FeJ TB mouse model after 4-weeks of treatment.
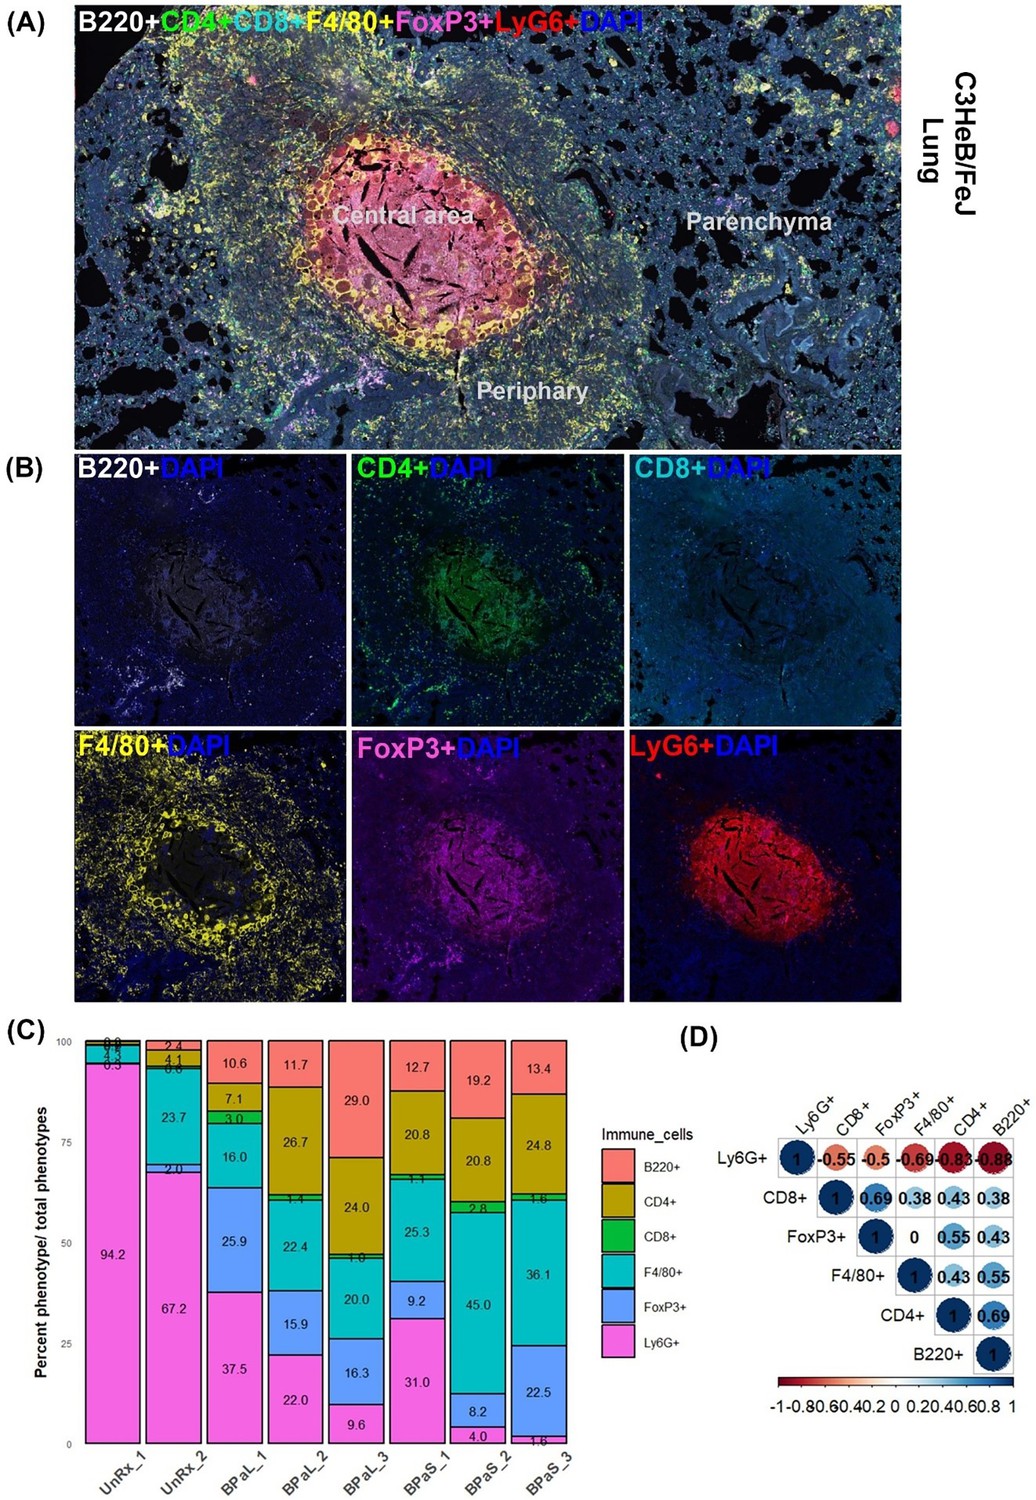
Selected mice from those shown in Figure 1 were processed for multiplex fluorescence immunohistochemistry (mfIHC). The mfIHC was performed for a panel of 6-color antibodies + DAPI using Opal-plex Tyramide Signal Amplification (TSA). Slides were scanned using multispectral automated PhenoImager (Akoya Biosciences) and analyzed for different immune cell populations using the inForm tissue Finder and Phenochart software (Akoya Biosciences). (A) The lung mfIHC full composite image displays B220, CD4, CD8, F4/80, FoxP3 and Ly6G markers along with DAPI staining for nuclei in the TB granuloma. The central and peripheral regions of a TB granuloma and the parenchyma of lung are also shown. (B) Single color composite image of individual markers with DAPI showing distribution of each immune cell population in the TB granuloma. (C) Cell populations (%) of several immune cells per total number of phenotypes calculated in untreated (UnRx: n = 2 mice) and treatment (BPaL and BPaS: n = 3 mice each) groups based on a panel of 6-color antibodies + DAPI. (D) Spearman’s correlation matrix for several immune cell populations (B220, CD4, CD8, F4/80, FoxP3, Ly6G) showing all relationships. A coefficient with a value of either +1 (blue), 0 (white), or -1 (red) indicates a perfect association, no association, and a perfect negative association of ranks, respectively. Numbers indicate the correlation coefficient.
-
Figure 6—source data 1
Numerical values for immune cell populations in the lungs of C3HeB/FeJ TB mouse model after 4-weeks of treatment.
- https://cdn.elifesciences.org/articles/96190/elife-96190-fig6-data1-v1.xlsx
Figure 6—figure supplement 1

Immune cell populations in the lungs of Mycobacterium tuberculosis infected C3HeB/FeJ tuberculosis (TB) model after 4 weeks of therapy.
Statistical significance was calculated using two-way ANOVA with Tukey’s test for multiple comparisons and p<0.05 was considered significant.
Tables
Table 1
Itemized list of antibodies for flow cytometry.
| Reagent or resource | Source | Identifier |
|---|---|---|
| Antibodies | ||
| Anti-mouse LY6G PerCP | BioLegend | Cat# 127654; RRID: AB_11218876 |
| Anti-mouse CD14 PerCP Cy5.5 | Invitrogen | Cat# 120606; RRID: AB_493267 |
| Anti-mouse NKp46/CD335 PE | BioLegend | Cat# 137604; RRID: AB_2566163 |
| Anti-mouse B220/CD45 R PE-Cy7 | BioLegend | Cat# 103222; RRID: AB_2573837 |
| Anti-mouse CD8 FITC | BioLegend | Cat# 100706; RRID: AB_394458 |
| Anti-mouse CD34 PE-Dazzle 594 | BioLegend | Cat# 128616; RRID: AB_11219403 |
| Anti-mouse TER119 APC | BD Pharmingen | Cat# 561033; RRID: AB_10900980 |
| Anti-mouse γδ-TCR APC Fire 750 | BioLegend | Cat# 118129; RRID: AB_755986 |
| Anti-mouse LY6C Alexa Fluor 700 | BioLegend | Cat# 128024; RRID: AB_2869739 |
| Anti-mouse CD4 BV421 | BioLegend | Cat# 100544; RRID: AB_2562555 |
| Anti-mouse MHC-II BV480 | BD Biosciences | Cat# 566088; RRID: AB_2562612 |
| Anti-mouse CD11b Pacific Blue | BioLegend | Cat# 101224; RRID: AB_2565937 |
| Anti-mouse CD3e BV510 | BioLegend | Cat# 100353; RRID: AB_2563056 |
| Anti-mouse CD45 BV570 | BioLegend | Cat# 103136; RRID: AB_2814047 |
| Anti-mouse CD19 BV605 | BioLegend | Cat# 115540; RRID: AB_2563289 |
| Anti-mouse CCR2 BV711 | BD Biosciences | Cat# 747964; RRID: AB_2660295 |
| Anti-mouse CC11c BV785 | BioLegend | Cat# 117335; RRID: AB_2073247 |
Additional files
-
Supplementary file 1
Reagents for multiplex fluorescence immunohistochemistry.
- https://cdn.elifesciences.org/articles/96190/elife-96190-supp1-v1.docx
-
MDAR checklist
- https://cdn.elifesciences.org/articles/96190/elife-96190-mdarchecklist1-v1.pdf
Download links
A two-part list of links to download the article, or parts of the article, in various formats.
Downloads (link to download the article as PDF)
Open citations (links to open the citations from this article in various online reference manager services)
Cite this article (links to download the citations from this article in formats compatible with various reference manager tools)
A modified BPaL regimen for tuberculosis treatment replaces linezolid with inhaled spectinamides
eLife 13:RP96190.
https://doi.org/10.7554/eLife.96190.3


