Artificially inserted strong promoter containing multiple G-quadruplexes induces long-range chromatin modification
- CSIR-Institute of Genomics and Integrative Biology, India
- Academy of Scientific and Innovative Research (AcSIR), India
- Department of Biotechnology, Indian Institute of Technology Hyderabad, India
- Cancer Science Institute of Singapore, National University of Singapore, Singapore
Figures
Figure 1 with 3 supplements

Insertion of an array of G4s in an isolated locus.
(A) Schematic showing the insertion of the G4-array and the G4-mutated control at chr12:79,872,423–79,872,424 (hg19). (B) PCR of the insertion locus showing the successful insertion of the 275 bp long insert sequence.
-
Figure 1—source data 1
Raw blot shown in Figure 1B.
- https://cdn.elifesciences.org/articles/96216/elife-96216-fig1-data1-v1.zip
Figure 1—figure supplement 1
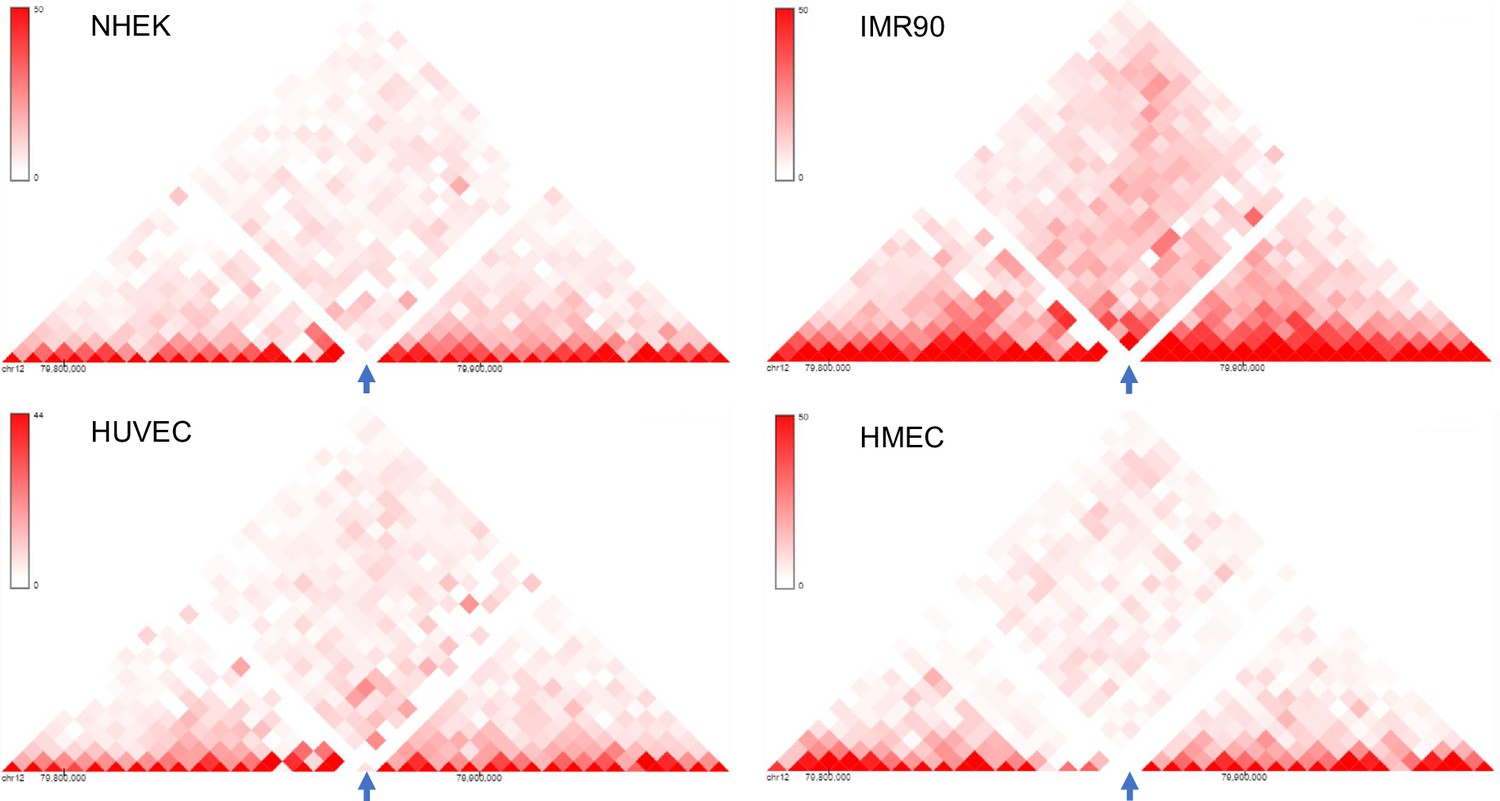
An isolated locus was chosen for insertion.
(A) 3D Genome Browser (Wang et al., 2018) snapshots showing the Hi-C interaction matrices from four cell lines (NHEK, IMR90, HUVEC and HMEC) of a section of chromosome 12 with chr12:79,870,000–79,875,000 (hg19) locus in the middle (marked by arrows); the chr12:79,870,000–79,875,000 locus has very low interaction with its surrounding loci, indicated by the lack of red dots or very faint red dots.
Figure 1—figure supplement 2
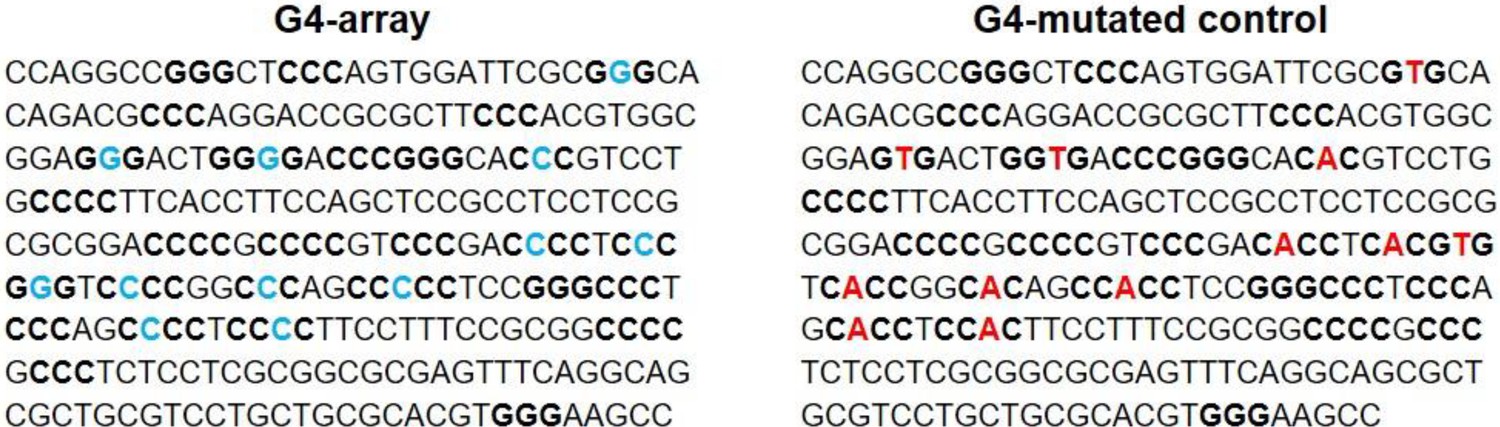
Insert sequences.
Sequences of the G4 array and the G4-mutated array that were inserted; three or more runs of G/Cs (stem of a potential G4) are shown in bold and the G/Cs (marked in blue) that were changed to T/As (marked in red) in the G4-mutated array are marked.
Figure 1—figure supplement 3

Insertion confirmed by Sanger sequencing.
Representative snapshots of the Sanger sequencing chromatogram of the reverse strand of the insertion locus PCR product showing some of the specific G/C to T/A substitutions in the insert.
Figure 2 with 1 supplement
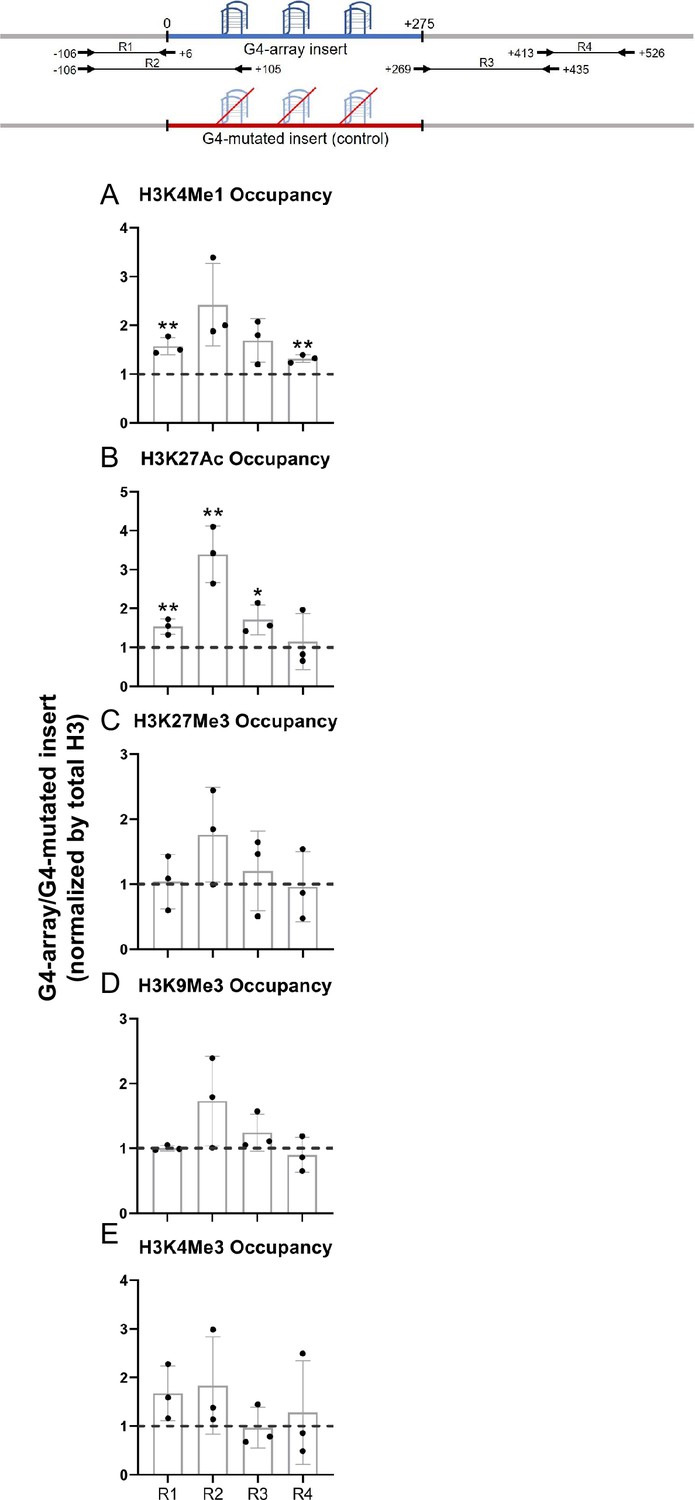
Changes in chromatin upon G4-array insertion.
The top panel shows the positions of the PCR amplicons used in the Histone ChIP experiments. Changes in chromatin-modifying histone modifications in the insert region represented by calculating the ratio of occupancy of different histone marks in the G4-array insert cells over the G4-mutated insert (control) cells- enhancer mark, H3K4Me1 (A); active enhancer/promoter mark, H3K27Ac (B); facultative repressor mark, H3K27Me3 (C); constitutive repressor mark, H3K9Me3 (D) and active promoter mark, H3K4Me3 (E). Mean ± SD (n=3); unpaired, two-tailed t-test (*p<0.05, **p<0.01, ***p<0.001, ****p<0.0001).
-
Figure 2—source data 1
Source data for Figure 2 (Changes in chromatin upon G4-array insertion).
- https://cdn.elifesciences.org/articles/96216/elife-96216-fig2-data1-v1.xlsx
Figure 2—figure supplement 1

G4 formation analyzed by BG4 ChIP.
BG4 antibody enrichment at the 79 M insertion locus in the G4-array and the G4-mutated (control) insert cells. Mean ± SD (n=2); unpaired, two-tailed t-test (*p<0.05, **p<0.01, ***p<0.001, ****p<0.0001). Primer R2, covers >100 bp of the respective inserted regions, as shown in Figure 2 top panel.
-
Figure 2—figure supplement 1—source data 1
Source data for Figure 2—figure supplement 1 (G4 formation analyzed by BG4 ChIP).
- https://cdn.elifesciences.org/articles/96216/elife-96216-fig2-figsupp1-data1-v1.xlsx
Figure 3 with 1 supplement
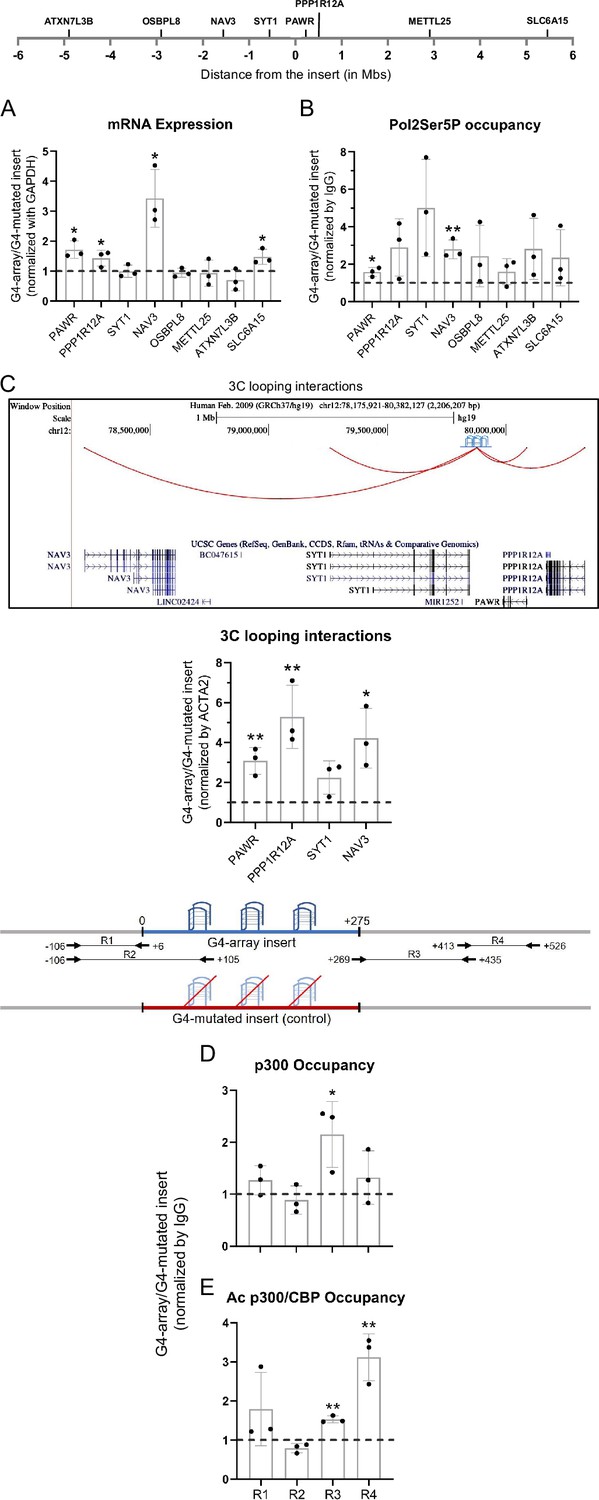
Insertion of the G4-array led to enhancer function.
(A) Long-range G4-dependent changes in mRNA expression are represented by calculating the ratio of expression of surrounding genes in the G4-array insert cells over the G4-mutated insert (control) cells. Top panel shows the positions of the gene promoters with respect to the insertion site. (B) Ratio of Pol2 Phospho-Ser5 Occupancy at the promoters of the surrounding genes in the G4-array insert cells over the G4-mutated insert (control) cells. (C) Fold change in 3C looping interactions between the insertion and the surrounding gene promoters in the G4-array insert cells over the G4-mutated insert (control) cells. The UCSC genome browser snapshot above shows the 3C looping interactions between the insertion and the surrounding gene promoters. The ratio of occupancy of p300 (D) and Ac p300/CBP (E) in the G4-array insert cells over the G4-mutated insert (control) cells. The panel above shows the positions of the PCR amplicons used in the ChIP experiments. Mean ± SD (n=3); unpaired, two-tailed t-test (*p<0.05, **p<0.01, ***p<0.001, ****p<0.0001).
-
Figure 3—source data 1
Source data for Figure 3 (Insertion of the G4-array led to enhancer function).
- https://cdn.elifesciences.org/articles/96216/elife-96216-fig3-data1-v1.xlsx
Figure 3—figure supplement 1
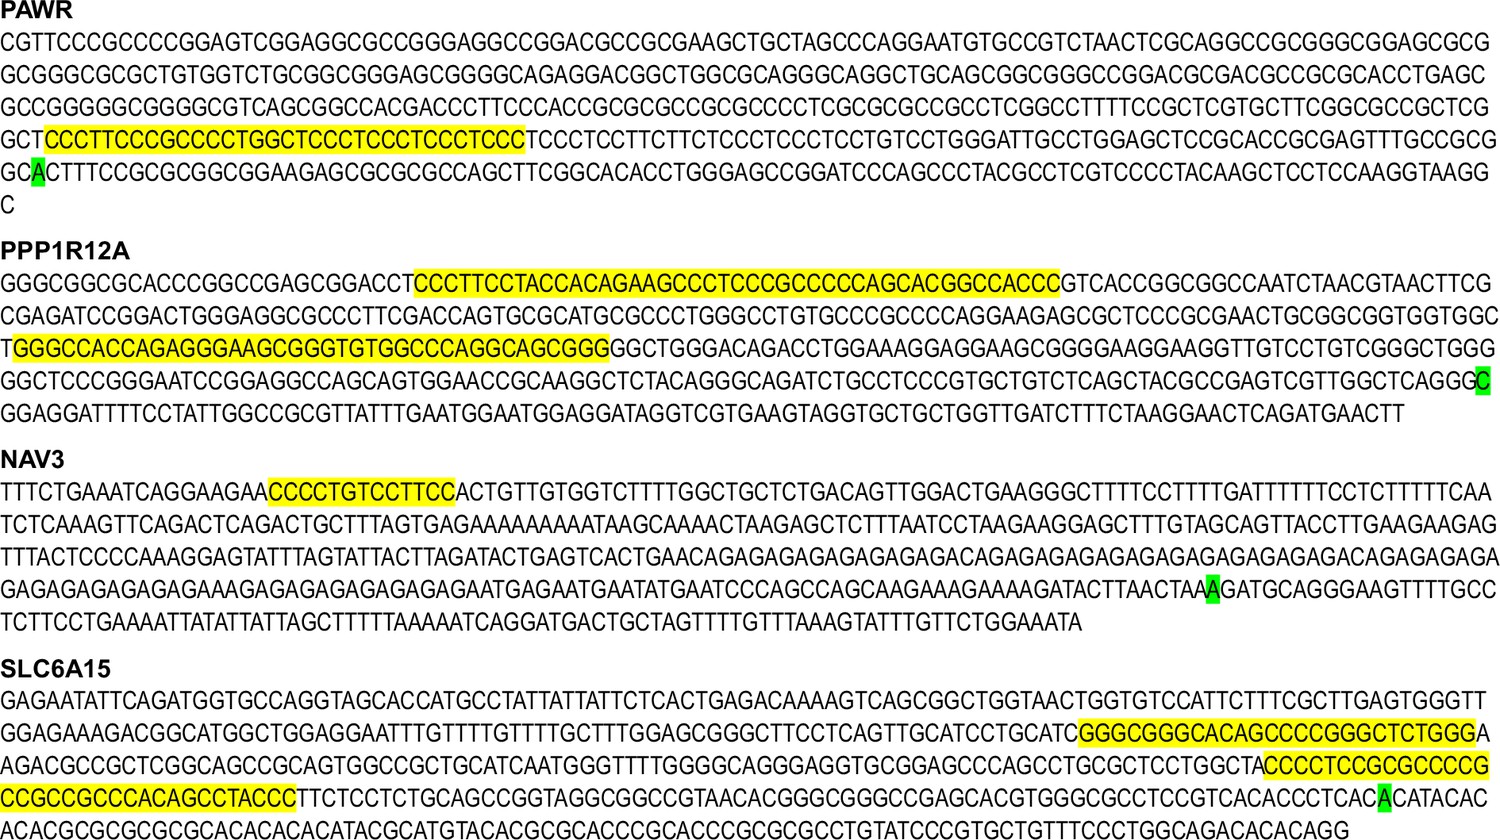
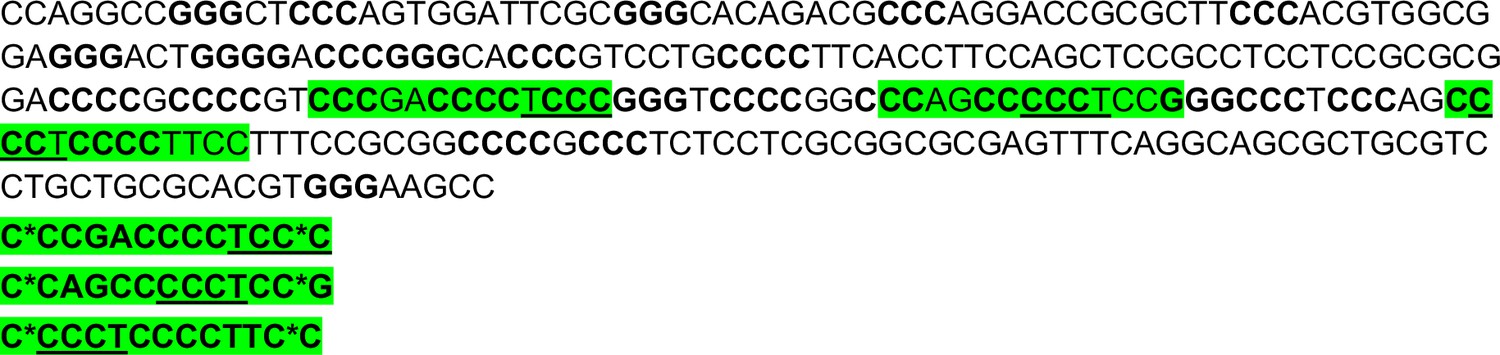
pG4s in the activated gene promoters.
−400 to +100 (w.r.t. TSS) promoter region of the genes whose expression increased upon insertion of the G4-array with the pG4 motifs highlighted in yellow and the TSS highlighted in green. C-rich motifs indicate G4 formation on the complementary strand.
Figure 4 with 1 supplement
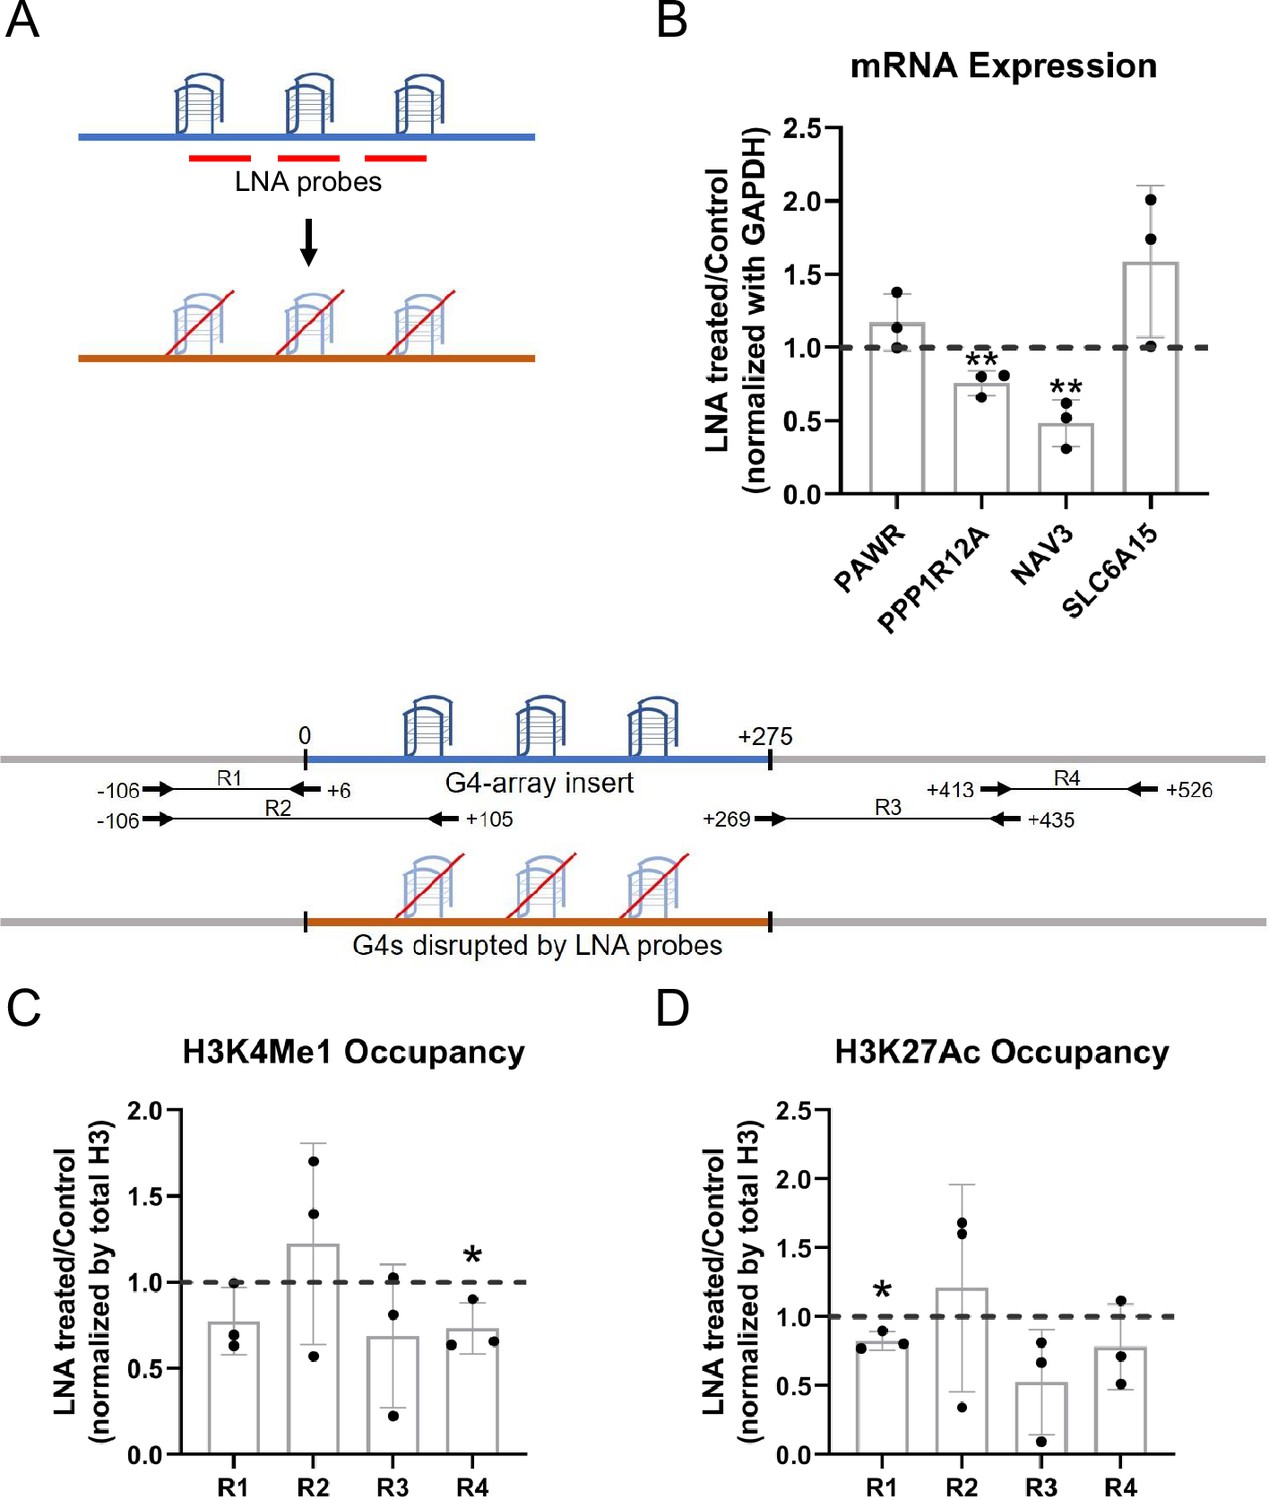
LNA-mediated disruption of the inserted G4s reverses enhancer phenotype.
(A) Schematic showing the inserted G4 structures disrupted using LNA probes (details in methods). (B) Effects of LNA treatment in the G4-array insert cells on the expression of surrounding genes which showed enhanced expression when compared against the G4-mutated insert (control) cells in Figure 3A- represented by the ratio of expression of surrounding genes in the LNA-treated over the vehicle-treated (control) cells. Effects of LNA treatment in the G4-array insert cells on the levels of H3K4Me1 (C) and H3K27Ac (D) histone modifications at the insert locus represented by the ratio of occupancy of the histone marks in the LNA-treated over the vehicle-treated (control) cells. The top panel shows the positions of the PCR amplicons used in the Histone ChIP experiments. Mean ± SD (n=3); unpaired, two-tailed t-test (*p<0.05, **p<0.01, ***p<0.001, ****p<0.0001).
-
Figure 4—source data 1
Source data for Figure 4 (LNA-mediated disruption of the inserted G4s reverses enhancer phenotype).
- https://cdn.elifesciences.org/articles/96216/elife-96216-fig4-data1-v1.xlsx
Figure 4—figure supplement 1

Effects of LNA treatment in the G4-mutated insert (control) cells on the expression of surrounding genes represented by the ratio of expression of surrounding genes in the LNA-treated over the vehicle-treated (control) cells.
Mean ± SD (n=3); unpaired, two-tailed t-test showed differences were insignificant.
-
Figure 4—figure supplement 1—source data 1
Source data for Figure 4—figure supplement 1 (Effects of LNA treatment in the G4-mutated insert (control) cells).
- https://cdn.elifesciences.org/articles/96216/elife-96216-fig4-figsupp1-data1-v1.xlsx
Figure 5
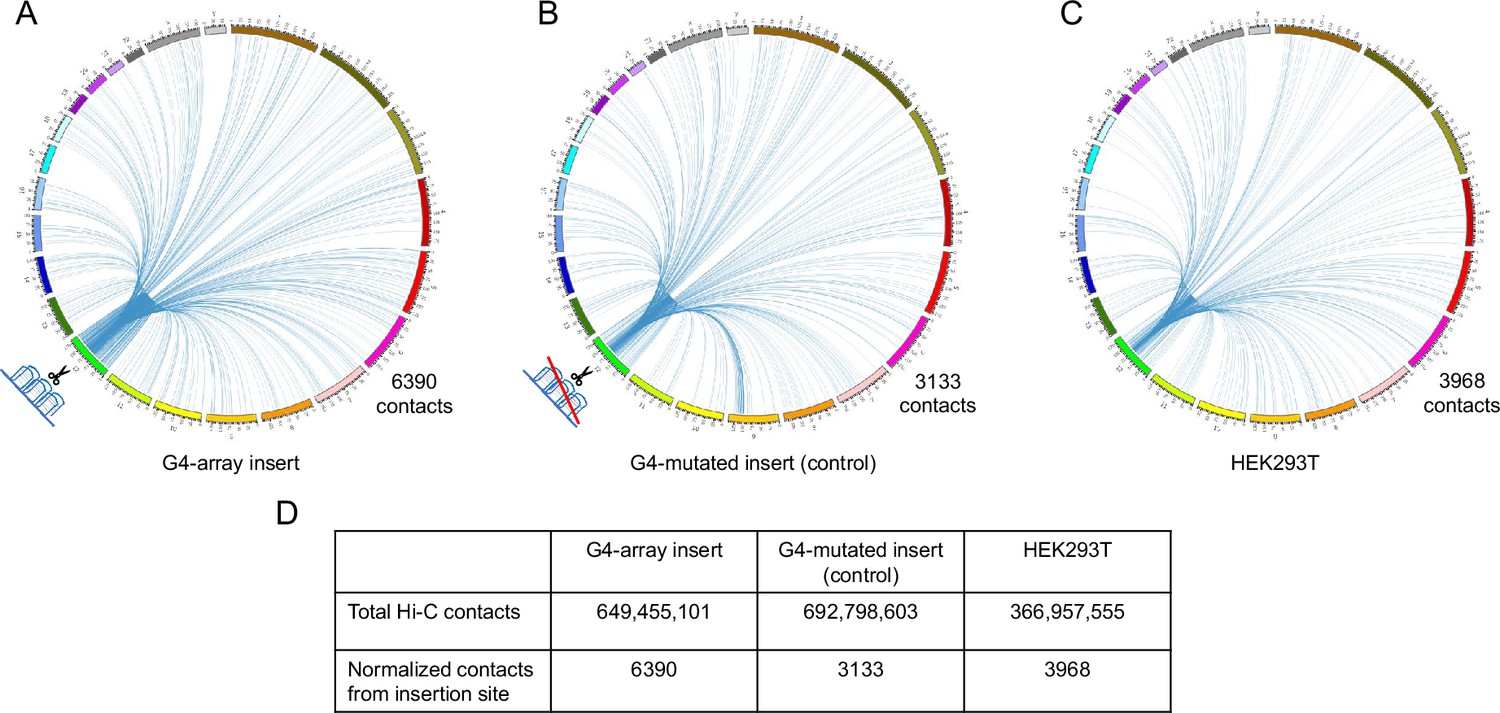
Insertion of the G4-array increased Hi-C interactions.
Circos plots showing raw Hi-C contacts across the genome originating from a±10 kb window with the insertion site at the middle across three samples- (A) G4-array insert cells, (B) G4-mutated insert (control) cells and (C) HEK293T control cells (taken from GSE44267). (D) Table showing the number of genome-wide raw Hi-C contacts and normalized contacts (normalized against the total raw Hi-C contacts to normalize for the sequencing depth) originating from the ±10 kb window with the insertion site at the middle across the three samples.
Figure 6 with 1 supplement
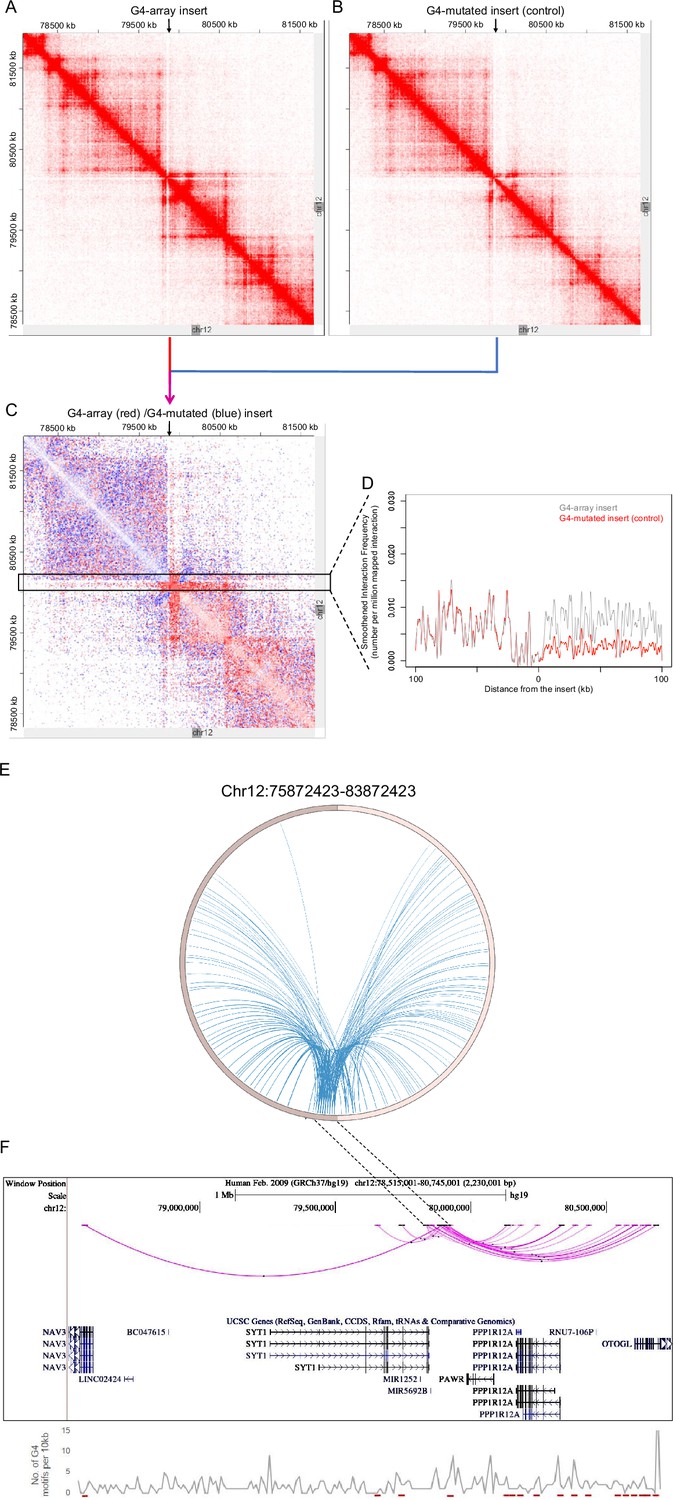
G4-dependent changes in local chromatin architecture.
Juicebox Hi-C matrices showing Hi-C contacts in the (A) G4-array insert cells, (B) G4-mutated insert (control) cells in a 3.6 Mb region of chromosome 12 with the insertion site at the middle of the matrices. The arrows at the top of the Hi-C matrices indicate the site of insertion. (C) Juicebox Hi-C matrix showing normalized Hi-C contacts in the G4-array insert cells over the G4-mutated insert (control) cells as a heatmap. The region of interest (i.e. interactions associated with the immediate vicinity of the insert) is marked with a box. The arrow at the top of the Hi-C matrix indicates the site of insertion. (D) A line histogram displaying the differences in interaction frequency across G4-array insert cells and G4-mutated insert (control) cells in regions up to 100 kb away from the insertion site. As seen interactions downstream of the insertion site are more enriched than upstream in the G4-array insert cells as compared to the G4-mutated control. (E) Circos plot showing differential interactions (fold enrichment ≥ 2) originating from a±100 kb window with the insertion site at the middle, in the G4-array insert cells over the G4-mutated insert (control) cells. (F) UCSC genome browser snapshot showing the more significant differential interactions (fold enrichment ≥ 2, interaction reads >20) originating from a±50 kb window with the insertion site at the middle, in the G4-array insert cells over the G4-mutated insert (control) cells. The color intensity of the arcs indicating the interacting bins is proportional to the fold enrichment. Density of potential G4 motifs (per 10 kb) shown in lower panel; G4-forming sequences identified using pqsfinder (Hon et al., 2017); interaction regions marked in red at the bottom of lower panel.
-
Figure 6—source data 1
Source data for Figure 6D (G4-dependent changes in local chromatin architecture- Interaction frequency histogram).
- https://cdn.elifesciences.org/articles/96216/elife-96216-fig6-data1-v1.xlsx
-
Figure 6—source data 2
Source data for Figure 6E (G4-dependent changes in local chromatin architecture- Circos plot showing differential interactions).
- https://cdn.elifesciences.org/articles/96216/elife-96216-fig6-data2-v1.zip
-
Figure 6—source data 3
Source data for Figure 6F (G4-dependent changes in local chromatin architecture- UCSC genome browser snapshot showing the more significant differential interactions).
- https://cdn.elifesciences.org/articles/96216/elife-96216-fig6-data3-v1.zip
Figure 6—figure supplement 1
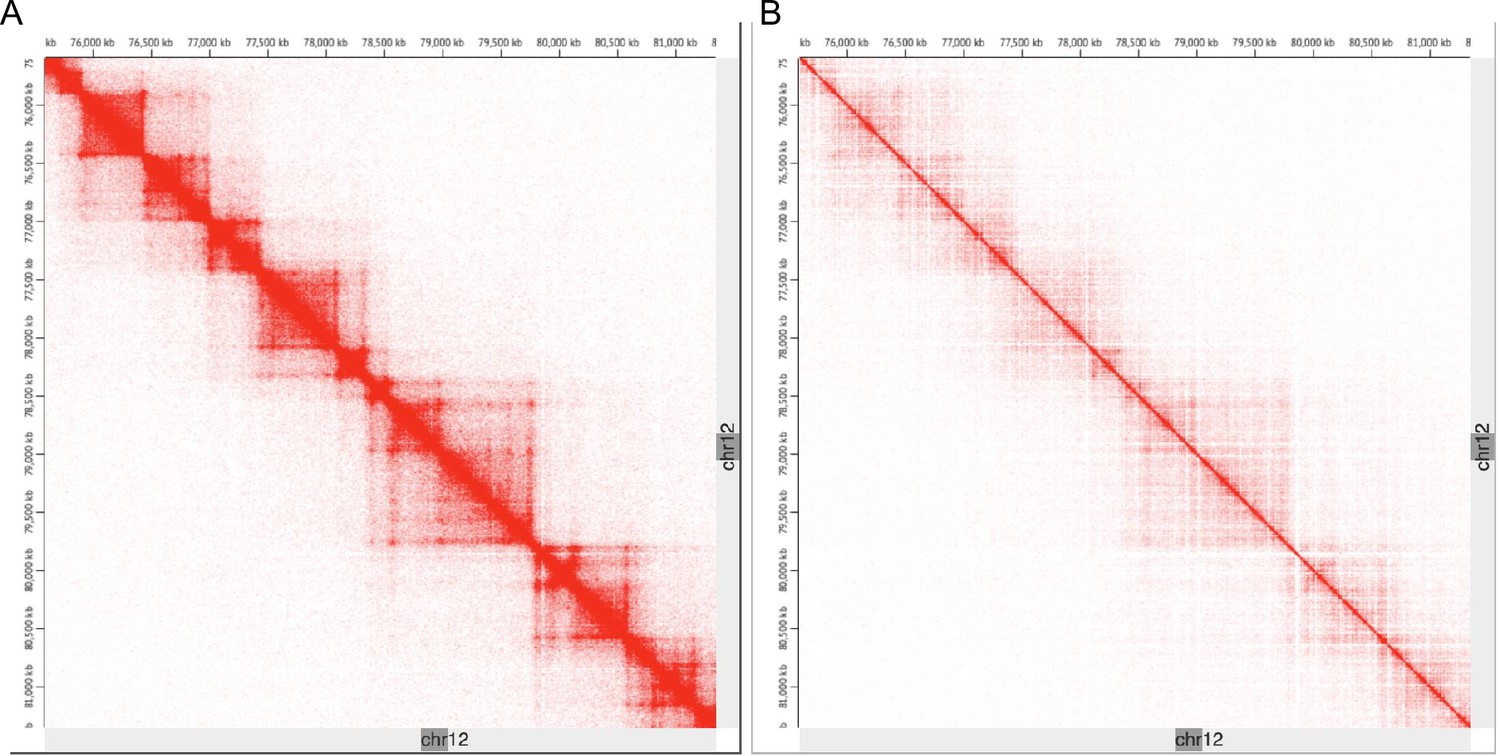
The chromosomal architecture of the insertion locus in the G4-array insert cells is broadly similar to uninserted cells except for the increase in looping interactions.
Comparison of Hi-C contact matrices around the insertion site in the G4-array insert cells (A) and the HEK293T control cells (taken from GSE44267) (B) shows that the broad chromatin organization is conserved. The TADs appear to be otherwise unaltered upon insertion.
Figure 7 with 2 supplements
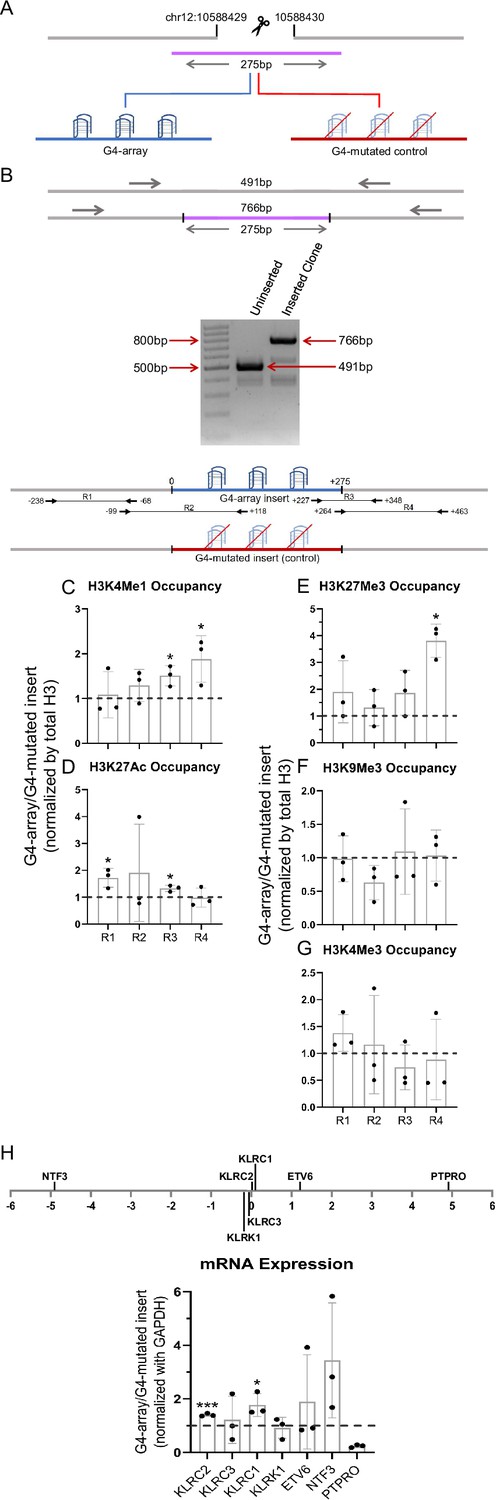
Insertion of the G4-array in another isolated locus and subsequent changes in chromatin and surrounding gene expression.
(A) Schematic showing the insertion of the G4-array and the G4-mutated control at chr12:10,588,429–10,588,430 (hg19). (B) PCR of the insertion locus showing the successful insertion of the 275 bp long insert sequence. The top panel shows the positions of the PCR amplicons used in the Histone ChIP experiments. Changes in chromatin-modifying histone modifications in the insert region represented by calculating the ratio of occupancy of different histone marks in the G4-array insert cells over the G4-mutated insert (control) cells- enhancer mark, H3K4Me1 (C); active enhancer/promoter mark, H3K27Ac (D); facultative repressor mark, H3K27Me3 (E); constitutive repressor mark, H3K9Me3 (F) and active promoter mark, H3K4Me3 (G). (H) Long-range G4-dependent changes in mRNA expression are represented by calculating the ratio of expression of surrounding genes in the G4-array insert cells over the G4-mutated insert (control) cells. The panel above shows the positions of the gene promoters with respect to the insertion site. Mean ± SD (n=3); unpaired, two-tailed t-test (*p<0.05, **p<0.01, ***p<0.001, ****p<0.0001).
-
Figure 7—source data 1
Source data for Figure 7 (Insertion of the G4-array in another isolated locus and subsequent changes in chromatin and surrounding gene expression).
- https://cdn.elifesciences.org/articles/96216/elife-96216-fig7-data1-v1.xlsx
-
Figure 7—source data 2
Raw blot shown in Figure 7B.
- https://cdn.elifesciences.org/articles/96216/elife-96216-fig7-data2-v1.zip
Figure 7—figure supplement 1
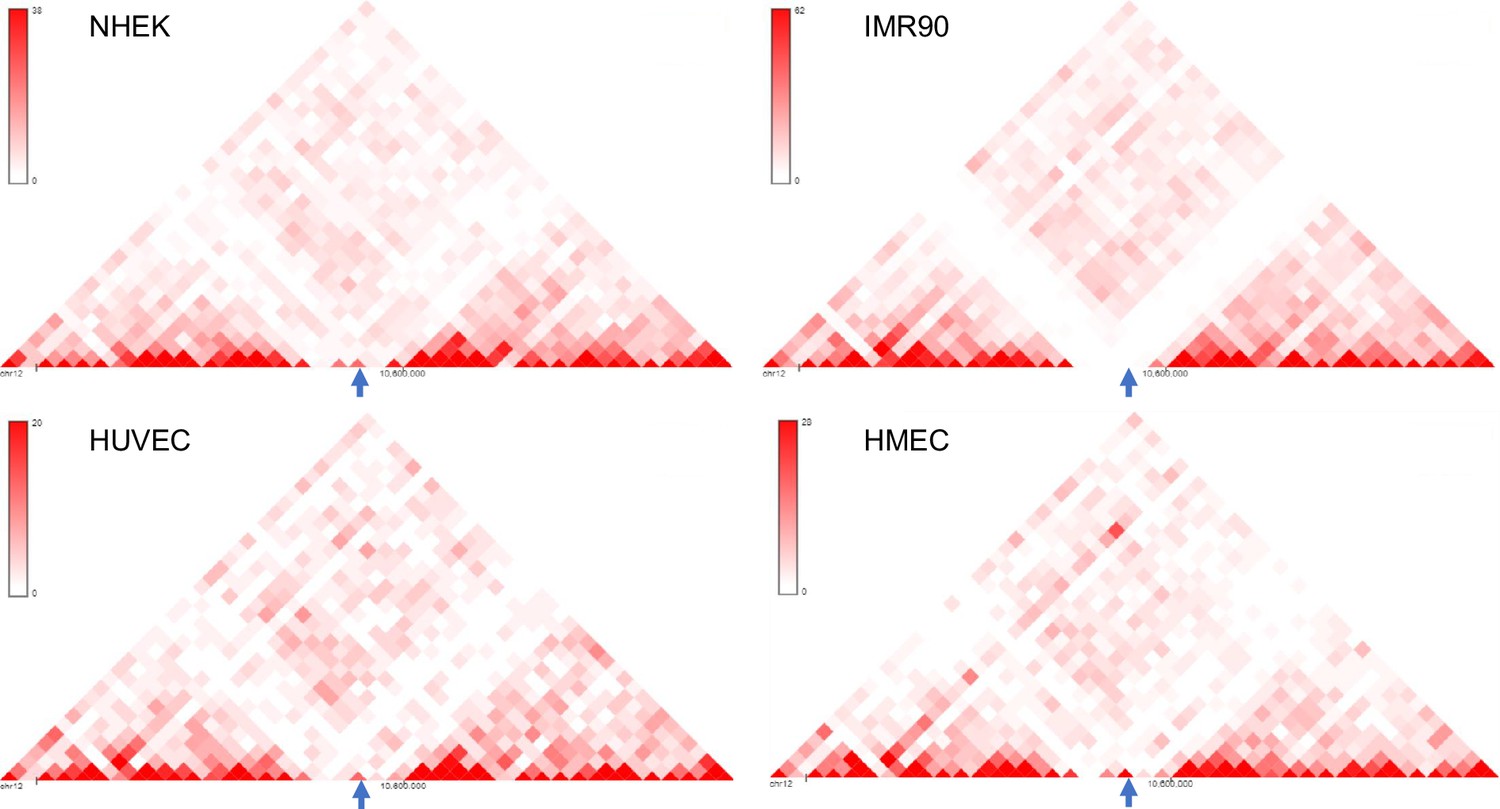
Another isolated locus was chosen for insertion.
(A) 3D Genome Browser (Wang et al., 2018) snapshots showing the Hi-C interaction matrices from four cell lines (NHEK, IMR90, HUVEC and HMEC) of a section of chromosome 12 with chr12:10585000–10590000 (hg19) locus in the middle (marked by arrows); the chr12:10585000–10590000 locus has low interaction with its surrounding loci, indicated by the lack of red dots or very faint red dots.
Figure 7—figure supplement 2

G4 formation analyzed by BG4 ChIP.
BG4 antibody enrichment at the 10 M insertion locus in the G4-array and the G4-mutated (control) insert cells. Mean ± SD (n=2); unpaired, two-tailed t-test (*p<0.05, **p<0.01, ***p<0.001, ****p<0.0001). Primer R2, covers >100 bp of the respective inserted regions, as shown in Figure 7 top panel.
-
Figure 7—figure supplement 2—source data 1
Source data for Figure 7—figure supplement 2 (G4 formation analyzed by BG4 ChIP).
- https://cdn.elifesciences.org/articles/96216/elife-96216-fig7-figsupp2-data1-v1.xlsx
Scheme 1
LNA probes designed to disrupt the inserted G4 structures along with the inserted G4 array sequence to show the specific sites of hybridization by the LNA probes.
Tables
Key resources table
| Reagent type (species) or resource | Designation | Source or reference | Identifiers | Additional information |
|---|---|---|---|---|
| Cell line (H. sapiens) | HEK 293T | NCCS Cell Repository | RRID:CVCL_0063 | |
| Transfected construct (S. pyogenes) | pX459 v2.0 | Addgene | #62988 | Construct to co-express cas9 protein and the gRNAs |
| Antibody | Histone H3 rabbit polyclonal | Abcam | ab1791, RRID:AB_302613 | (5 μg) |
| Antibody | H3K4Me1 rabbit polyclonal | Abcam | ab8895, RRID:AB_306847 | (5 μg) |
| Antibody | H3K27Ac rabbit polyclonal | Abcam | ab4729, RRID:AB_2118291 | (5 μg) |
| Antibody | H3K4Me3 mouse monoclonal | Abcam | ab1012, RRID:AB_442796 | (5 μg) |
| Antibody | H3K27Me3 mouse monoclonal | Abcam | ab6002, RRID:AB_305237 | (5 μg) |
| Antibody | H3K9Me3 rabbit polyclonal | Abcam | ab8898, RRID:AB_306848 | (5 μg) |
| Antibody | p300 rabbit monoclonal | CST | #54062, RRID:AB_2799450 | (5 μg) |
| Antibody | Ac-p300/CBP rabbit polyclonal | CST | #4771, RRID:AB_2262406 | (5 μg) |
| Antibody | BG4 antibody | Sigma-Aldrich | MABE917, RRID:AB_2750936 | (5 μg) |
| Commercial assay or kit | Arima-HiC Kit | Arima Genomics | A510008 | |
| Software, algorithm | Juicer | https://github.com/aidenlab/juicer | ||
| Software, algorithm | Juicebox | https://github.com/aidenlab/Juicebox/wiki/Download | ||
| Software, algorithm | Bedtools | https://bedtools.readthedocs.io/en/latest/ | ||
| Software, algorithm | HOMER | http://homer.ucsd.edu/homer/ |
Additional files
-
Supplementary file 1
Comparative analysis of the G4-dependent increase in Hi-C interactions upon insertion.
Table showing the number of genome-wide raw Hi-C contacts, actual number of contacts originating from the ±10 kb window with the insertion site at the middle and the comparative analysis (mean, standard deviation and z-score) of these number of contacts with contacts across 10,000 random 20 kb windows across the genome across the 3 samples.
- https://cdn.elifesciences.org/articles/96216/elife-96216-supp1-v1.docx
-
Supplementary file 2
Supplementary materials and methods.
- https://cdn.elifesciences.org/articles/96216/elife-96216-supp2-v1.docx
-
MDAR checklist
- https://cdn.elifesciences.org/articles/96216/elife-96216-mdarchecklist1-v1.docx
Download links
A two-part list of links to download the article, or parts of the article, in various formats.
Downloads (link to download the article as PDF)
Open citations (links to open the citations from this article in various online reference manager services)
Cite this article (links to download the citations from this article in formats compatible with various reference manager tools)
Artificially inserted strong promoter containing multiple G-quadruplexes induces long-range chromatin modification
eLife 13:RP96216.
https://doi.org/10.7554/eLife.96216.3


