Dual targeting of histone deacetylases and MYC as potential treatment strategy for H3-K27M pediatric gliomas
- Department of Immunology and Regenerative Biology, Weizmann Institute of Science, Israel
- Department of Veterinary Resources, Weizmann Institute of Science, Israel
- Bioinformatics Unit, Department of Life Sciences Core Facilities, Faculty of Biochemistry, Weizmann Institute of Science, Israel
- Wohl Institute for Drug Discovery of the Nancy and Stephen Grand Israel National Center for Personalized Medicine, Weizmann Institute of Science, Israel
- Department of Chemical and Structural Biology, Weizmann Institute of Science, Israel
- Racah Institute of Physics, Hebrew University, Israel
Figures
Figure 1 with 1 supplement
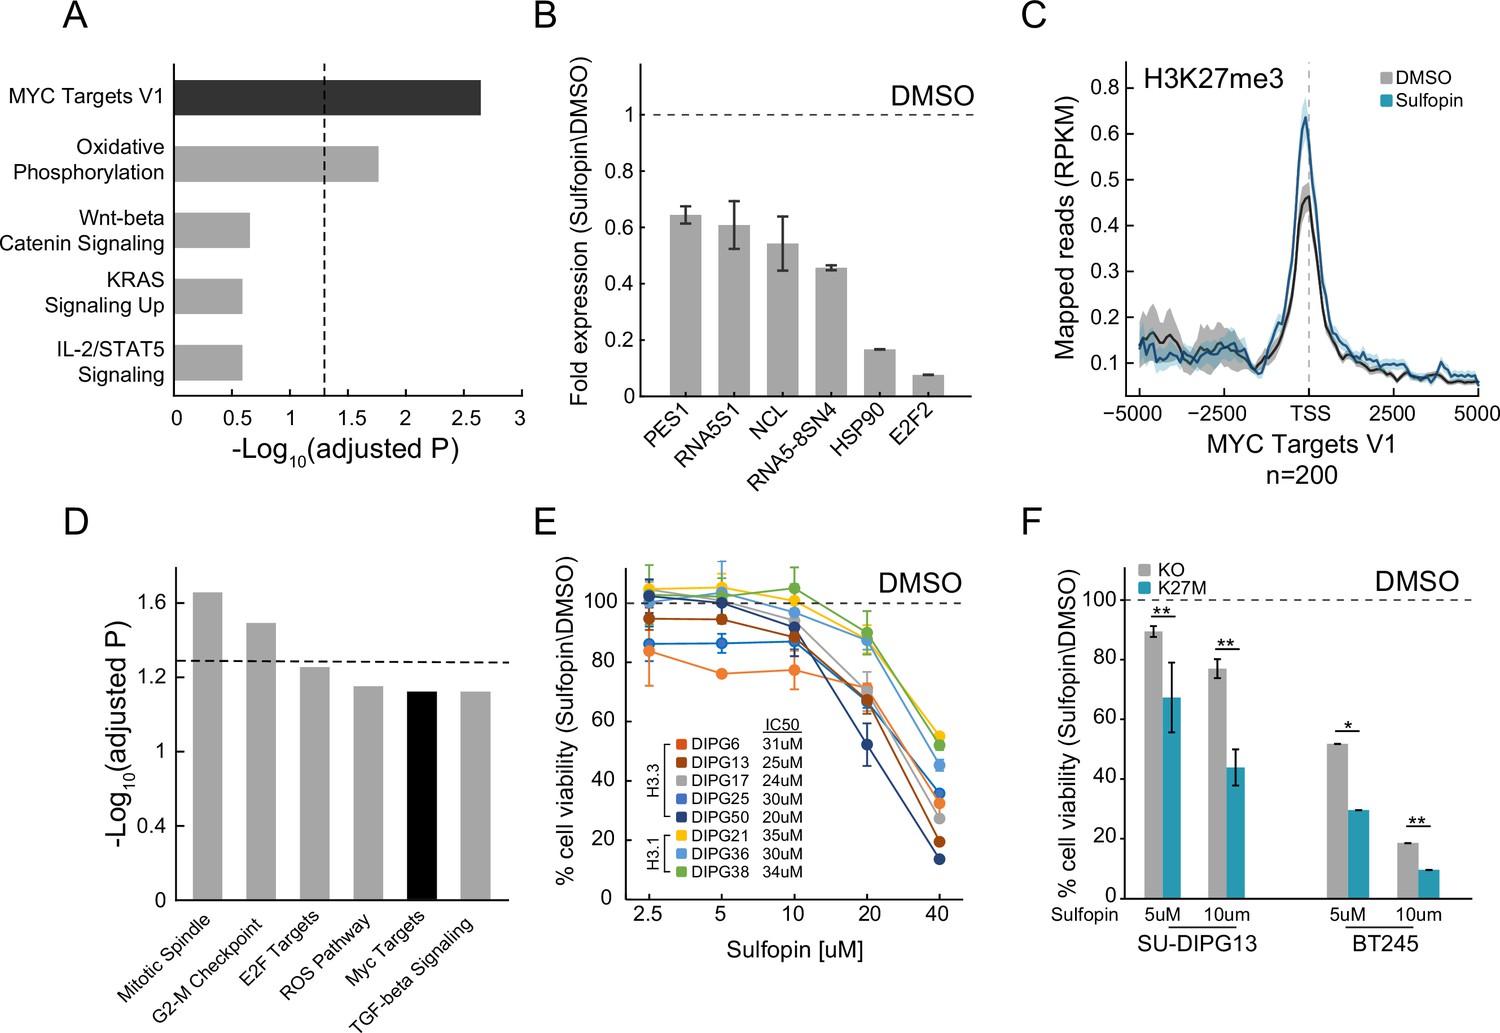
Sulfopin inhibits MYC signaling and reduces viability of diffuse midline glioma (DMG) cells in an H3-K27M-dependent manner.
(A) Functional enrichment analysis on significantly downregulated genes in SU-DIPG13 cells treated with 10 µM Sulfopin for 12 hr, compared to DMSO. Enrichr algorithm (Kuleshov et al., 2016) was used to compare downregulated genes against the Molecular Signatures Database (MSigDB) hallmark gene set (Liberzon et al., 2015). Dashed line denotes adjusted p-value=0.05. MYC targets are significantly enriched among the Sulfopin downregulated genes. (B) RT-qPCR analysis of selected MYC target genes in SU-DIPG13 cells treated with 10 µM Sulfopin for 12 hr, compared to DMSO. Fold change between Sulfopin and DMSO-treated cells was calculated and the mean ± SD of two technical repeats is shown. (C) H3K27me3 Cut&Run read coverage over MYC target genes (‘MYC Targets V1’ hallmark gene set; Liberzon et al., 2015, n=200), in SU-DIPG13 cells treated with 10 µM Sulfopin for 8 days compared to DMSO. Sulfopin treatment increases H3K27me3 levels on the transcriptional start sites (TSS) of MYC target genes. (D) Functional enrichment analysis of the genes associated with Sulfopin-unique H3K27me3 peaks, in SU-DIPG13 cells treated as in C. Dashed line denotes adjusted p-value=0.05. MYC target gene set (‘MYC Targets V1’ hallmark gene set; Liberzon et al., 2015) is mildly enriched among these genes, with adjusted p-value of 0.077. (E) Cell viability, as measured by CellTiterGlo, of eight DMG cultures (H3.3K27M: SU-DIPG13, SU-DIPG6, SU-DIPG17, SU-DIPG25, and SU-DIPG50. H3.1K27M: SU-DIPG36, SU-DIPG38, and SU-DIPG21), treated with Sulfopin for 8 days with pulse at day 4, compared to DMSO. Mean ± SD of two technical replicates is shown. Logarithmic scale is used for the x-axis. Sulfopin treatment led to a mild reduction in cell viability in all H3-K27M glioma cultures. (F) Cell viability, as measured by CellTiterGlo, of two isogenic DMG cell lines (SU-DIPG13 and BT245) in which the mutant histone was knocked out (KO), treated with the indicated concentration of Sulfopin for 8 days, compared to DMSO. For each cell line and concentration, the fold change in viability between Sulfopin and DMSO-treated cells is shown. For SU-DIPG13 mean±SE of at least two independent experiments is shown. For BT245 mean ± SD of three technical replicates is shown. H3-K27M glioma cells show higher sensitivity to Sulfopin treatment compared to the KO cells. *p<0.05; **p<0.01 (two-sample t-test over all technical replicates). Significance adjusted after Bonferroni correction.
Figure 1—figure supplement 1
The sensitivity of diffuse midline glioma (DMG) cells to Sulfopin correlates with MYC expression levels.
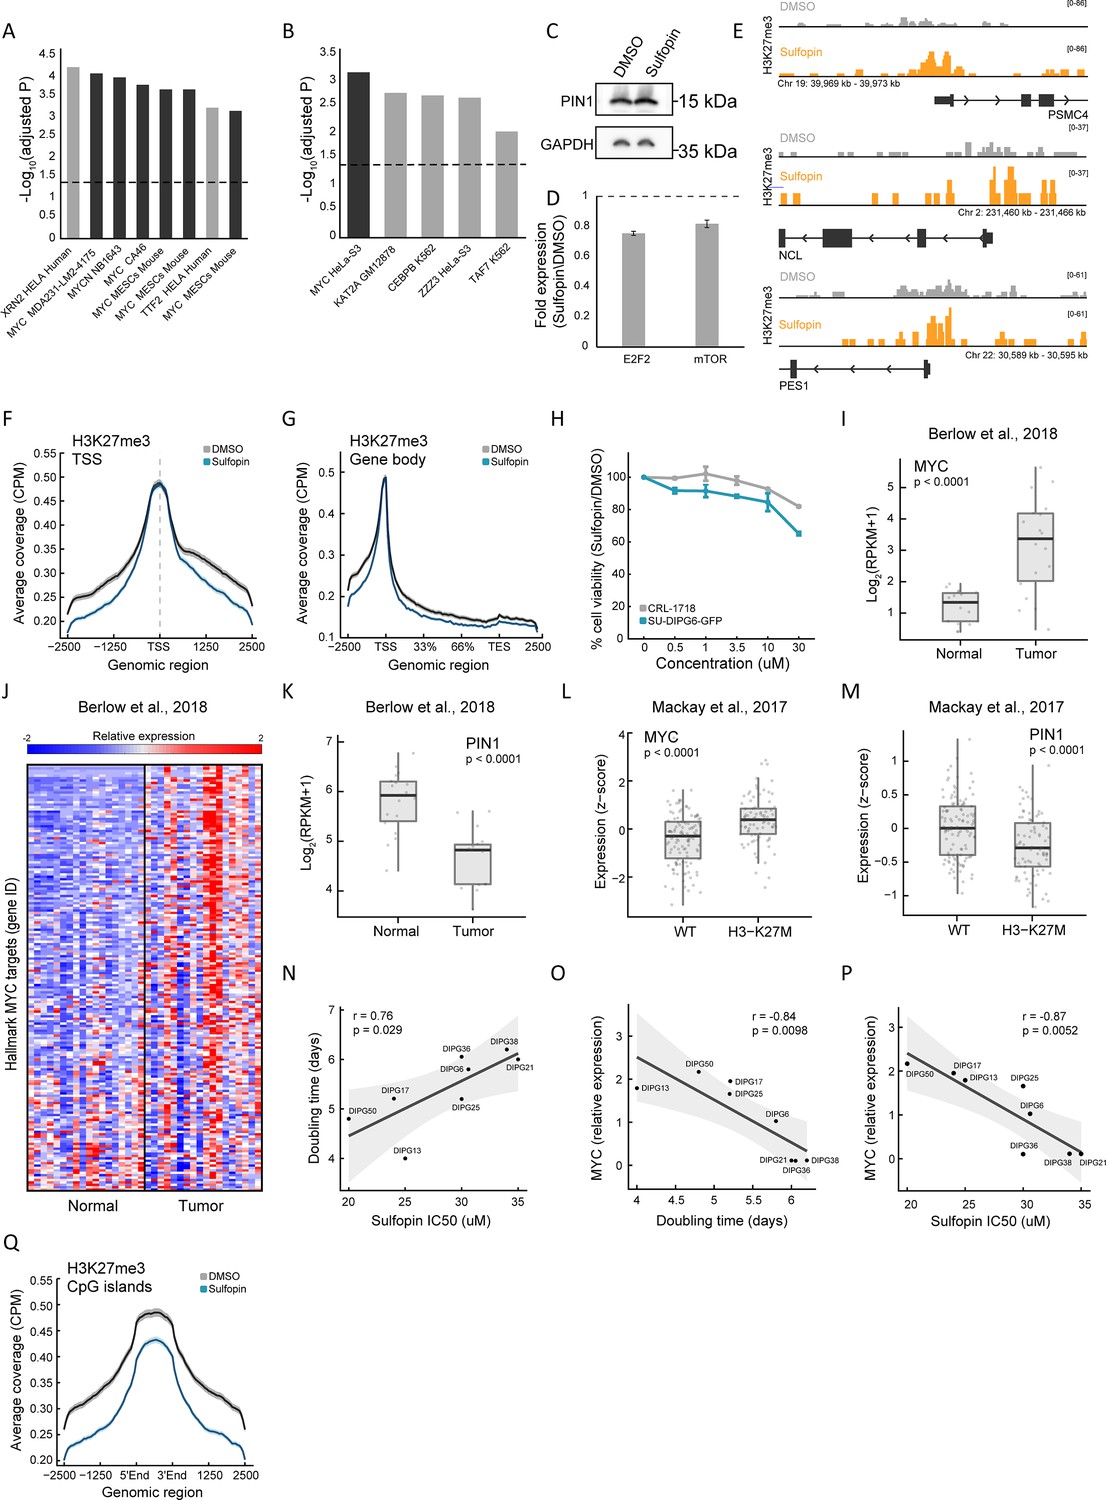
(A–B) Functional enrichment analysis on significantly downregulated genes in SU-DIPG13 cells treated with 10 µM Sulfopin for 12 hr, compared to DMSO. Enrichr (Kuleshov et al., 2016) algorithm was used to compare the dataset against the ChEA (Keenan et al., 2019) (A) and ENCODE TF ChIP (Dunham et al., 2012) sets (B) databases. Dashed line denotes adjusted p-value=0.05. Sulfopin downregulated genes are strongly enriched for MYC target genes as identified in different non-glioma cell lines (black bars). (C) Western blot of SU-DIPG13 treated either with Sulfopin (10 µM, 8 days) or DMSO, using the indicated antibodies. (D) RT-qPCR analysis of E2F2 and mTOR genes in SU-DIPG6 cells treated with 10 µM Sulfopin for 12 hr, compared to DMSO. Fold change between Sulfopin and DMSO-treated cells was calculated and the mean ± SD of two technical repeats is shown. (E) IGV track of the transcriptional start sites (TSS) region of three MYC targets, PSMC4, NCL, and PES1, showing H3K27me3 coverage in SU-DIPG13 cells treated with 10 µM Sulfopin for 8 days, compared to DMSO. (F–G) H3K27me3 coverage over all TSS (F) and gene body (G), in SU-DIPG13 cells treated as in C. Sulfopin does not affect H3K27me3 global deposition over these regions. (H) Percentage of cell viability as measured by CellTiterGlo of SU-DIPG6-GFP and astrocytic-like cells (CRL-1718) treated with Sulfopin (0.5, 1, 3.5, 10, 30 µM) for 4 days, compared to DMSO. Mean ± SD of two technical repeats is shown. SU-DIPG6-GFP cells show higher sensitivity to Sulfopin compared to the astrocytes at all concentrations. (I–K) Expression levels of MYC (I), ‘MYC Targets V1’ hallmark gene set (Liberzon et al., 2015) (J), and PIN1 (K) in 18 DMG tumor samples and their matched normal samples (Berlow et al., 2018). Box plots show center line as median, box limits as upper and lower quartiles, whiskers as minimum and maximum values. Individual data points are shown in gray circles. ***p<0.001 (two-sample t-test). MYC and its target genes show higher expression in the DMG tumor samples, compared to their matched normal samples. (L–M) Expression levels of MYC (K) and PIN1 (L) in WT and H3-K27M DMG tumor samples (n=201) (Mackay et al., 2017). Boxplot as in J. ***p<0.001 (two-sample t-test). (N) Doubling time (days) and Sulfopin IC50 levels measured in eight DMG cultures. Pearson correlation coefficient (r) is indicated. Gray area depicts 95% confidence interval for regression line. Positive correlation was detected between the two measures. (O) Doubling time (days) and MYC expression levels measured in eight DMG cultures. Pearson correlation coefficient (r) is indicated. Gray area depicts 95% confidence interval for regression line. Negative correlation was detected between the two measures. (P) MYC expression and Sulfopin IC50 levels measured in eight DMG cultures. Pearson correlation coefficient (r) is indicated. Gray area depicts 95% confidence interval for regression line. Negative correlation was detected between the two measures. (Q) H3K27me3 coverage over CpG islands (CGIs), in SU-DIPG13 cells treated as in C. H3K27me3 signal is decreased in the Sulfopin-treated cells compared to the DMSO-treated cells.
-
Figure 1—figure supplement 1—source data 1
Original scan for the western blot analysis shown in Figure 1—figure supplement 1C.
- https://cdn.elifesciences.org/articles/96257/elife-96257-fig1-figsupp1-data1-v1.zip
-
Figure 1—figure supplement 1—source data 2
Annotation of the original scan for the western blot analysis shown in Figure 1—figure supplement 1C.
- https://cdn.elifesciences.org/articles/96257/elife-96257-fig1-figsupp1-data2-v1.zip
Figure 2 with 1 supplement
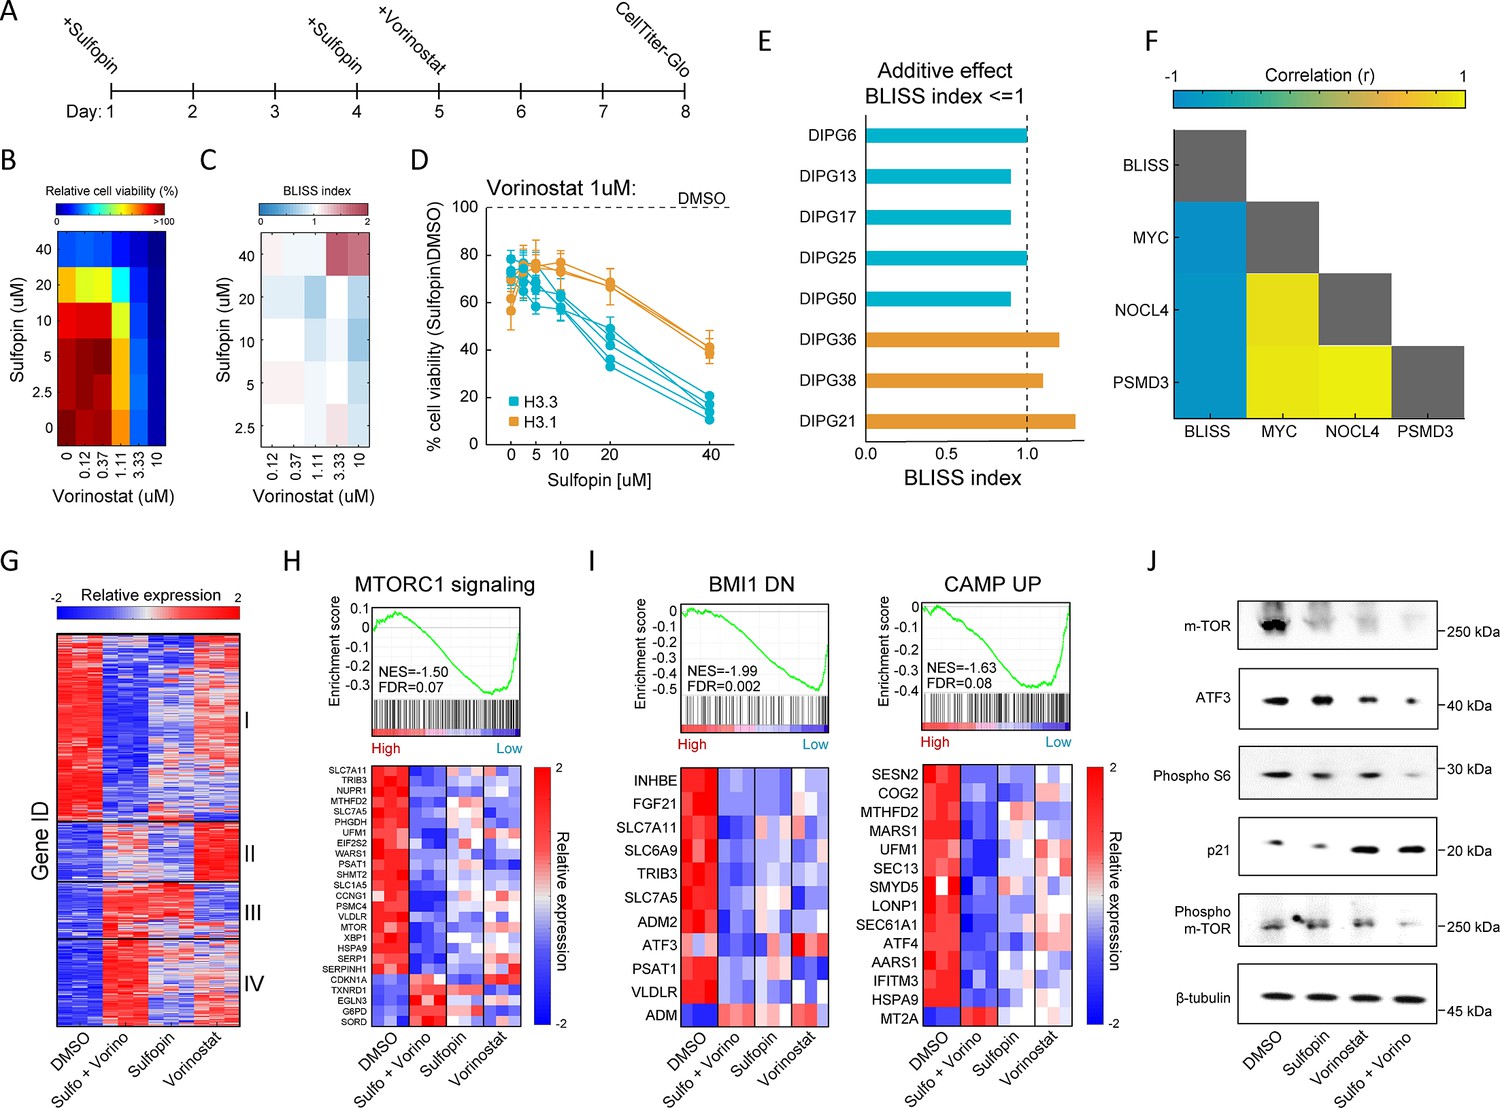
Combination of Sulfopin and Vorinostat elicits robust downregulation of oncogenic pathways.
(A) Timeline demonstrating the treatment protocol for the combination of Sulfopin and Vorinostat. (B) Percentage of cell viability, as measured by CellTiterGlo of SU-DIPG13 cells treated with Sulfopin and Vorinostat at the indicated concentrations, compared to DMSO. (C) BLISS index measured as the ratio between the observed and the expected effect of the combination of Sulfopin and Vorinostat, for each pair of concentrations, in SU-DIPG13. Synergy: Bliss < 1,Additive: Bliss = 1, Antagonist: Bliss > 1. (D) Cell viability as measured by CellTiterGlo, of eight diffuse midline glioma (DMG) cultures treated with Sulfopin (0 µM, 2.5 µM, 5 µM, 10 µM, 20 µM, and 40 µM) and Vorinostat (1 µM), compared to DMSO. H3.3-K27M and H3.1-K27M cultures are indicated in blue and orange, respectively. Mean ± SD of two technical replicates is shown. H3.3-K27M cells showed higher sensitivity to the combined treatment compared to H3.1-K27M cells. (E) The BLISS index of the combination of Sulfopin (10 µM) and Vorinostat (1 µM), in the indicated cultures. An additive effect was detected in all the H3.3-K27M cultures at this set of concentrations. (F) Pearson correlation coefficient matrix of BLISS index of the combined treatment (Sulfopin [10 µM] and Vorinostat [1 µM]) and mRNA levels of MYC and its target genes, in the eight DMG cultures tested. mRNA levels were measured by RT-qPCR (Figure 2—figure supplement 1G and H). Blue and yellow colors indicate negative or positive correlation, respectively. Negative correlation was detected between the BLISS indexes and the expression levels of MYC and its target genes. (G) Unsupervised hierarchical clustering of expression levels of 620 significantly differentially expressed (DE) genes detected in SU-DIPG13 cells treated with either Sulfopin (10 µM, 8 days), Vorinostat (1 µM, 72 hr), the combination of Sulfopin and Vorinostat or DMSO (see also Supplementary file 1). Gene expression rld values (log2 transformed and normalized) were standardized for each gene (row) across all samples. Color intensity corresponds to the standardized expression, low (blue) to high (red). Clusters 1 and 4 demonstrate additive transcriptional patterns associated with the combined treatment. (H) Top: Gene set enrichment analysis (GSEA) on SU-DIPG13 treated with combination of 10 µM Sulfopin and 1 µM Vorinostat compared to DMSO, showing significant downregulation of mTORC1 signaling (‘HALLMARK_MTORC1_SIGNALING’ gene set; Liberzon et al., 2015) in the combined treatment. NES: normalized enrichment score. FDR: false discovery rate. Bottom: Expression levels of significantly DE genes detected in the combined treatment compared to DMSO that are part of the mTORC1 signaling gene set. MTOR gene was added manually to the heatmap. Heatmaps were generated as described in B. (I) Top: GSEA on SU-DIPG13 treated as in C, showing significant downregulation of the epigenetic BMI-1 pathway and the oncogenic cAMP pathway in the combined treatment (BMI1_DN.V1_UP; CAMP_UP.V1_UP; Molecular Signatures Database [MSigDB] C6 oncogenic signature; Wiederschain et al., 2007; van Staveren et al., 2006). Bottom: Expression levels of significantly DE genes detected in the combined treatment compared to DMSO that are part of the BMI-1 and cAMP gene sets. Heatmaps were generated as described B. (J) Western blot of SU-DIPG13 treated either with Sulfopin (10 µM, 8 days), Vorinostat (1 µM, 72 hr), the combination of Sulfopin and Vorinostat or DMSO, using the indicated antibodies. β-Tubulin is used as loading control.
-
Figure 2—source data 1
Original scan for the western blot analysis shown in Figure 2J.
- https://cdn.elifesciences.org/articles/96257/elife-96257-fig2-data1-v1.zip
-
Figure 2—source data 2
Annotation of the original scan for the western blot analysis shown in Figure 2J.
- https://cdn.elifesciences.org/articles/96257/elife-96257-fig2-data2-v1.zip
Figure 2—figure supplement 1
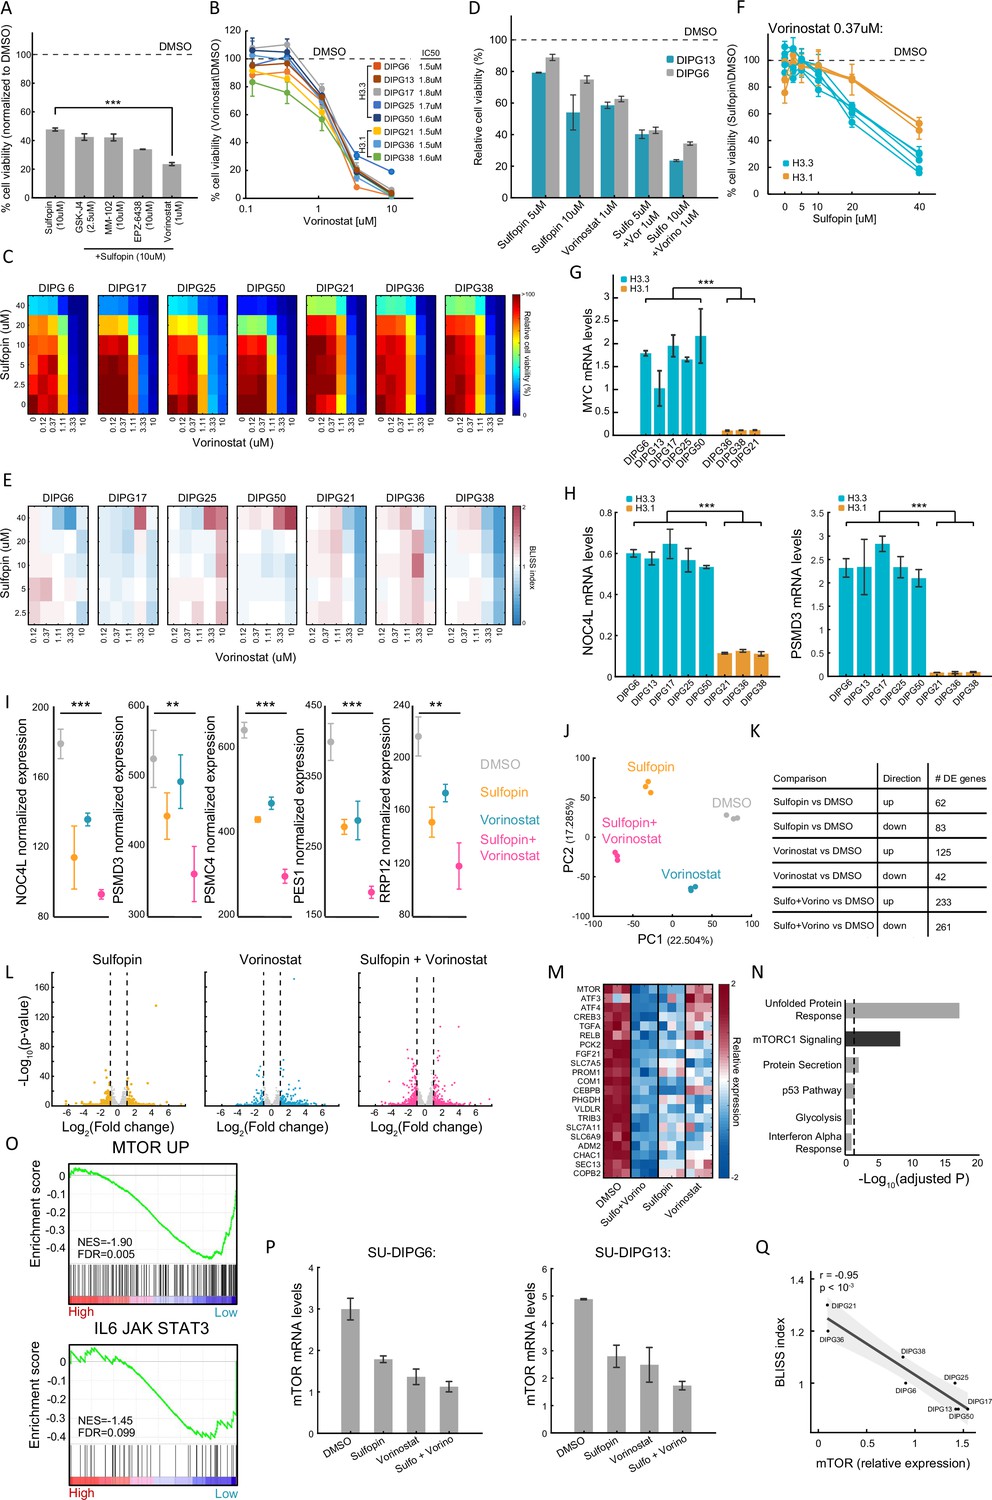
The additive effect of the combination of Sulfopin and Vorinostat results in downregulation of oncogenic pathways.
(A) Percentage of cell viability, as measured by CellTiterGlo, of SU-DIPG13 treated with 10 µM Sulfopin or with combined treatment of 10 µM Sulfopin and the indicated agent (putative targets left to right: JMJD3, MLL1, EZH2, histone deacetylases [HDAC]), compared to DMSO. For Sulfopin and Vorinostat mean±SE of at least two independent experiments is shown. For all the other drugs mean ± SD of three technical replicates is shown. In the combination of Sulfopin and Vorinostat, only ~20% of cells survive the treatment. ***p<0.001 (two-sample t-test). (B) Cell viability, as measured by CellTiterGlo, of eight diffuse midline glioma (DMG) cultures (SU-DIPG13, SU-DIPG6, SU-DIPG17, SU-DIPG25, SU-DIPG50, SU-DIPG36, SU-DIPG38, and SU-DIPG21), treated with the indicated concentrations of Vorinostat for 3 days, compared to DMSO. Mean ± SD of two technical replicates is shown. Logarithmic scale is used for the x-axis. (C) Percentage of cell viability, as measured by CellTiterGlo, of seven DMG cultures (SU-DIPG6, SU-DIPG17, SU-DIPG25, SU-DIPG50, SU-DIPG36, SU-DIPG38, and SU-DIPG21), treated with Sulfopin and Vorinostat at the indicated concentrations, compared to DMSO. (D) Cell viability as measured by CellTiterGlo, of SU-DIPG13 and SU-DIPG6-GFP cells treated as indicated, relative to DMSO. Mean ± SE of two independent experiments is shown. (E) BLISS index for each concentration of Sulfopin and Vorinostat, in the eight DMG cultures indicated in C. Synergy: Bliss < 1,Additive: Bliss = 1, Antagonist: Bliss > 1. Additive effect was detected in the majority of the drug doses of the H3.3-K27M DMG cells, and in the higher dosages of Vorinostat in the H3.1-K27M cells. (F) Cell viability as measured by CellTiterGlo, of eight DMG cultures treated with Sulfopin (0 µM, 2.5 µM, 5 µM, 10 µM, 20 µM, and 40 µM) and Vorinostat (0.33 µM), compared to DMSO. H3.3-K27M and H3.1-K27M cultures are indicated in blue and orange, respectively. Mean ± SD of two technical replicates is shown. H3.3-K27M cells showed higher sensitivity to the combined treatment compared to H3.1-K27M cells. (G–H) RT-qPCR analysis of MYC, and its target genes NOC4L and PSMD3, in eight DMG cultures. Mean ± SD of two technical repeats is shown. H3.3-K27M cells show higher expression compared to the H3.1-K27M cells. ***p<0.001 (two-sample t-test). (I) Normalized expression levels of the indicated MYC target genes in SU-DIPG13 cells treated as described in Figure 2G. Mean ± SD of three technical repeats is shown. The expression of these genes is reduced following the combined treatment. **p<0.01, ***p<0.001 (two-sample t-test). (J) RNA sequencing was performed on SU-DIPG13 treated with either Sulfopin (10 µM, 8 days), Vorinostat (1 µM, 72 hr) or Sulfopin+Vorinosat (10 µM, 8 days and 1 µM, 72 hr), compared to DMSO. Principal component analysis (PCA) of all genes detected by RNA-seq is shown. Three technical repeats are shown. (K) Table presenting the total numbers of significantly differentially expressed genes in each treatment compared to DMSO (adjusted p-value≤0.05, |log2FoldChange|≥1, and baseMean≥5). (L) Volcano plots presenting all genes detected in each treatment compared to DMSO. Significantly differentially expressed genes are colored. (M) Heatmap presenting selected genes from cluster 1 (as shown in Figure 2B) that were downregulated in the combined treatment compared to DMSO. Color intensity corresponds to the standardized expression, low (blue) to high (red). Only oncogenes and genes that are involved in glioma progression are shown. (N) Functional enrichment analysis on genes comprising cluster 1 using Enrichr (Kuleshov et al., 2016) algorithm comparing to the Molecular Signatures Database (MSigDB) hallmark gene set collection (Liberzon et al., 2015). Dashed line denotes adjusted p-value=0.05. mTORC1 signaling is highly enriched among cluster 1 genes. (O) Gene set enrichment analysis (GSEA) on SU-DIPG13 treated with combination of 10 µM Sulfopin and 1 µM Vorinostat compared to DMSO, showing significant downregulation of the mTOR oncogenic signature (MTOR_UP.N4.V1_UP; MSigDB C6 Oncogenic Signature; Wei et al., 2006), and the IL-6/JAK/STAT3 signaling pathway (HALLMARK_IL6_JAK_STAT3_SIGNALING; MSigDB hallmark gene set collection; Liberzon et al., 2015), in the combined treatment. NES: normalized enrichment score. FDR: false discovery rate. (P) RT-qPCR analysis of mTOR gene in SU-DIPG6 cells (left) and SU-DIPG13 (right), treated as indicated in Figure 2G. Mean ± SD of two technical repeats is shown. The expression of mTOR is reduced following the combined treatment. (Q) mTOR expression and BLISS index measured in eight DMG cultures. Pearson correlation coefficient (r) is indicated. Gray area depicts 95% confidence interval for regression line. Negative correlation was detected between the two measures.
Figure 3 with 1 supplement
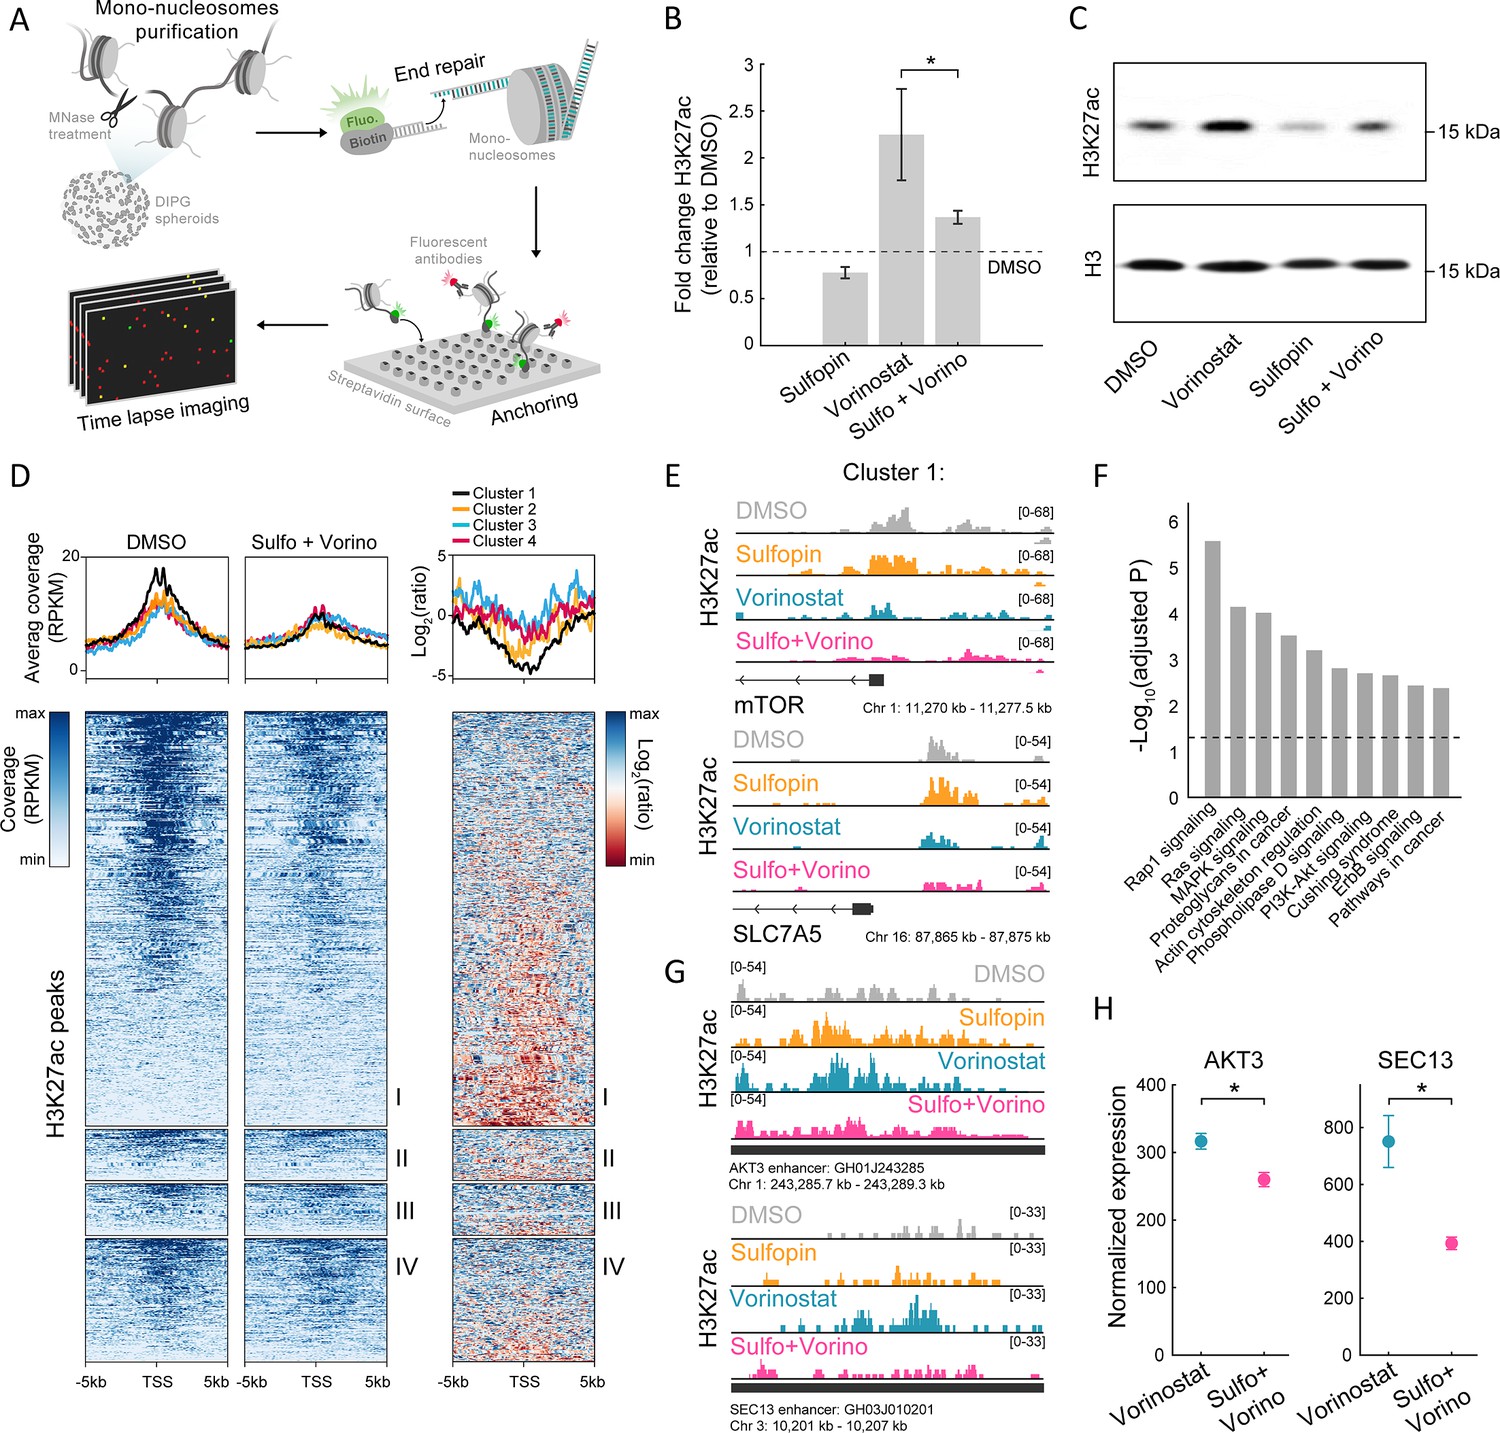
The combined treatment attenuates H3K27ac levels on oncogenic targets.
(A) Scheme of the single-molecule imaging experimental setup (Shema et al., 2016): cell-derived mono-nucleosomes are anchored in a spatially distributed manner on polyethylene glycol (PEG)-coated surface. Captured nucleosomes are incubated with fluorescently labeled antibodies directed against the H3K27ac modification. Total internal reflection fluorescence (TIRF) microscopy is utilized to record the position and modification state of each nucleosome. Time series images are taken to allow detection of maximal binding events. (B) Single-molecule imaging quantification of the percentage of H3K27ac nucleosomes, in SU-DIPG13 cells treated with either Sulfopin (10 µM, 8 days), Vorinostat (1 µM, 72 hr), or the combination of Sulfopin and Vorinostat, normalized to DMSO. Mean fold±SE of at least two independent experiments is shown. H3K27ac global levels are lower in the combined treatment compared to cells treated solely with Vorinostat. *p<0.05 (two-sample t-test). (C) SU-DIPG13 cells were treated as in B, and analyzed by western blot using the indicated antibodies. (D) Left panel: Heatmap shows H3K27ac read coverage around the transcriptional start sites (TSS) (±5 kb) of the significantly differentially expressed (DE) genes shown in Figure 2G, in SU-DIPG13 cells treated with the combination of 10 µM Sulfopin and 1 µM Vorinostat versus DMSO. Average coverage is shown on top. Color intensity corresponds to the standardized expression. Clusters 1–4 are indicated. Right panel: The log2 ratio of H3K27ac read coverage in SU-DIPG13 cells treated with the combination of 10 µM Sulfopin and 1 µM Vorinostat vs. DMSO was calculated. Heatmap shows the ratio around the TSS (±5 Kb) of the significantly DE genes shown in Figure 2G, and average coverage is shown on top. Color intensity corresponds to the ratio between samples, low (red) to high (blue). Clusters 1–4 are indicated, with cluster 1 presenting the strongest local decrease in H3K27ac following the combined treatment compared to DMSO. (E) IGV tracks of MTOR and SLC7A5 gene promoters, showing H3K27ac coverage in SU-DIPG13 cells treated as indicated. (F) Functional enrichment analysis of the genes linked to enhancers (top targets of high confident enhancers) marked with H3K27ac exclusively in SU-DIPG13 cells treated with Vorinostat, and not in the combined treatment. gProfiler algorithm (Raudvere et al., 2019) was used to calculate enrichment against the KEGG pathways DB (Kanehisa and Goto, 2000). Dashed line denotes adjusted p-value=0.05. Genes associated with Vorinostat-unique enhancers are enriched for oncogenic signaling pathways. (G) IGV track of AKT3 and SEC13 linked enhancers, showing H3K27ac coverage in SU-DIPG13 cells treated with 1 µM Vorinostat or the combination of 10 µM Sulfopin and 1 µM Vorinostat. (H) Normalized expression levels of AKT3 and SEC13 genes in SU-DIPG13 cells treated as in G. Mean ± SD of three technical repeats is shown. *p<0.05 (two-sample t-test).
-
Figure 3—source data 1
Original scan for the western blot analysis shown in Figure 3C.
- https://cdn.elifesciences.org/articles/96257/elife-96257-fig3-data1-v1.zip
-
Figure 3—source data 2
Annotation of the original scan for the western blot analysis shown in Figure 3C.
- https://cdn.elifesciences.org/articles/96257/elife-96257-fig3-data2-v1.zip
Figure 3—figure supplement 1
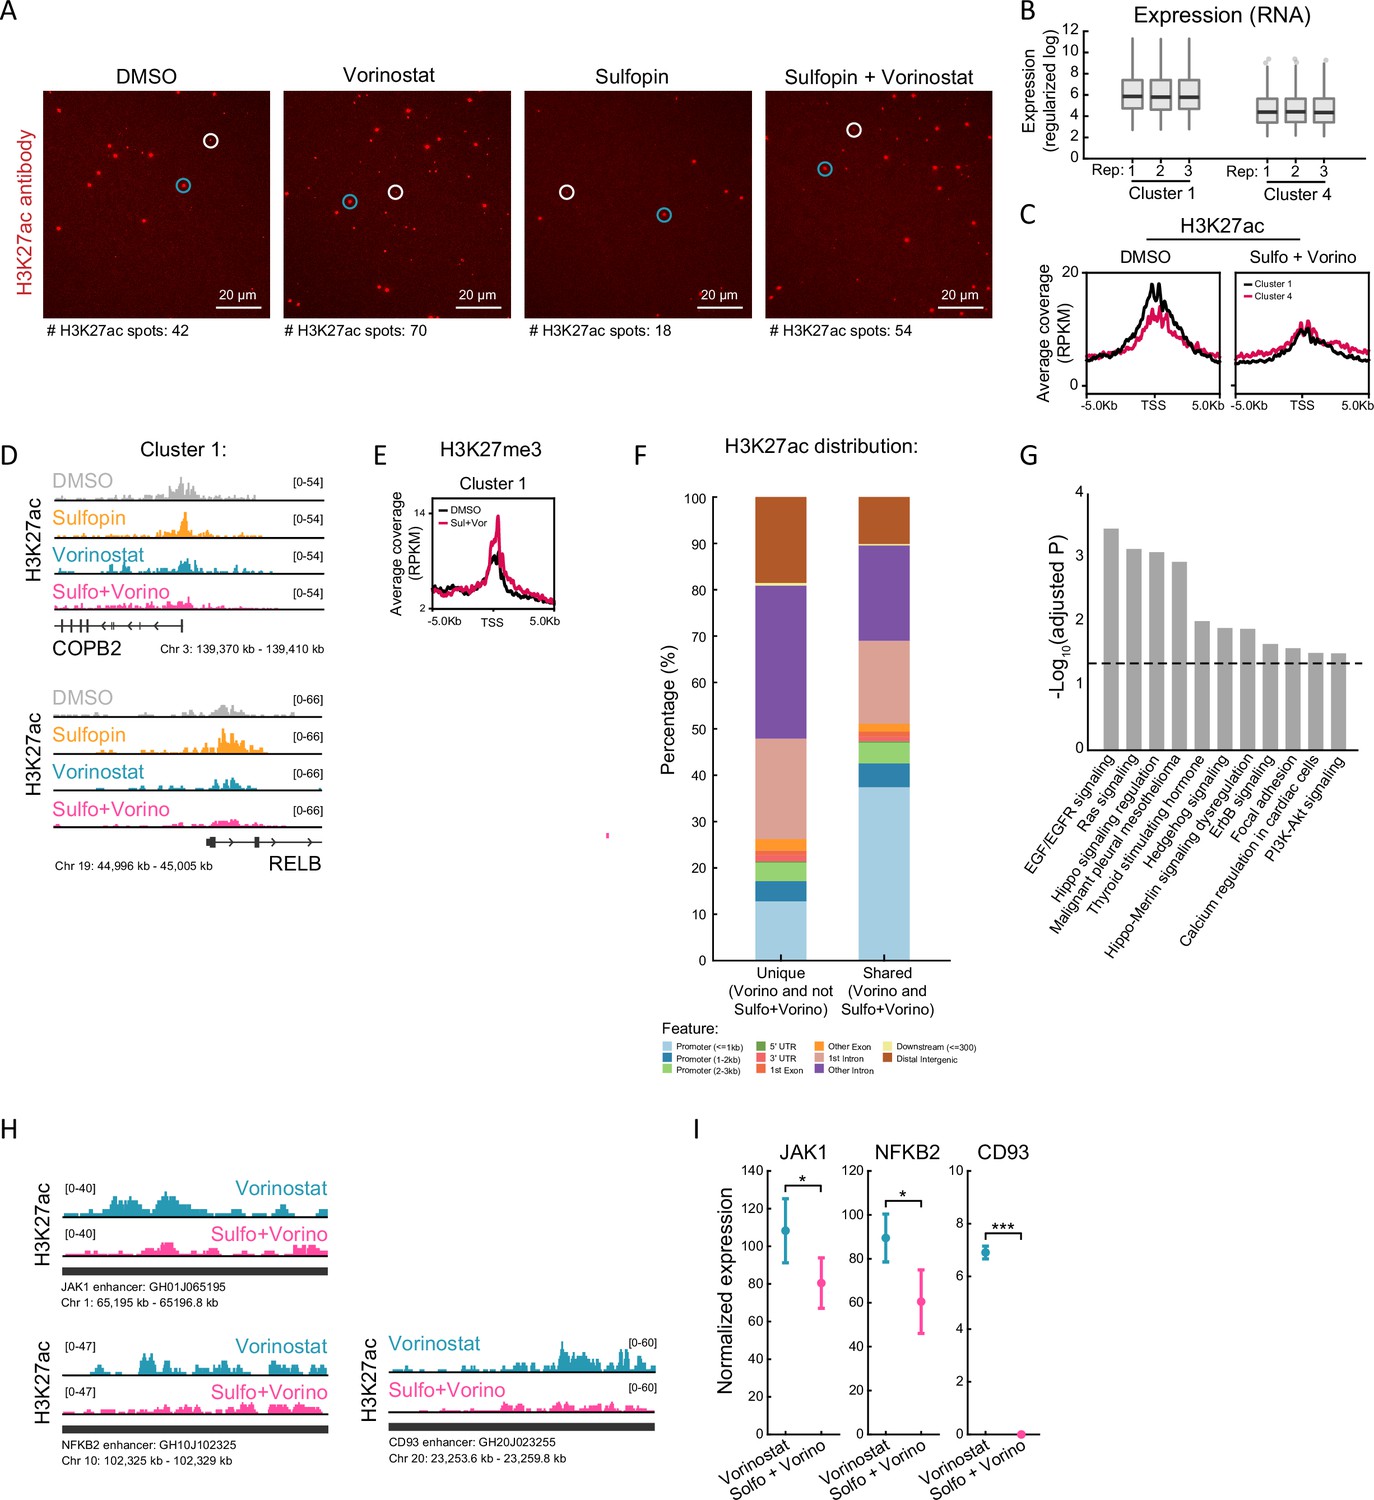
H3K27ac levels decrease following the combined treatment specifically on oncogenes.
(A) Representative single-molecule images of individual H3K27ac nucleosomes imaged by total internal reflection fluorescence (TIRF) microscopy (as described in Figure 3A), in SU-DIPG13 treated as described in Figure 3B. White circles indicate antibody spots, and blue circles indicate TetraSpeck beads that are used for the alignment with the nucleosomes. Number of H3K27ac antibody spots is indicated in each field of view (FOV). (B) Averaged expression levels of genes comprising cluster 1 and cluster 4, in control DMSO-treated SU-DIPG13 cells. Three technical replicates are shown. Cluster 1 genes show higher expression levels under basal conditions compared to cluster 4 genes. (C) H3K27ac Cut&Run averaged signal over the transcriptional start sites (TSS) of genes comprising cluster 1 and cluster 4, in SU-DIPG13 cells treated as described in Figure 3D. (D) IGV tracks of the cluster 1’ genes RELB and COPB2, showing H3K27ac coverage upon their promoters in SU-DIPG13 treated as described in Figure 3D. (E) H3K27me3 Cut&Run averaged signal over the TSS of genes comprising cluster 1. (F) Proportion of H3K27ac peaks corresponding to the indicated genomic features. Shown are peaks that were detected in both Vorinostat and Sulfopin+Vorinostat-treated cells (shared peaks, bottom line), as well as H3K27ac peaks that were only present in Vorinostat-treated cells and were lost in the combined treatment with Sulfopin (unique peaks). H3K27ac peaks that were lost in the combined treatment with Sulfopin are associated with distal genomic regions. (G) Functional enrichment analysis of the genes linked to enhancers (top targets of high confident enhancers), marked with H3K27ac exclusively in SU-DIPG13 cells treated with Vorinostat, and are lost in the combined treatment. gProfiler algorithm (Raudvere et al., 2019) was used to calculate enrichment against the WikiPathways gene sets (Martens et al., 2021). Dashed line denotes adjusted p-value=0.05. Genes associated with Vorinostat-unique enhancers are enriched for oncogenic signaling pathways. (H) IGV track of JAK1, NFKB2, and CD93 enhancer locus, showing H3K27ac coverage in SU-DIPG13 treated with 1 µM Vorinostat or the combination of 10 µM Sulfopin and 1 µM Vorinostat. (I) Normalized expression levels of JAK1, NFKB2, and CD93 genes in SU-DIPG13 treated as in F. Mean ± SD of three technical repeats is shown. *p<0.05; ***p<0.001 (two-sample t-test).
Figure 4 with 1 supplement
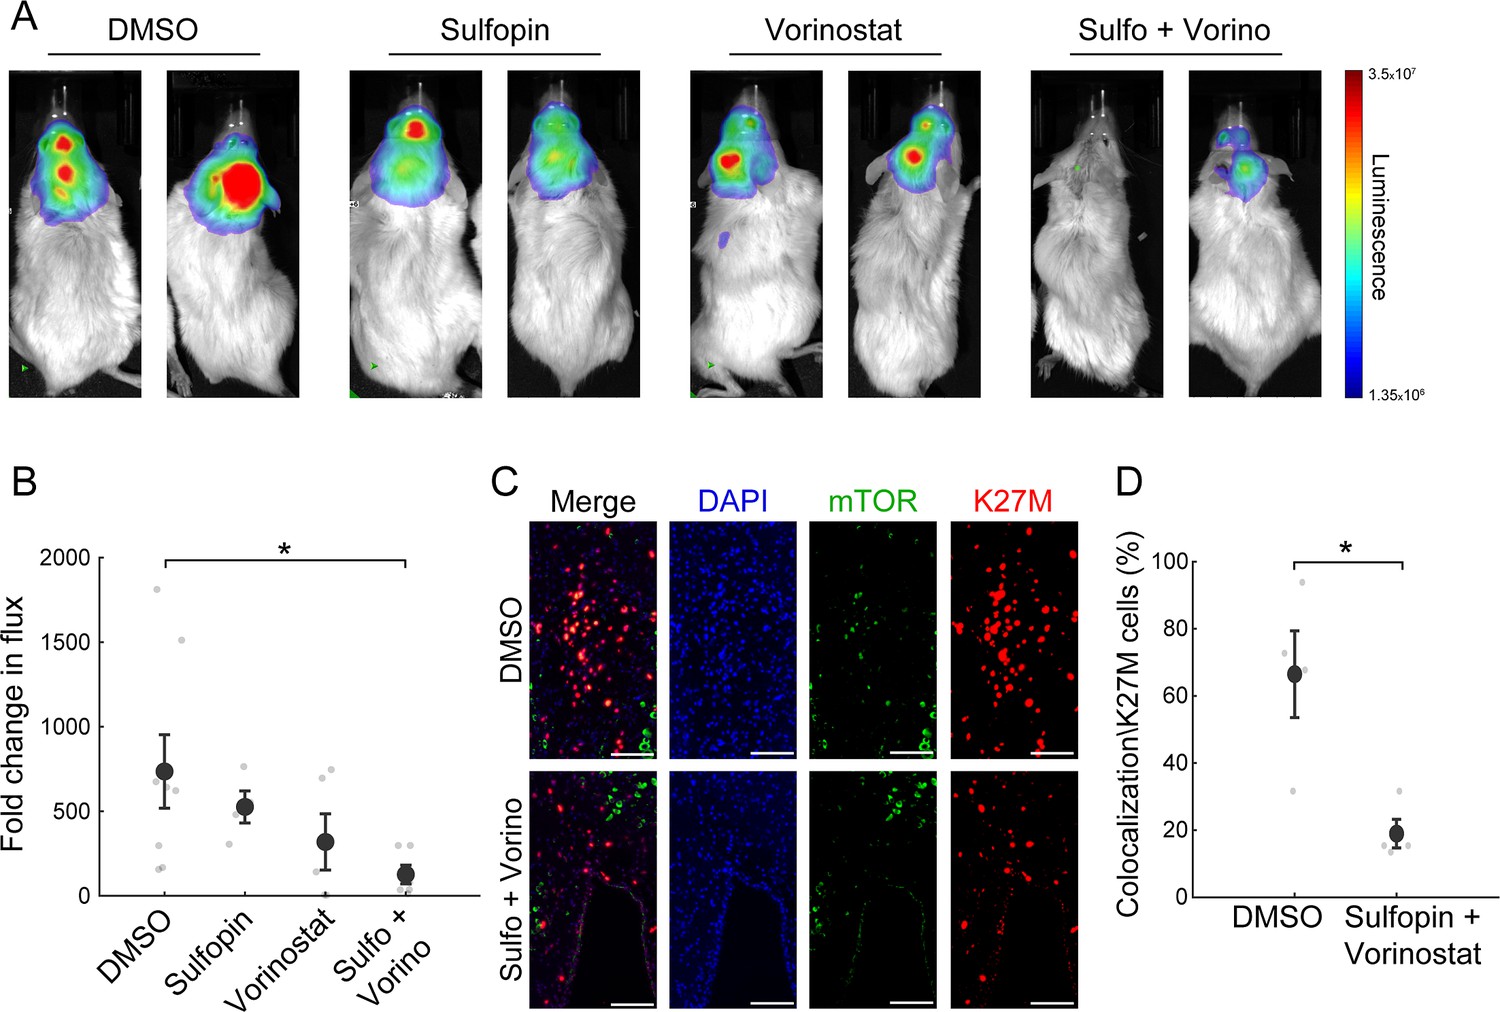
The combined treatment with Sulfopin and Vorinostat reduces tumor growth in vivo.
(A–B) SU-DIPG13P* cells were injected to the pons of immunodeficient mice to form tumors. Ten days post injection, mice were treated for 18 days with either DMSO, Sulfopin, Vorinostat, or the combination of Sulfopin and Vorinostat. (A) In vivo bioluminescent imaging of diffuse midline glioma (DMG) xenografts following 18 days of treatment. The heatmap superimposed over the mouse head represents the degree of photon emission by DMG cells expressing firefly luciferase. (B) DMG xenograft tumor growth as measured by change in bioluminescent photon emission following 15 days of treatment with either DMSO (n=8), Sulfopin (n=4), Vorinostat (n=5), or the combination of Sulfopin and Vorinostat (n=6). Data points represent the fold change in maximum photon flux between day 3 and day 18 under treatment for each mouse. Mean ± SE is shown. *p<0.05 (two-tailed Mann-Whitney U-test). (C–D) Immunofluorescent staining of brain sections from mice injected with SU-DIPG13 cells and treated with DMSO (n=4) or the combination of Sulfopin and Vorinostat (n=4). (C) Representative fluorescence images of H3-K27M (red) and mTOR (green). Scale-bar = 100mm. (D) Percentage of mTOR-positive cells out of the total H3-K27M-positive cells (n=13–198 cells per field of view [FOV]). H3-K27M-positive cells show lower levels of mTOR following the combined treatment compared to DMSO. Mean ± SE is shown. *p<0.05 (two-tailed t-test).
Figure 4—figure supplement 1

The combined treatment with Sulfopin and Vorinostat results in tumor growth reduction in vivo.
(A–B) mTOR immunofluorescent signal (% of positive area) detected in region of interest (ROI) of H3-K27M-negative cells (mouse cells), from brain sections of mice treated with either DMSO or the combination of Sulfopin and Vorinostat. N.S. indicates p>0.05 (two-sample t-test). Representative images are shown in B.
Additional files
-
Supplementary file 1
List of differentially expressed genes and their corresponding cluster.
Related to Figure 2G.
- https://cdn.elifesciences.org/articles/96257/elife-96257-supp1-v1.xlsx
-
Supplementary file 2
Reagents and resources.
- https://cdn.elifesciences.org/articles/96257/elife-96257-supp2-v1.docx
-
Supplementary file 3
Summary information of NGS libraries.
(a) Summary information of MARS-seq libraries. (b) Summary information of Cut&Run libraries.
- https://cdn.elifesciences.org/articles/96257/elife-96257-supp3-v1.xlsx
-
MDAR checklist
- https://cdn.elifesciences.org/articles/96257/elife-96257-mdarchecklist1-v1.pdf
Download links
A two-part list of links to download the article, or parts of the article, in various formats.
Downloads (link to download the article as PDF)
Open citations (links to open the citations from this article in various online reference manager services)
Cite this article (links to download the citations from this article in formats compatible with various reference manager tools)
Dual targeting of histone deacetylases and MYC as potential treatment strategy for H3-K27M pediatric gliomas
eLife 13:RP96257.
https://doi.org/10.7554/eLife.96257.3


