Chronic activation of a negative engram induces behavioral and cellular abnormalities
- Department of Psychological and Brain Sciences, The Center for Systems Neuroscience, Boston University, United States
- Graduate Program for Neuroscience, Boston University, United States
- Whitehead Institute for Biomedical Research, MIT, United States
- Department of Physiology and Cellular Biophysics, Columbia University Medical Center, United States
- Neurophotonics Center, and Photonics Center, Boston University, United States
- Department of Biomedical Engineering, Boston University, United States
Figures
Figure 1 with 1 supplement
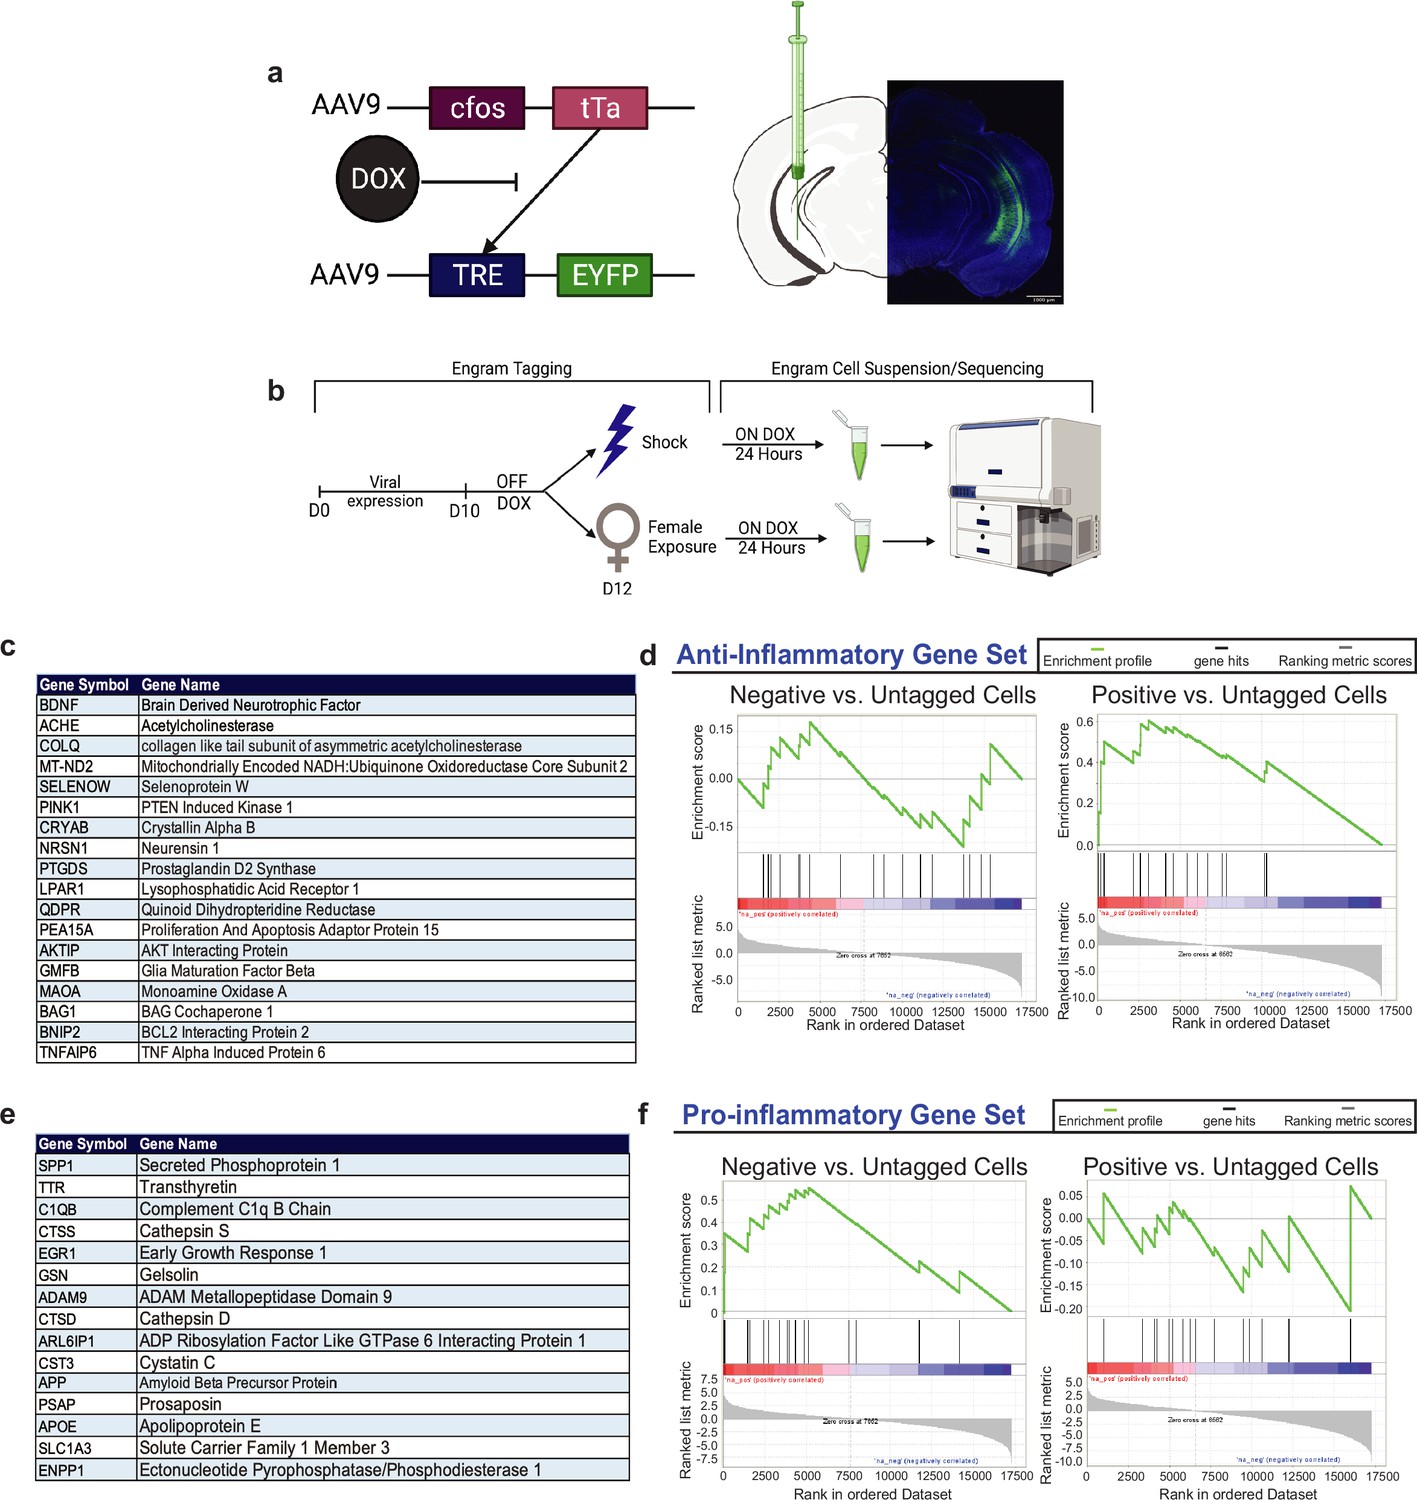
Gene Set Enrichment Analysis (GSEA) of RNA-sequencing data of positive and negative ventral hippocampus (vHPC) engram upregulate genes associated with neuroprotective and neurodegeneration, respectively.
(a) C57BL/6J mice were bilaterally injected with a 1:1 viral cocktail of AAV9-c-Fos-tTA and AAV9-TRE-eYFP into the vHPC. This activity-dependent labeling strategy captures sufficiently active neurons expressing the immediate-early gene, cfos. This system couples the cfos promoter to the expression of the tetracycline transactivator (tTA), which binds to the tetracycline response element (TRE) in its protein form. When doxycycline (DOX) is present, such as in the animal’s diet, this inhibits the binding of tTA to TRE, preventing eYFP labeling of active cells. (b) Experimental schematic used to label, isolate, and analyze the two groups of vHPC cells labeled by eYFP upon shock (negative) or male-to-female interaction (positive). Prior to surgery, mice were placed on a Dox diet to inhibit the labeling of active neurons. On day 0, mice were injected with the activity-dependent viral strategy to enable labeling of active neurons during a salient experience. On day 10 after viral expression and recovery, the mice were taken off of Dox prior to engram tagging to open the labeling window. On day 11, mice were subjected to contextual fear conditioning (CFC) or male-to-female interaction to label negative or positive neurons, respectively. Mice were placed immediately back on Dox to close this tagging window. Then, 24 hr later, mice were sacrificed and brains were obtained for sequencing experiments. (c) List of gene abbreviations and full names used for the GSEA of anti-inflammatory genes. (d) GSEA with the enrichment score for negative vs. untagged cells and positive vs. untagged cells using the anti-inflammatory gene set. (e) List of gene abbreviations and names used for the GSEA of pro-inflammatory genes. (f) GSEA with the enrichment score of negative vs. untagged cells and positive vs. untagged cells using the pro-inflammatory gene set.
Figure 1—figure supplement 1
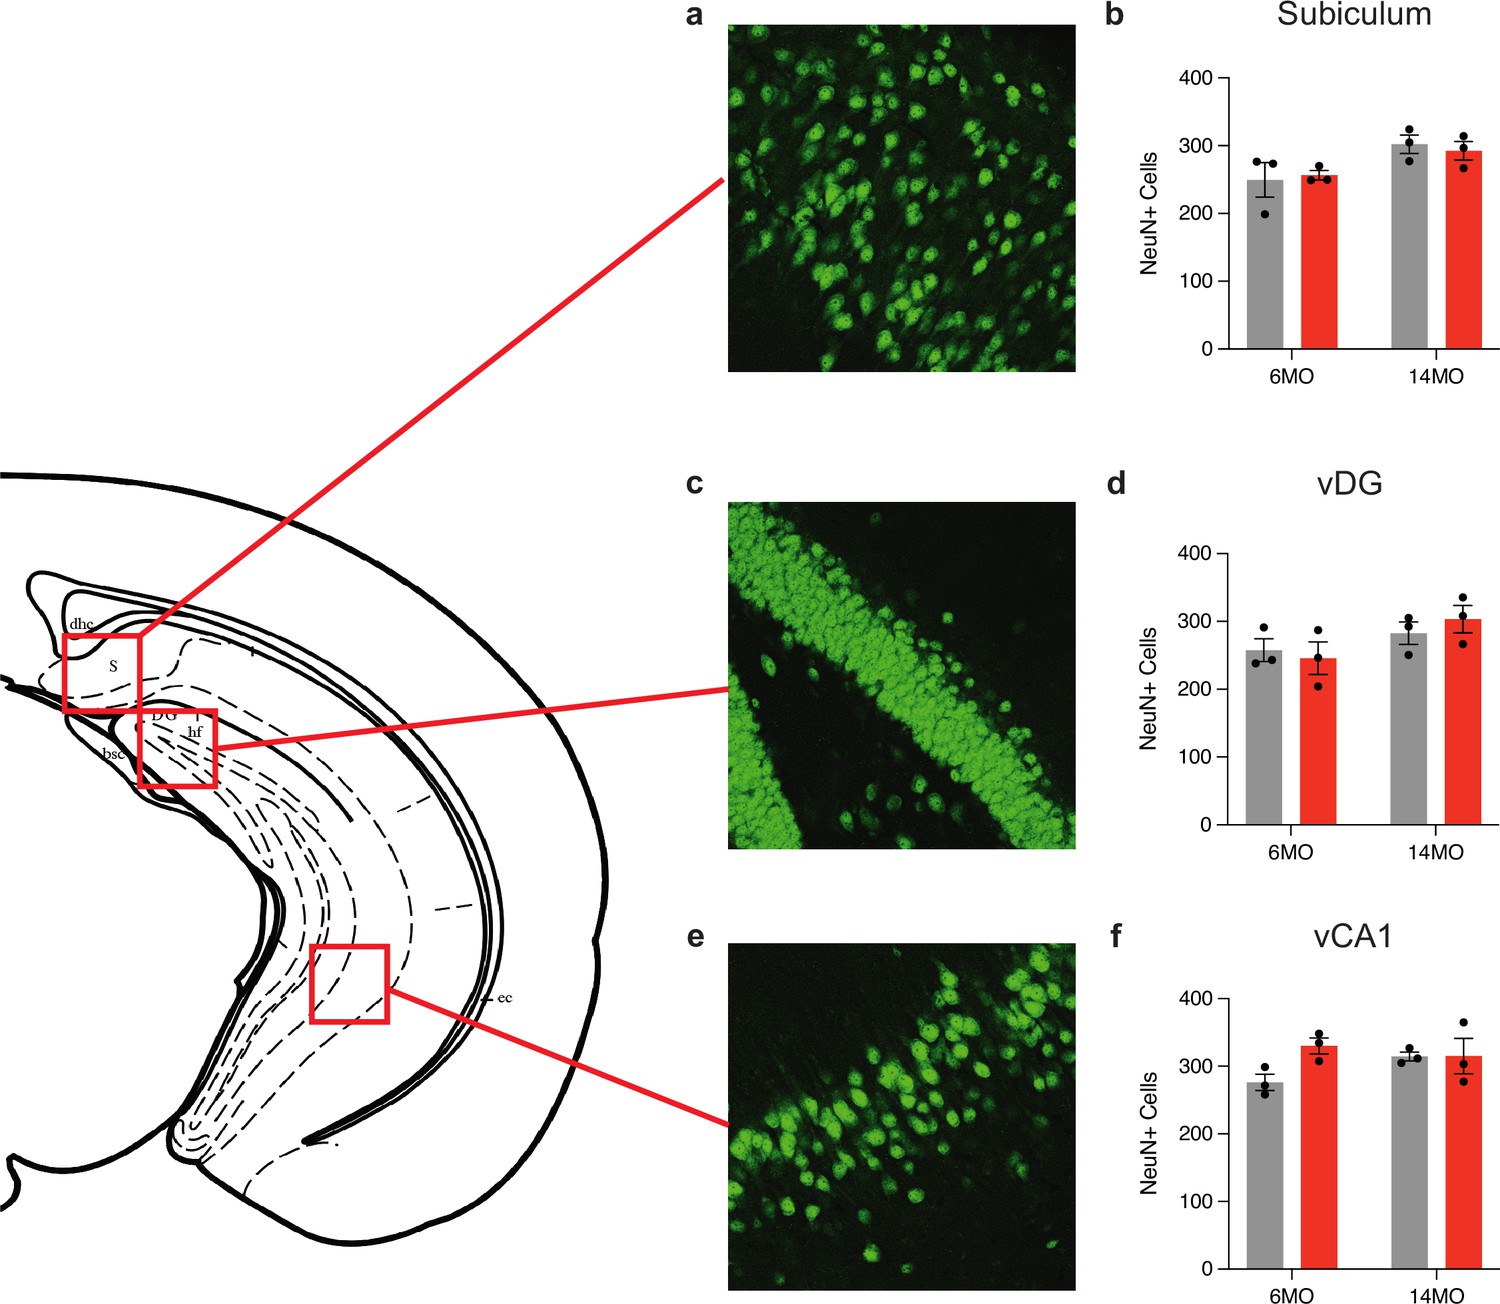
Chronic stimulation of the negative engram does not induce neuronal death.
Representative images and quantification of NeuN+ cells in the (a, b) subiculum, (c, d) vDG, and (e, f) vCA1 of all groups (6-month mCherry and hM3Dq and 14-month mCherry and hM3Dq). Values are given as a mean + SEM. Statistical analysis was performed with two-way ANOVA followed by Tukey’s post hoc test. For cell counts, n = 3 mice/group × 18 single-tile ROIs each brain region (NeuN). No label = not significant, **p>0.001, ***p>0.0001, ****p>0.00001.
Figure 2
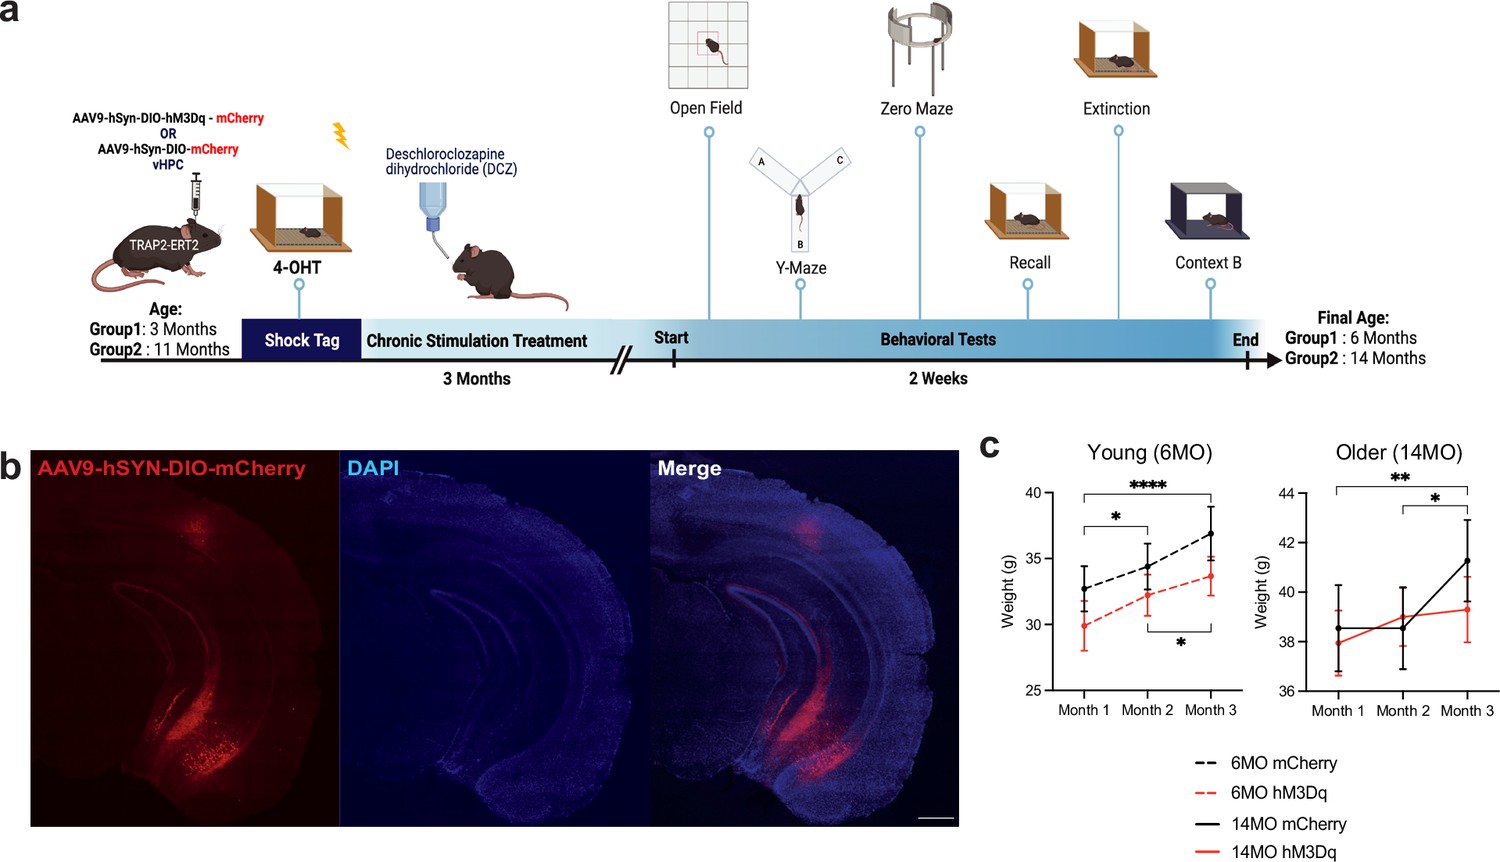
Experimental timeline for chronic modulation of a negative engram in TRAP2 mice.
(a) Schematic representation of tagging a negative engram in young (3 months) and old (11 months) TRAP2 mice followed by 3 months of chronic engram stimulation and a battery of behavioral tests. AAV9-hSyn-DIO-hM3Dq-mCherry or AVV9-hSyn-DIO-mCherry control vector was bilaterally injected into the ventral hippocampus (vHPC) of young and old mice. After viral expression and surgical recovery, all mice were subjected to contextual fear conditioning (CFC) in context A and subsequent 4-hydroxytamoxifen (4-OHT) intraperitoneal (IP) injection to induce negative engram tagging. For the next 3 months, mice received the water-soluble Designer Receptors Exclusively Activated by Designer Drugs (DREADDs) agonist deschloroclozapine dihydrochloride (DCZ) in their home cage water. After 3 months of stimulation wherein the young and old groups reached 6 months and 14 months of age, the mice underwent open field, y-maze, zero maze, remote recall, extinction, and generalization in a novel context B. (b) Representative image of hSyn-DIO-hM3Dq-mCherry expression in the vHPC (red) and DAPI+ cells (blue) after 3 months of hM3Dq activation. (c) Weights of all groups were recorded over the 3-month stimulation protocol, once per month. (Left) Young 6-month-old and (right) older 14-month-old mice. Values are given as a mean + SEM. Statistical analysis was performed with two-way (RM) ANOVA followed by Sidak’s post hoc test. n = 9–17 per group after outlier removal. p≤0.05, **p≤0.01, ***p≤0.001, ****p≤0.0001, no label = not significant.
Figure 3
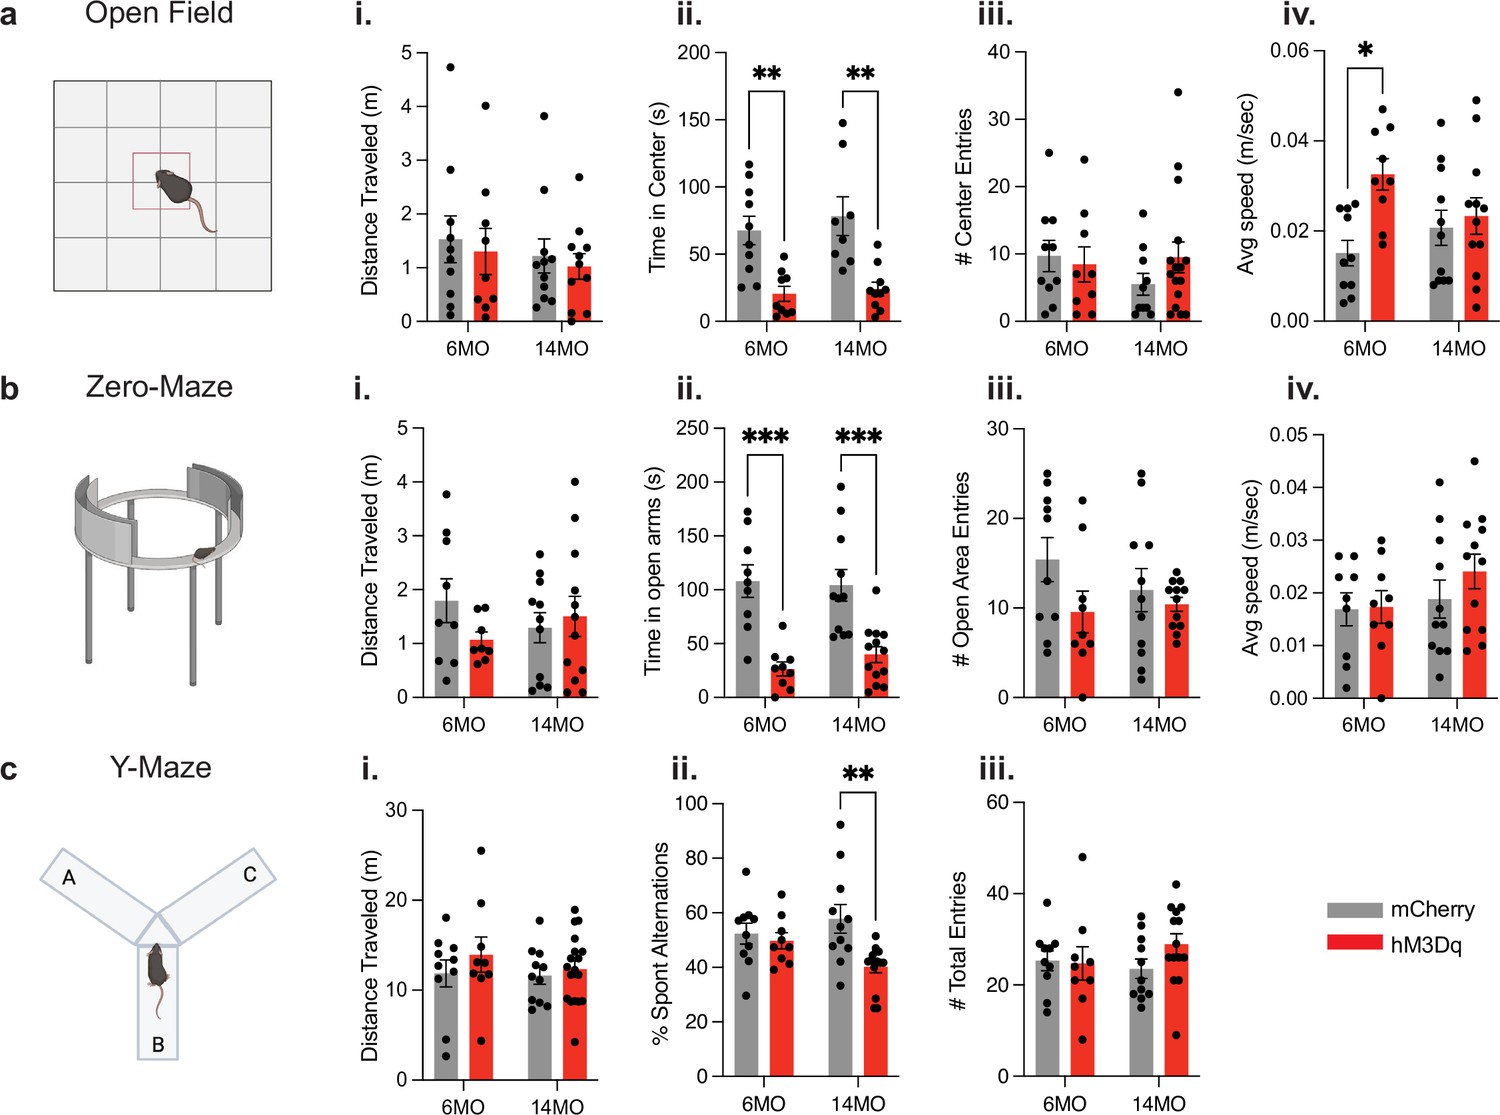
Chronic activation of an aversive engram induces behavioral changes in anxiety and working memory.
(a) Schematic of open-field test; (i) total distance traveled, (ii) total time spent in center, (iii) number of entries into the center, and (iv) average speed in 6-month mCherry and hM3Dq and 14-month mCherry and hM3Dq after 3 months of stimulation. (b) Schematic of zero-maze test; (i) total distance traveled, (ii) total time spent in open arms, (iii) number of entries into the open area, and (iv) average speed. (c) Schematic of y-maze test; (i) total distance traveled, (ii) percentage of spontaneous alterations, and (iii) total number of entries into arms. Statistical measure used a two-way ANOVA with time point and group as factors. Tukey’s post hoc tests were performed. Error bars indicate SEM. p≤0.05, **p≤0.01, ***p≤0.001, ****p≤0.0001, ns = not significant. n = 8–11 per group after outlier removal.
Figure 4
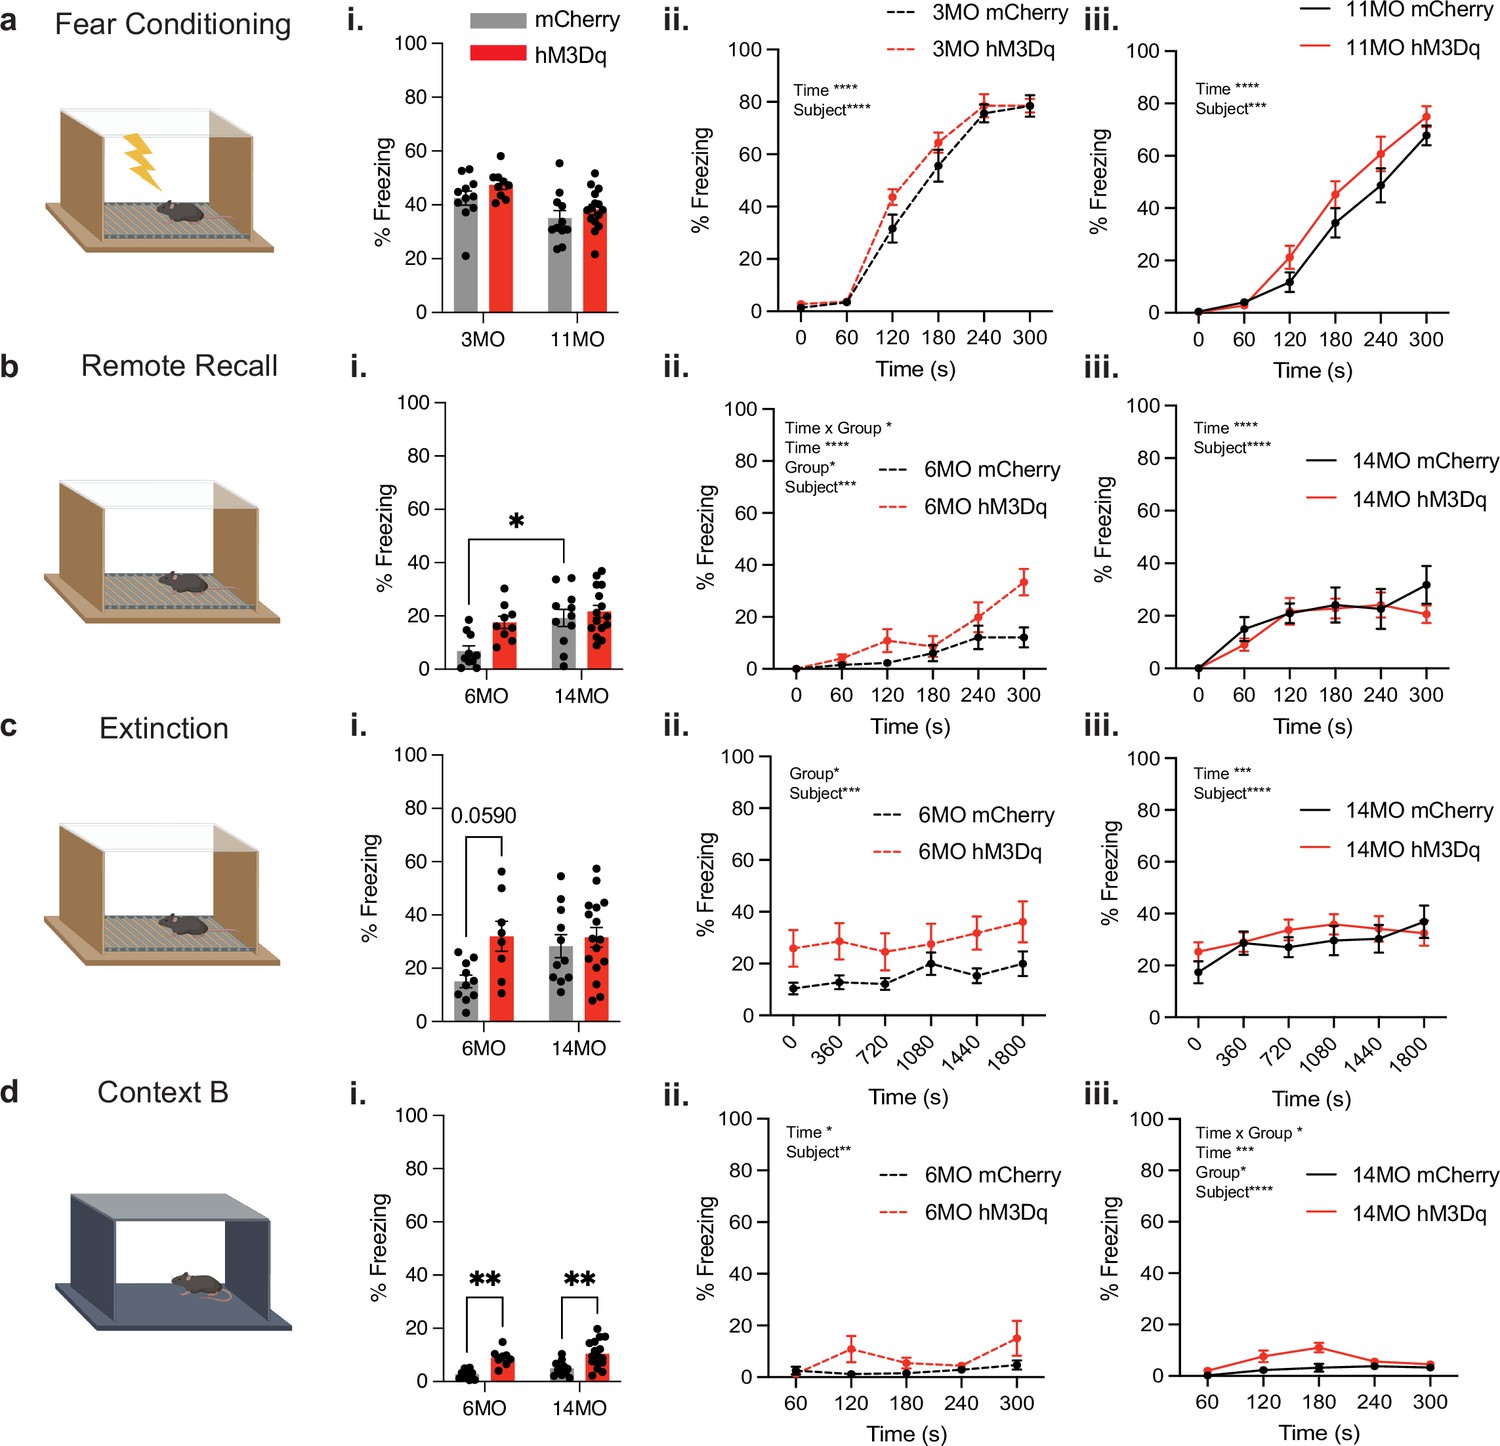
Chronic activation of the negative engram induces behavioral changes in fear memory.
(a) Schematic of contextual fear conditioning (CFC) in context A wherein 3- and 11-month-old mice received four, 1.5 mA, 2 s foot shocks. Following the CFC session, the negative engram was tagged in all mice by intraperitoneal (IP) injection of 4-hydroxytamoxifen (4-OHT). (i) Average percent freezing levels and total percentage freezing across the 300 s CFC session for (ii) 3-month groups and (iii) 11-month groups (two-way ANOVA RM; [3 months] interaction: F(5,130) = 1.131, p=0.3473; time: F(5,130) = 115.6, p<0.0001; group: F(1,26) = 2.737, p=0.1101; subject: F(26,130) = 3.056, p<0.0001. [11 months] Interaction: F(5,90) = 1.218, p=0.3074; time: F(5,90) = 234.4, p<0.0001; group: F(1,18) = 1.862, p=0.1892; subject: F(18,90) = 2.887, p=0.0005). (b) Schematic of remote recall performed after 3 months of negative engram stimulation. Mice were returned to context A for 5 min in the absence of foot shocks. (i) Average percent freezing levels and total percentage freezing across the 300 s remote recall session for (ii) 6-month groups and (iii) 14-month groups two-way ANOVA RM; [6 months] interaction: F(5,85) = 15.72, p=0.0115; time: F(5,85) = 15.72, p<0.001; group: F(1,17) = 6.588, p=0.0200; subject: F(17,85) = 2.458, p=0.0035. [14 months] Interaction: F(5,130) = 0.9027, p=0.4815; time: F(5,130) = 14.18, p<0.0001; group: F(1,26) = 0.3967, p=0.5343; subject: F(26,130) = 4.107, p<0.0001. (c) Schematic of extinction wherein mice were placed in context A for 30 min in the absence of foot shocks. (i) Average percent freezing levels and total percentage freezing across the 1800s extinction session for (ii) 6-month groups and (iii) 14-month groups (two-way ANOVA RM; [6 months] interaction: F(5,85) = 0.4133, p=0.8383; time: F(5,85) = 1.979, p=0.0899; group: F(1,17) = 5.494, p=0.0315; subject: F(17,85) = 7.352, p<0.0001. [14 months] interaction: F(5,130) = 1,362, p=0.2570; time: F(5,130) = 5.387, p=0.0002; group: F(1,26) = 0.3836, p=0.5411; subject: F(26, 130)=11.16, p<0.0001). (d) Schematic of the novel context B used to assess generalization. (i) Average percent freezing levels and total percentage freezing across the 300 s generalization session for (ii) 6-month groups and (iii) 14-month groups (two-way ANOVA RM; [6 months] interaction: F(4,72) = 2.257, p=0.0713; time: F(4,72) = 3.373, p=0.0138; group: F(1,18) = 4.151, p=0.0566; subject: F(18,72) = 2.537, p=0.0028. [14 months] interaction: F(4,100) = 2.575, p=0.0421; time: F(4,100) = 5.717, p=0.0003; group: F(1,25) = 6.343, p=0.0186; subject: F(25,100) = 3.175, p<0.0001). Statistical analysis utilized a two-way ANOVA with time point and group as factors and two-way repeated measures (RM) ANOVA with time (seconds) and group as factors across 6- and 14-month-old mice. Tukey’s or Sidak’s post hoc tests were performed where applicable. Error bars indicate SEM. p≤0.05, **p≤0.01, ***p≤0.001, ****p≤0.0001, ns = not significant. n = 8–11 per group after outlier removal.
Figure 5 with 1 supplement
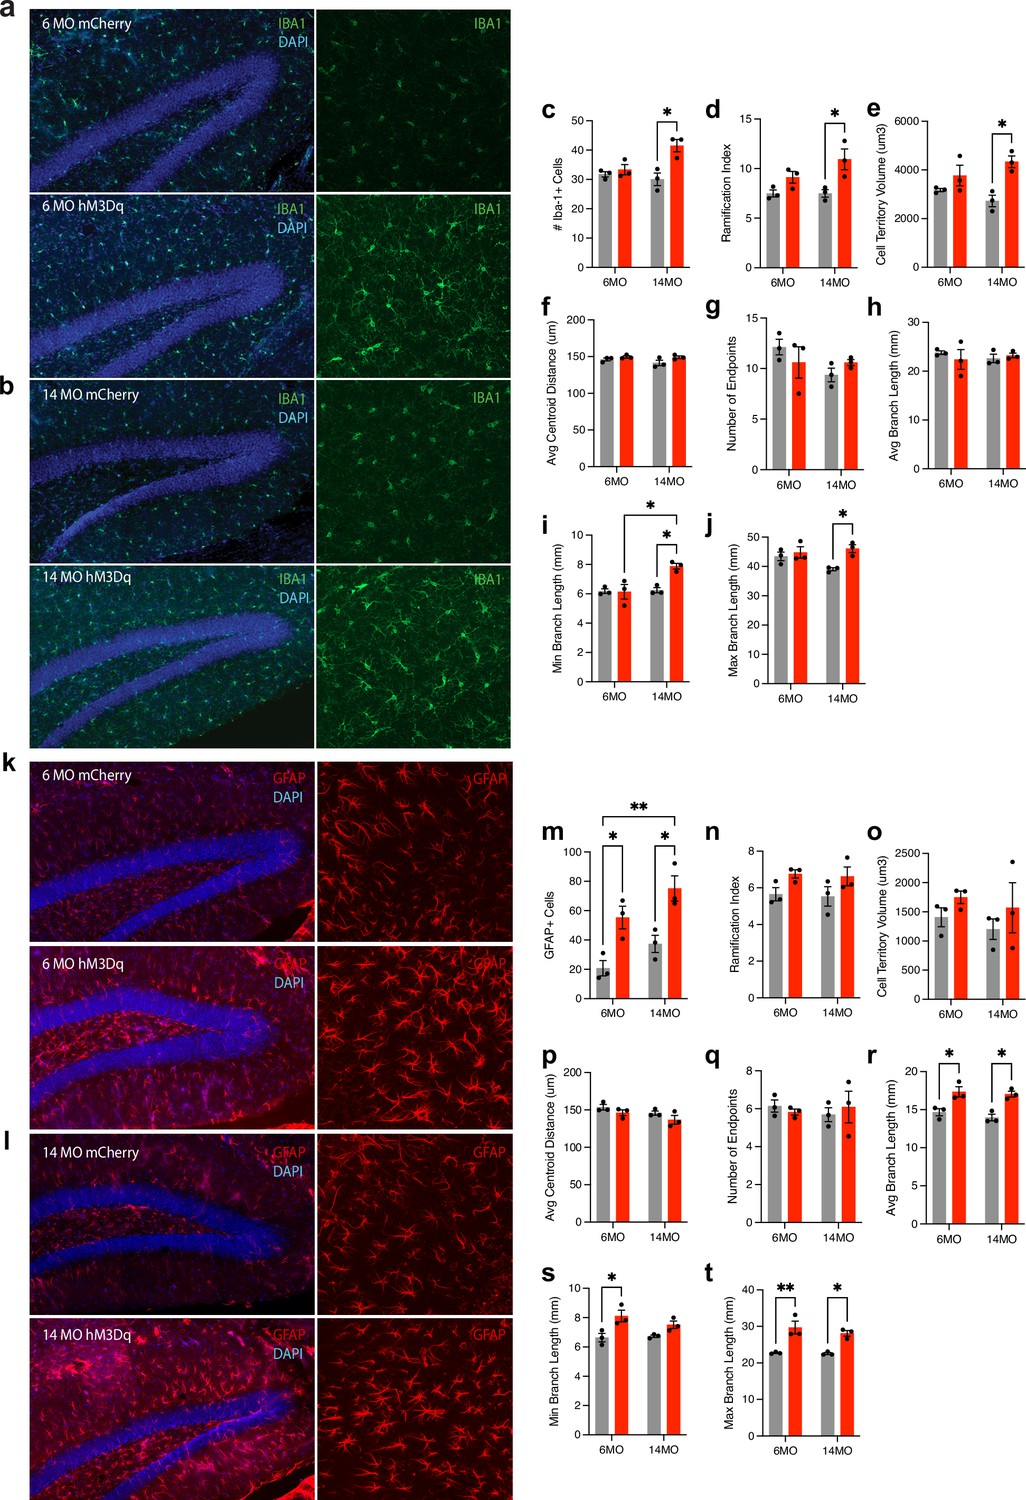
Chronic modulation of the negative engram induces changes in the number and morphology of microglia and astrocytes.
(a, b) Representative images of Iba1+ microglia (green) in the hippocampus of (a) 6-month mCherry and hM3Dq mice and (b) 14-month mCherry and hM3Dq mice following 3 months of stimulation. (c) Number of Iba1+ cells. (d–j) Quantified morphological analysis of Iba1+ cells; (d) ramification index, (e) cell territory volume, (f) average centroid distance, (g) number of endpoints, (h) average branch length, (i) minimum branch length, and (j) maximum branch length. (k, l) Representative images of GFAP+ astrocytes (red) in the hippocampus of (k) 6-month mCherry and hM3Dq mice and (l) 14-month mCherry and hM3Dq mice following 3 months of stimulation. (m) Number of GFAP+ cells. (n–t) Quantified morphological analysis of GFAP+ cells; (n) ramification index, (o) cell territory volume, (p) average centroid distance, (q) number of endpoints, (r) average branch length, (s) minimum branch length, and (t) maximum branch length. Statistical analysis used a two-way ANOVA with time point and group as factors. Tukey’s post hoc tests were performed. Error bars indicate SEM. p≤0.05, **p≤0.01, ***p≤0.001, ****p≤0.0001, ns = not significant. For cell counts, n = 3 mice/group × 18 single-tile ROIs each (GFAP, Iba1). For morphology, n = 3 mice/group × 3 single-tile ROIs each (GFAP, Iba1), each containing 20–30 glial cells.
Figure 5—figure supplement 1
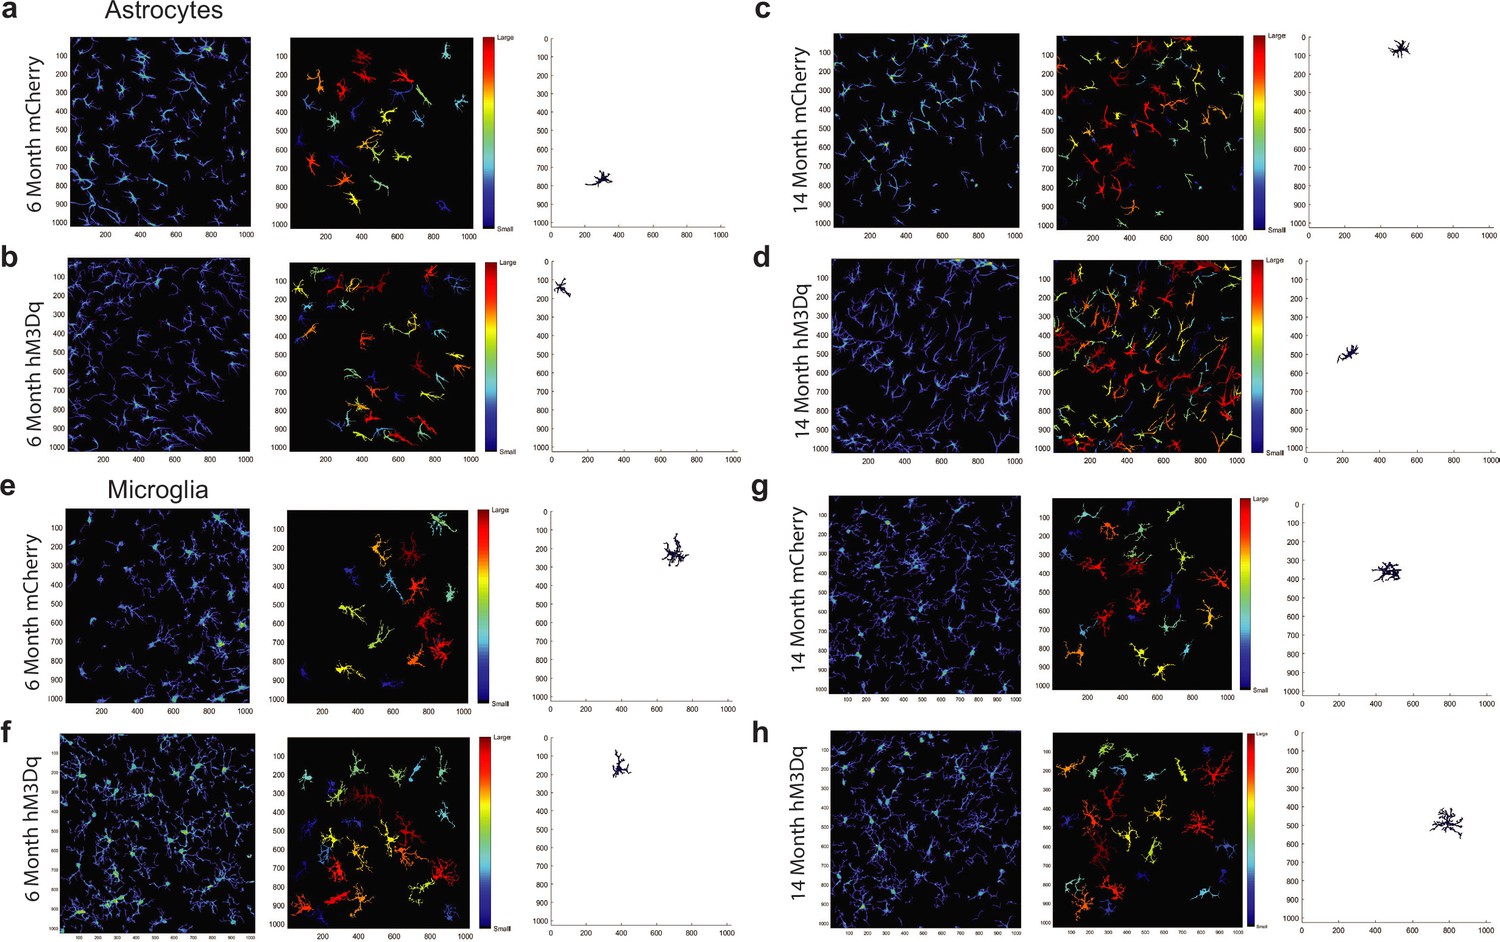
Analysis of astrocyte and microglial morphology using the MATLAB-based tool 3DMorph.
(a–d) Representative 3DMorph images of GFAP+ astrocytes in (a) 6-month mCherry, (b) 6-month hM3Dq, (c) 14-month mCherry, and (d) 14-month hM3Dq mice. (e–h) Representative 3DMorph images of Iba1+ microglia in (e) 6-month mCherry, (f) 6-month hM3Dq, (g) 14-month mCherry, and (h) 14-month hM3Dq mice.
Additional files
Download links
A two-part list of links to download the article, or parts of the article, in various formats.
Downloads (link to download the article as PDF)
Open citations (links to open the citations from this article in various online reference manager services)
Cite this article (links to download the citations from this article in formats compatible with various reference manager tools)
Chronic activation of a negative engram induces behavioral and cellular abnormalities
eLife 13:RP96281.
https://doi.org/10.7554/eLife.96281.3


