Probing PAC1 receptor activation across species with an engineered sensor
- Institute of Pharmacology and Toxicology, University of Zürich, Switzerland
- Medical University of Vienna, Center for Brain Research, Department for Neuronal Cell Biology, Austria
- Department of Molecular Neuroscience & Department of Molecular Cell Biology, Weizmann Institute of Science, Israel
- Department of Cell Physiology and Metabolism, University of Geneva, Switzerland
- Department of Chemistry, University of Zürich, Switzerland
- Neuroscience Center Zurich, University and ETH Zürich, Switzerland
Figures
Figure 1 with 2 supplements
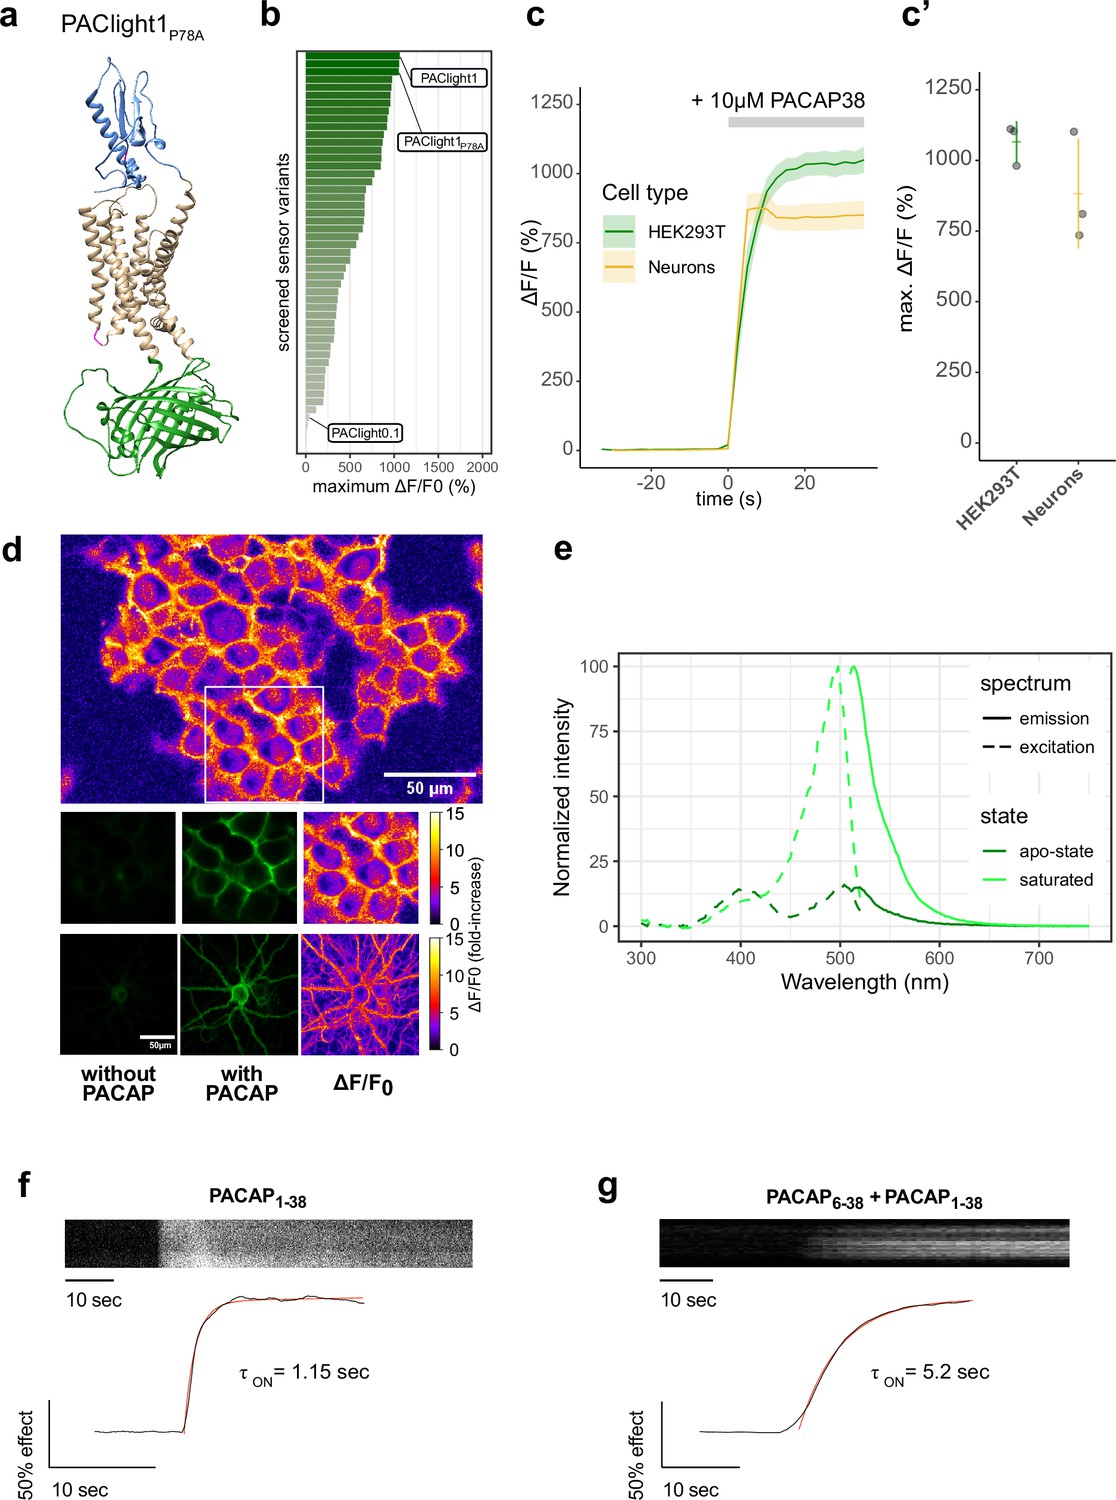
Design and in vitro optical properties of PAClight1P78A.
(a) Protein structure of PAClight1P78A as predicted by AlphaFold2 (Jumper et al., 2021). The transmembrane and intracellular domain of the PAC1Rnull backbone is depicted in beige. The extracellular domain, which is crucial for ligand specificity and affinity, is colored in blue. The circularly permuted green fluorescent protein (cpGFP) module replacing the third intracellular loop is colored in green. Point-mutations inserted in the second intracellular loop as well as on the extracellular domain are depicted in magenta. (b) Bar chart depicting the maximum dynamic range obtained for all tested mutants with acceptable expression on the plasma membrane. Bars are ordered by dynamic range and color coded by the average of the maximum dynamic range recorded. The bars representing the prototype variant PAClight_V0.1, PAClight1P78A, and PAClight1 are indicated. (c) Line plots depicting the maximum activation (mean ± standard error of the mean [SEM]) of PAClight1P78A expressed in HEK293T cells and rat primary neurons. Upon bath application of 10 μM PACAP1-38, PAClight1P78A reaches a mean ΔF/F0 of 1066% in HEK293T cells (n = 3, five regions of interest [ROIs]) and a mean ΔF/F0 of 883% in rat primary neurons (n = 3, five ROIs). (c’) Scatter plot representation of the maximum ΔF/F0 of the individual replicates shown in c. Confocal image acquisition was performed at a frame rate of 1 frame/2.53 s (~0.4 Hz). (d) Representative examples of the expression of PAClight1P78A in HEK293T cells (low magnification overview and middle row of images) and rat primary neurons (bottom row) with pixel-wise quantification and depiction of the dynamic range in ΔF/F0 upon bath application of 10 μM PACAP1-38. Top: Overview micrograph of HEK293T cells color coded in pixel-wise ΔF/F0. The white square represents the ROI represented below in the middle row of images. Middle: Selected ROI before (left) and after (middle and right) peptide application. Bottom: Rat primary neuron-expressing PAClight1P78A before (left) and after (middle and right) peptide application. The color bars represent the look-up table used for visualization of the pixel-wise ΔF/F0. (e) One-photon excitation (dashed lines) and emission (solid lines) spectra of PAClight1P78A in the absence (apo-state, dark green) and the presence (saturated state, light green) of 10 μM PACAP1-38. The excitation maximum of the saturated state is at 498 nm. The isosbestic point is at 420 nm. Emission maximum in of the saturated state is at 514 nm. n = 4 (2 replicates each measured on 2 independent days). (f) Activation kinetics of PAClight1P78A upon application of PACAP1-38 (10 μM) measured via time-lapse imaging. A representative kymograph of sensor fluorescence on the surface of a HEK293 cell is shown on top. The normalized fluorescence response trace is shown at bottom along with the calculated one-phase association curve fit and activation time constant. The trace shown is the average of three independent experiments. (g) Same as (f) but in the presence of PACAP6-38 (10 μM) in the bath.
-
Figure 1—source data 1
Source data for graphs and bar plots in Figure 1.
- https://cdn.elifesciences.org/articles/96496/elife-96496-fig1-data1-v1.xlsx
Figure 1—figure supplement 1
Optimizing the fluorescent response of PAClight sensors.
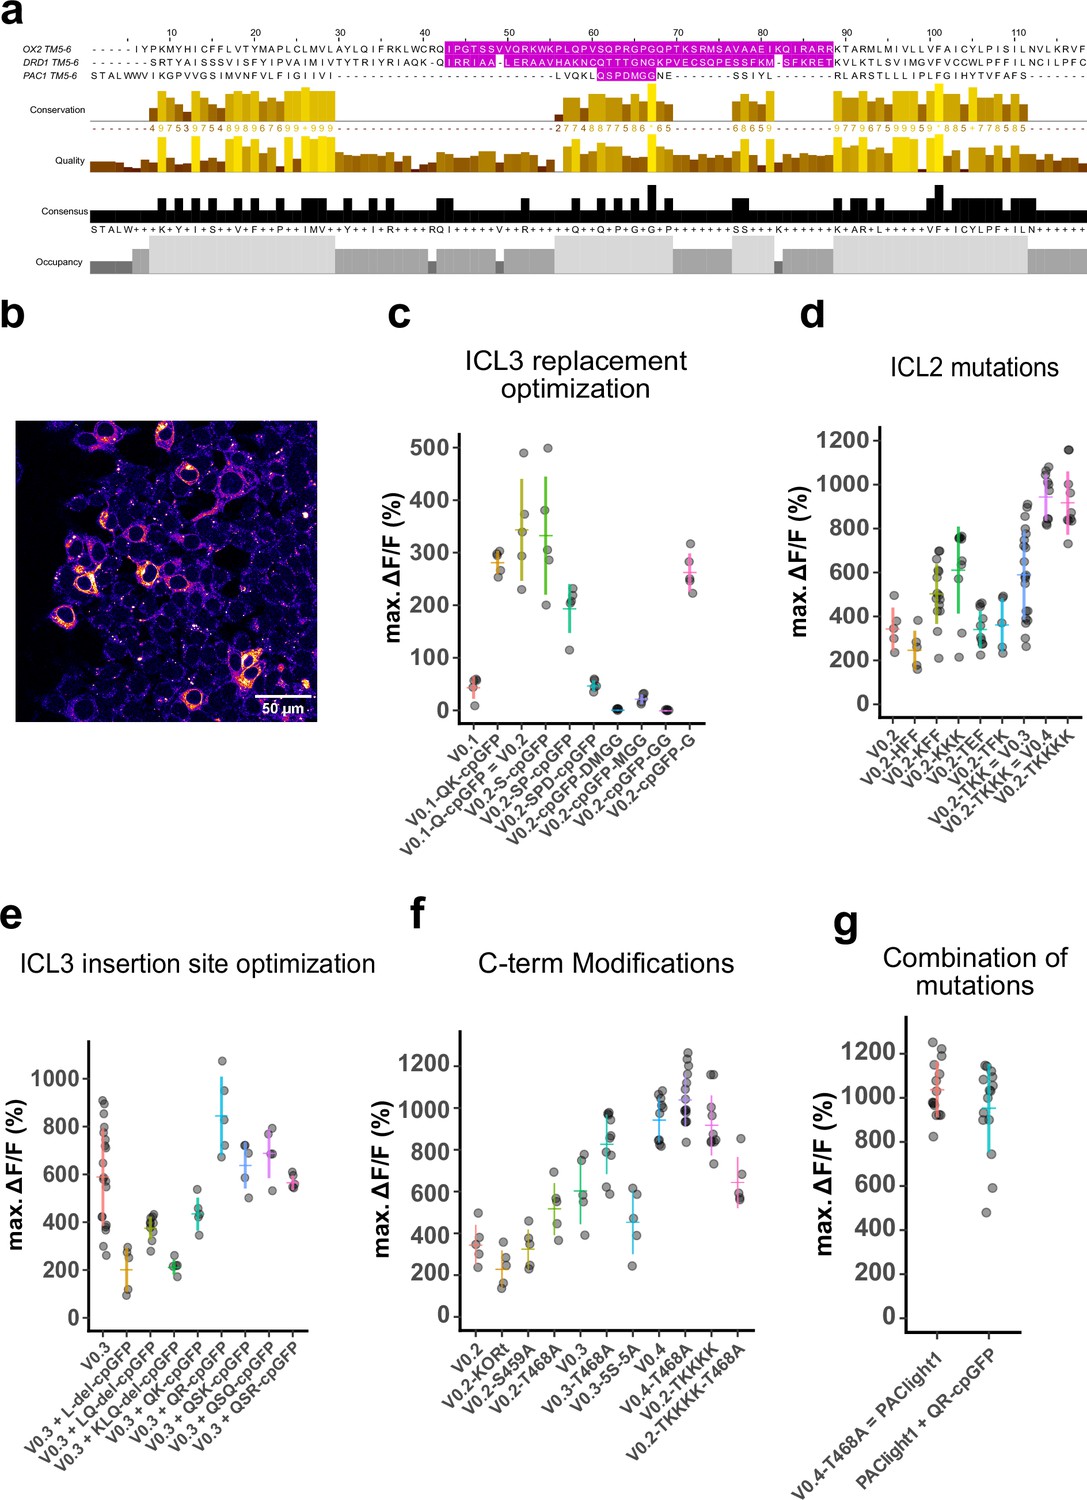
(a) Multiple amino acid sequence alignment of the TM5, ICL3, and TM6 domains of the human orexin 2 receptor (OX2), the human D1 dopamine receptor (DRD1), and of the human PAC1Rnull (PAC1). The sequences replaced by the circularly permuted green fluorescent protein (cpGFP) module in the OxLight1, dLight1.3b, and PAClight1P78A sensors are highlighted in magenta. The OX2 and DRD1 receptor sequences align well due to the fact that they both belong to the class-A G-protein-coupled receptors (GPCRs). The PAC1Rnull belongs to the class-B1 family of GPCRs and hence aligns less well to the OX2 and DRD1 backbones. We therefore guided the initial design and site of cpGFP module insertion by protein structure rather than by amino acid sequence. (b) Pseudo-colored confocal micrograph of HEK293T cells expressing the prototypical PAClight_V0.1. Plasma membrane expression can be detected, but a significant amount of sensor protein is retained intracellularly. (c) Scatterplot representing insertion site variants screened for maximum dynamic range. Reinsertion of the glutamine on the N-terminal side of the cpGFP module (PAClight_V0.2) drastically increased the dynamic range to 343% ΔF/F0 (compared to 43.4% ΔF/F0 in PAClight_V0.1). (d) Point mutations in the intracellular loop 3 (ICL3) further improved the dynamic range to 588% ΔF/F0 for PAClight_V0.3 (point mutations: F259K/F260K) and to 942% ΔF/F0 for PAClight_V0.4 (point mutations: F259K/F260K /P261K). (e) On the backbone of the improved second intracellular loop (ICL2) variant PAClight_V0.3 we screened again for the optimal insertion site of the cpGFP module. To this end we performed serial deletions as well as insertions of charged residues on the residues N-terminal to the cpGFP module. This small-scale screen identified a mutant with a glutamine and arginine insertion before the cpGFP module (PAClight_V0.3+QR-cpGFP) with improved dynamic range (ΔF/F0 = 844%) compared to the PAClight_V0.3 backbone. (f) To abolish β-arrestin recruitment and further improve membrane localization, we further screened C-terminus mutants. We included mutants in this screen in which we replaced the C-terminus with the tail of the kappa opioid receptor (KORt), as well as point mutants of known post-translational modification sites and serine residues. The point mutation of the T468 to alanine further improved plasma membrane localization (data not shown) and improved the dynamic range from 942% ΔF/F0 (in PAClight_V0.4) to 1037% ΔF/F0. The resulting construct was named PAClight1. (g) Since the insertion of QR in front of the cpGFP module had a positive effect on dynamic range on the backbone of PAClight_V0.3 (e), we also tested this insertion of QR on the PAClight1 backbone. However, the QR insertion did not yield improved dynamic range on the PAClight1 backbone (ΔF/F0 = 953%) and was hence rejected. Each datapoint represents the average of the maxΔF/F0 within one region of interest (ROI). In each replicate five ROIs each were quantified. N = 4 for V0.3. n = 3 for V0.2_KFF, PAClight1, and PAClight1+QR-cpGFP. n = 2 for V0.2_KKK, V0.2_TEF, V0.2_KKKK, V0.3_LQ-del-cpGFP, V0.3_T468A, and V0.4. For all other constructs n = 1 replicates each was screened. The y-axis position of the colored horizontal bars represents the mean across all replicates within a construct. The extent of the colored vertical bars represents ±1 standard deviation. For ease of comparability some constructs are potted on multiple plots.
Figure 1—figure supplement 2
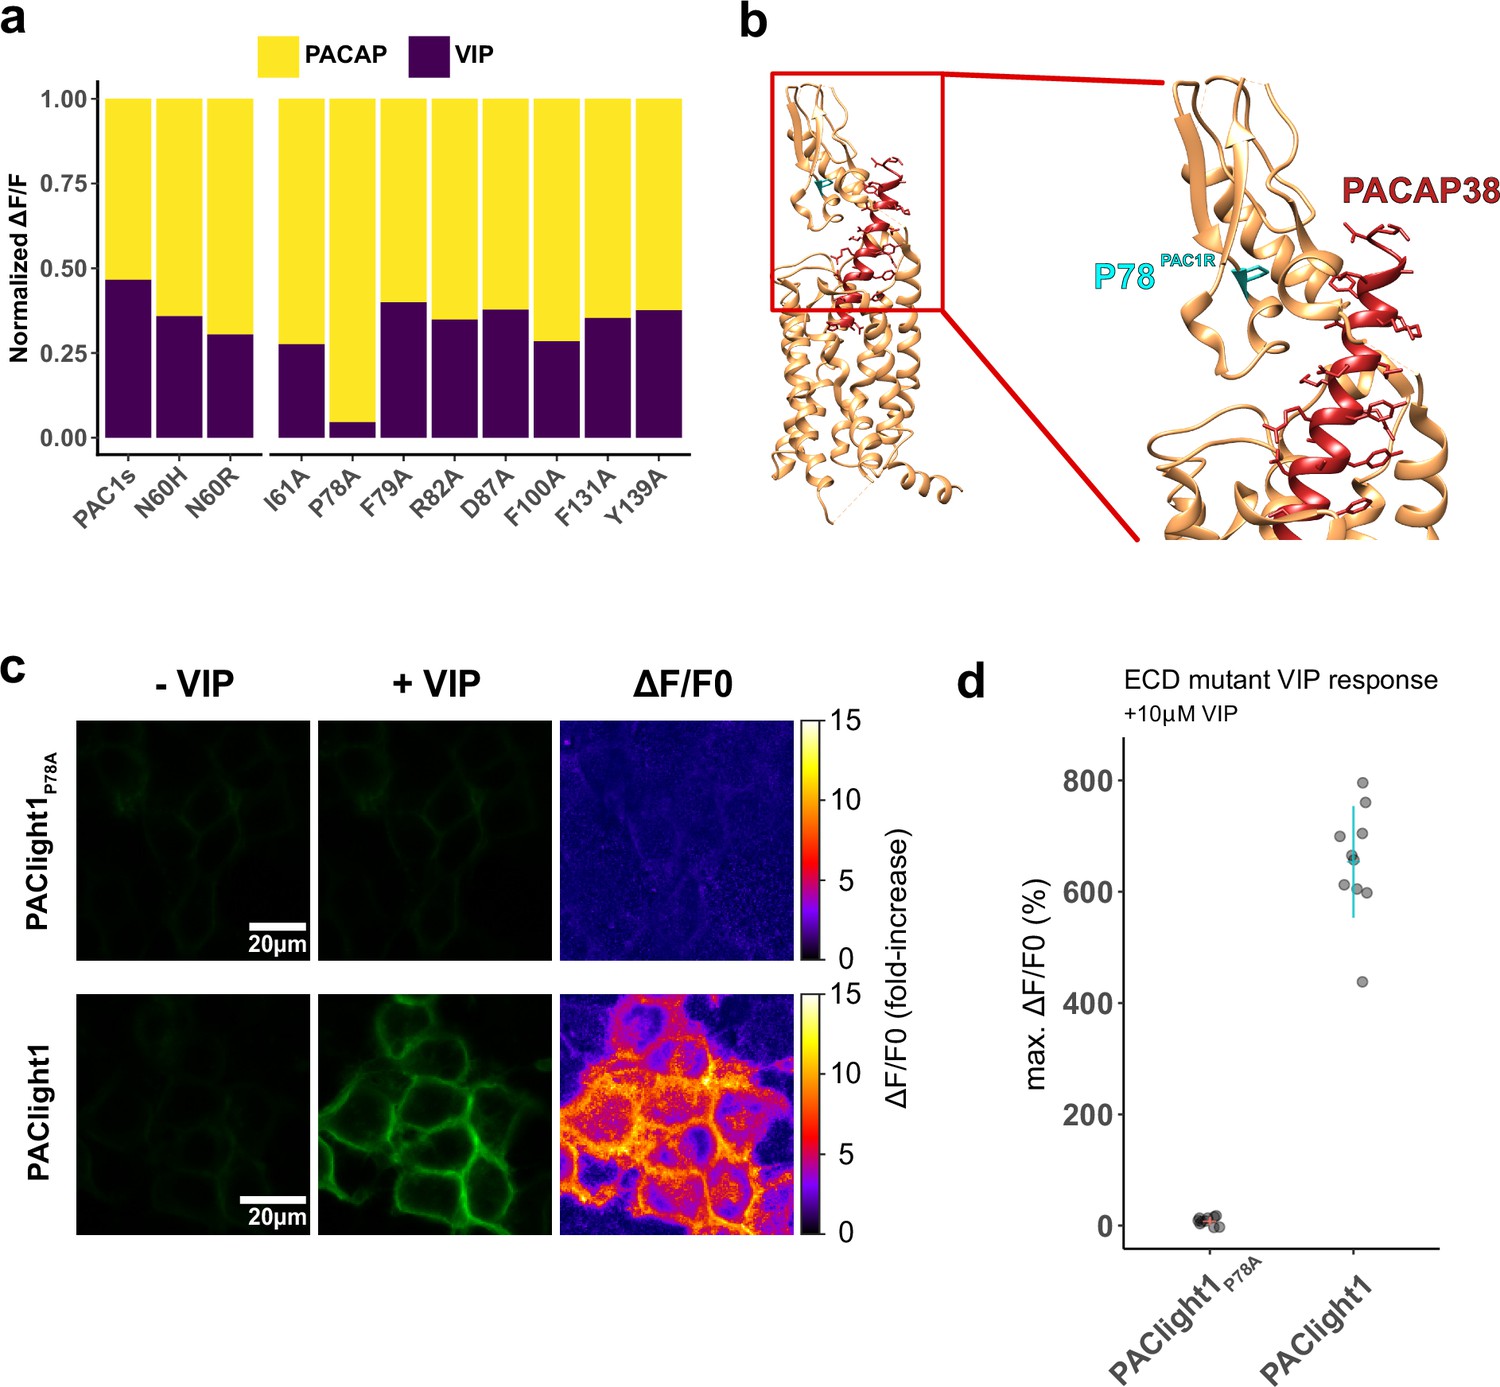
Engineering PACAP selectivity in PAClight1P78A.
(a) Stacked bar plot demonstrating the relative fluorescent response of extracellular ligand-binding domain (ECD) mutants toward 500 nM of vasoactive intestinal peptide (VIP) followed by 9.09 μM PACAP1-38. The mutant PAC1s contains the naturally occurring splice mutation (deletion) on the ECD. The N60H and N60R were inspired by the analysis of protein structure. The remaining alanine point mutants (right side of bar plot) were inspired by molecular dynamics (see main text). The P78A point mutation on the ECD resulted in excellent improvement of specificity. The highly PACAP-specific mutant was named PAClight1P78A. The data are normalized to the maximum response within each condition. n = 1 for each mutant. (b) Visualization of the ECD mutation P78A (cyan) on the backbone of a previously published cryo-EM structure of PAC1Rnull (beige) in interaction with PACAP1-38 (dark red) (PDB: 6LPB) (Kobayashi et al., 2020). (c) Representative confocal micrographs of HEK293T cells expressing the PACAP-specific PAClight1P78A and the VIP-responsive PAClight1 sensors before (left) and after (middle) 10 μM VIP bath application. Pixel-wise calculation of ΔF/F0 is shown on the right. Note the complete absence of a fluorescent response to VIP in the PAClight1P78A mutant. (d) Quantification of the averaged maximum dynamic range of PAClight1P78A (ΔF/F0 = 8.28%) vs. PAClight1 (ΔF/F0 = 654%) in response to 10 μM VIP.
Figure 2 with 2 supplements
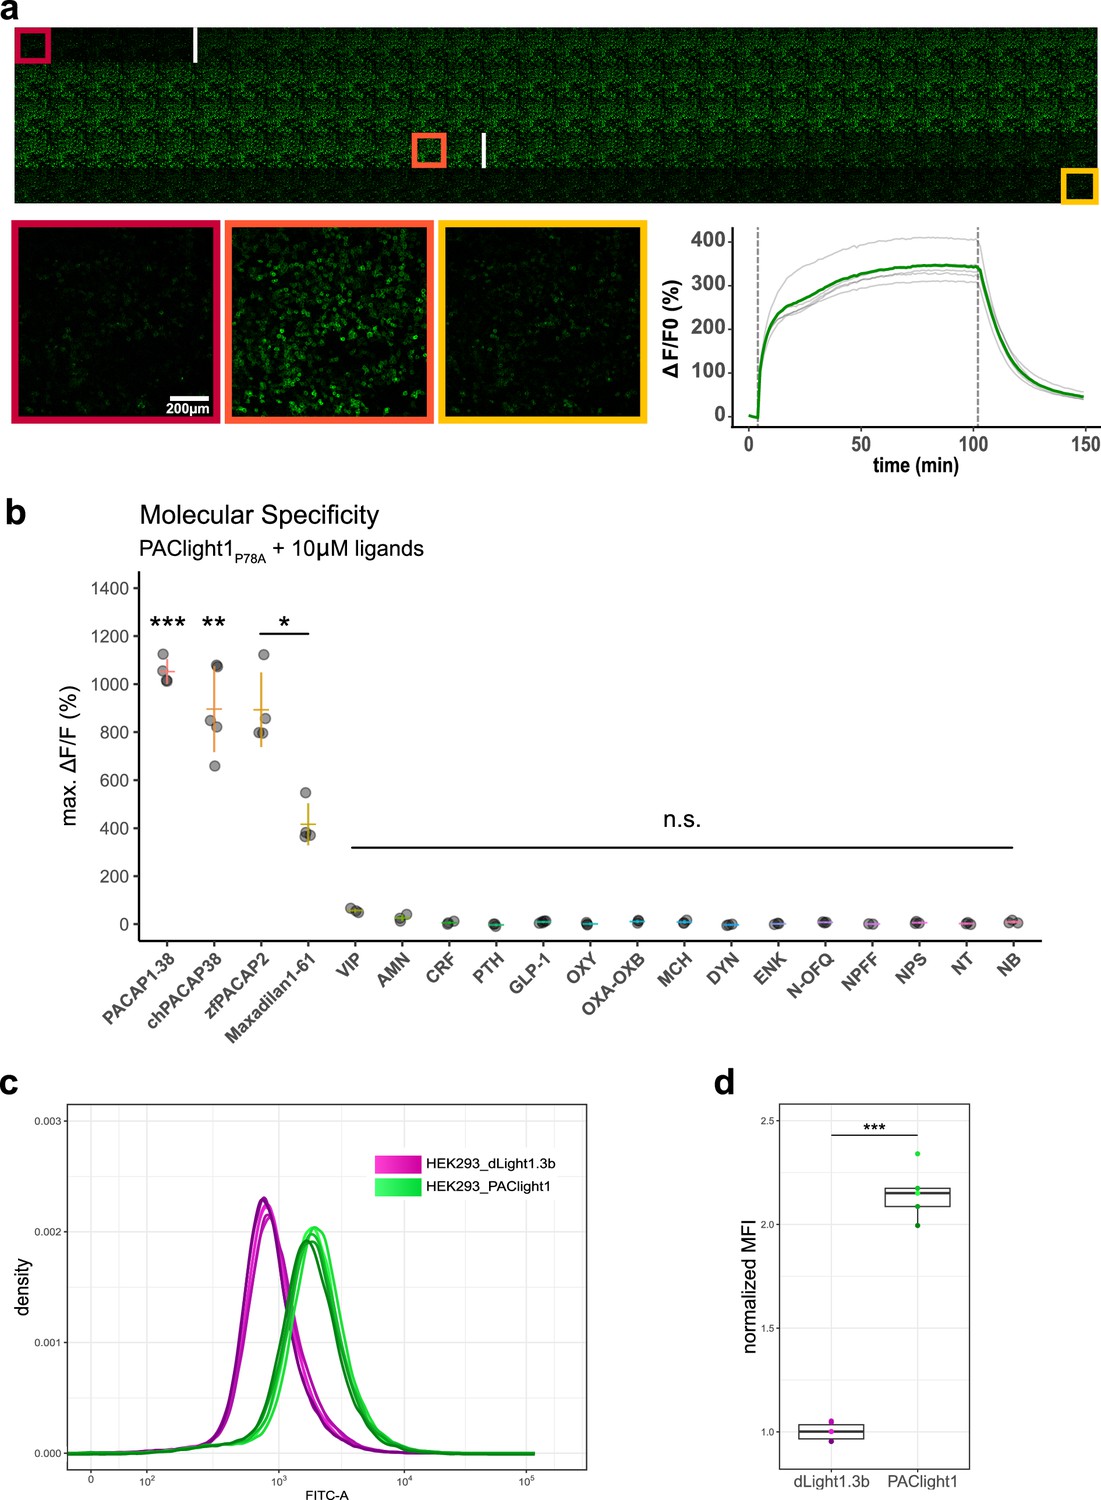
Pharmacological characterization of PAClight1P78A.
(a) PAClight1P78A fluorescent response to 200 nM PACAP1-38 bath application over extended periods at room temperature. No internalization of the sensor expressed on the plasma membrane is observed throughout the full time course of >90 min. The fluorescent response of PAClight1P78A to PACAP1-38 can be reversed with competitive binding of the peptidergic PAC1R antagonist Max.d.4 (a Maxadilan derivative). Please note that the seemingly slow activation rate of PAClight1P78A in this experiment is due to the experimental setup (see Methods section) and slow diffusion of PACAP1-38 throughout the well. Top: Downscaled gallery view of the acquired time series (total of 150 frames; 1 frame/min) from top-left to bottom-right. Application time points of PACAP1-38 (after frame Nr. 5) and Max.d.4 (after frame Nr. 103) are depicted as white vertical lines between the frames. The red, orange, and yellow rectangles indicate the frames used for representative higher magnification inserts shown below (bottom left). Bottom right: Line plot depicting the time course of the PAClight1P78A response across five rectangular regions of interest (ROIs) distributed across the whole field of view. (b) PAClight1P78A is highly specific to PACAP and does not respond to vasoactive intestinal peptide (VIP). PAClight1P78A can be activated by PACAP homologs found in the chicken (gallus gallus, chPACAP38) as well as in the zebrafish (Danio rerio, zfPACAP2). PAClight1P78A is further partially activated by the PAC1R-specific ligand Maxadilan1-61, which is expressed endogenously in the sand fly (Lutzomyia longipalpis) salivary gland. None of the other tested class-A and -B1 G-protein-coupled receptor (GPCR) ligands was found to activate PAClight1P78A. Abbreviations: AMN: amnesiac, CRF: corticotropin-releasing factor, PTH: parathyroid hormone, GLP-1: glucagon-like peptide, OXY: oxytocin, OXA–OXB: orexin-A and -B, MCH: melanin-concentrating hormone, DYN: dynorphin, ENK: enkephalin, N-OFQ: nociception, NPFF: neuropeptide FF, NPS: neuropeptide S, NT: neurotensin, NB: neuromedin B. Single datapoints represent one replicate average obtained from five ROIs per replicate. The extent of the colored vertical bar represents 1 standard deviation. The y-axis location of the colored horizontal bar indicates the average across all replicates. Number of replicates per ligand: n = 5 for chPACAP38 and GLP-1; n = 4 for PACAP1-38, zfPACAP2, and Maxadilan1-61; n = 3 for VIP, AMN, CRF, PTH, OXY, OXA–OXB, MCH, DYN, ENK, N-OFQ, NPS, NT, and NB; n = 2 for NPFF. Asterisks represent statistical significance of Hochberg-corrected p values of multiple one-sample t tests. (c) PAClight1 has significantly brighter baseline fluorescence than the dopamine sensor dLight1.3b. The peak of the dLight1.3b FITC-A density curve coincides with the start of the uphill slope of the PAClight1 FITC-A density curve. Note the bi-exponential scaling of the x-axis. n = 6 for dLight1.3b, n = 5 for PAClight1. (d) Quantification of the average of the median fluorescence intensity (MFI) across all replicates and normalization to the group MFI of dLight1.3b show a 2.15-fold increased basal brightness of PAClight1 over dLight1.3b (t(4.74) = −19.254, p < 0.0001, 95% CI [−1.30,−0.99], two-sided two-sample Welch’s t test).
-
Figure 2—source data 1
Source data for graphs and bar plots in Figure 2.
- https://cdn.elifesciences.org/articles/96496/elife-96496-fig2-data1-v1.xlsx
Figure 2—figure supplement 1
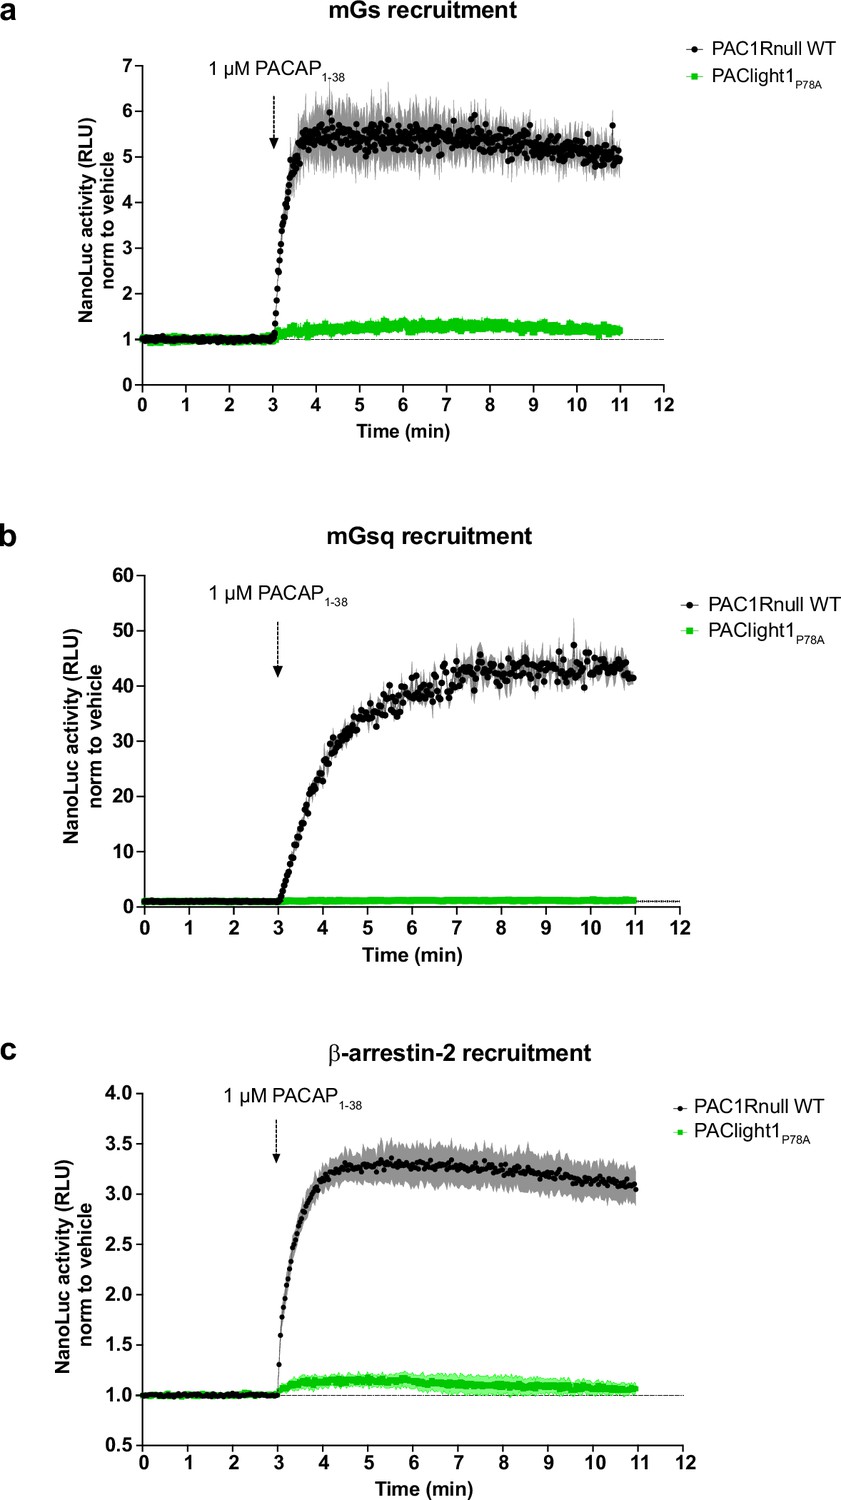
Characterization of PAClight1P78A coupling to transducer proteins NanoLuc complementation assays were employed to measure the ability of human SmBiT-PAC1R or SmBiT-PAClight1P78A to recruit LgBiT-miniGs (a), -miniGsq (b), or -β-arrestin2 (c) in an agonist-induced manner.
Luminescence emission (relative luminescence units, RLU) was monitored during application of agonist (PACAP1-38) and was normalized to control cells with application of buffer (vehicle). Dots represent average datapoints, shades represent standard error of the mean (SEM). n = 3 for each condition.
Figure 2—figure supplement 2
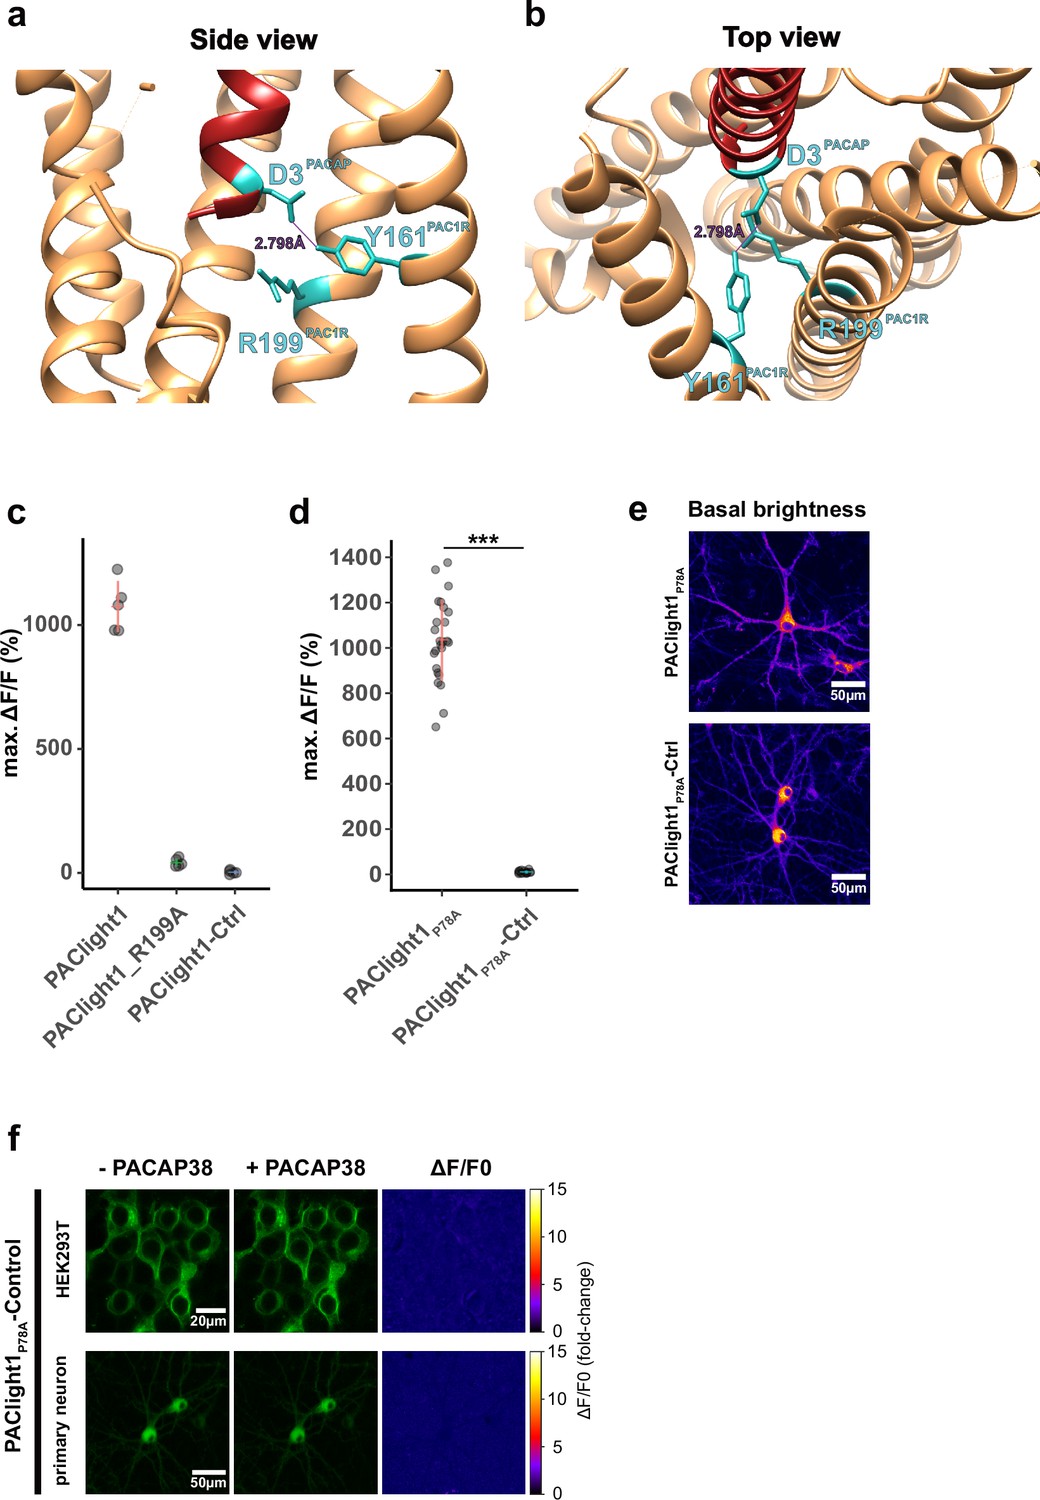
Development of a PAClight1P78A-ctrl sensor.
(a) Side view of the protein structure of the hmPAC1R transmembrane domain (beige) in interaction with PACAP1-38 (red). Residues Y161 and R199 of the hmPAC1R, as well as residue D3 of PACAP are highlighted in cyan. The hydrogen bond between D3 and Y161 is indicated with a dashed line. (b) Top view onto the same protein structures depicted in a. (c) Maximum dynamic range of HEK293T cells expressing PAClight1 (mean = 1075% ΔF/F0), PAClight1_R199A (mean = 41.9% ΔF/F0), and PAClight1-ctrl (mean = 2.87% ΔF/F0). (d) Maximum dynamic range of HEK293T cells expressing PAClight1P78A (mean = 1034% ΔF/F0) and PAClight1P78A-ctrl (mean = 10.44% ΔF/F0). (e) Comparison of basal brightness levels of PAClight1P78A and PAClight1P78A-ctrl expressed in rat primary neurons via viral transduction. (f) Representative examples of PAClight1P78A-ctrl expressed in HEK293T cells (top row) and rat primary neurons (bottom row) before (left column) and after (middle column) bath application of 10 μM PACAP1-38. The right column depicts the pixel-wise calculated ΔF/F0. No detectable increase in fluorescence is observed. *** indicates p < 0.0001 for two-sample t-test with Welch's correction.
Figure 3
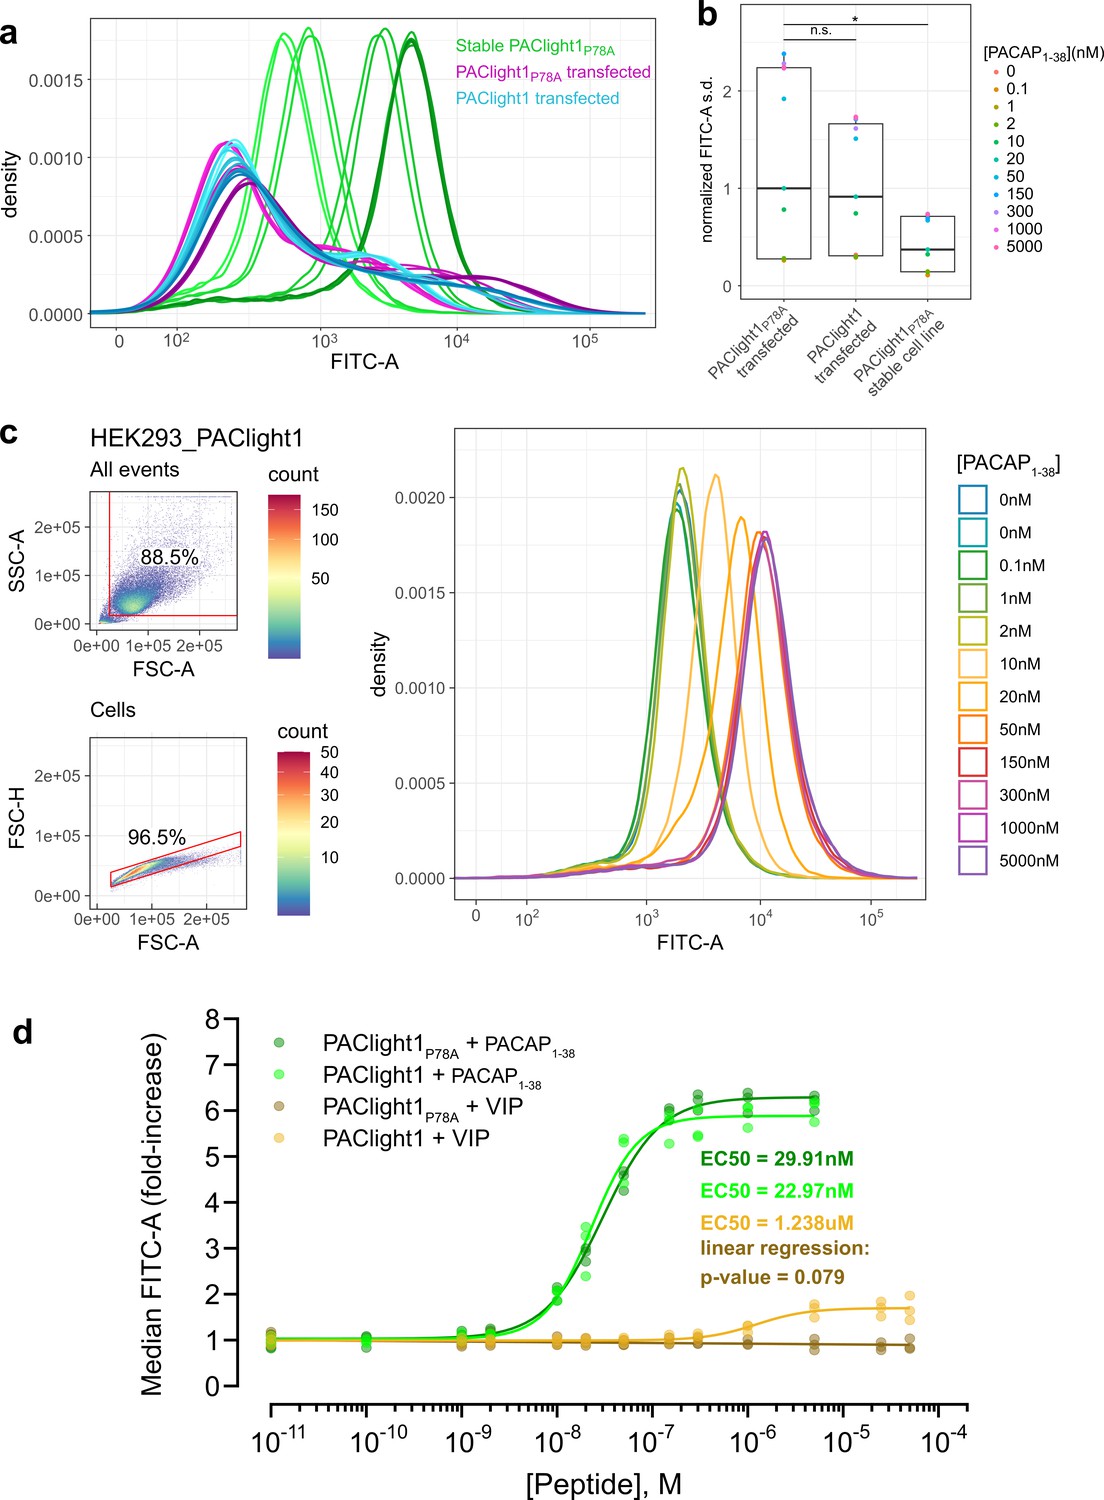
Comparison between transient and stable PAClight1P78A expression.
(a) A direct flow cytometric comparison between transfected HEK293T cells and stable and inducible HEK293_PAClight1P78A cells highlights the improved homogeneity of the distribution of expression levels in the newly generated stable cell line. Note the increased number of cells on both the low and high extremes in the transfected populations over the stable cell line population. Data from a full PACAP1-38 titration series for each condition are presented. The overall variability in expression levels in the PAClight1P78A- and PAClight1-transfected condition is very similar. (b) The standard deviation of each density curve (normalized to the median standard deviation of the transfected PAClight1P78A condition) is plotted by condition and concentration. The median standard deviation of the stable HEK293_PAClight1P78A condition is reduced to only 37.4% of the transfected PAClight1P78A condition (Dunnett’s test p = 0.0142). The median standard deviation varies little between transfected PAClight1P78A and PAClight1 cells (8.6% lower in PAClight1, Dunnett’s test p = 0.5966). (c) A representative example of a PACAP1-38 titration series on stable HEK293_PAClight1 cells. Top left: Gating strategy used to gate cells by the area of the side scatter (SSC-A) vs. the area of the forward scatter (FSC-A). Bottom left: Gating strategy used to gate singlets (within the cells gate) by the height of the forward scatter (FSC-H) vs. the FSC-A. Right: Density curves of the FITC-A channel obtained from the singlet gate. (d) Dose–response curves obtained from vasoactive intestinal peptide (VIP) and PACAP1-38 titrations on stable HEK293_PAClight1P78A and stable HEK293_PAClight1 cells. PAClight1P78A and PAClight1 both have high affinities for PACAP1-38 (PAClight1P78A EC50 = 29.91 nM, PAClight1 EC50 = 22.97 nM, n = 3). While PAClight1 still shows a response to higher concentrations of VIP (EC50 = 1.24 μM), PAClight1P78A’s response to VIP is completely abolished up to concentrations of 50 μM VIP (F(1, 33) = 3.28, p = 0.079, adj. R2 = 0.06). Data in a–c are derived from 100 K original events recorded for each concentration and construct. Data in d are derived from 100 K recorded events across n = 3 of each titration series. * indicates p < 0.05 for Dunnett's test. n.s. = not statistically significant.
-
Figure 3—source data 1
Source data for graphs and bar plots in Figure 3.
- https://cdn.elifesciences.org/articles/96496/elife-96496-fig3-data1-v1.xlsx
Figure 4 with 1 supplement
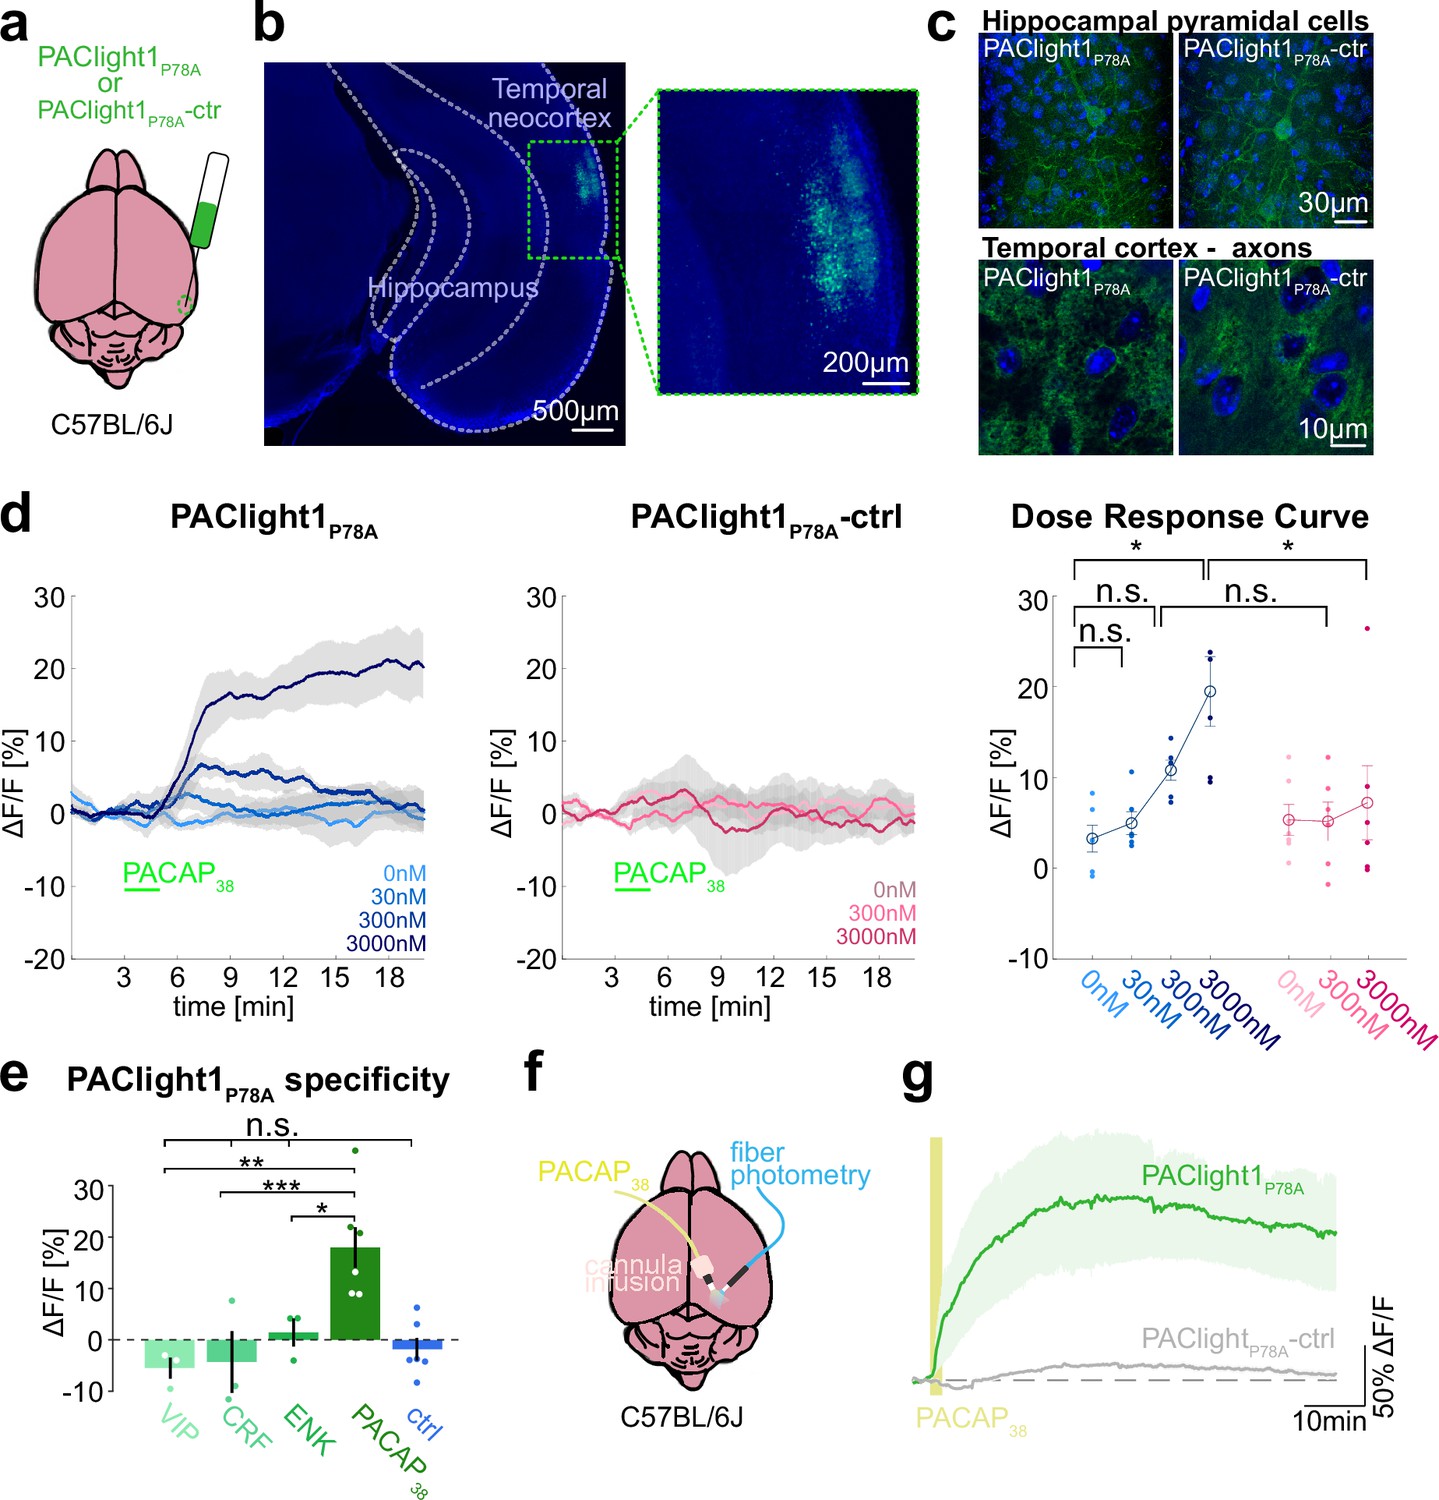
Ex vivo and in vivo sensor characterization in mice.
(a) Adeno-associated viruses (AAVs) encoding the PAClight1P78A or PAClight1P78A-ctrl sensor were injected into the temporal neocortex of adult mice. (b) Representative epifluorescent image of PAClight1P78A fluorescence after 4 weeks of expression time. (c) Maximum intensity projections of exemplary confocal images of PAClight1P78A and PAClight1P78A-ctrl-expressing neurons and neuropil in hippocampus and cortex enhanced with GFP immunostaining and counterstained with DAPI (blue). (d) Acute mouse brain slices expressing PAClight1P78A (left) and PAClight1P78A-ctrl (middle) were used to test the sensitivity of the sensor in the mammalian brain. PACAP1-38 was bath applied for 2 min (green bar) at indicated concentrations. Data shown as mean ± standard error of the mean (SEM). N = 6 slices per condition from ≥3 mice. Right: Dose–response curve for PAClight1P78A ΔF/F0 (blue shades) and PAClight1P78A-ctrl ΔF/F0 (pink shades) in response to indicated concentrations of PACAP1-38. Mann–Whitney U tests with Bonferroni corrections revealed no statistically significant difference in mean PAClight1P78A peak responses to bath application of 30 nM (p = 2.909), and 300 nM PACAP1-38 (p = 0.0519) compared to 0 nM PACAP1-38. We found a significant difference between 0 and 3000 nM PACAP1-38 (p = 0.013). Comparing mean peak ΔF/F0 PAClight1P78A responses with PAClight1P78A-ctrl revealed a significant difference when bath applying 3000 nM (p = 0.041), but not for 300 nM (p = 0.084). (e) Quantification of mean PAClight1P78A peak responses to bath application of 3 µM vasoactive intestinal peptide (VIP), CRF, ENK, PACAP1-38, and negative control (ctrl) in acute mouse brain slices. N = 3–6 slices per condition from ≥3 mice. No statistically significant difference (F(4,10) = 5.15) was found between ctrl and VIP (p = 0.9705), ctrl and CRF (p = 0.9937) and ctrl and ENK (p = 0.9726). A statistically significant difference (F(3,8) = 9.19) was detected between PACAP1-38 and VIP (p = 0.007), PACAP1-38 and CRF (p = 0.001), and PACAP1-38 and ENK (p = 0.045). Statistically significant differences are indicated with an asterisk, non-significant differences with n.s. (f) AAVs encoding the PAClight1P78A or PAClight1P78A-ctrl sensor were injected into the neocortex of adult mice. Fiberoptic cannulae and acute microinfusion cannulae were implanted nearby. (g) PAClight1P78A and PAClight1P78A-ctrl fluorescence changes upon microinfusion of 300 µM PACAP1-38 (200 nl) recorded with fiber photometry in freely behaving mice. N = 5 PAClight1 P78A and 4 PAClight1 P78A-ctrl mice. Data shown as mean ± SEM.
-
Figure 4—source data 1
Source data for graphs and bar plots in Figure 4.
- https://cdn.elifesciences.org/articles/96496/elife-96496-fig4-data1-v1.xlsx
Figure 4—figure supplement 1

Validation of PAClight1P78A and PAClight1P78A-ctrl sensors in mammalian brains.
Maximum intensity projections of exemplary confocal images of PAClight1P78A and PAClight1P78A-ctrl-expressing neurons in the cortex enhanced with immunostaining and counterstained with DAPI (blue).
Figure 5
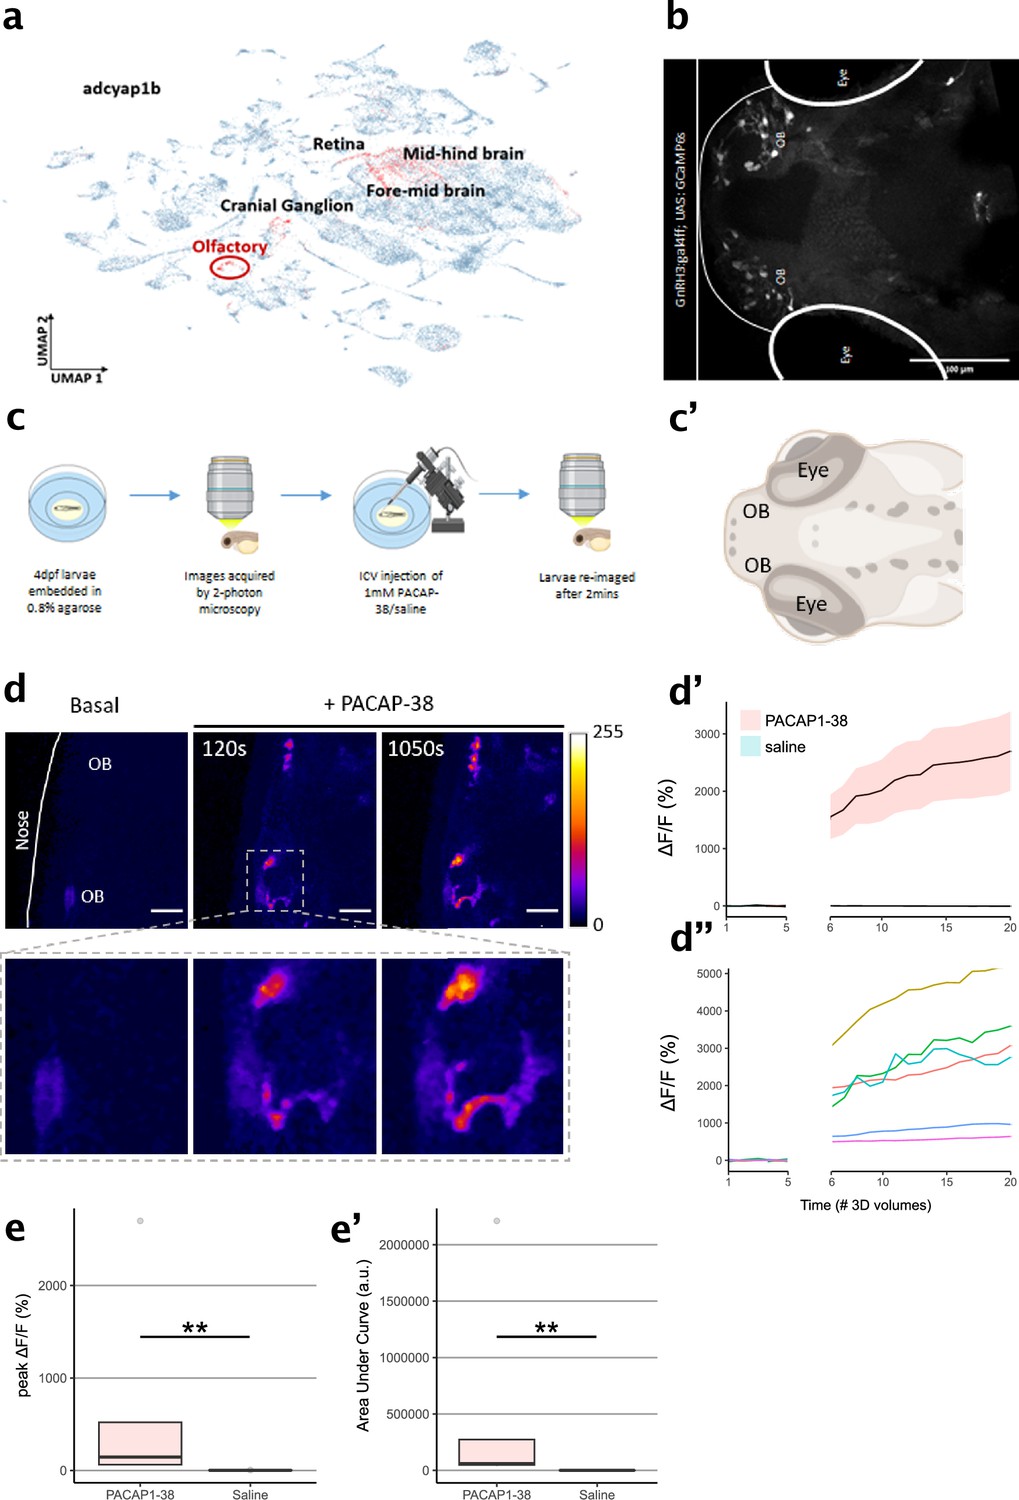
Characterization of PAClight1 in live zebrafish larvae.
(a) Uniform manifold approximation and projection (UMAP) showing topological distribution of single-cell gene expression clusters with high adcyap1b (PACAP) expression of 0–4 dpf larvae. High adcyap1b expression is highlighted in the olfactory bulb. (b) Maximum intensity projection image of the 4 dpf Tg(GnRH3:gal4ff; UAS:GCaMP6s) larvae shows GnRH3-expressing cells in the olfactory bulb. (c) Schema representing the experimental design. 4 dpf larvae were immobilized and 3D volumetric images across time were obtained during the naïve state. 50 nl of 1 mM PACAP-38/saline was injected intracerebroventricularly and the same larvae was imaged again after 2 min. (c’) Schema of imaged region of interest including the olfactory bulb in the 4 dpf larvae. Illustrations in c and c’ were created using Biorender.com. (d) (Top) Representative maximum intensity projection of two-photon volumetric images showing naïve sensor at baseline and its increase in fluorescence after PACAP-38 injection in the same larvae along time (scale bar = 20 µm). Color bar is representative of the ΔF/F0 in the images. (Bottom) Zoomed-in image of the left olfactory bulb showing increase in fluorescence after injection of PACAP1-38. (d’) Representative quantification of the change in fluorescence with respect to basal fluorescence depicted as ΔF/F0. PACAP1-38 injected larvae show an increase in activity of the fluorescent sensor as compared to their saline injected sibling controls. (d”) Individual cell traces show variability in sensor responses in different cells that may be a function of expression of the sensor on the cell surface. (e, e’) Peak ΔF/F0 and area under the curve (AUC) of PACAP1-38 injected larvae is significantly higher than the saline injected controls (ncontrol = 5, nPACAP-38 = 5, Kolmogorov–Smirnov test p = 0.0079). ** indicates p < 0.01 for Kolmogorov–Smirnov test.
© 2024, BioRender Inc. Figure 5c was created using BioRender, and is published under a CC BY-NC-ND license. Further reproductions must adhere to the terms of this license.
© 2024, BioRender Inc. Figure 5c' was created using BioRender, and is published under a CC BY-NC-ND license. Further reproductions must adhere to the terms of this license.
-
Figure 5—source data 1
Source data for graphs and bar plots in Figure 5.
- https://cdn.elifesciences.org/articles/96496/elife-96496-fig5-data1-v1.xlsx
Tables
Key resources table
| Reagent type (species) or resource | Designation | Source or reference | Identifiers | Additional information |
|---|---|---|---|---|
| Strain, strain background (Escherichia coli) | NEB 10 Beta | New England Biolabs | C3019H | N/A |
| Cell line (Homo sapiens) | HEK293T | ATCC | CRL-3216 | N/A |
| Cell line (Homo sapiens) | Flp-In T-REx 293 cells | Thermo Fisher | R78007 | N/A |
| Commercial assay or kit | Nano-Glo Live Cell Reagent | Promega | N2011 | N/A |
| Commercial assay or kit | Lipofectamine 2000 | Thermo Fisher | 11668019 | N/A |
| Commercial assay or kit | Effectene | QIAGEN | 301425 | N/A |
| Chemical compound, drug | PACAP1-38 | Sigma-Aldrich | A1439 | N/A |
| Software, algorithm | Fiji | ImageJ | 2.15.1 | https://imagej.net/software/fiji/ |
| Software, algorithm | R studio | Posit | 2023.09.1 | https://posit.co/downloads/ |
Additional files
-
Supplementary file 1
DNA and protein sequence for the PACLight1P78A sensor.
- https://cdn.elifesciences.org/articles/96496/elife-96496-supp1-v1.docx
-
MDAR checklist
- https://cdn.elifesciences.org/articles/96496/elife-96496-mdarchecklist1-v1.docx
Download links
A two-part list of links to download the article, or parts of the article, in various formats.
Downloads (link to download the article as PDF)
Open citations (links to open the citations from this article in various online reference manager services)
Cite this article (links to download the citations from this article in formats compatible with various reference manager tools)
Probing PAC1 receptor activation across species with an engineered sensor
eLife 13:RP96496.
https://doi.org/10.7554/eLife.96496.3


