The mechanism of mammalian proton-coupled peptide transporters
- Structural Bioinformatics and Computational Biochemistry, Department of Biochemistry, University of Oxford, United Kingdom
- The Kavli Institute for Nanoscience Discovery, University of Oxford, United Kingdom
Figures
Figure 1 with 3 supplements
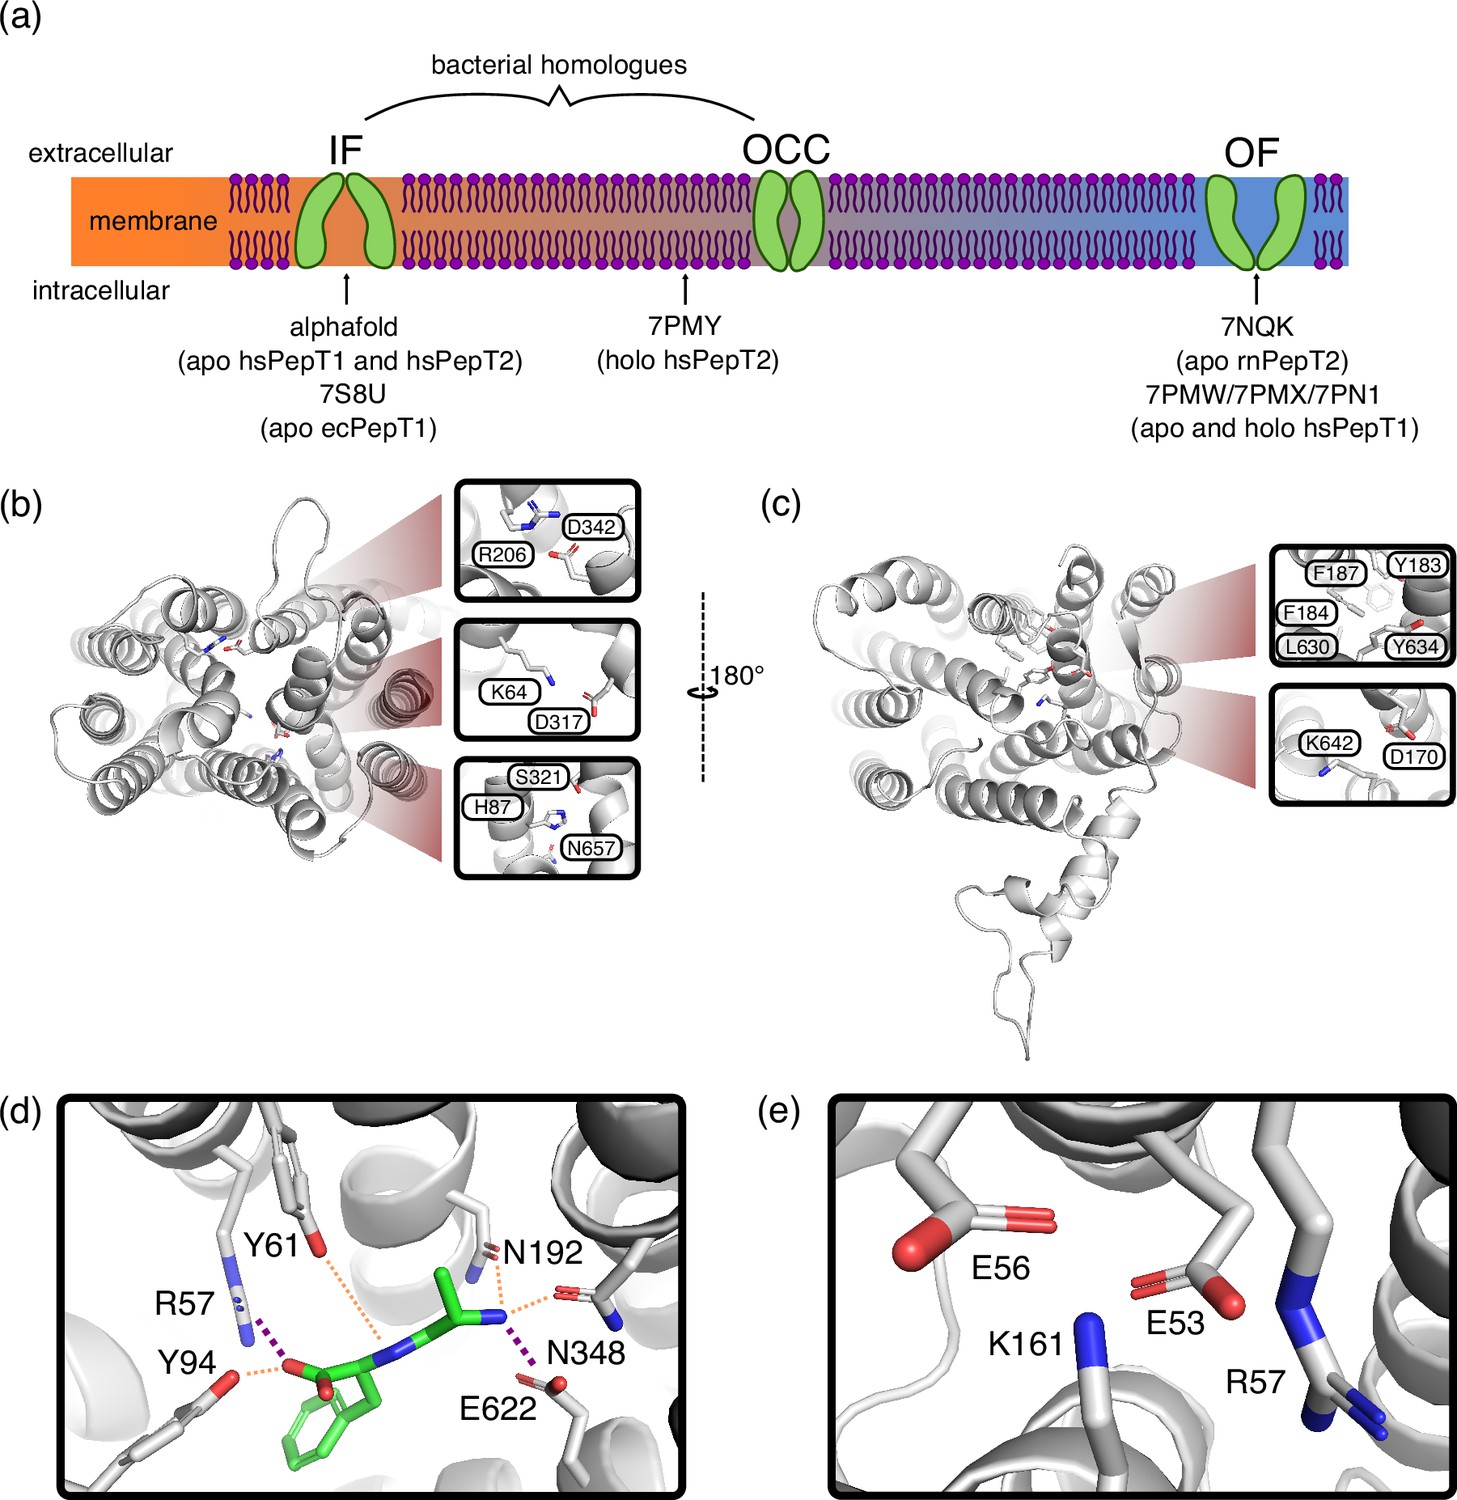
Key features of Proton-coupled oligo-peptide transporter (POT) structures.
(a) Schematic overview of the conformational diversity of available mammalian POT structures. Intermediate positions between states indicate partial gate opening. (b) Alphafold-predicted inwards-facing (IF) HsPepT2 structure (top view), highlighting potential inter-bundle extracellular gate interactions. (c) Outwards-facing (OF) Cryo-EM structure of apo RnPepT2 (7NQK, bottom view) (Parker et al., 2021), highlighting potential inter-bundle intracellular gate interactions. (d) Ala-Phe substrate binding pose, representative cluster frame of 1 µs molecular dynamics (MD) simulation from 7NQK structure with added ligand, for setup details see Materials and methods. Purple dotted lines represent salt-bridge contacts, orange dotted lines other polar contacts. (e) ExxER motif salt-bridge cluster, representative cluster frame of 1 µs MD simulation from 7NQK structure.
Figure 1—figure supplement 1
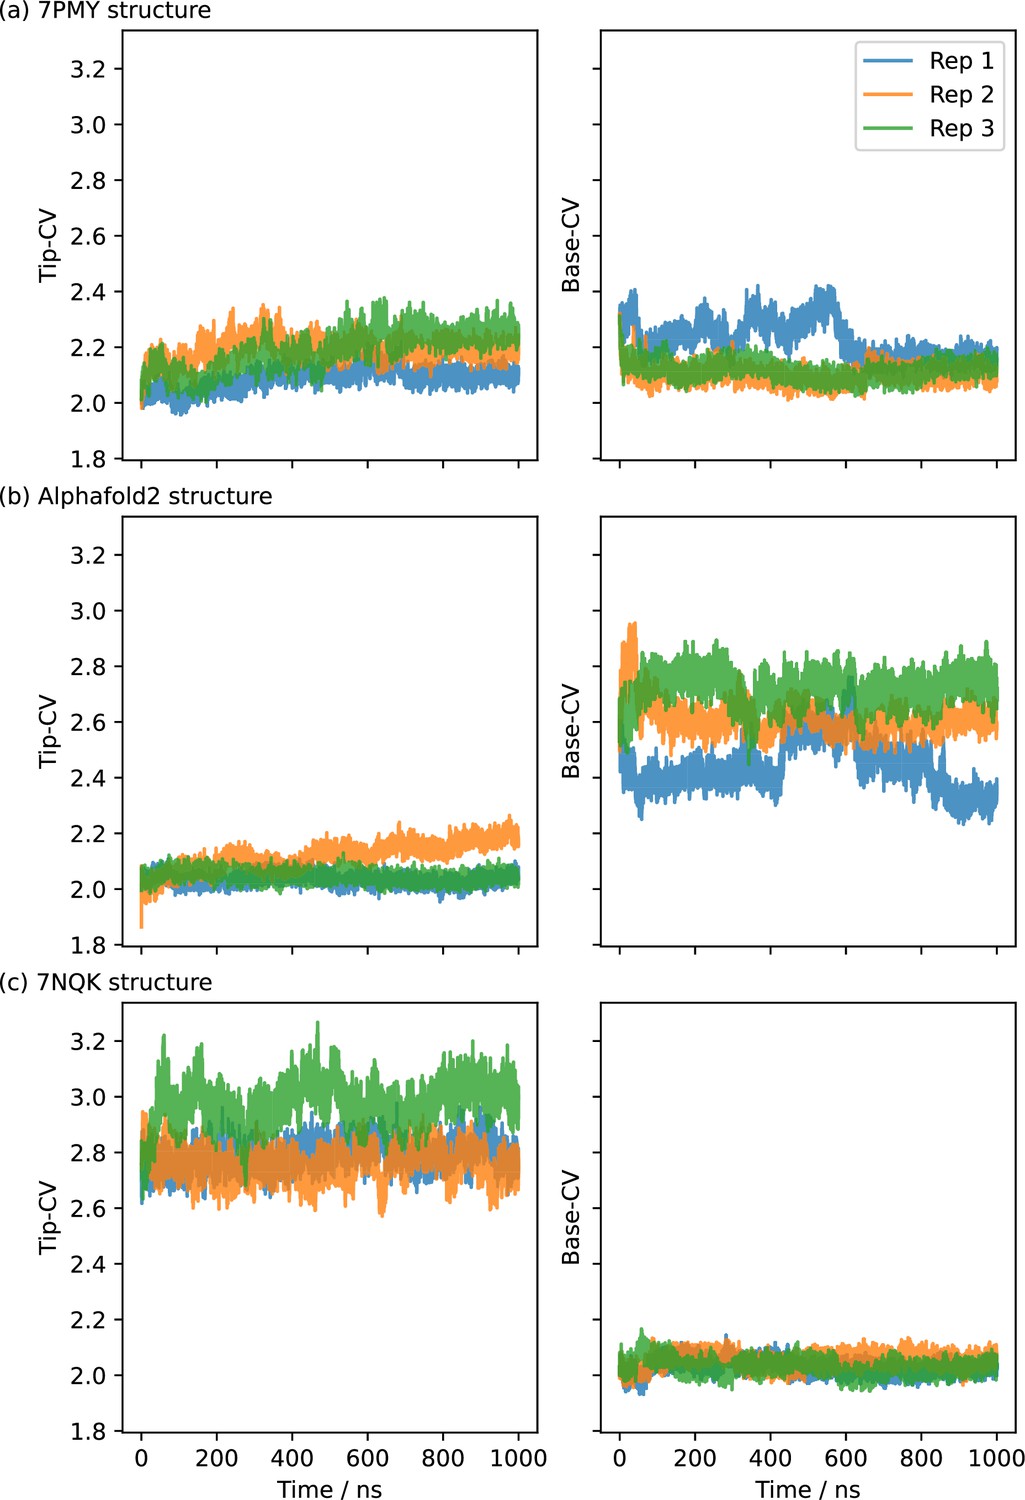
1 µs-long molecular dynamics (MD) simulations starting from CHARMM-GUI-embedded and equilibrated PepT2 structures.
(a) The inwards-facing (IF), partially occluded (OCC) cryo-EM structure (7PMY) moves towards an occluded state via closure of the intracellular gate. However the extracellular gate partially opens in the process. Rep 1 also displays a partial helical unfolding near the intracellular gate (see provided coordinate files in the supplementary data). (b) Alphafold-based IF embeddings 1 and 3 explore a range of IF conformations while maintaining a stable extracellular gate, whereas rep 2 partially opens the extracellular gate. (c) The outwards-facing (OF) cryo-EM structure (7NQK) remains stable with a tight intracellular gate.
Figure 1—figure supplement 2
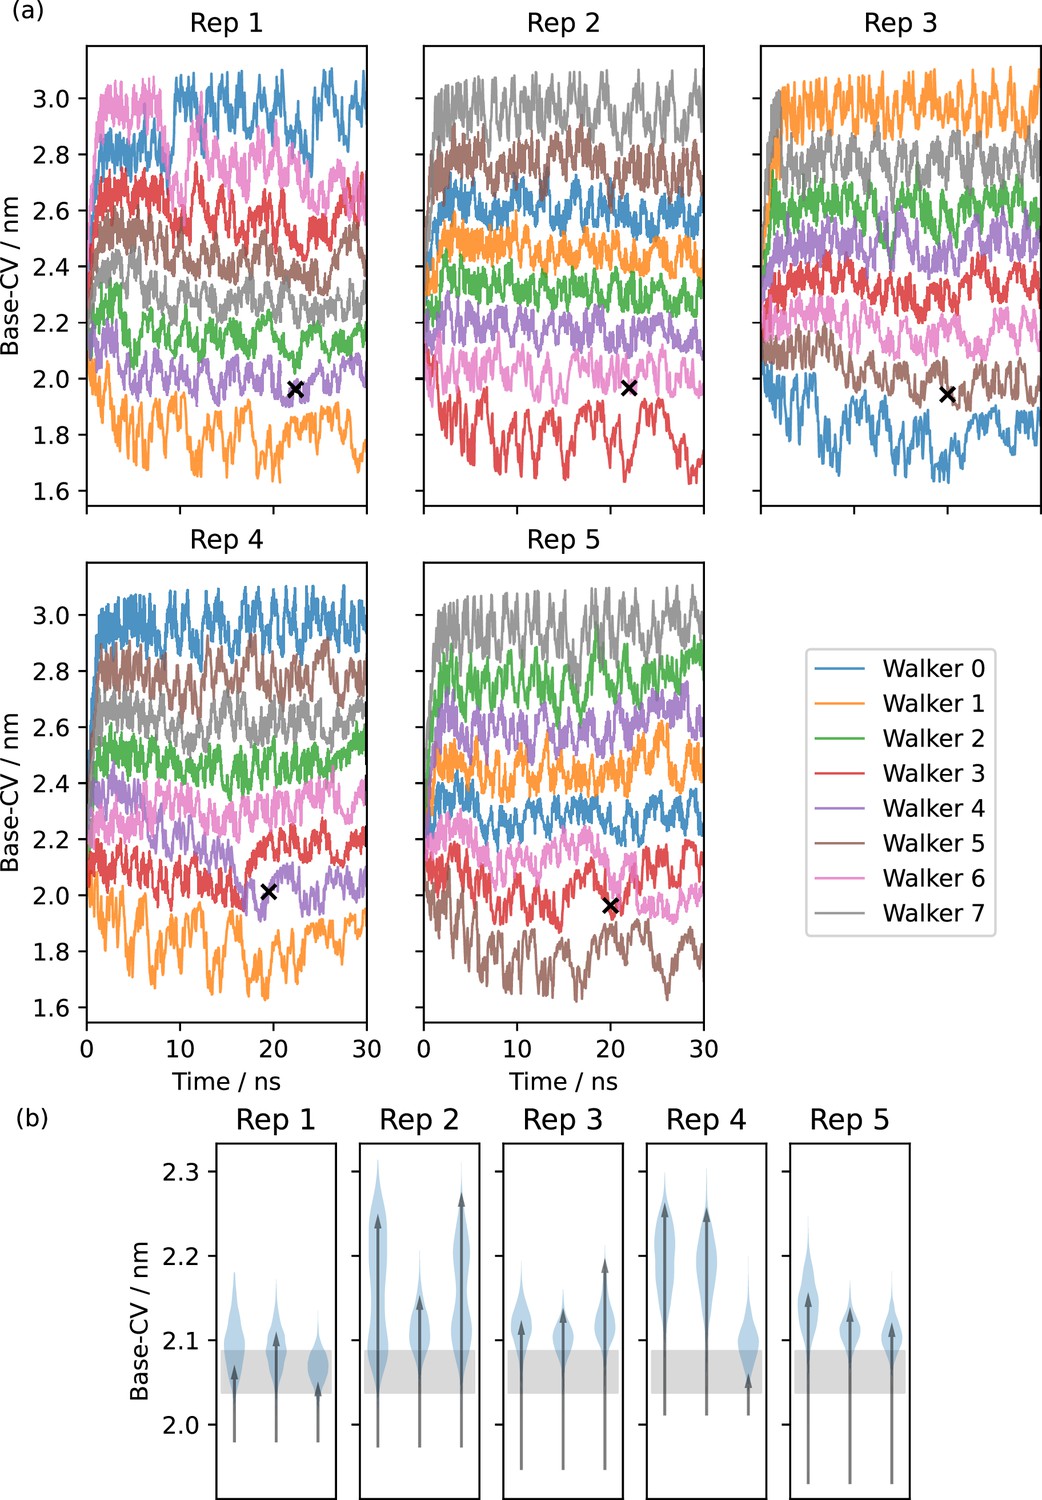
Metadynamics to derive potential occluded states.
(a) Five replicates of multiple-walker metadynamics along the Base-CV, starting from the Alphafold inwards-facing (IF) equilibration rep 1. Black crosses indicate potential occluded (OCC) states picked around a Base-CV value of 2 nm and at a timestep of around 20 ns. (b) Equilibrations (three per metadynamics replicate) of the candidate OCC states in 100 ns unbiased molecular dynamics (MD). Histograms of trajectory projections onto the Base-CV are shown as violin plots, arrows link the first and final frames. The grey shaded area corresponds to the range of Base-CV values sampled in our outwards-facing (OF) simulation. Rep 1 is a stable OCC state, whereas the other replicates display partial intracellular-gate opening.
Figure 1—figure supplement 3
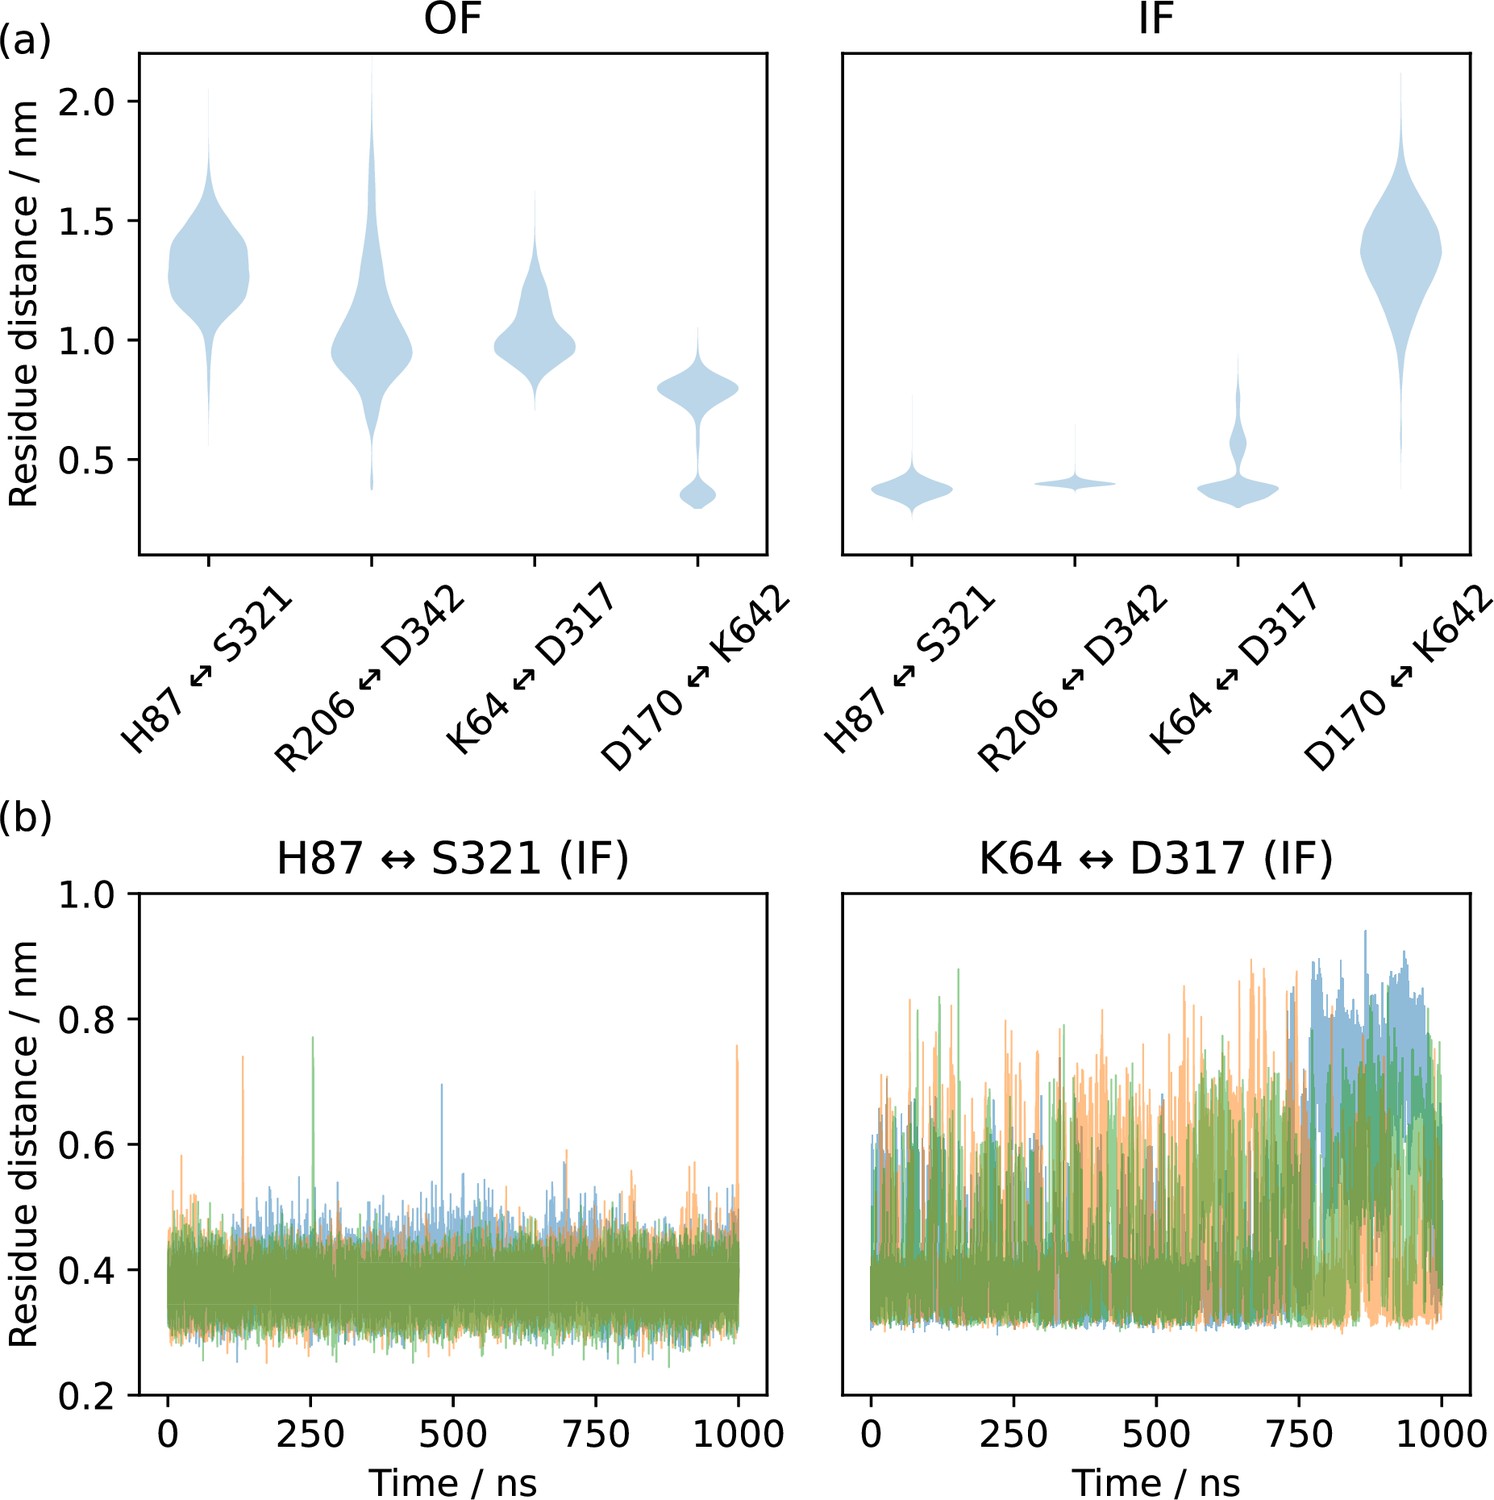
Inter-residue heavy atom (H87: NE2, S321: OG, R206: CZ, D342: CG, K64: NZ, D317: CG, D170: CG, K642: NZ) distances for several possible gating interactions.
(a) Histograms from pooled triplicates of 1 µs molecular dynamics (MD) as violin plots in the top row, starting from alphafold-derived inwards-facing (IF) and Cryo-EM derived outwards-facing (OF) conformations. H87↔S321 and R206↔D342 are always formed in the IF state but not in the OF state, while K64↔D317 and D170↔K462 show a preference for the IF and OF states, respectively but are not formed in all trajectory frames. (b) Triplicate time series of the H87↔S321 and K64↔D317 interactions in the IF state, showing how the former is a tight interaction, while the latter is unstable and only transiently formed.
Figure 2 with 5 supplements
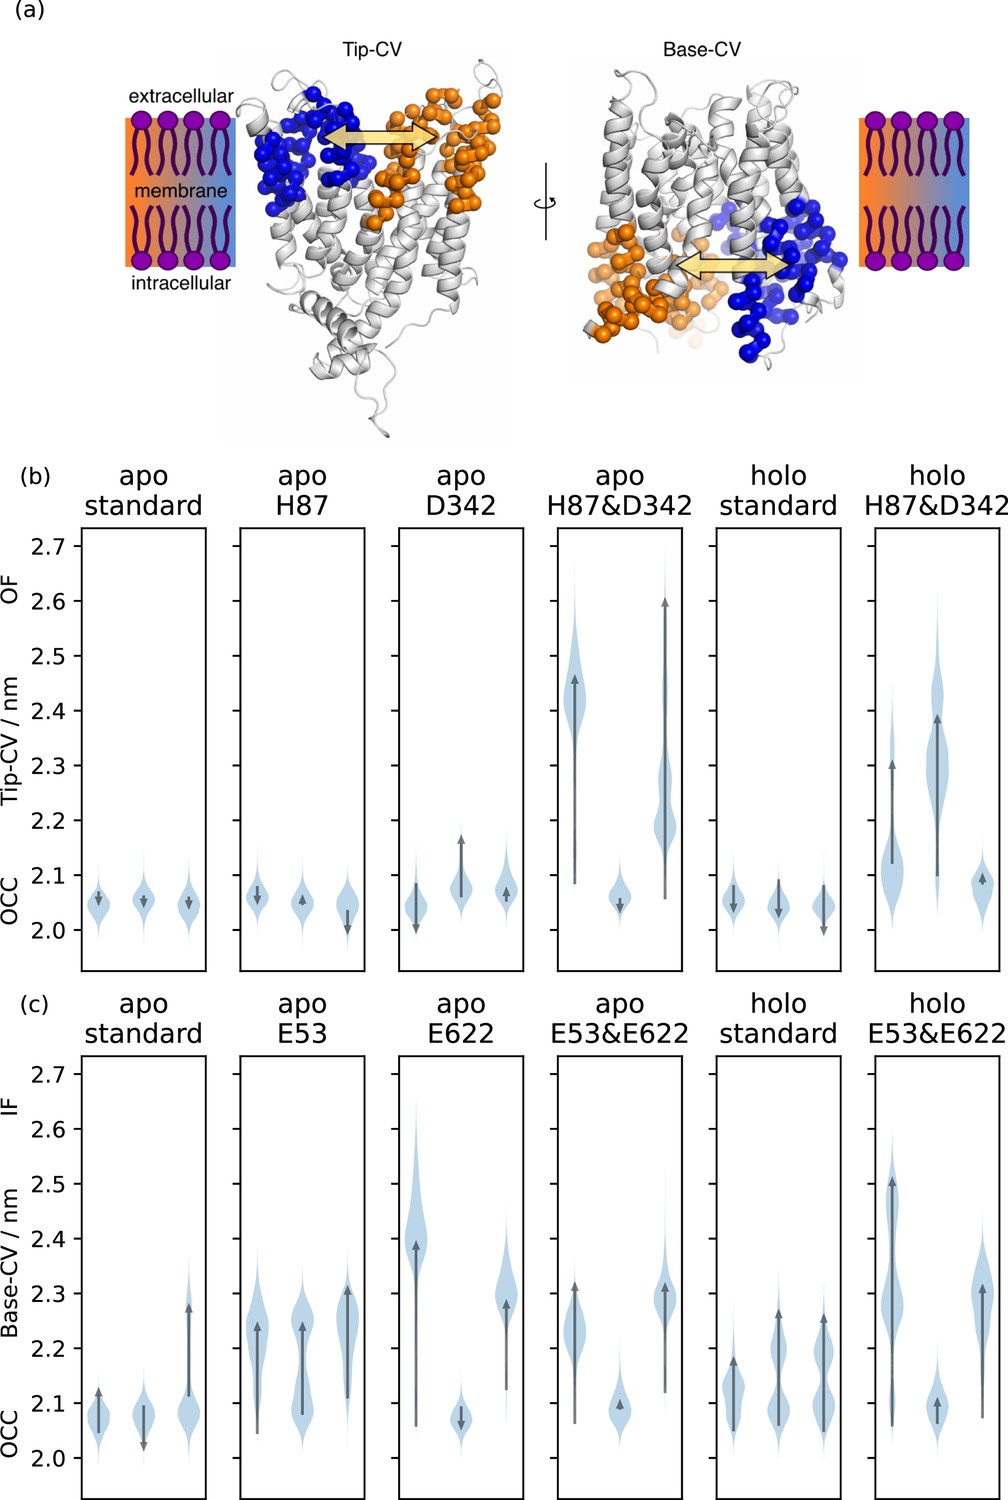
Collective variable analysis.
(a) Illustration of the collective variables (CVs) used to quantify extra-and intracellular gate opening, consisting of inter-bundle centre-of-mass distances between the helical tips (top 11 residues) and bases (bottom 11 residues). (b) + (c) Triplicate 1 μs-molecular dynamics (MD) simulations starting from occluded (OCC), showing the effects of different protonation and substrate binding states, projected onto the (b) Tip-CV and (c) Base-CV, respectively. Violin plots are trajectory histograms, arrows link the CV values of the first and last frames.
Figure 2—figure supplement 1
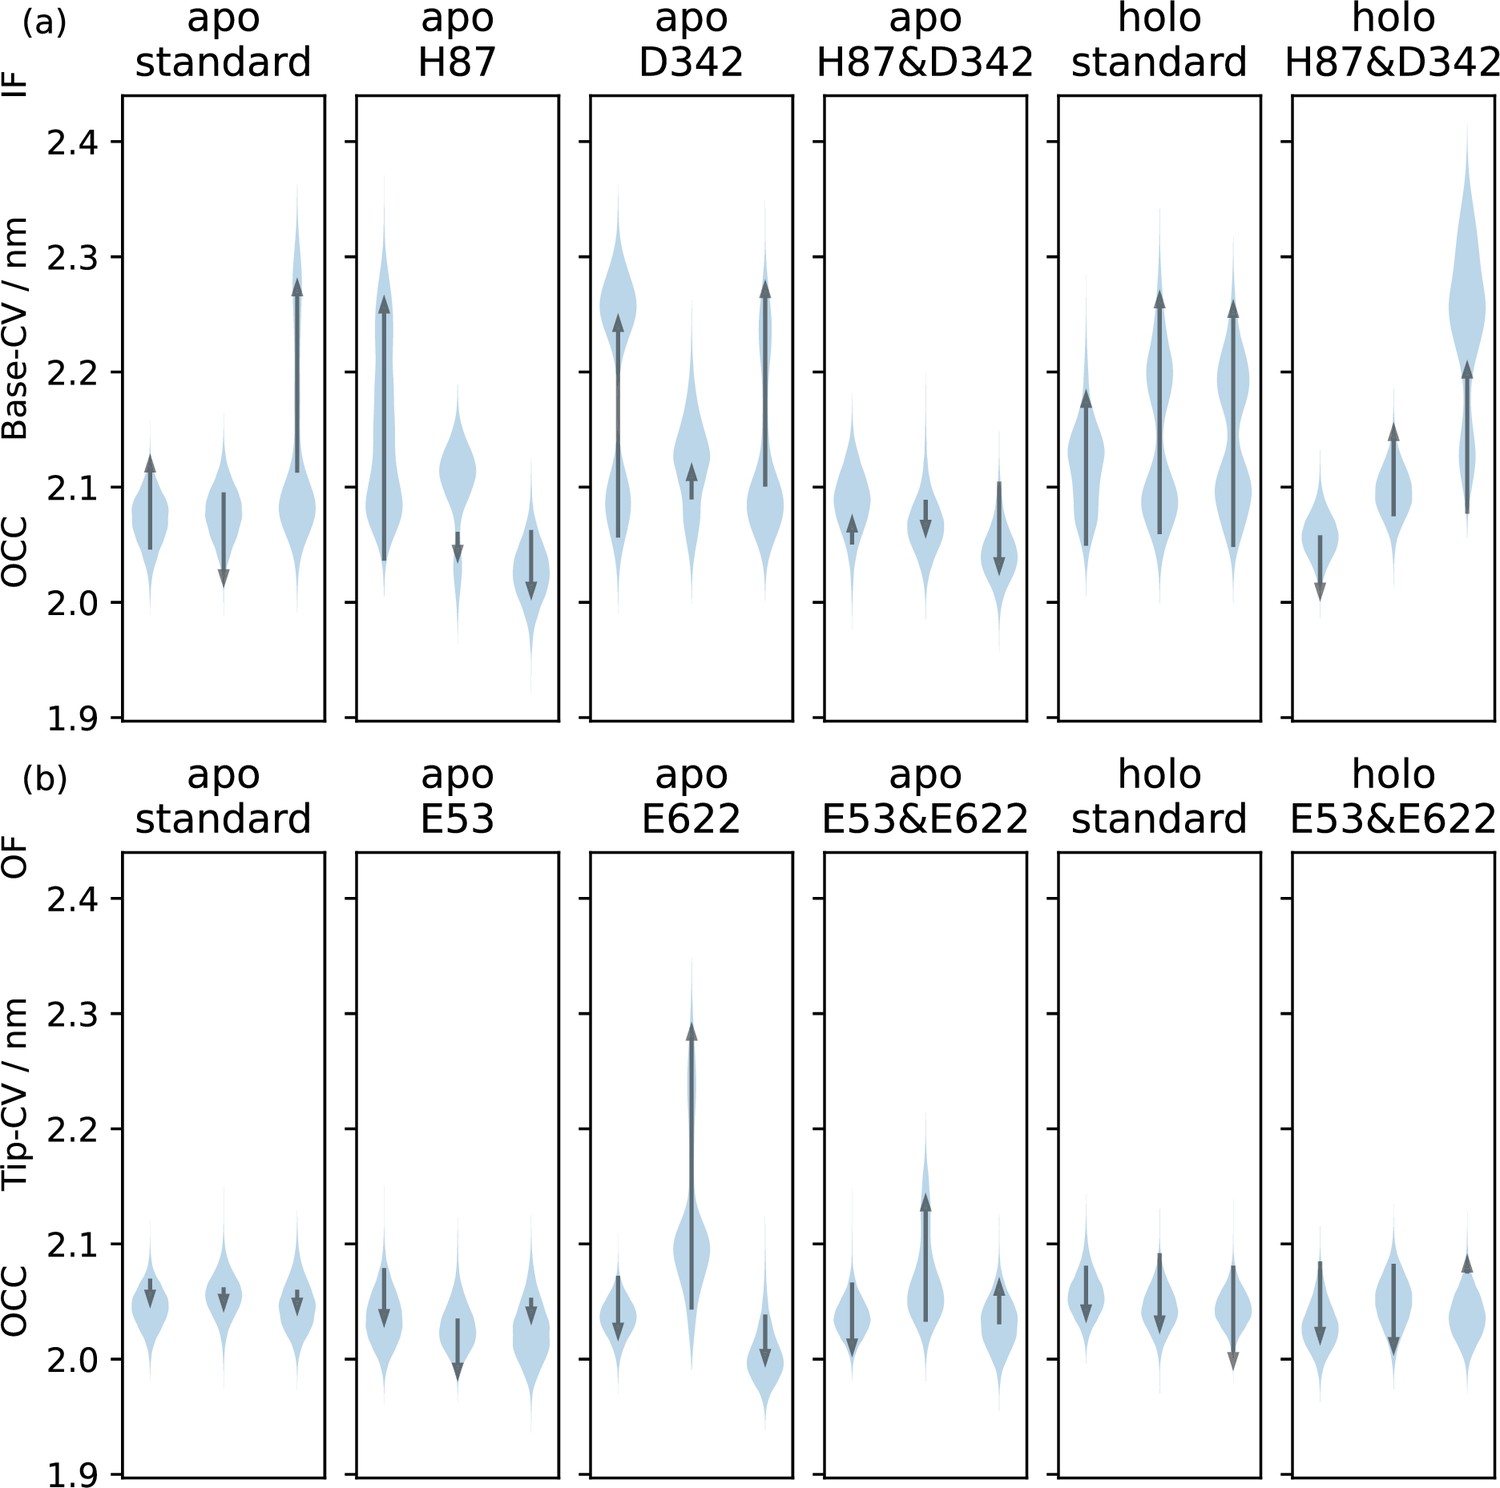
Effects of protonation and substrate on vanilla MD simulations of the OCC state.
Triplicate 1 μs-molecular dynamics (MD) simulations starting from occluded (OCC), showing the effects of different protonation and substrate binding states, projected onto the (a) Base-collective variables (CV) and (c) Tip-CV, respectively. Violin plots are trajectory histograms, arrows link the CV values of the first and last frames. Intracellular gate flexibility is suppressed by conditions that favour extracellular gate opening and vice versa.
Figure 2—figure supplement 2
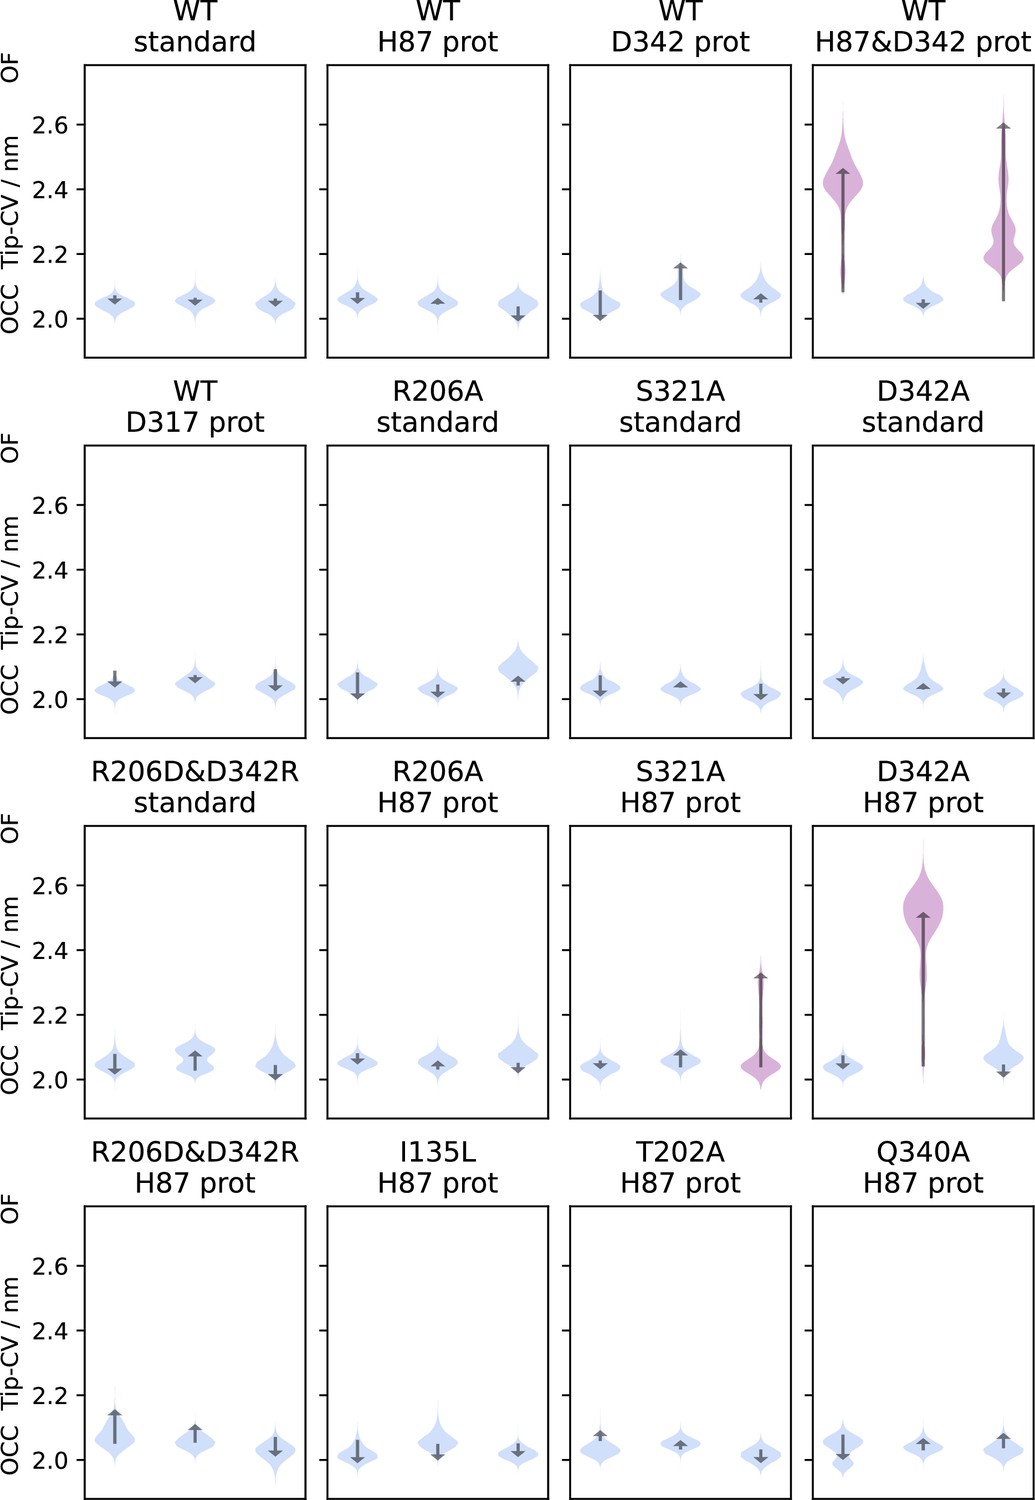
Triplicate 1 μs-molecular dynamics (MD) simulations starting from the occluded (OCC) state, showing the effects of different protonation states and mutations projected onto the tip-collective variables (CV).
Violin plots are trajectory histograms, arrows link the CV values of the first and last frames. Trajectories which displayed significant extracellular gate opening are highlighted in purple. Spontaneous extracellular gate opening requires H87 protonation, and the disruption of the R206↔D342 salt bridge also makes a significant contribution, either by mutation or protonation.
Figure 2—figure supplement 3
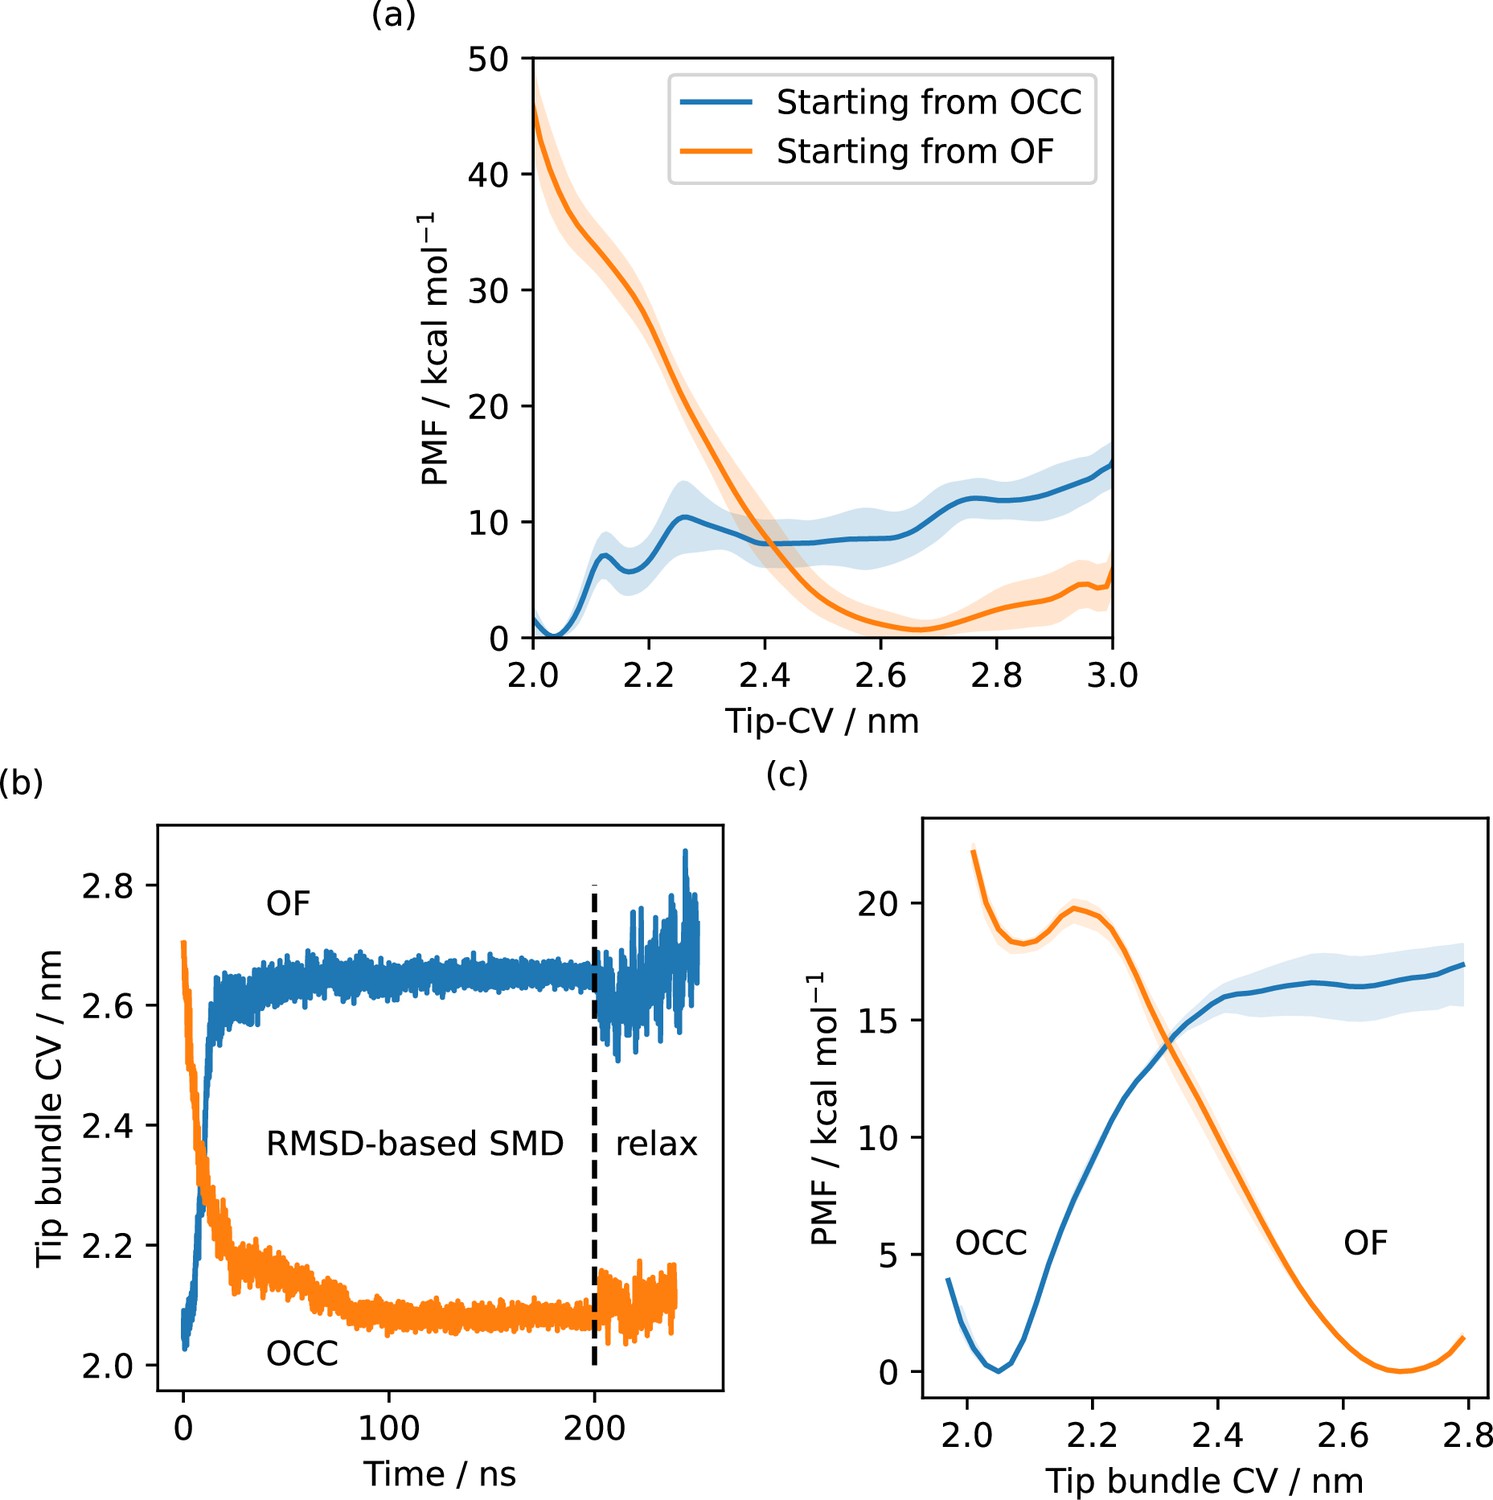
Illustration of hysteresis effects.
(a) Free energy profiles from metadynamics simulations (eight walkers) along the Tip-collective variables (CV), starting simulations from the occluded (OCC) (total sampling 1.7 μs) or outwards-facing (OF) state (total sampling 860 ns). Solid lines are the free energy estimates using the second half of the data only, shaded area is the standard deviation of free energy estimates with respect to sequential data chunks. The disparity between the curves indicates a significant hysteresis problem, favouring the initial state of the respective metadynamics run. (b) Steered MD (SMD) runs between OF and OCC states, biasing the heavy-atom replica-exchange umbrella sampling (RMSD) to the respective target state, shown as projections along the tip-CV. Metastable OCC and OF states are formed that remain stable in 50 ns unbiased molecular dynamics (MD). (c) REUS along the tip-CV with starting conformations picked to be equidistant in the CV from two SMD runs. Sampling was using 48 windows for a total of 4.4 μs (OCC→OF path) and 6.1 μs (OF→OCC path). Solid lines are PMFs calculated using all sampling, the shaded areas are error ranges obtained by omitting either the first 40% or the last 40% of sampling. The disparity between the curves indicates a significant hysteresis problem, favouring the initial state of the respective SMD path-generation run.
Figure 2—figure supplement 4
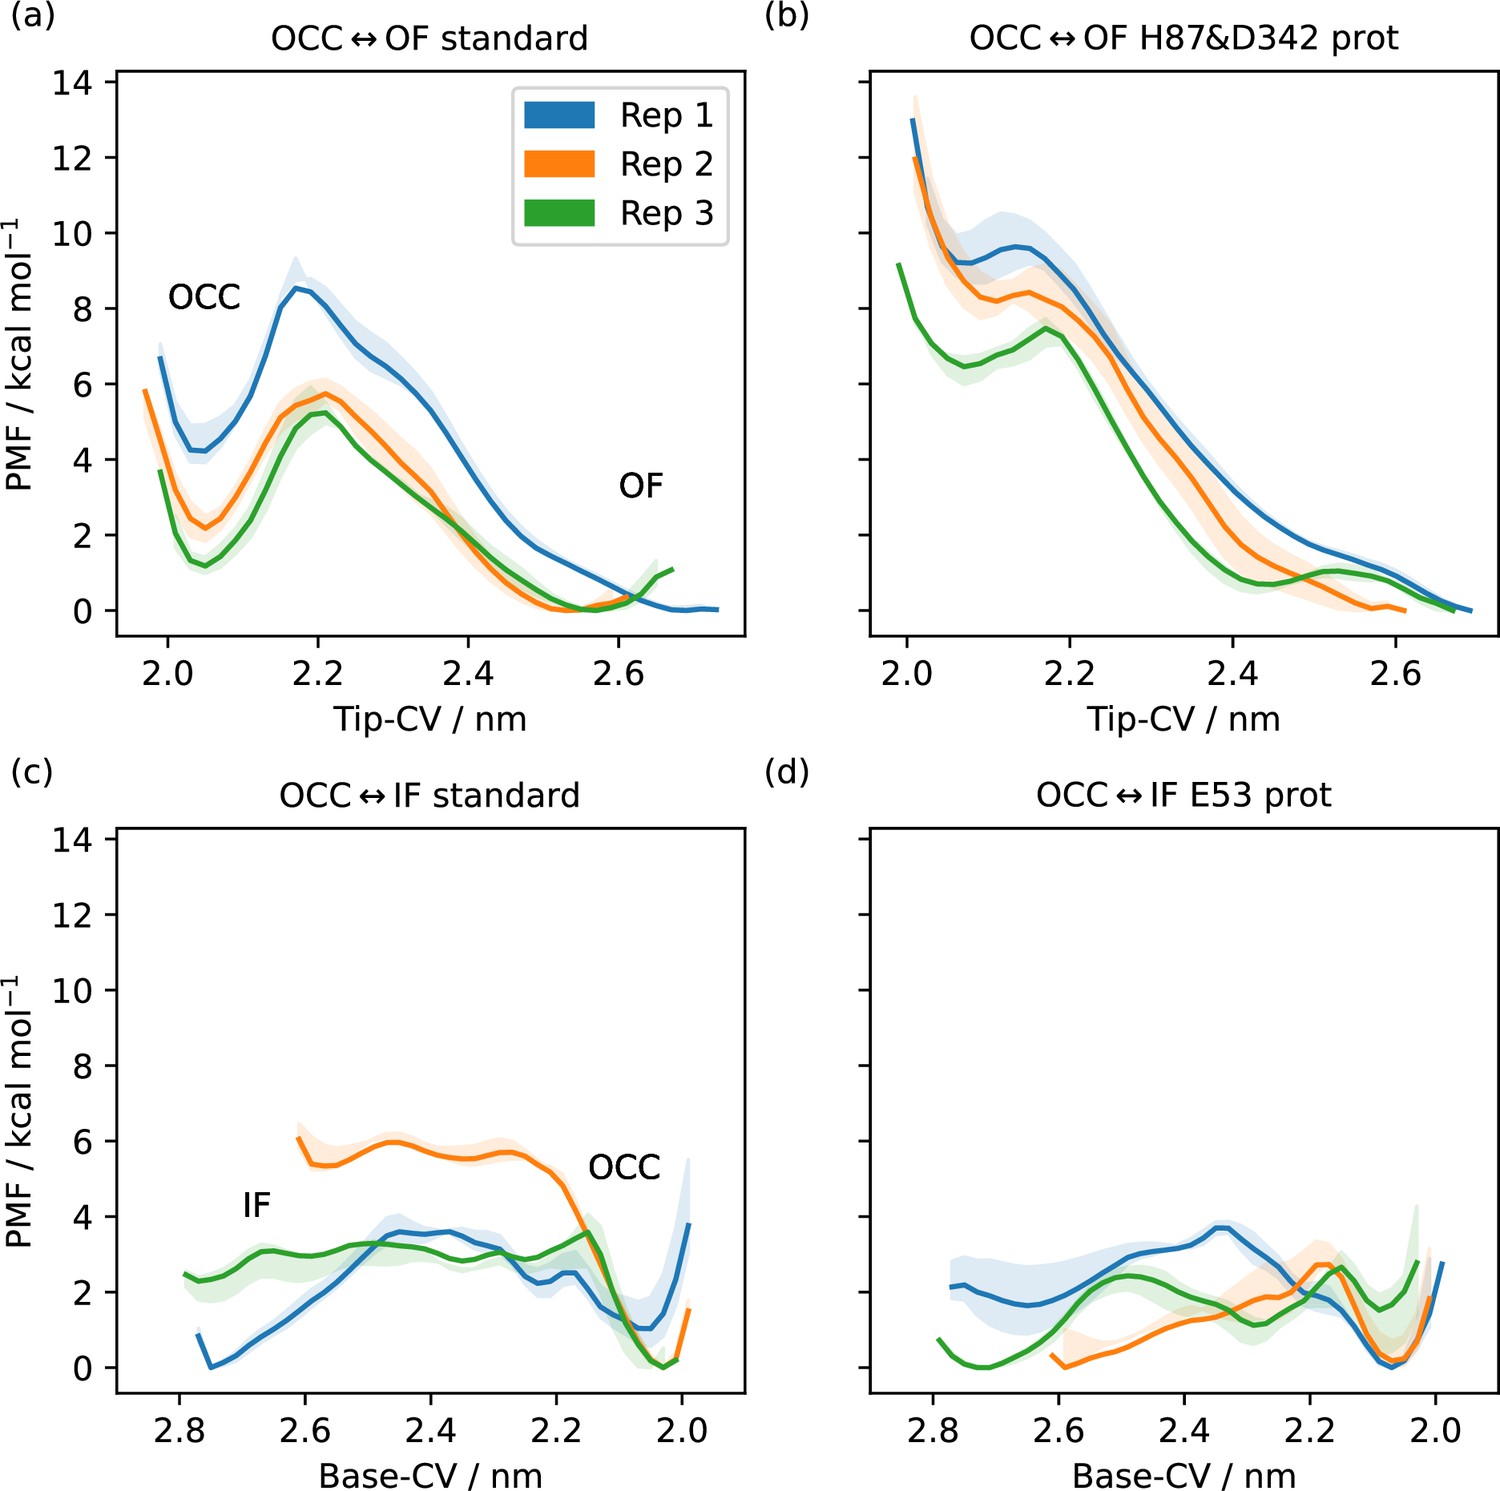
1D-potential of mean forces (PMFs) along the Tip-collective variable (CV) or Base-CV (as indicated), from replica-exchange umbrella sampling (REUS) starting at Morphing Endstates by Modelling Ensembles with iNdependent TOpologies (MEMENTO) intermediates.
The central line is calculated using all sampling, whereas the shaded areas are enclosed by curves derived from omitting the first 40% or the last 40% of sampling, giving a sense of apparent convergence (while substantial inter-replicate differences remain). (a) OCC↔OF transition, standard protonation states. Distinct occluded (OCC) and outwards-facing (OF) basins with separating barrier. (b) OCC↔OF transition, H87 and D342 protonated. The OCC basin and the separating barrier largely disappear. (c) OCC↔IF transition, standard protonation states. Distinct OCC basin and raised inwards-facing (IF) plateau. (d) OCC↔IF transition, E53 protontaed. The IF plateau and the barrier are lowered with respect to OCC.
Figure 2—figure supplement 5
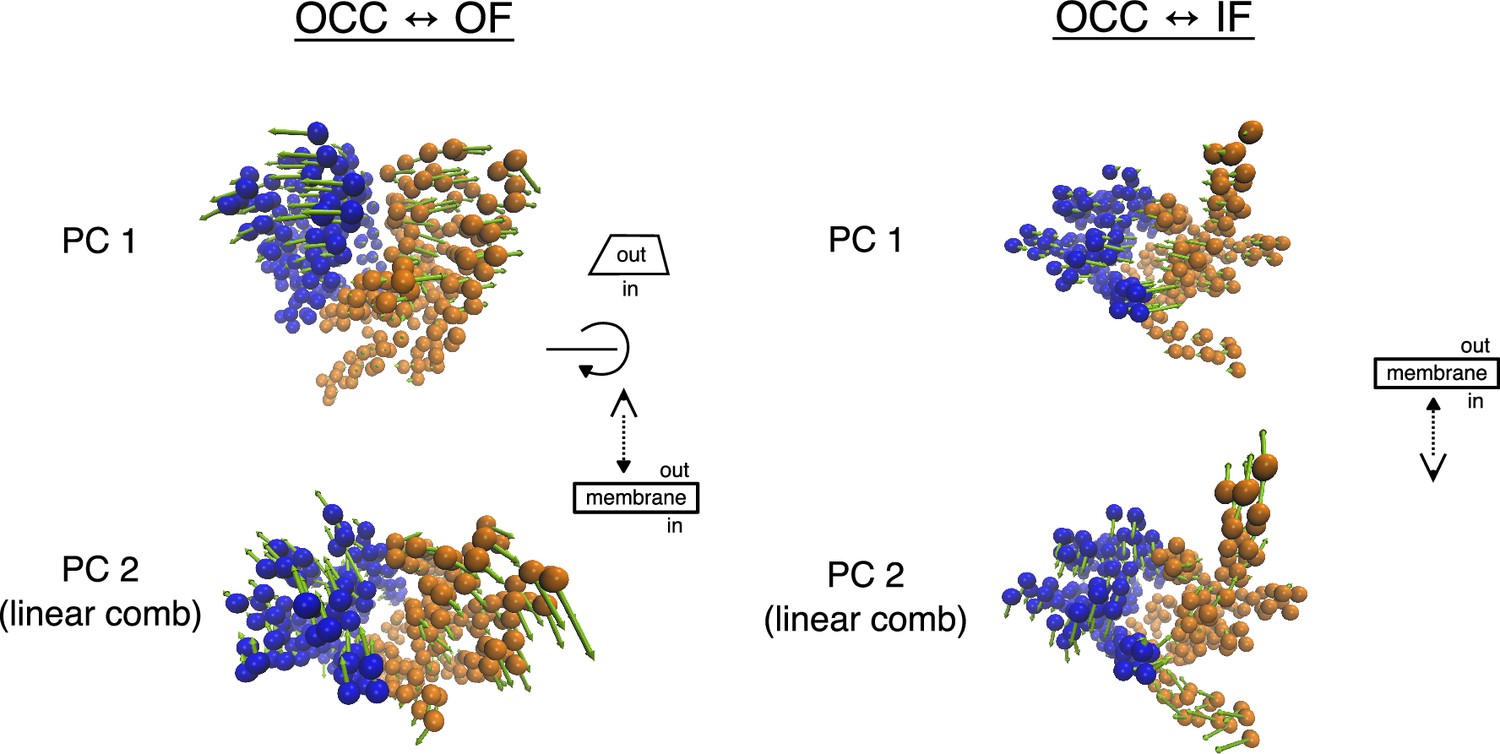
Illustration of the principal component analysis (PCA)-derived collective variables (CVs) for 2D-replica-exchange umbrella sampling (REUS).
TM-helix CA-atoms are shown as spheres, coloured blue for the N-terminal bundle and orange for the C-terminal bundle, while arrows show magnitude and direction. For the OCC↔OF transition, PC 1 corresponds to the gating motion, while PC 2 is a cleft-sliding movement. For OCC↔IF, PC 1 corresponds to the gating motion, while PC 2 is a twisting movement. See Videos 1–4 for animated versions of the same representations.
Figure 3 with 5 supplements
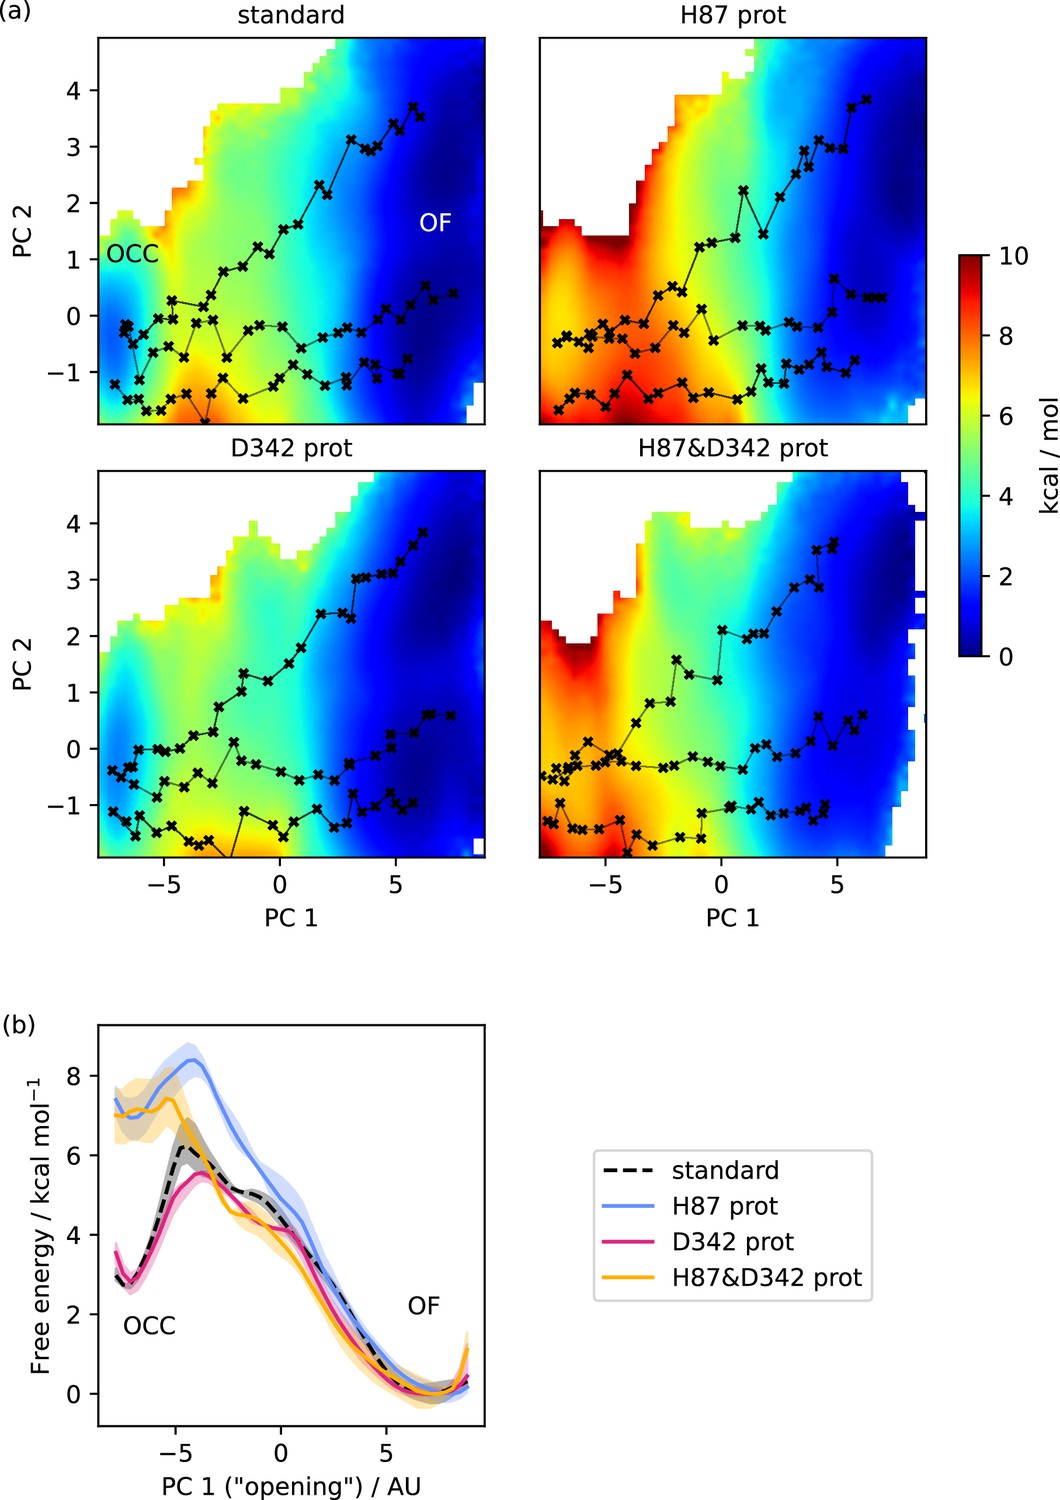
Free energy surfaces for the OCC-OF transition.
(a) 2D-PMFs from replica-exchange umbrella sampling (REUS) starting with Morphing Endstates by Modelling Ensembles with iNdependent TOpologies (MEMENTO) paths, in different protonation states of candidate extracellular gating residues. (b) Projection of the 2D-PMFs in part a onto PC 1 using Boltzmann reweighting. Shaded areas indicate convergence errors as the range of PMF values for a given CV value obtained with the first 40%, the last 40%, and 100% of sampling included (after alignment to the 100% curve). H87 and D342 form an additive extracellular gate, where H87 protonation changes the relative occluded (OCC)–outwards-facing (OF) state energies as well as the transition barrier, while D342 protonation only contributes in the transition region. Note that the individual PMFs are only determined by our REUS approach up to additive constants, and are shown aligned here at the OF state for convenience of comparison.
Figure 3—figure supplement 1
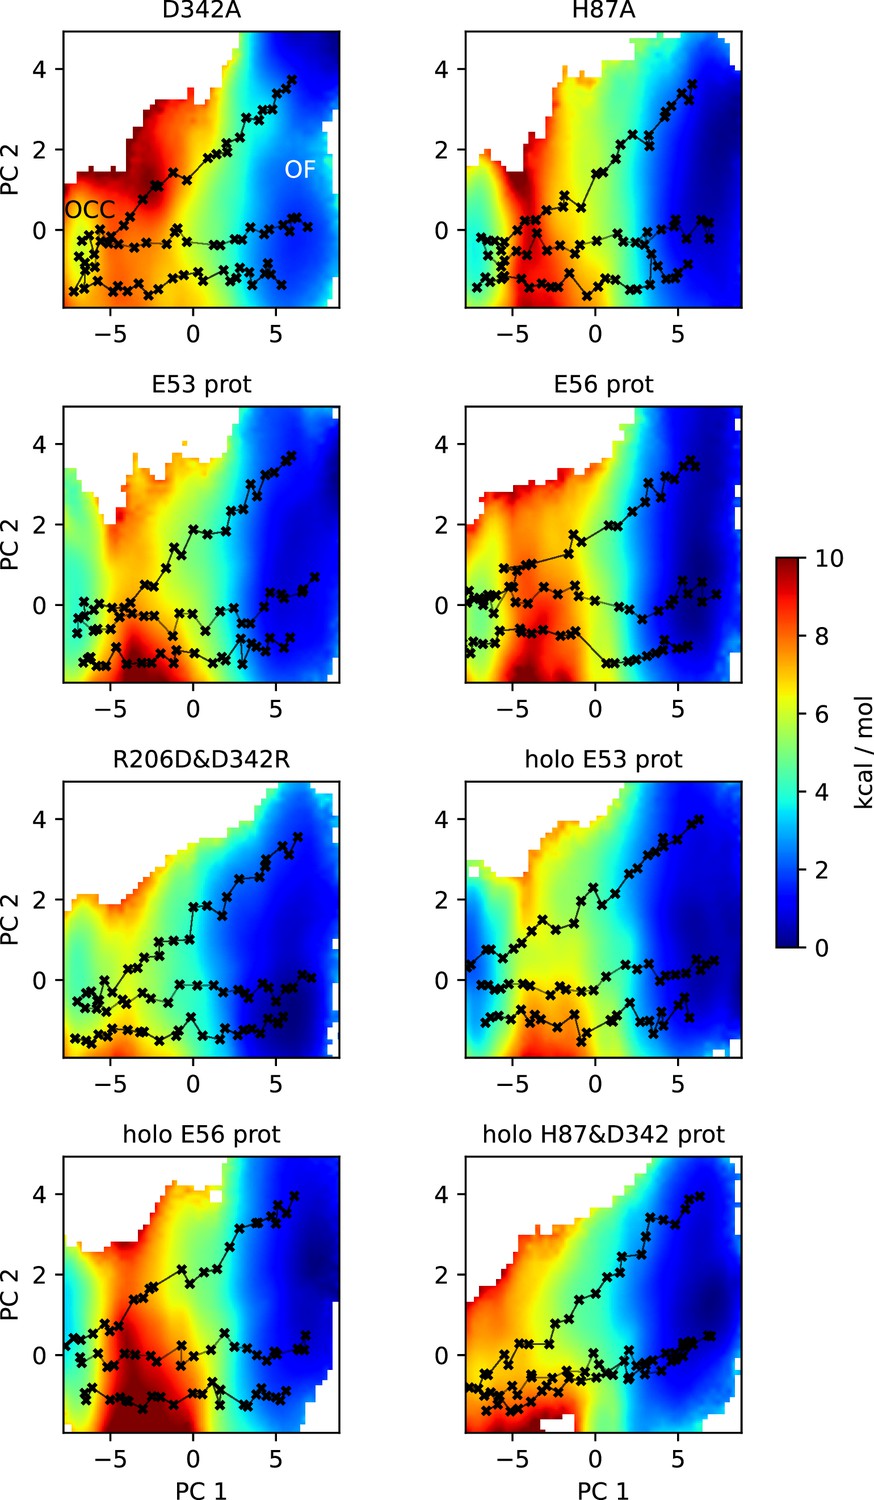
2D-PMFs of the OCC↔OF transition from replica-exchange umbrella sampling (REUS) with Morphing Endstates by Modelling Ensembles with iNdependent TOpologies (MEMENTO) paths in additional protonation state and mutation conditions.
Figure 3—figure supplement 2
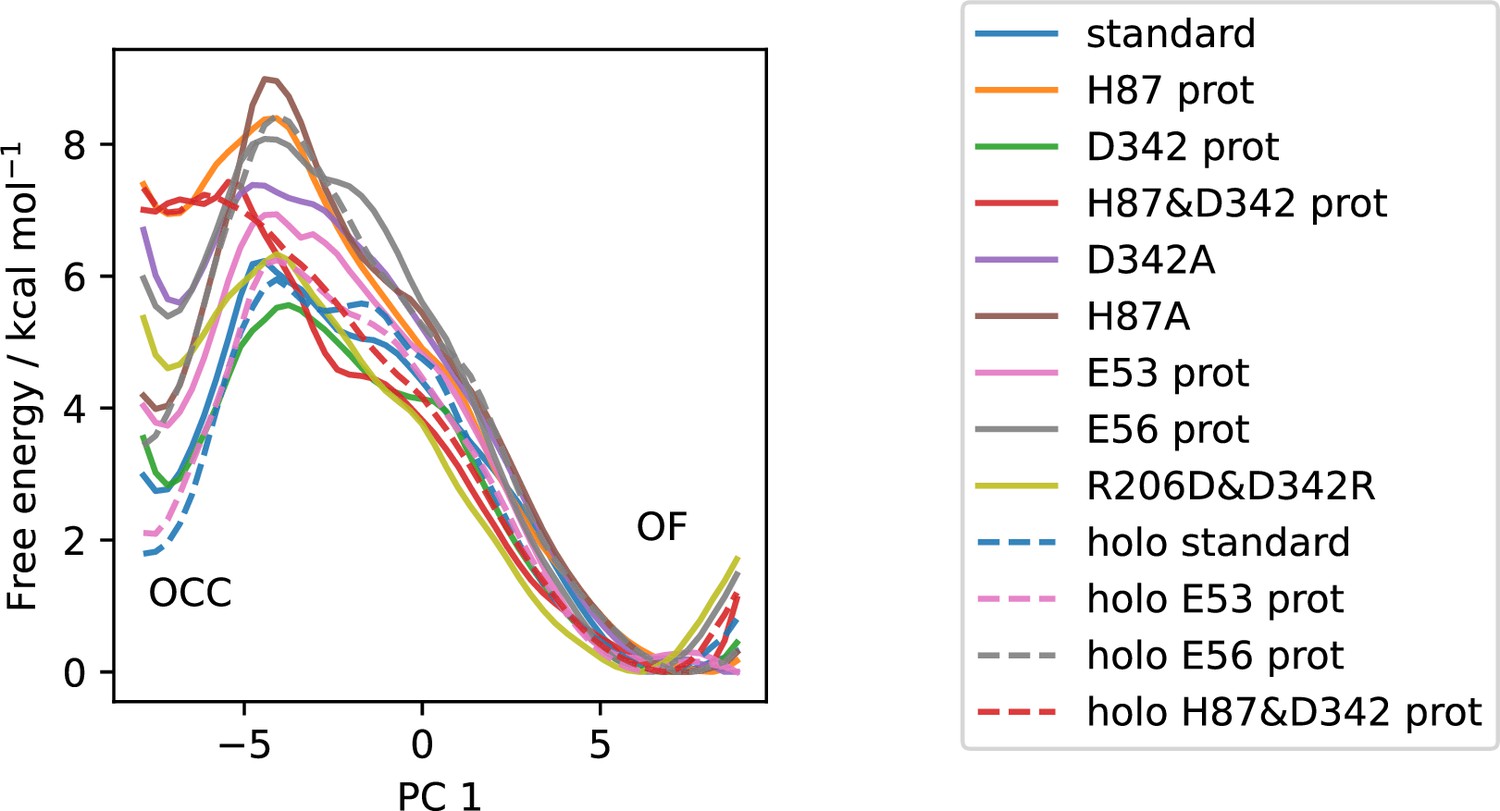
All available OCC↔OF 2D-PMFs, projected onto the first collective variable (CV) (PC 1).
Solid lines are apo PMFs, dashed lines are ala-phe substrate-bound and color-matched to the respective apo PMF. Note that the individual PMFs are only determined by our replica-exchange umbrella sampling (REUS) approach up to additive constants, and are shown aligned here at the outwards-facing (OF) state for convenience of comparison.
Figure 3—figure supplement 3
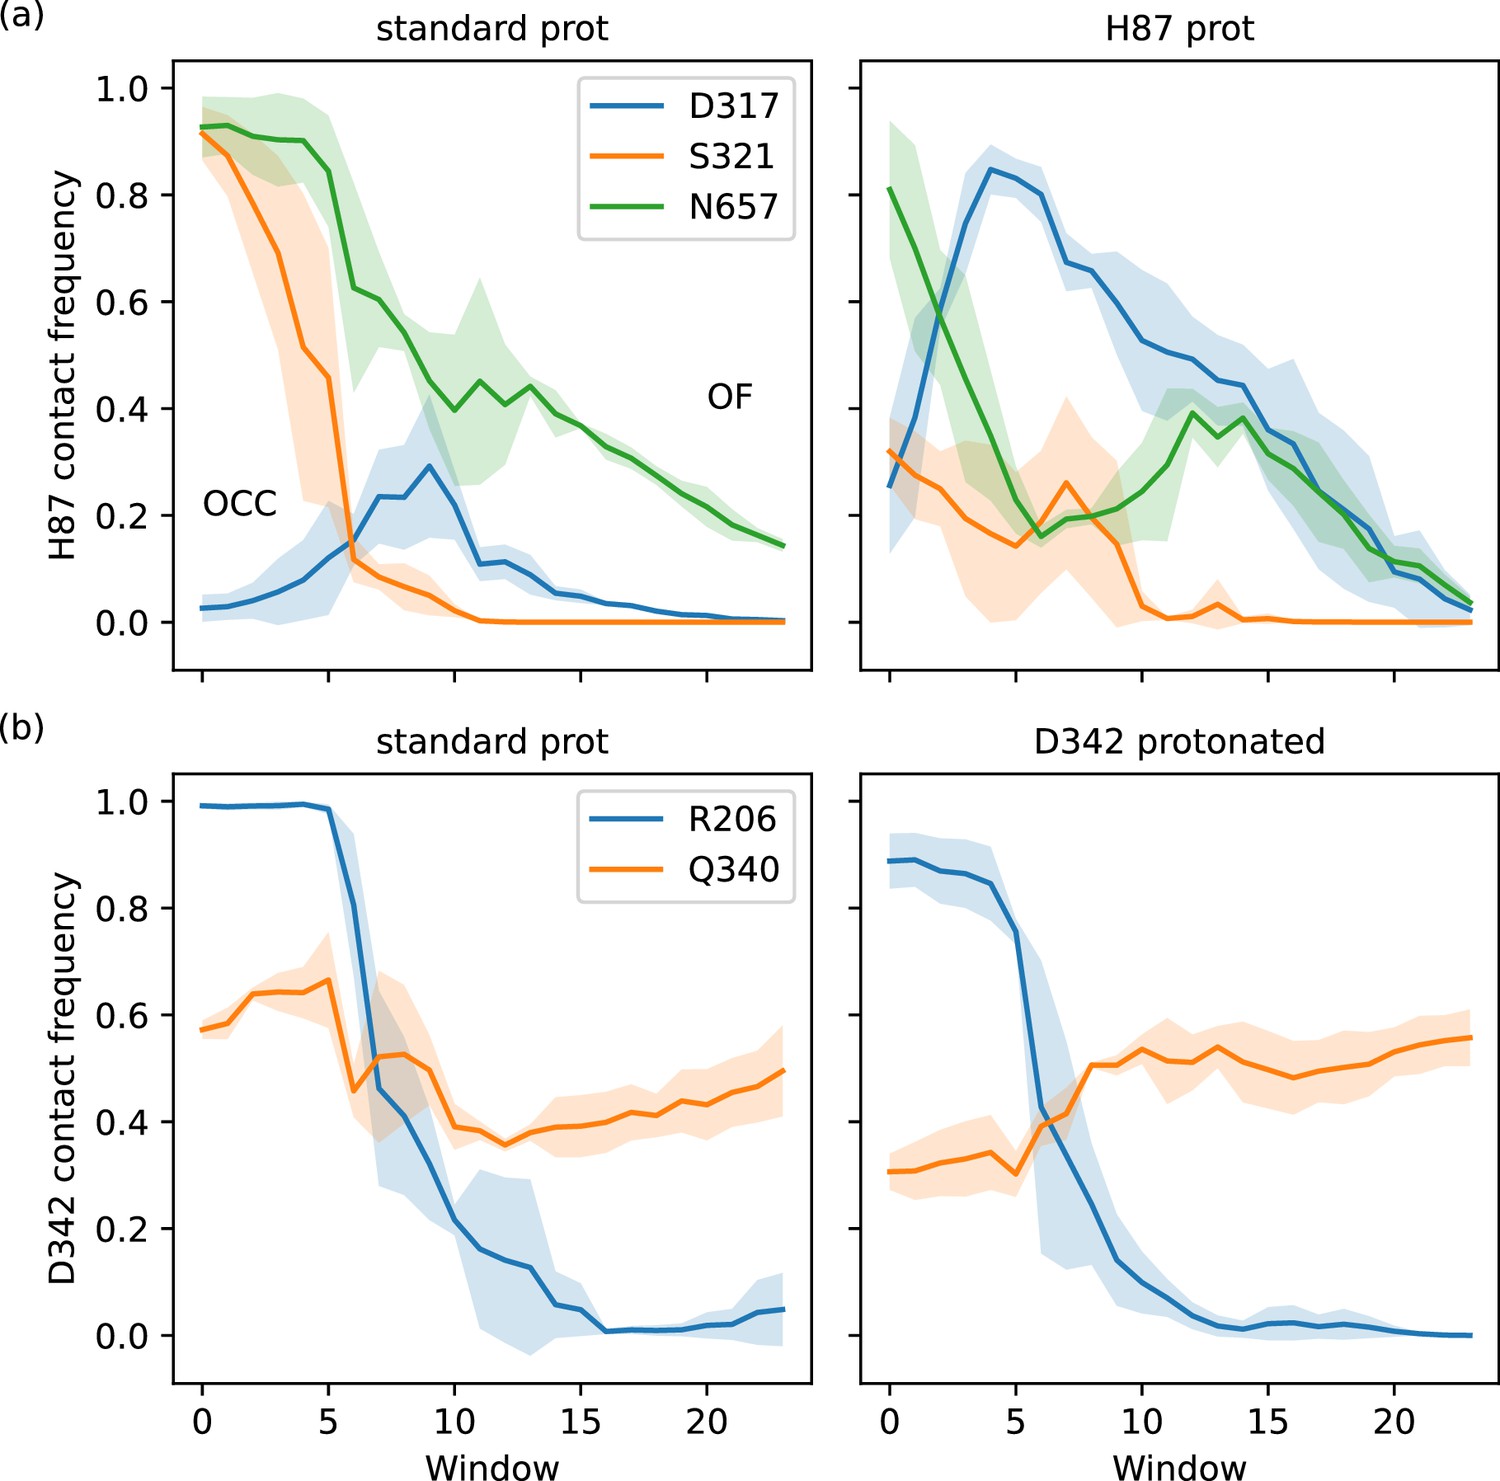
Interaction plots of the 2D-PMF trajectory data (high force constant windows only), calculated as frequencies of finding inter-residue heavy-atom distances smaller than 0.35 nm, shown as a line for the average across three replicates with shaded standard deviations.
(a) H87 interactions with D317, S321, and N657. Protonation of H87 replaces the S321 interaction by an interaction with D317. (b) D342 interactions with R206 and Q340. The tight salt bridge D342–R206 is disrupted by D342 protonation, but the residues still interact in the occluded (OCC) state via hydrogen bonds.
Figure 3—figure supplement 4
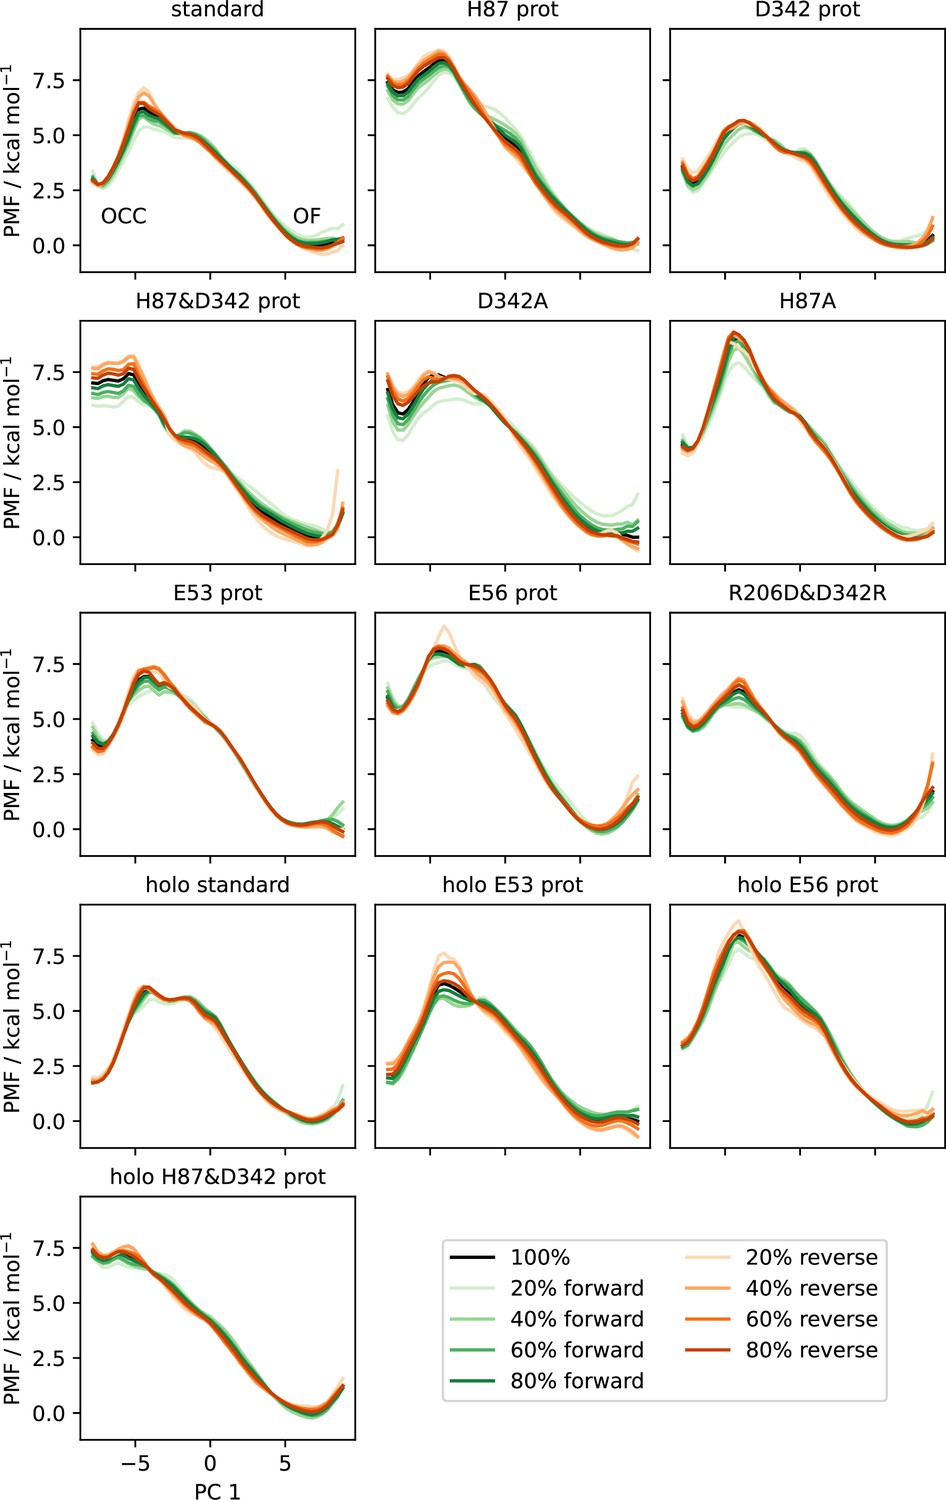
Convergence plots of all OCC↔OF 2D-PMFs, shown as projections onto PC 1 including successively (increasing saturation) more data points, starting from the first frame (green) or from the last frame in reverse (orange).
The PMF using all data is shown in black.
Figure 3—figure supplement 5
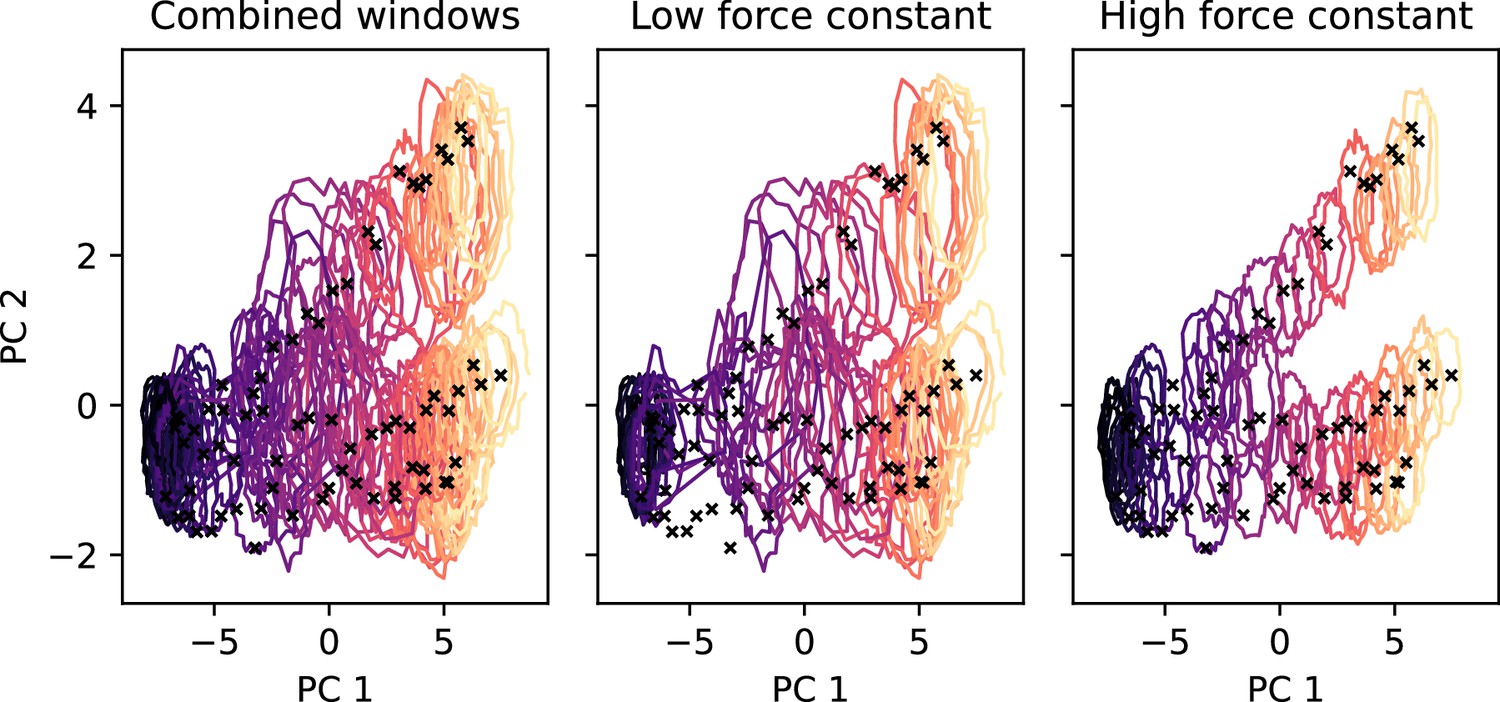
2D-replica-exchange umbrella sampling (REUS) histograms for the OCC↔OF standard protonation state 2D-PMF, drawn as contour lines at 30% of the maximal histogram height for each window (coloured by window, from purple at occluded (OCC) to yellow at outwards-facing (OF)).
Black crosses indicate the Morphing Endstates by Modelling Ensembles with iNdependent TOpologies (MEMENTO)-derived REUS starting frames. Using the lower force constant (see Materials and methods) gives good overlap in the basin regions while the transition region is undersampled. Using the higher force constant gives good overlap in the transition region while the basins are not sampled widely enough. Combining all windows results in good overlap across the 2D-collective variable (CV) space.
Figure 4 with 3 supplements
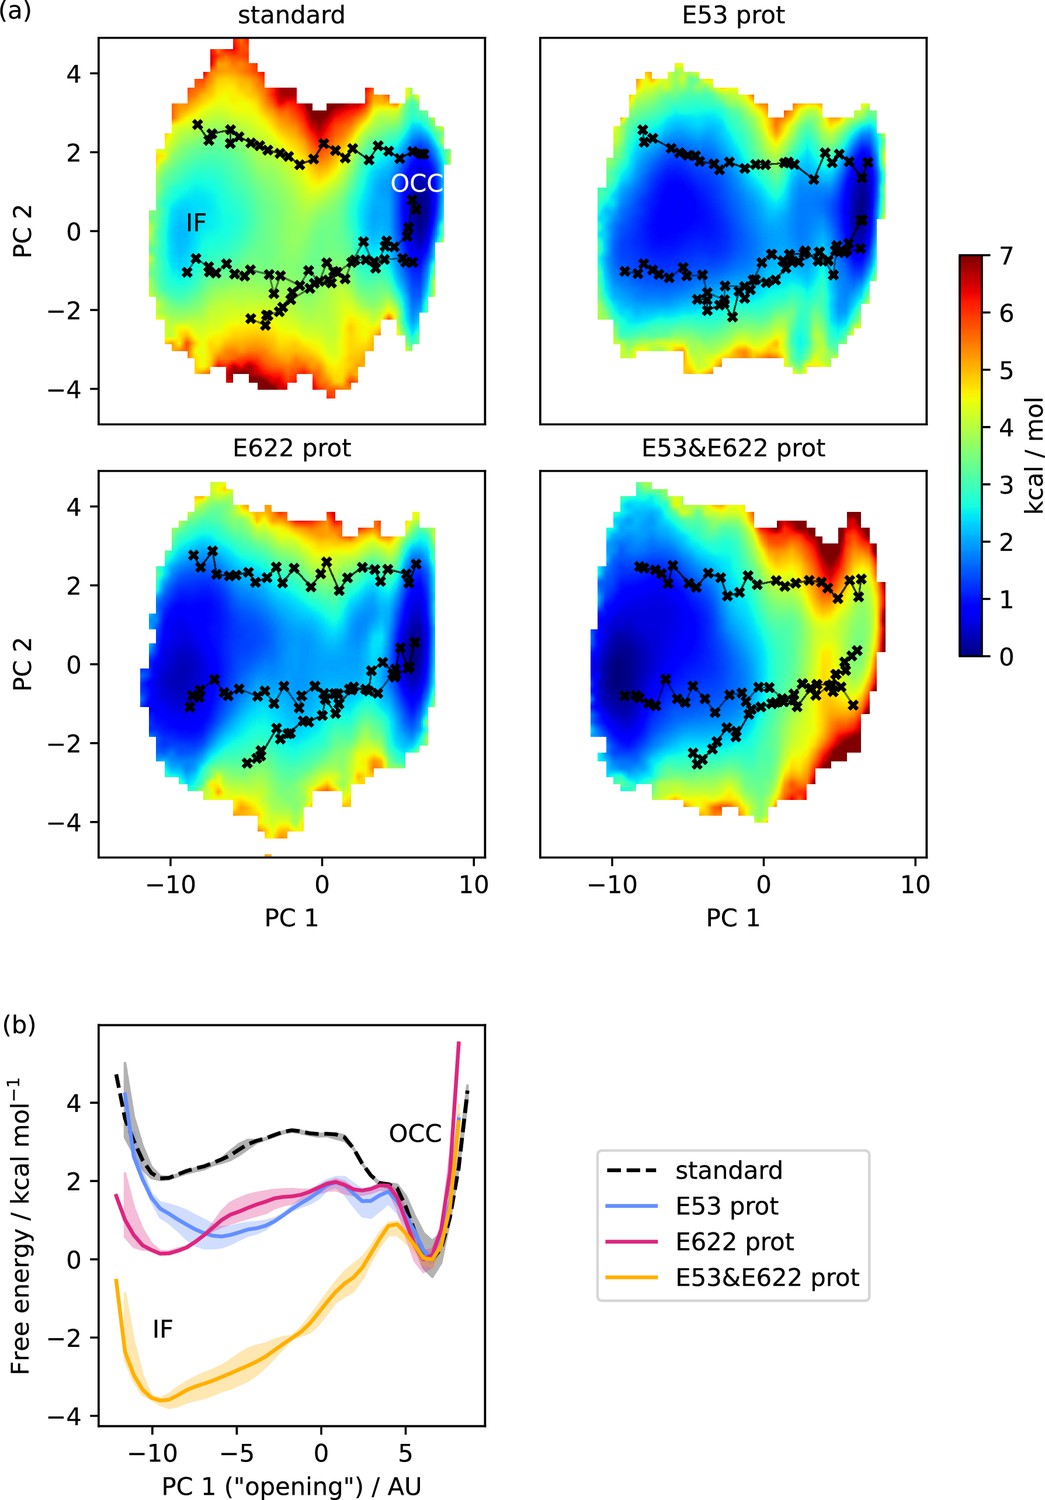
Free energy surfaces for the OCC-IF transition.
(a) 2D-PMFs from replica-exchange umbrella sampling (REUS) starting with Morphing Endstates by Modelling Ensembles with iNdependent TOpologies (MEMENTO) paths, in different protonation states of candidate intracellular gate-controlling residues. (b) Projection of the 2D-PMFs in part a onto PC 1 using Boltzmann reweighting. Shaded areas indicate convergence errors as the range of PMF values for a given collective variable (CV) value obtained with the first 40%, the last 40%, and 100% of sampling included (after alignment to the 100% curve). E53 and E622 protonation have additive and approximately equal effects on driving the OCC→IF transition. Note that the individual PMFs are only determined by our REUS approach up to additive constants, and are shown aligned here at the IF state for convenience of comparison.
Figure 4—figure supplement 1
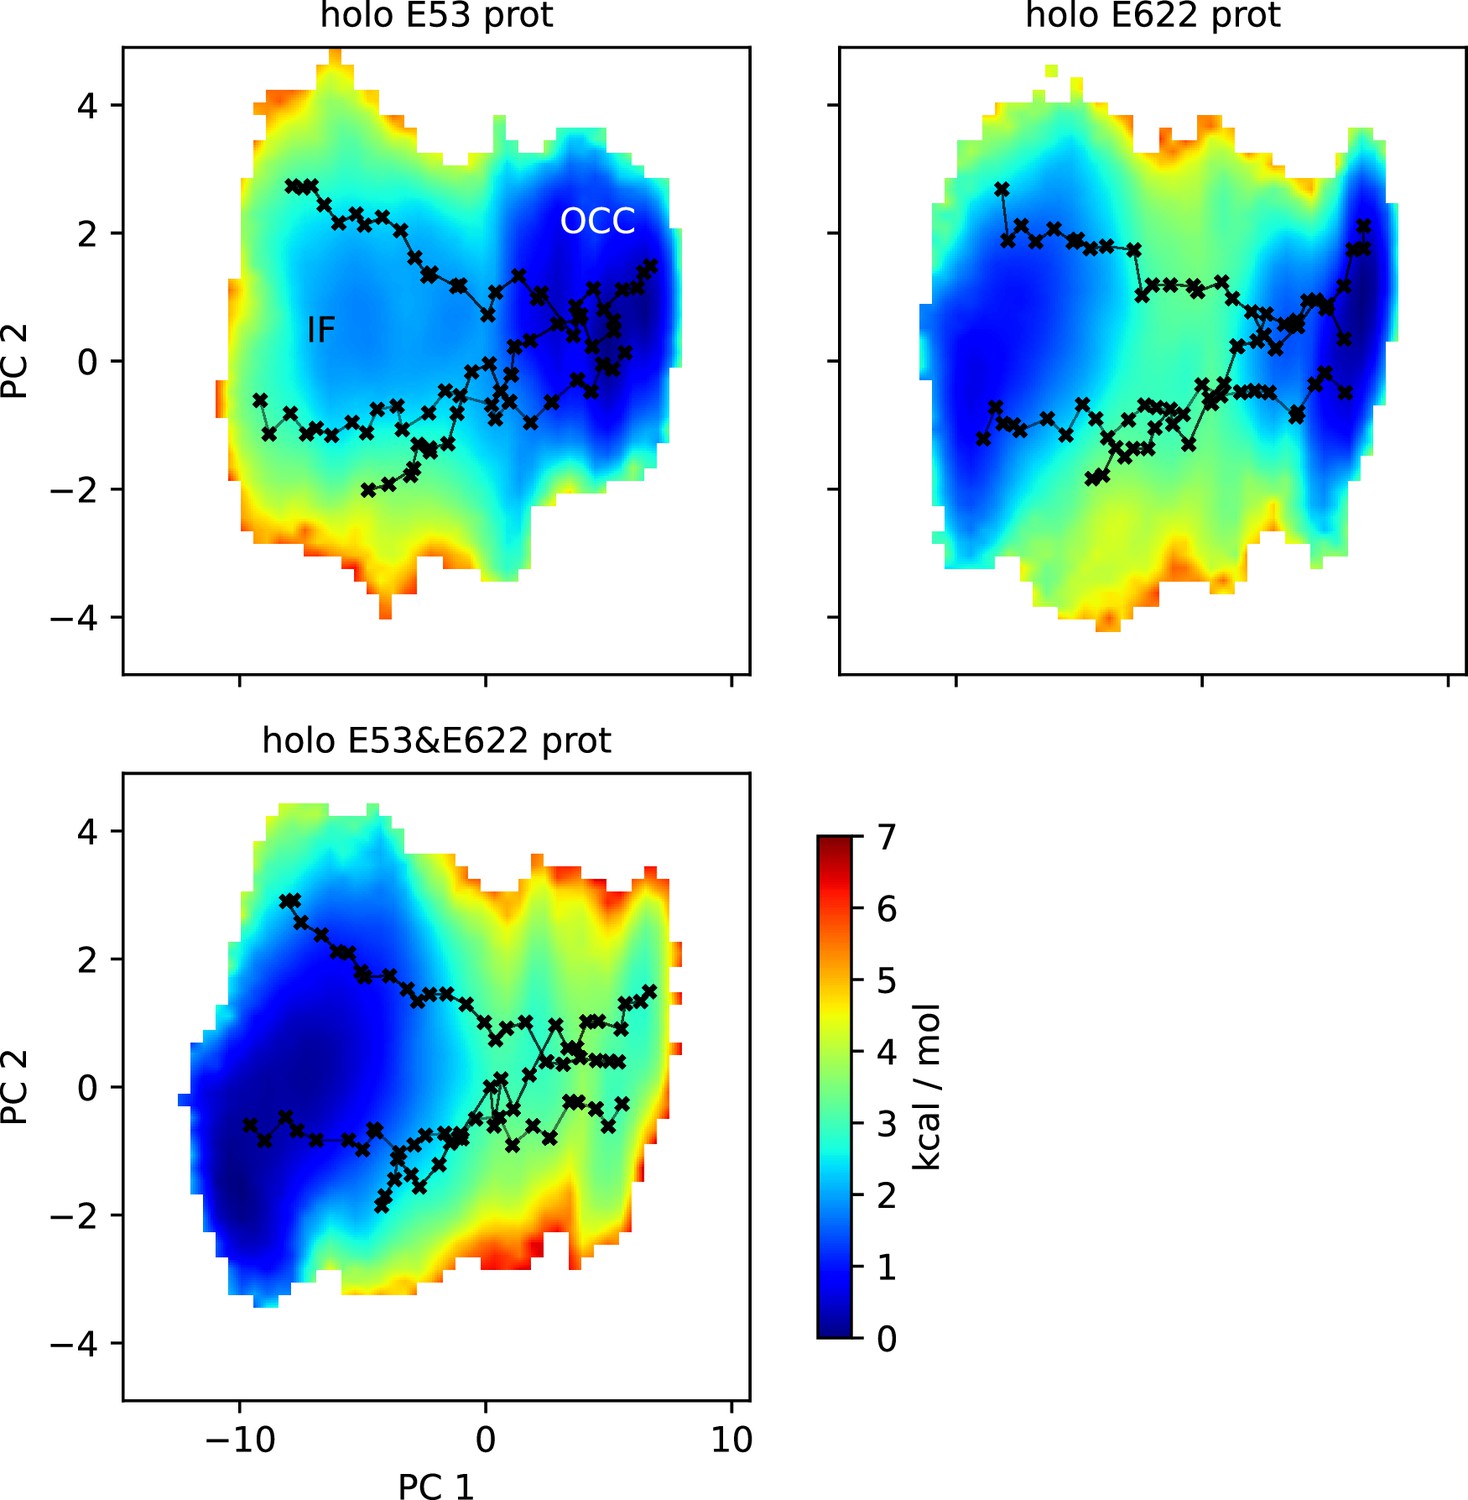
2D-PMFs of the OCC↔IF transition from replica-exchange umbrella sampling (REUS) with Morphing Endstates by Modelling Ensembles with iNdependent TOpologies (MEMENTO) paths in additional substrate-bound protonation state conditions.
Figure 4—figure supplement 2
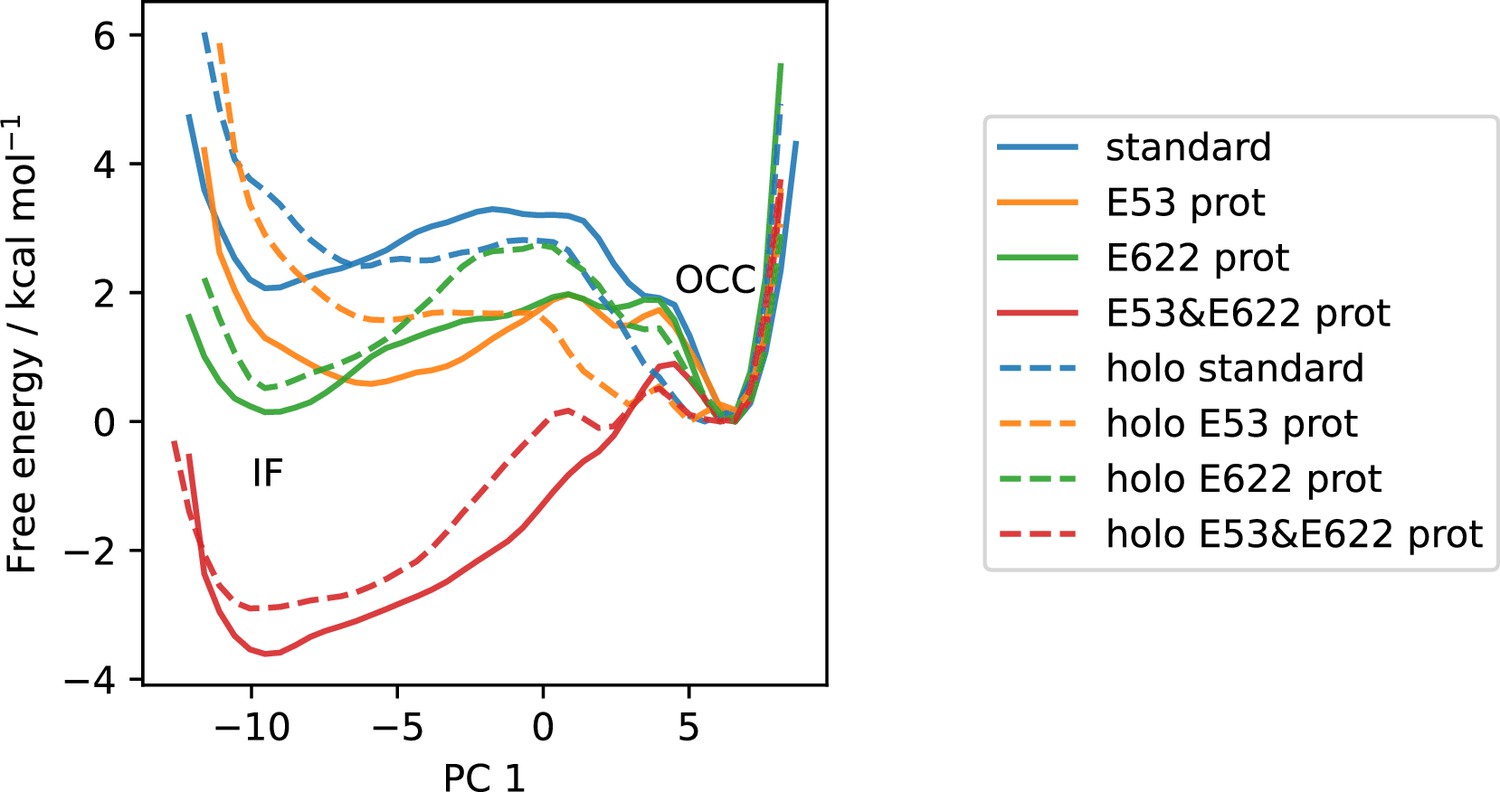
All available OCC↔IF 2D-PMFs, projected onto the first collective variable (CV) (PC 1).
Solid lines are apo PMFs, dashed lines are ala-phe substrate-bound and color-matched to the respective apo PMF. Note that the individual PMFs are only determined by our replica-exchange umbrella sampling (REUS) approach up to additive constants, and are shown aligned here at the inwards-facing (IF) state for convenience of comparison.
Figure 4—figure supplement 3
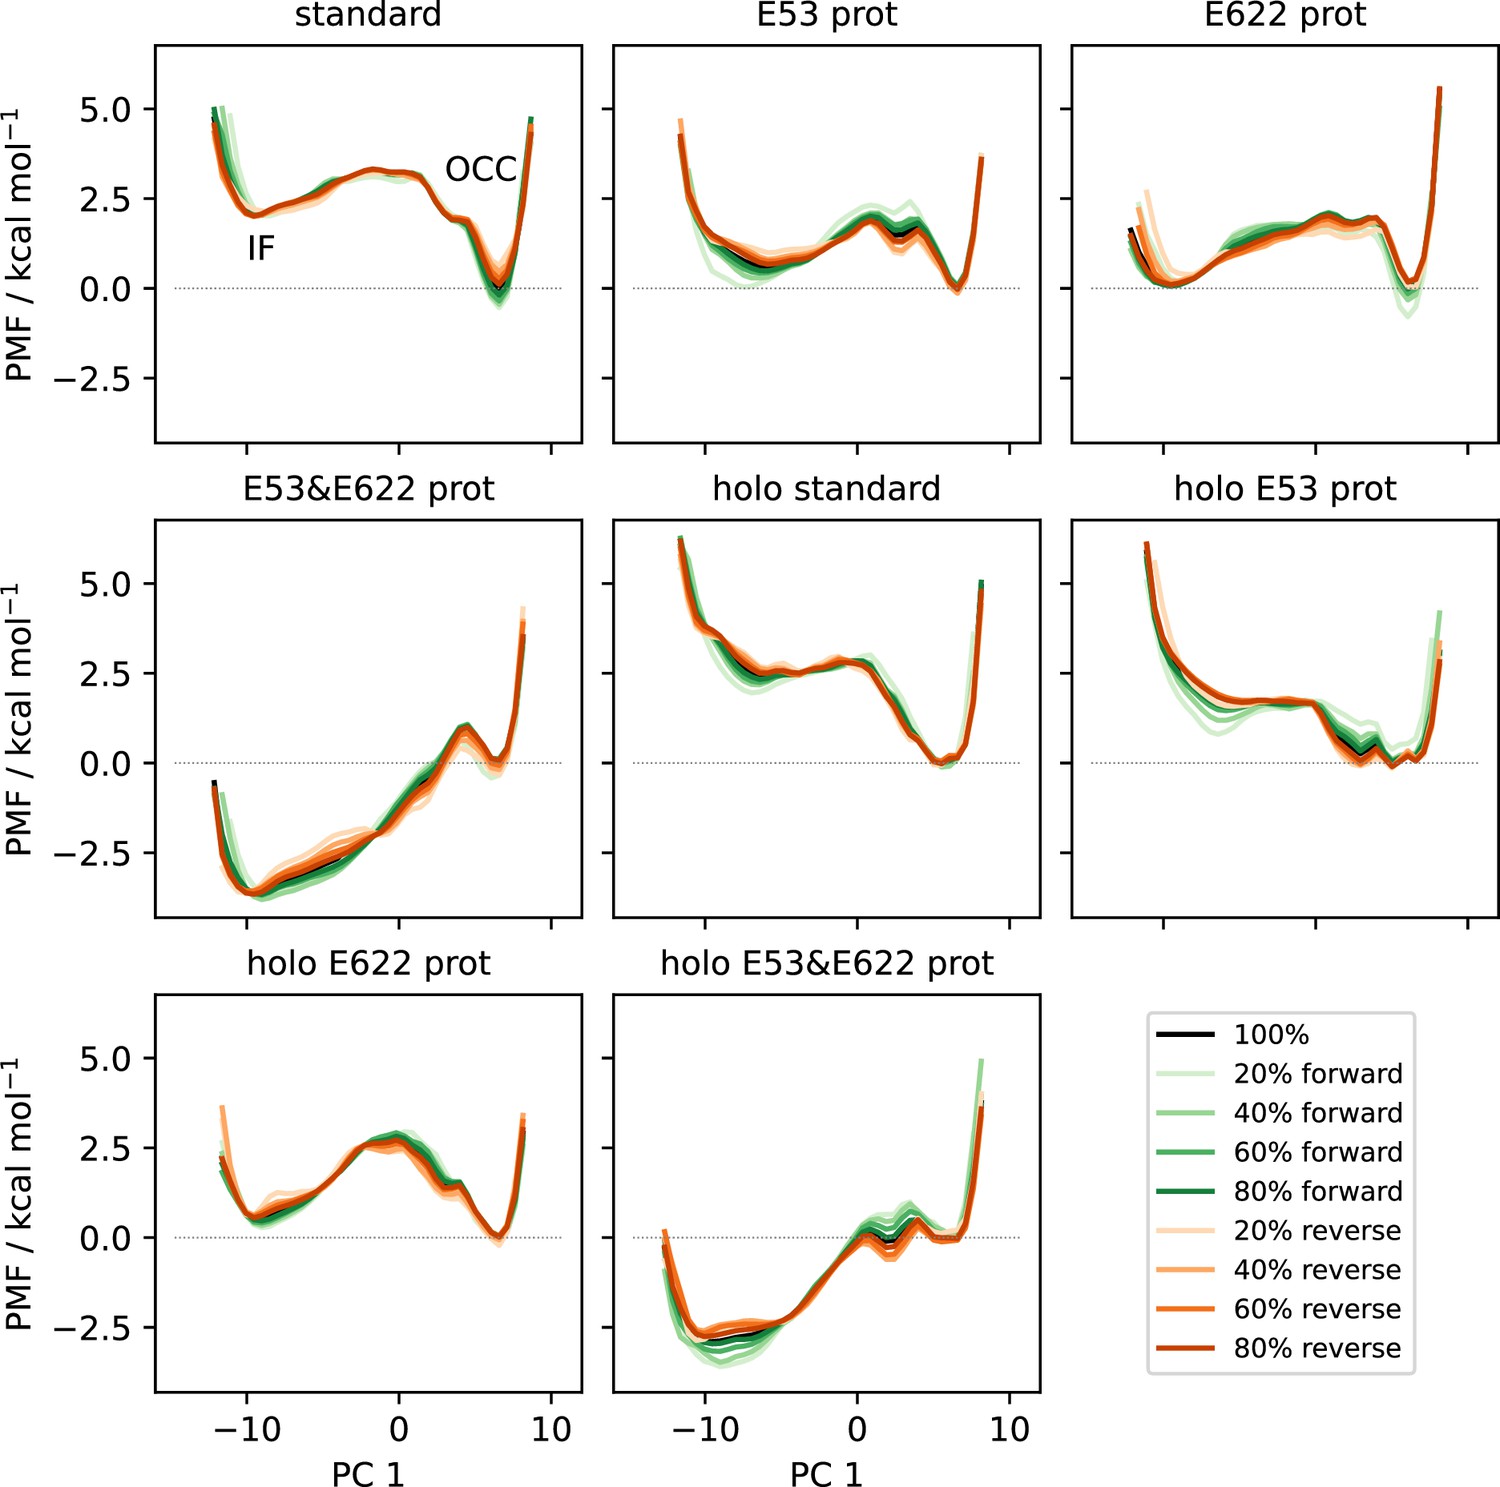
Convergence plots of all OCC↔IF 2D-PMFs, shown as projections onto PC 1 including successively (increasing saturation) more data points starting from the first frame (green) or from the last frame in reverse (orange).
The PMF using all data is shown in black.
Figure 5
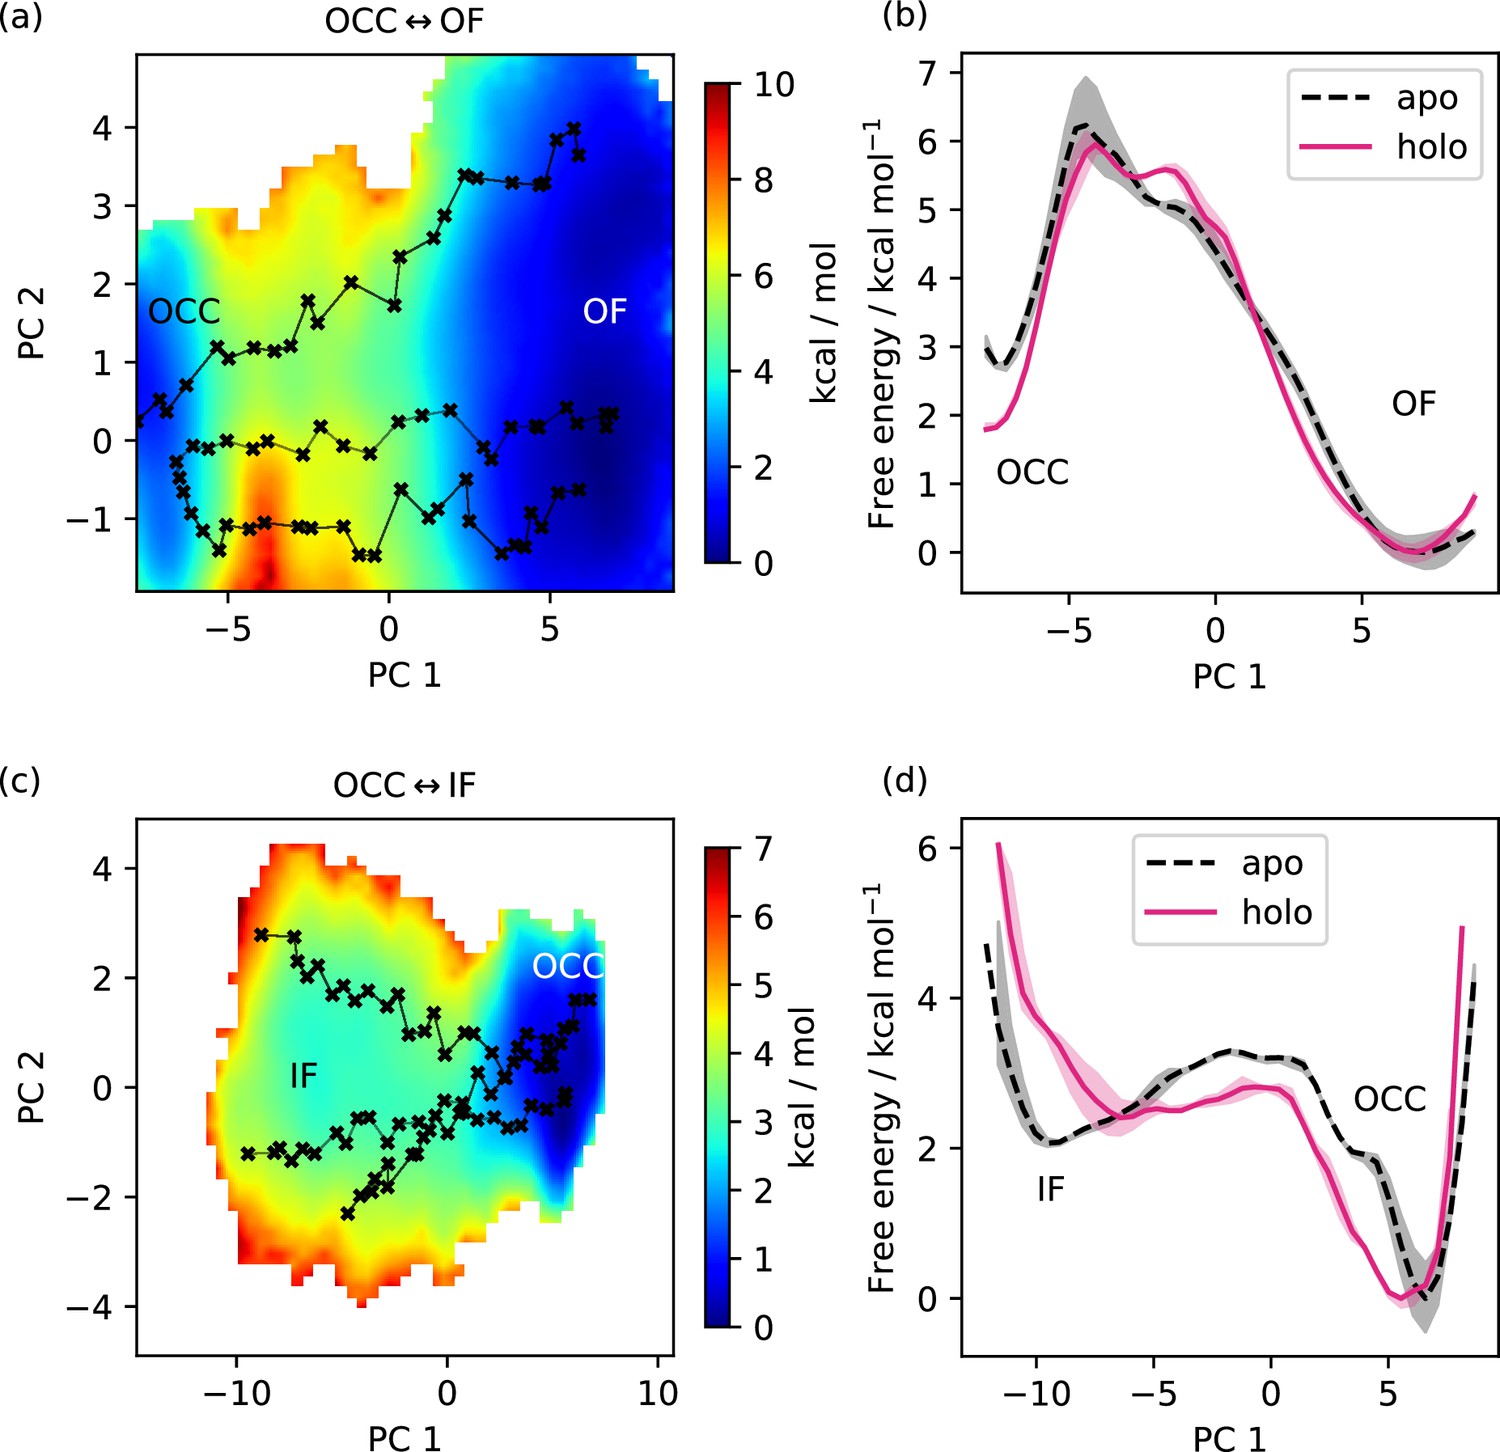
Dependence of free energy surface on presence or absence of substrate.
(a) 2D-PMF for the OCC↔OF transition from replica-exchange umbrella sampling (REUS) starting with Ala-Phe-bound PepT2 Morphing Endstates by Modelling Ensembles with iNdependent TOpologies (MEMENTO) paths. The occluded (OCC) state has an increased basin width in PC 2 (compared to Figure 3a), and a transition path shifted in PC 2. (b) Projection of the PMF from panel a onto PC 1, showing how in holo PepT2, the OCC state is stabilised by ≈1 kcal mol−1. Shaded areas indicate convergence errors as the range of PMF values for a given collective variable (CV) value obtained with the first 40 %, the last 40%, and 100% of sampling included (after alignment to the 100% curve). Note that the individual PMFs are only determined by our REUS approach up to additive constants, and are shown aligned here at the OF state for convenience of comparison. (c) 2D-PMF for the OCC↔IF transition from REUS starting with Ala-Phe-bound PepT2 MEMENTO paths. The structure of the inwards-facing (IF) plateau is not significantly affected, but OCC is more flexible in PC 1. (d) Projection of the PMF from panel c onto PC 1, showing how in holo PepT2, the OCC state has a broader basin, corresponding to intracellular-gate flexibility. Convergence error and alignment of PMFs are shown in panel b.
Figure 6 with 3 supplements
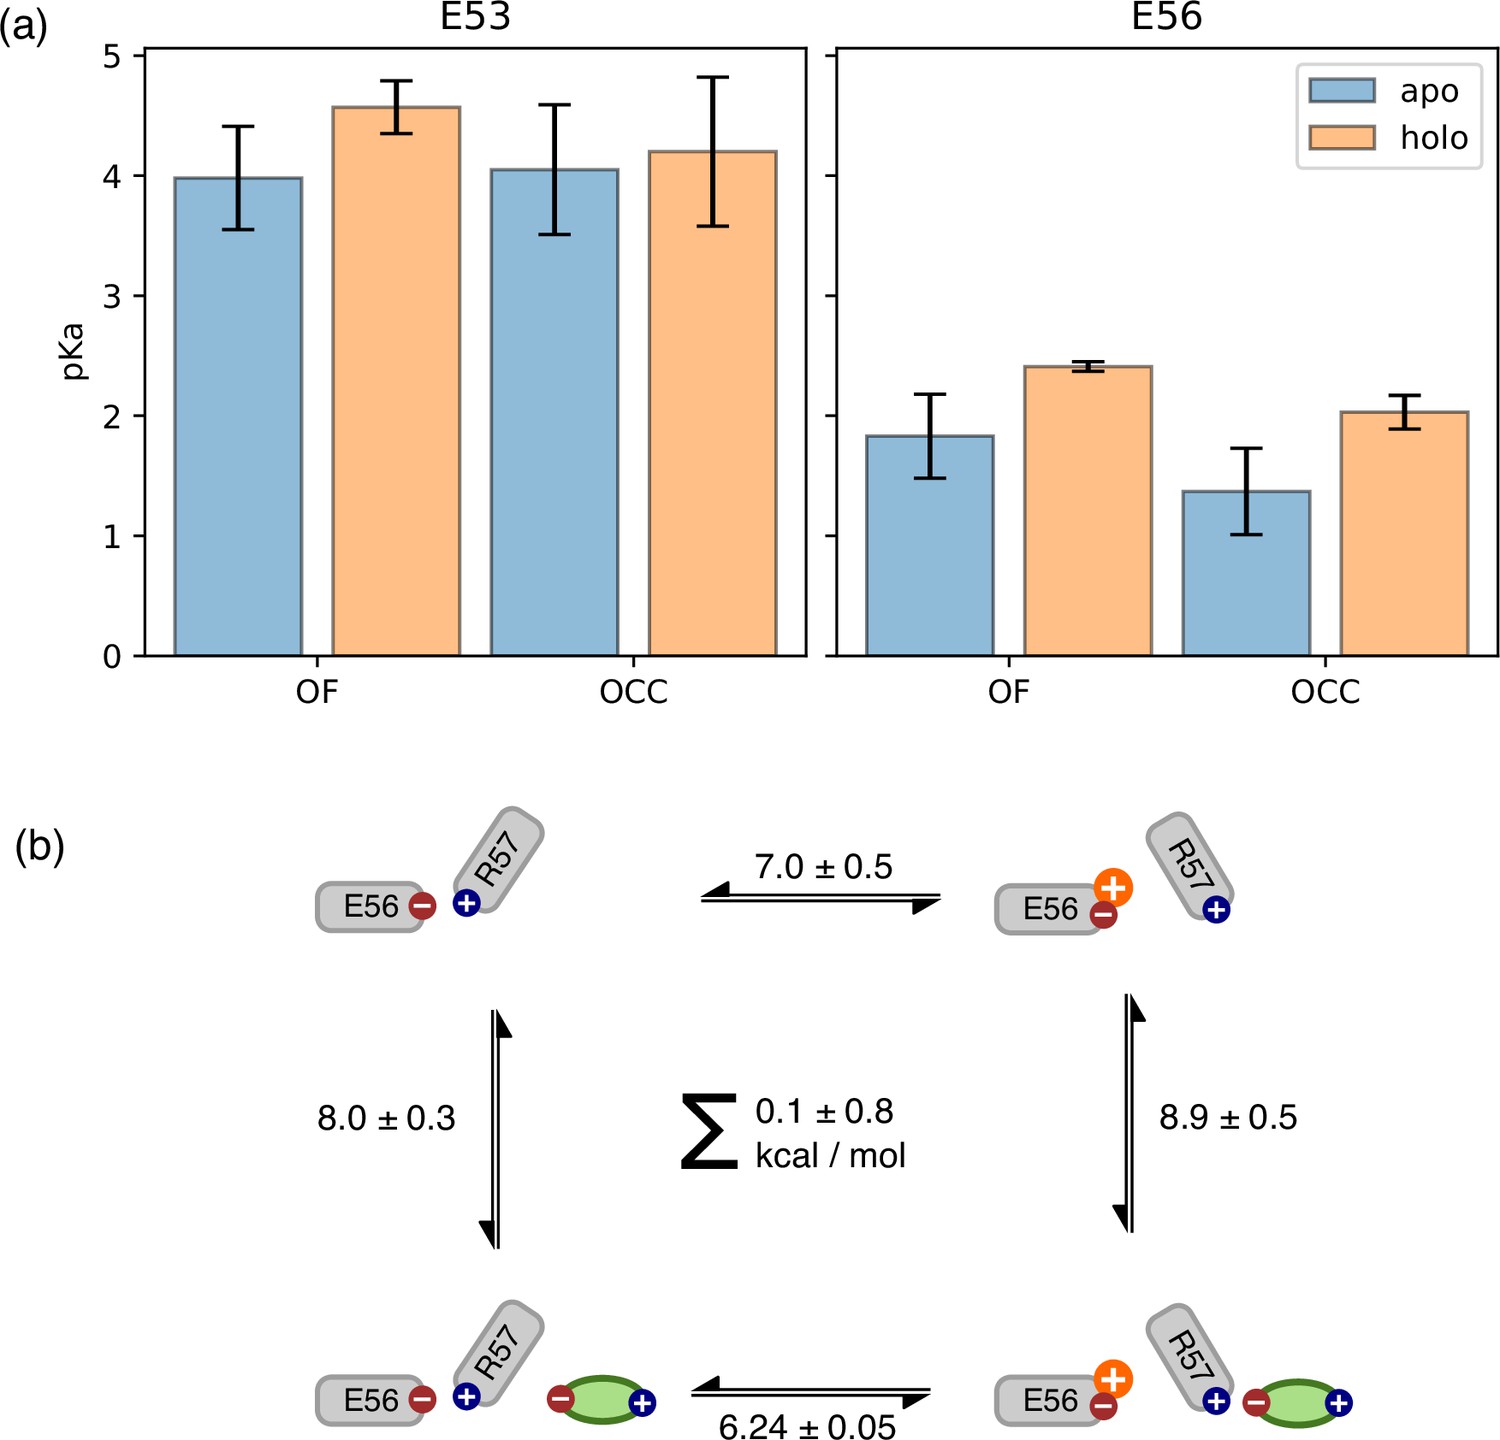
Use of constant pH simulations to investigate influence of substrate on pKa values.
(a) E53 and E56 pKa values from constant-pH molecular dynamics (MD) simulations, in the apo and holo as well as the outwards-facing (OF) and occluded (OCC) states, estimated as mean ± standard deviation from triplicate runs (using the full simulation data for fitting the titration curves). The presence of substrate raises the E56 pKa in either conformational state, while some effect on the E53 pKa may also exist in the OF state. (b) Illustration of a themodynamic cycle of E56 protonation and Ala-Phe binding, with edges filled in via constant pH simulations (CpHMD) (converted into kcal mol–1 at pH 7) for the top and bottom transitions, and absolute binding free energy (ABFE) for the left and right edges. Notably, ABFE displays a response of Ala-Phe affinity to E56 is consistent with the CpHMD results, and the cycle closes very well. The error in the cycle closure residual is estimated as a square root of the sum of squared standard deviations of the individual edges.
Figure 6—figure supplement 1
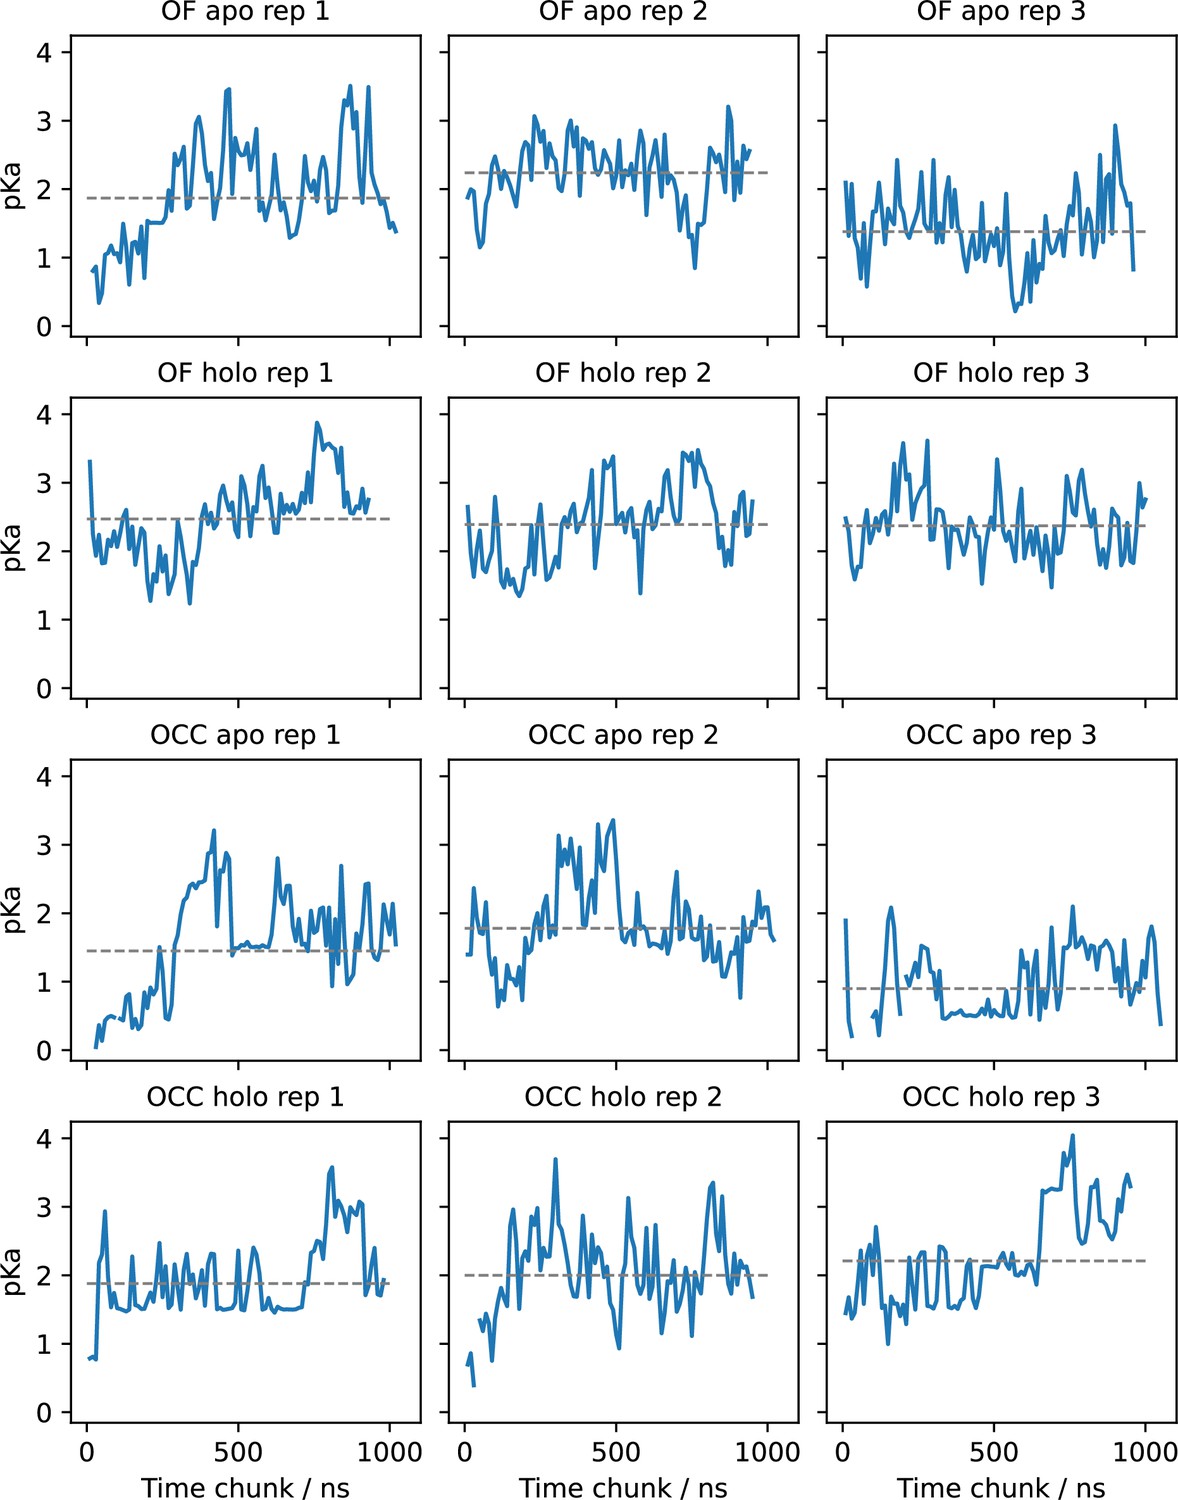
E53 pKa values estimated for (separate) successive chunks of 80 ns (10 ns per pH window) of constant pH simulations (CpHMD) via fitting the Hill equation.
Grey lines indicate the pKa resulting from fitting the total simulation data. The pKa values appear highly dynamic and superimpose several relaxation timescales. Convergence seems to be achieved in most replicates but is not straightforward to assess.
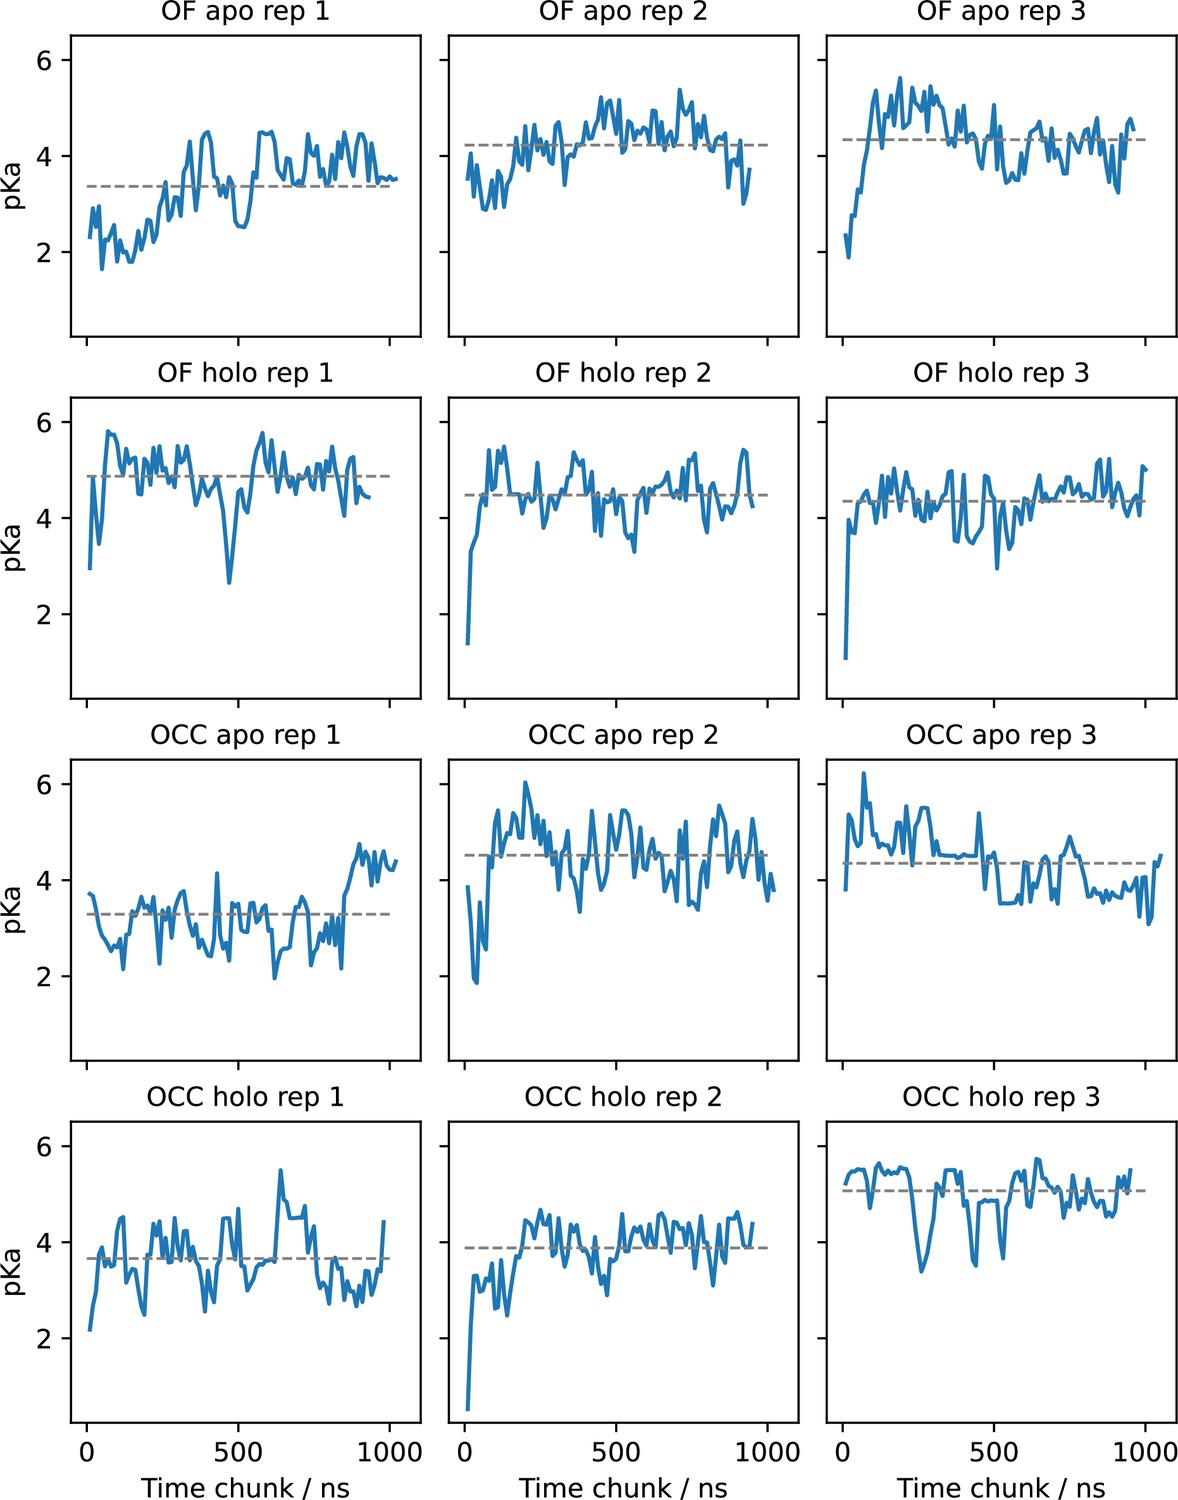
Figure 6—figure supplement 2
E56 pKa values estimated for (separate) successive chunks of 80 ns (10 ns per pH window) of constant pH simulations (CpHMD) via fitting the Hill equation.
Grey lines indicate the pKa resulting from fitting the total simulation data. The pKa values appear highly dynamic and superimpose several relaxation timescales. Convergence seems to be achieved in most replicates but is not straightforward to assess.
Figure 6—figure supplement 3
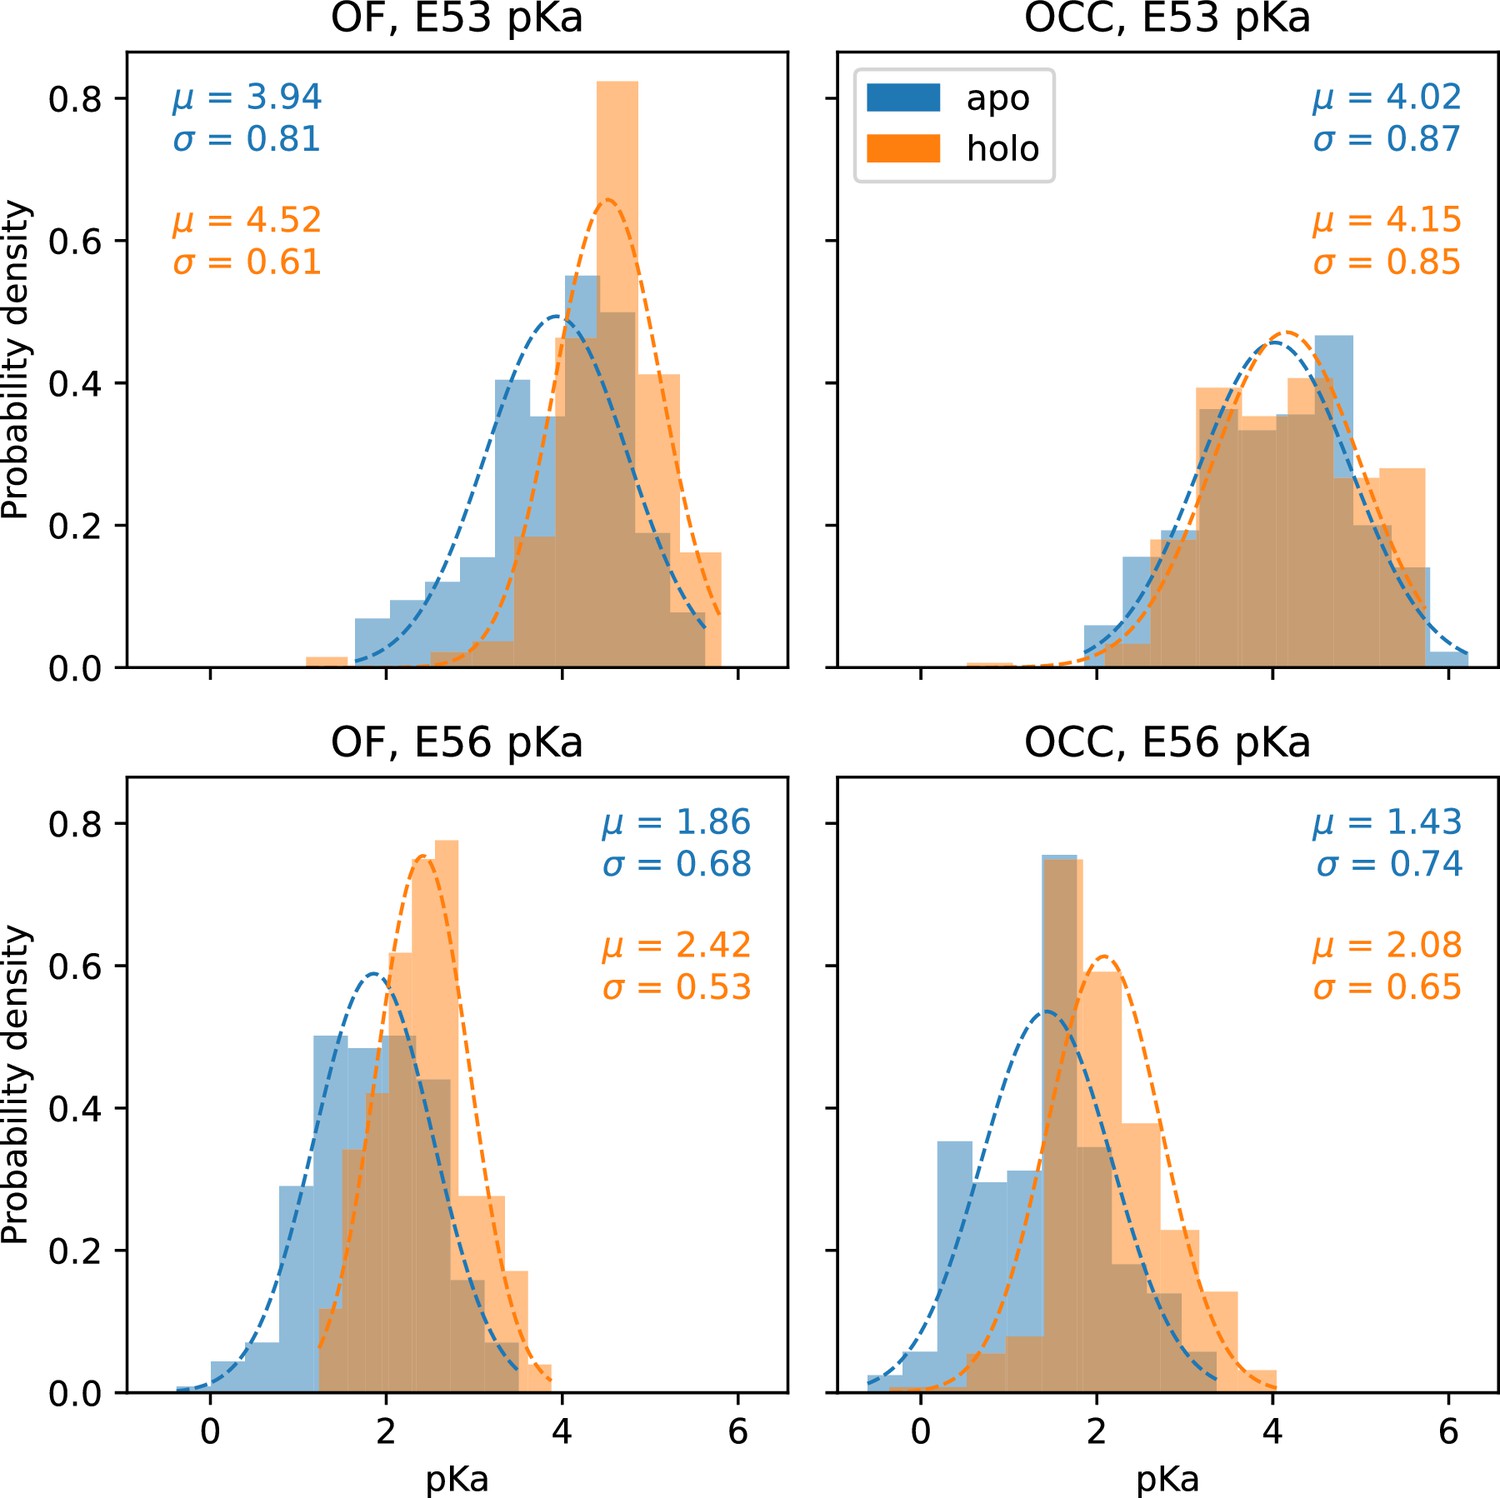
Histograms of the pKa values estimated from chunks of 80 ns (10 ns per pH window) of constant pH simulations (CpHMD), pooled for all trajectories of a given condition.
Apo conditions are shown in blue, holo (ala-phe bound) are shown in orange. Gaussian fits are indicated by dashed lines and the resulting fit parameters are given in the respective color for each histogram.
Figure 7 with 1 supplement
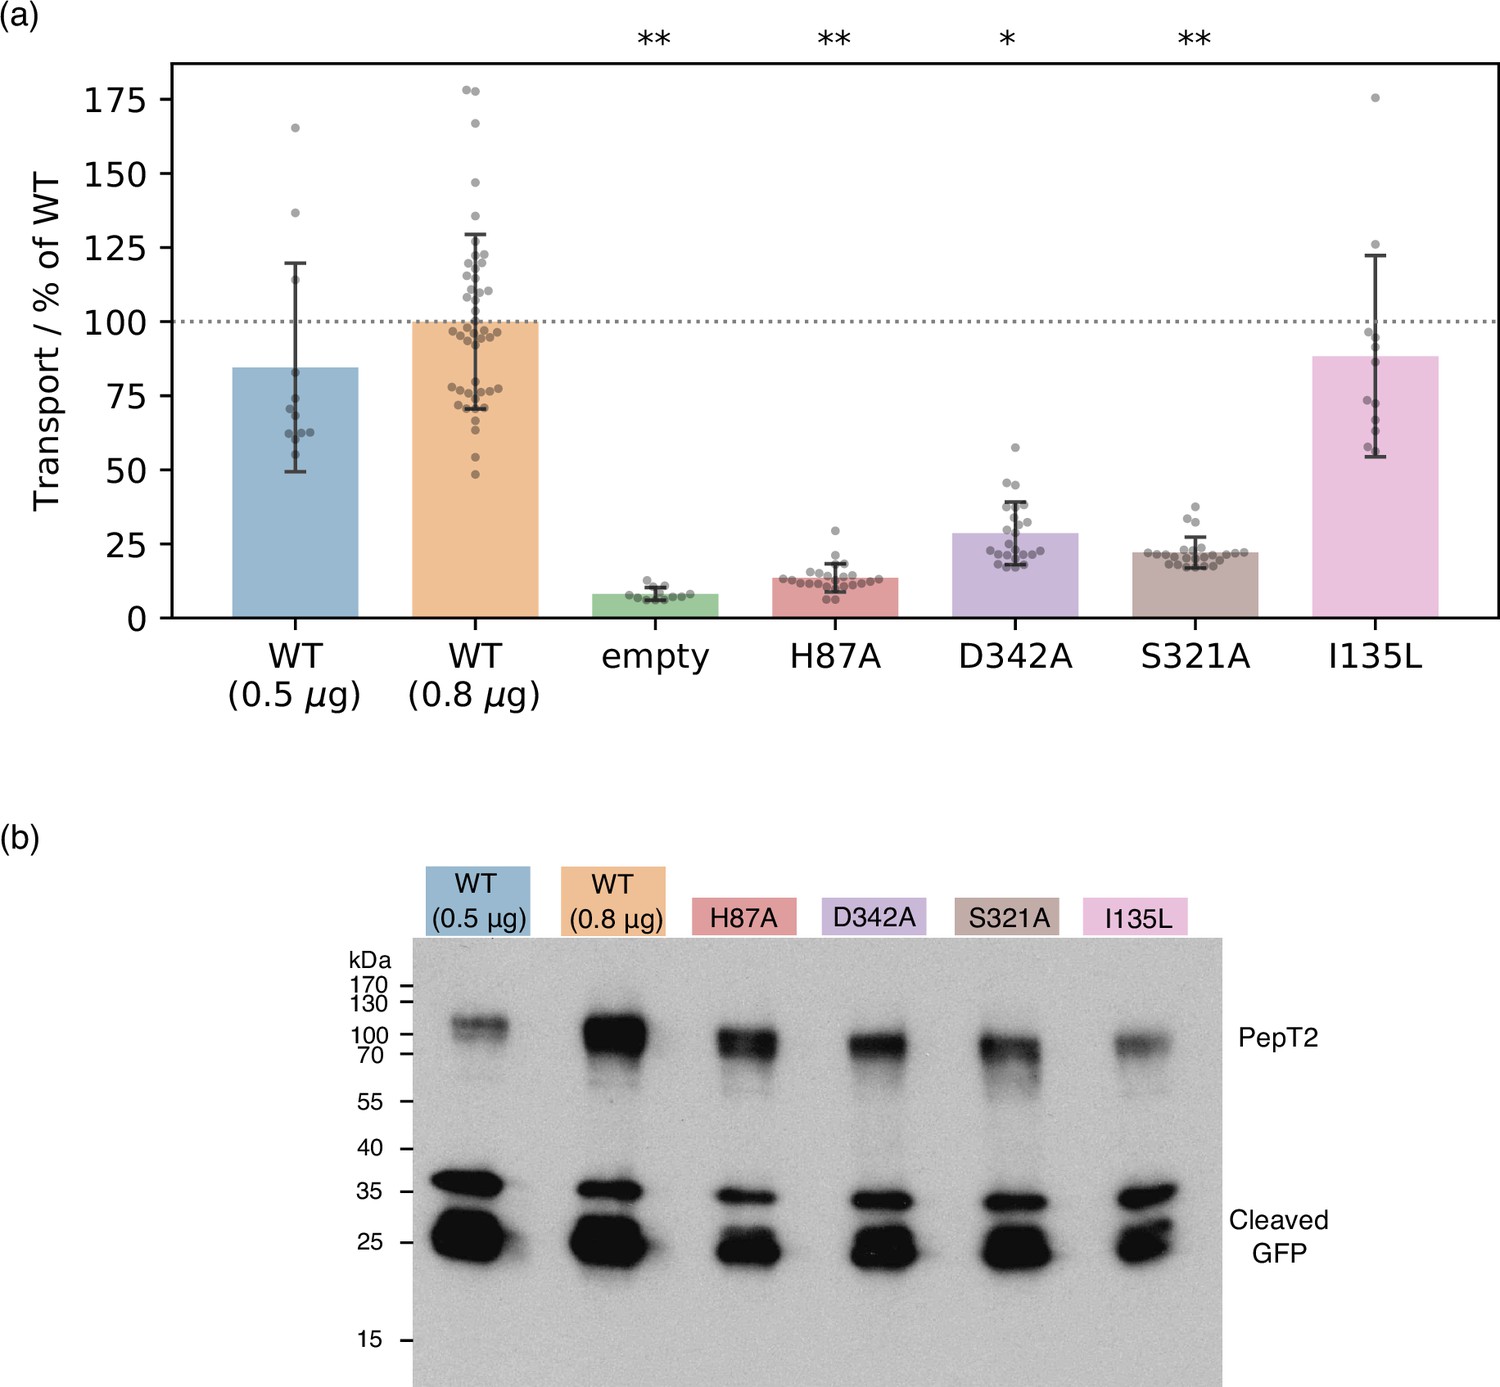
Experimental validation of computational predictions.
(a) Cell-based transport assays for PepT2 wild-type (WT) (transfected with 0.5 μg, n=12, and 0.8 μg, n=46, of DNA per well), empty plasmid vector (n=12) and PepT2 H87A, D342A, S321A (n=24 each) and I135L (n=12) mutants, all transfected with 0.8 μg of DNA. Diagram shows transport as fluorescence in post-assay lysate divided by total protein concentration, normalised to the WT (0.8 μg) mean. Bars are mean values plus minus standard deviation, and swarm plots samples corresponding to individual wells. Single asterisk indicates , double asterisks significance levels for difference compared to (weaker transporting, 0.5 μg-transfected) WT, as evaluated using a two-tailed t-test. (b) Western-blot showing expression levels of WT and mutant GFP-labelled PepT2, with an anti-GFP primary antibody. All mutants express at levels between the WT transfected with 0.5 μg and 0.8 μg plasmid DNA. Cleaved GFP is also visible at low molecular weight, at levels comparable for WT and mutants.
-
Figure 7—source data 1
Raw gel image for Figure 7b.
- https://cdn.elifesciences.org/articles/96507/elife-96507-fig7-data1-v1.pdf
Figure 7—figure supplement 1
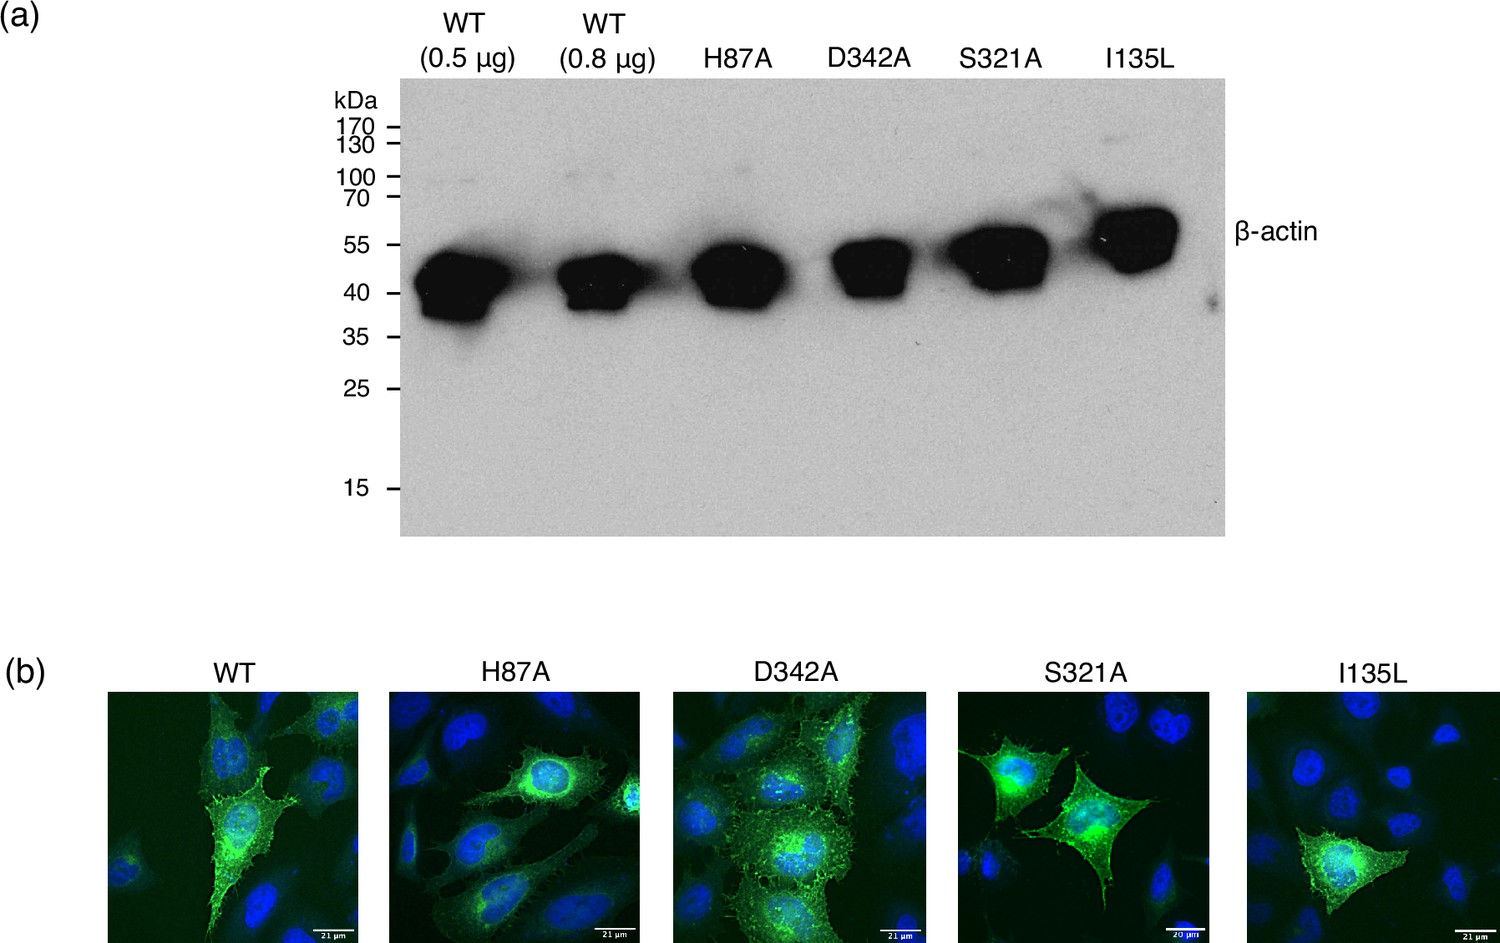
Control data for cell-based transport assays.
(a) Loading control of the Western blot shown in Figure 7b, using an antibody against β-actin, showing even loading of the gel. (b) Fluorescence microscopy images, overlaying GFP-labelled PepT2 (green) with DAPI-labelled DNA (blue). Membrane expression is qualitatively shown for wild-type (WT) and all mutants by the thin cell outline of GFP.
-
Figure 7—figure supplement 1—source data 1
Raw gel image for Figure 7—figure supplement 1.
- https://cdn.elifesciences.org/articles/96507/elife-96507-fig7-figsupp1-data1-v1.pdf
Figure 8
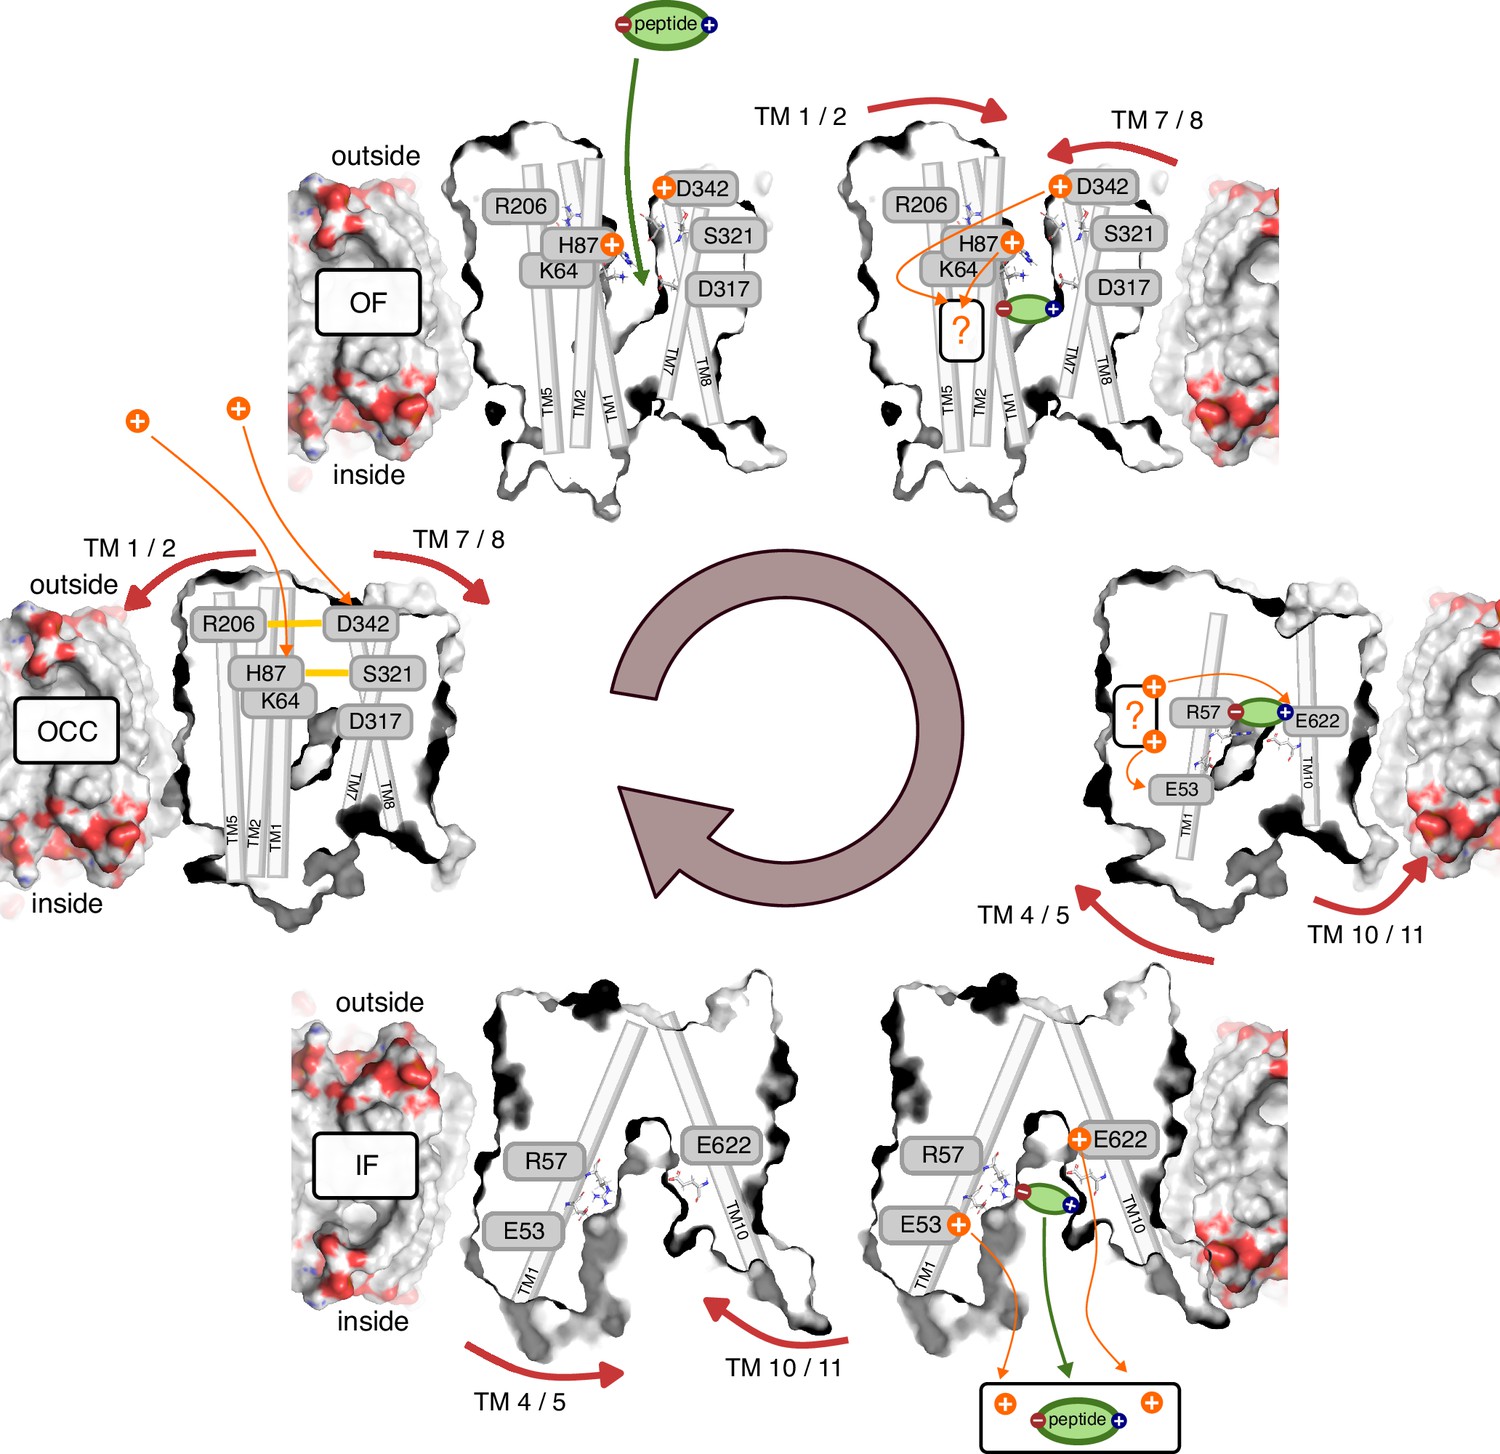
Schematic overview of the PepT2 alternating-access transport cycle proposed in this work.
Protons located at a question mark indicate a proton-transfer step with an as-of-yet unknown mechanism regarding intermediate residues.
Author response image 1
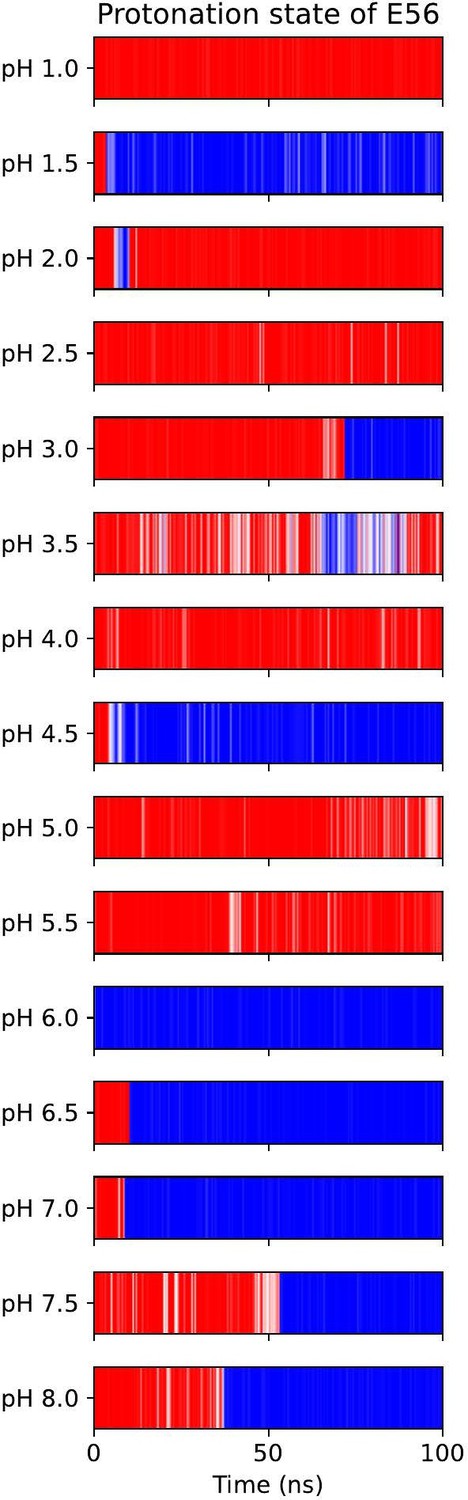
All-atom CpHMD simulations of apo-OF PepT2.
Red indicates protonated E56, blue is deprotonated.
Author response image 2
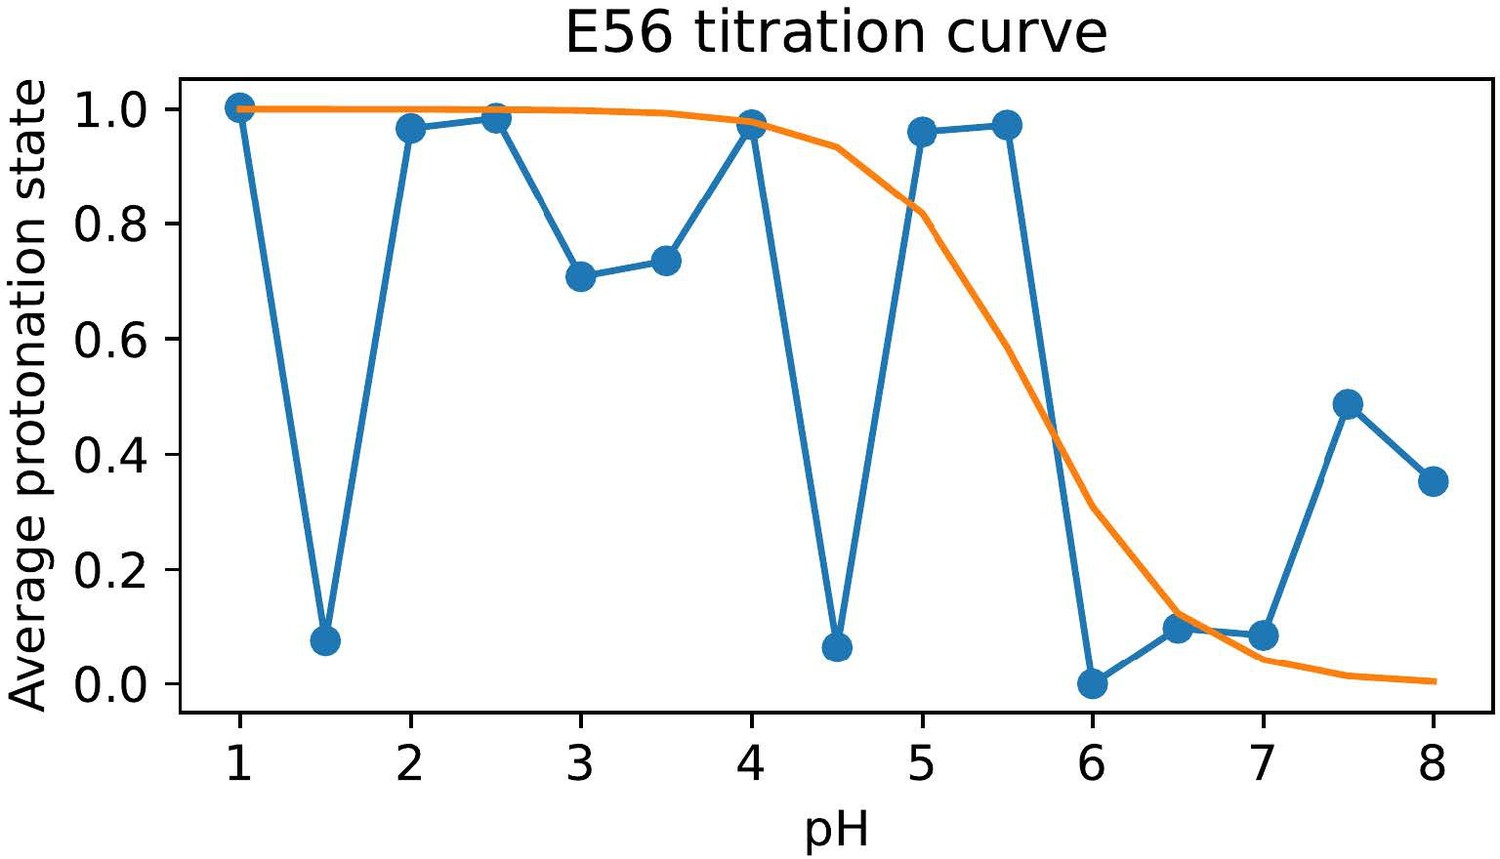
Difficulty in calculating the E56 pKa value from the noisy all-atom CpHMD data shown in Author response image 1.
Videos
Video 1
First Principal Component (PC) of occluded (OCC) to outwards-facing (OF) state.
Video 2
Second Principal Component (PC) of occluded (OCC) to outwards-facing (OF) state.
Video 3
First Principal Component (PC) of occluded (OCC) to inwards-facing (IF) state.
Video 4
Second Principal Component (PC) of occluded (OCC) to inwards-facing (IF) state.
Tables
Table 1
Results of absolute binding free energy (ABFE) calculations, showing that the affinity of Ala-Phe substrate does not depend much on the conformational state (outwards-facing, OF vs inwards-facing, IF), but is significantly decreased on E622 protonation.
| Protein state | AF dipeptide affinity/kcal mol−1 |
|---|---|
| OF | 8.0 ± 0.3 |
| IF | 7.0 ± 0.4 |
| IF & E622 prot | 2.9 ± 0.2 |
Table 2
Residue numbers used in the definition of the tip-collective variable (CV) and base-CV.
| Bundle | Residue numbers |
|---|---|
| N-terminal bundle tips | 63–74, 79–90, 120–131, 143–154, 194–205, 217–228 |
| N-terminal bundle bases | 46–57, 93–104, 110–121, 161–172, 177–188, 227–238 |
| C-terminal bundle tips | 320–331, 341–352, 392–403, 609–620, 655–666, 671–682 |
| C-terminal bundle bases | 290–301, 359–370, 376–387, 626–637, 642–653, 686–697 |
Table 3
Overview of all 1D-PMF sampling.
| Condition | Simulation time/ns |
|---|---|
| OCC↔OF, standard prot | 24 * (266+244+244) |
| OCC↔OF, H87 & D342 prot | 24 * (327+244+244) |
| OCC↔IF, standard prot | 24 * (242+248+246) |
| OCC↔IF, E53 prot | 24 * (158+155+154) |
| Total | 67 μs |
Table 4
Overview of all 2D-PMF sampling.
| Condition | Simulation time/ns |
|---|---|
| OCC↔OF, standard prot | 24 * (233+195+195+208+208+207) |
| OCC↔OF, H87 prot | 24 * (230+200+188+201+228+229) |
| OCC↔OF, D342 prot | 24 * (204+232+204+224+229+207) |
| OCC↔OF, H87&D342 prot | 24 * (196+196+195+194+194+201) |
| OCC↔OF, D342A | 24 * (182+183+206+181+183+183) |
| OCC↔OF, H87A | 24 * (176+182+183+184+182+177) |
| OCC↔OF, E53 prot | 24 * (185+180+209+179+218+213) |
| OCC↔OF, E56 prot | 24 * (194+194+194+192+193+193) |
| OCC↔OF, R206D&D342R | 24 * (227+213+183+222+211+180) |
| OCC↔OF, holo, standard prot | 24 * (200+196+195+200+194+201) |
| OCC↔OF, holo, E53 prot | 24 * (185+180+210+179+218+213) |
| OCC↔OF, holo, E56 prot | 24 * (194+194+194+192+193+193) |
| OCC↔OF, holo, H87&D342 prot | 24 * (198+191+198+190+182+201) |
| OCC↔IF, standard prot | 24 * (197+216+203+192+197+199) |
| OCC↔IF, E53 prot | 24 * (197+208+199+192+193+195) |
| OCC↔IF, E622 prot | 24 * (199+201+200+196+217+197) |
| OCC↔IF, E53&E622 prot | 24 * (193+237+240+187+250+200) |
| OCC↔IF, holo, standard prot | 24 * (190+195+191+196+192+197) |
| OCC↔IF, holo, E53 prot | 24 * (189+196+197+199+189+198) |
| OCC↔IF, holo, E622 prot | 24 * (194+191 + 206+197 + 198+199) |
| OCC↔IF, holo, E53&E622 prot | 24 * (197+198 + 180+195 + 190+204) |
| Total | 598 μs |
Additional files
Download links
A two-part list of links to download the article, or parts of the article, in various formats.
Downloads (link to download the article as PDF)
Open citations (links to open the citations from this article in various online reference manager services)
Cite this article (links to download the citations from this article in formats compatible with various reference manager tools)
The mechanism of mammalian proton-coupled peptide transporters
eLife 13:RP96507.
https://doi.org/10.7554/eLife.96507.3


