Hidden GPCR structural transitions addressed by multiple walker supervised molecular dynamics (mwSuMD)
- Centre for Health and Life Sciences, Coventry University, United Kingdom
- Dipartimento di Scienze Chimiche, Farmaceutiche ed Agrarie, University of Ferrara, Italy
- Molecular Modeling Section (MMS), Dipartimento di Scienze del Farmaco, University of Padua via Marzolo, Italy
- School of Life Sciences, University of Essex, Wivenhoe Park, United Kingdom
Figures
Figure 1 with 2 supplements
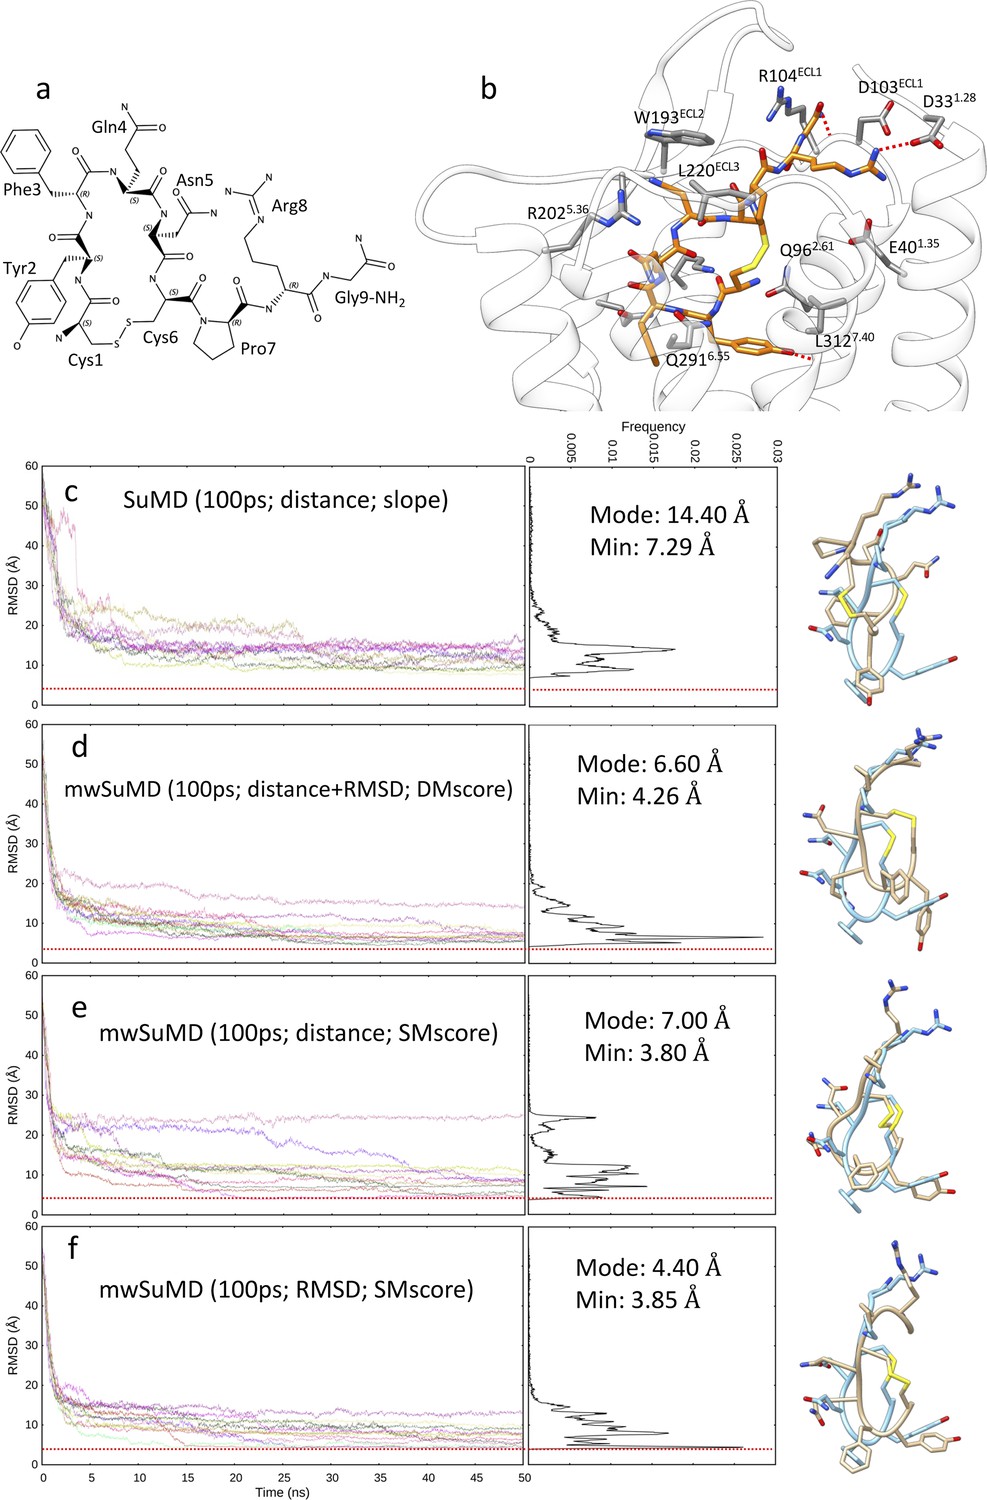
Arginine vasopressin (AVP) supervised molecular dynamics (SuMD) and multiple walker SuMD (mwSuMD) binding simulations to vasopressin 2 receptor (V2R) (100 ps time windows).
(a) Chemical structure and (b) binding more within the V2R orthosteric binding site; AVP is represented in orange stick, while V2R is in white ribbon and gray stick. For each set of settings (c–f) the root mean square deviation (RMSD) of AVP Cα atoms to the cryo-electron microscopy (cryo-EM) structure 7DW9 is reported during the time course of each SuMD (c) or mwSuMD (d–f) replica alongside the RMSD values distribution and the snapshot corresponding to the lowest RMSD values (AVP from the cryo-EM structure 7DW9 is in a cyan stick representation, while AVP from simulations is in a tan stick representation). A complete description of the simulation settings is reported in Table 1 and the Methods section. The dashed red line indicates the AVP RMSD during a classic (unsupervised) equilibrium MD simulation of the X-ray AVP:V2R complex (Figure 1—figure supplement 1).
Figure 1—figure supplement 1
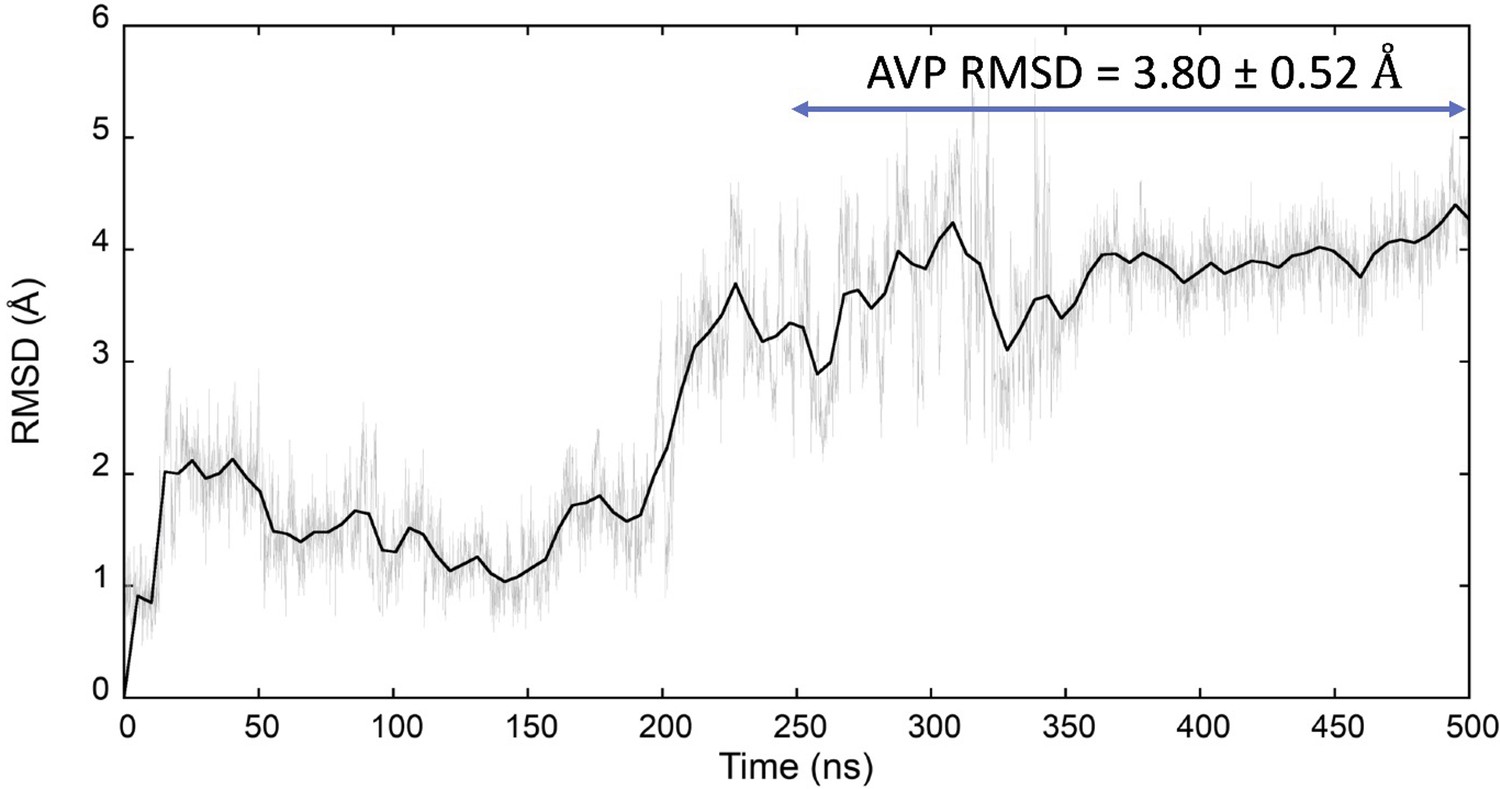
Classic molecular dynamics (MD) simulation of the AVP:V2R complex (PDB ID 7DW9).
The average AVP root mean square deviation (RMSD) (computed on the Cα atoms) after stabilization of the system (second half of the trajectory) is indicated. AVP, arginine vasopressin; V2R, vasopressin 2 receptor.
Figure 1—figure supplement 2

Arginine vasopressin (AVP) supervised molecular dynamics (SuMD) and multiple walker SuMD (mwSuMD) binding simulations to vasopressin 2 receptor (V2R) (600 ps time windows).
For each set of settings (a-e), the RMSD of AVP Cα atoms to the cryo-EM structure 7DW9 is reported during the time course of each SuMD (a) or mwSuMD (b-e) replica, alongside the RMSD values distribution and the snapshot corresponding to the lowest RMSD (AVP from the cryo EM structure 7DW9 is in a cyan stick representation, while AVP from simulations is in a tan stick representation). A complete description of the simulation settings is reported in Table 1 and the Methods section. The dashed red line indicates the AVP RMSD during a classic (unsupervised) equilibrium MD simulation of the X-ray AVP:V2R complex (Figure 1—figure supplement 1).
Figure 2
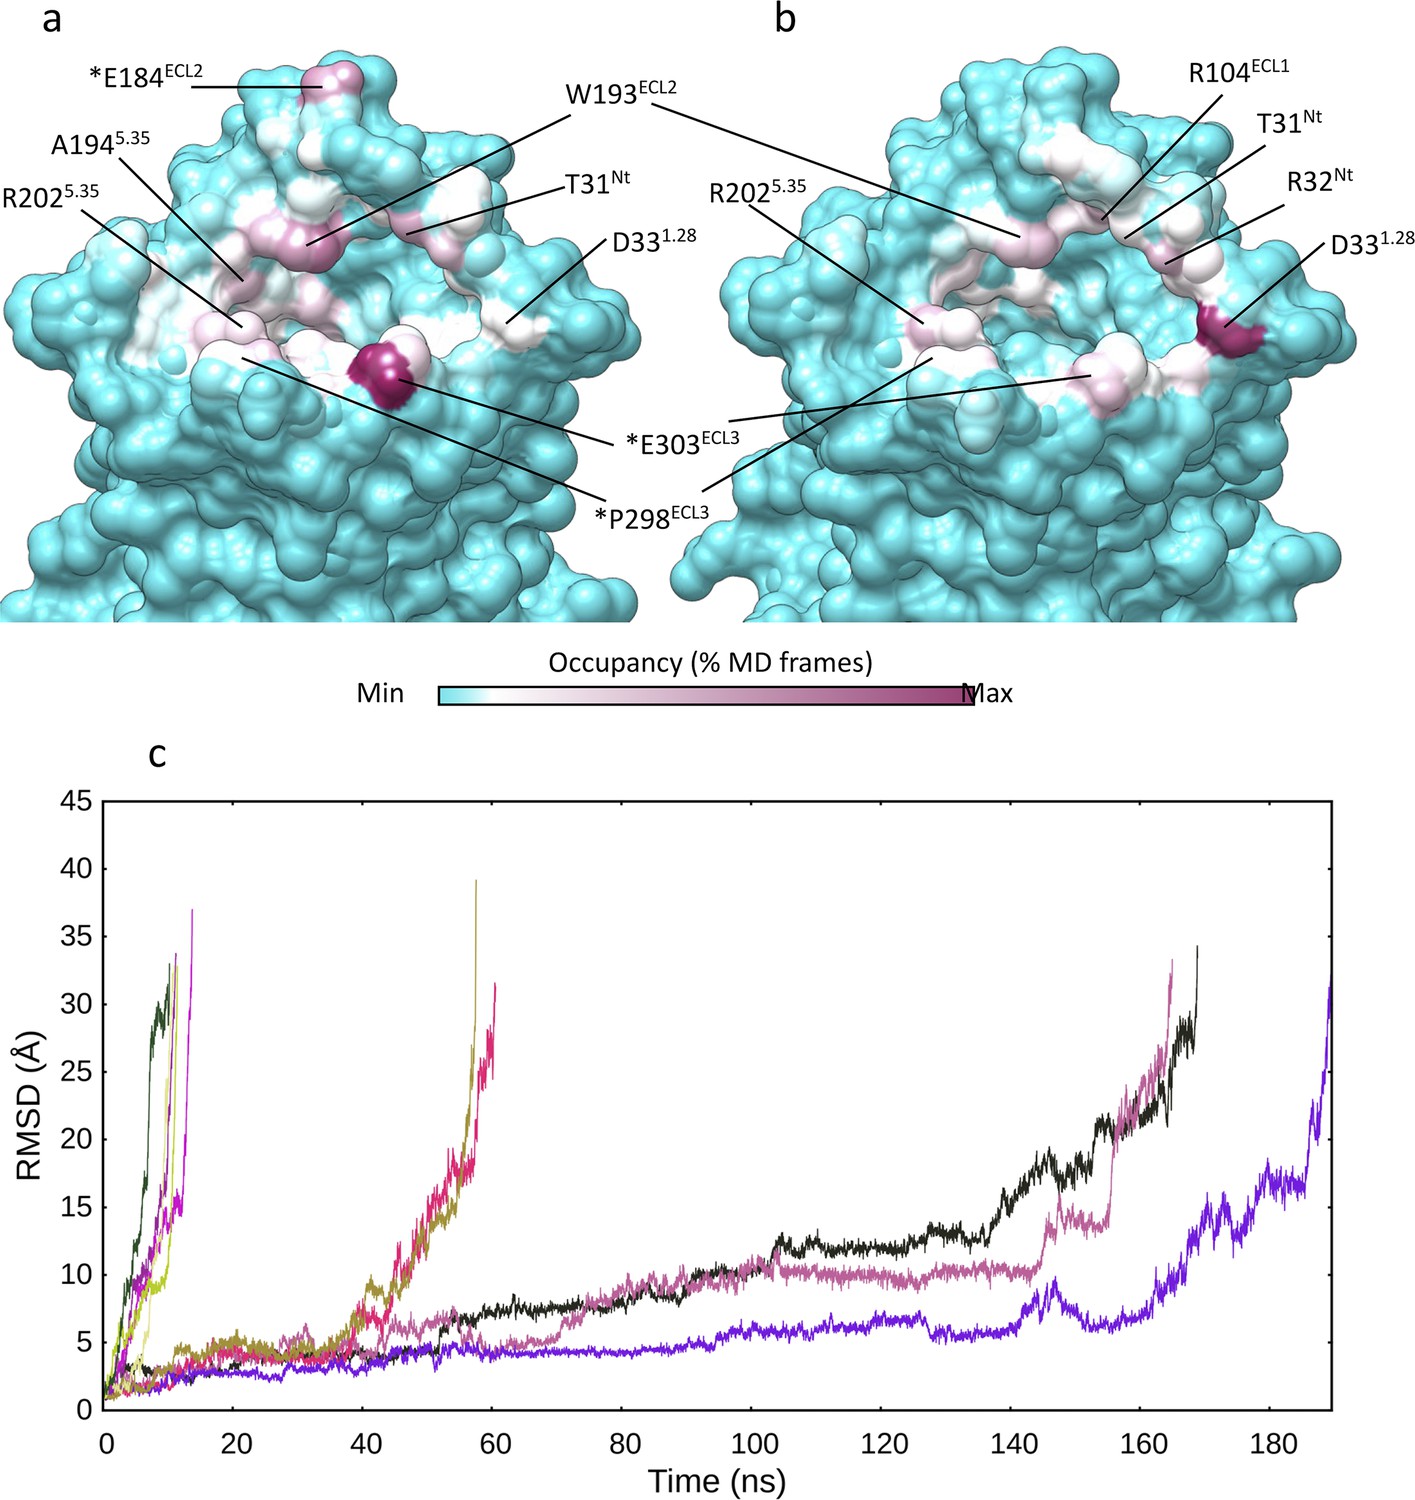
Multiple walker supervised molecular dynamics (mwSuMD) (un)binding simulations of arginine vasopressin (AVP).
Vasopressin 2 receptor (V2R) residues involved in mwSuMD simulations of AVP. (a) Binding (dynamic docking); (b) unbinding simulations. (c) Dissociation of AVP from V2R. The root mean square deviation (RMSD) of AVP to the initial bound state is reported during the time course of five replicas of SuMD and mwSuMD, respectively.
Figure 3 with 2 supplements
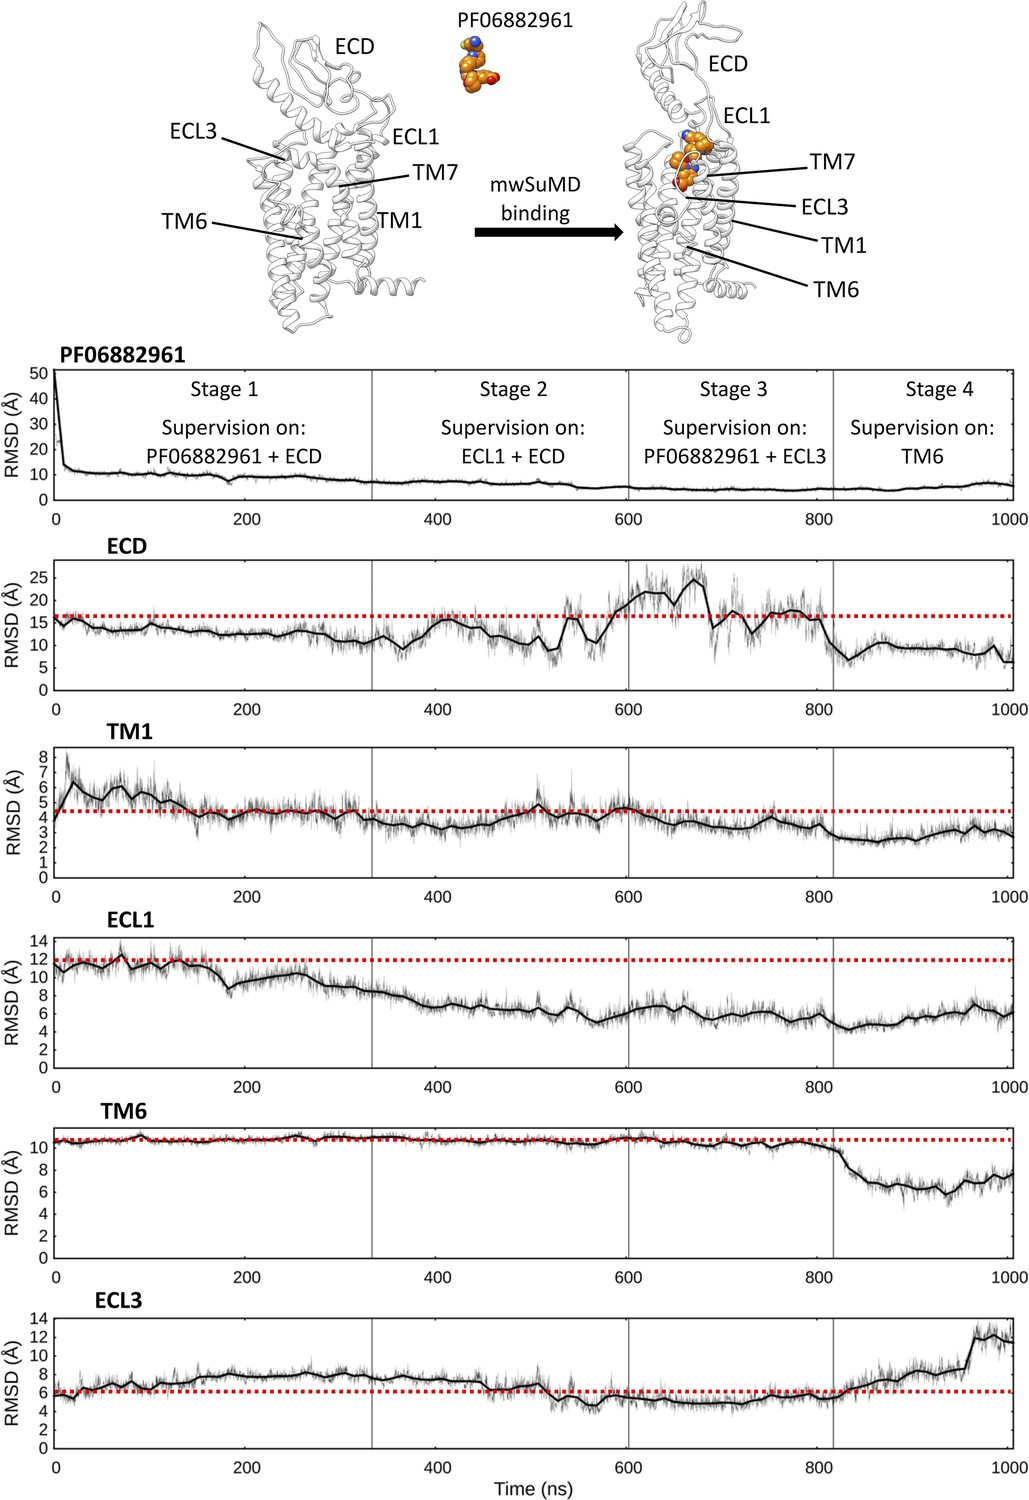
Multiple walker supervised molecular dynamics (mwSuMD) simulation of PF06882961 binding to glucagon-like peptide-1 receptor (GLP-1R) and receptor activation.
Each panel reports the root mean square deviation (RMSD) to the position of the ligand in the active state (top panel) or a GLP-1R structural element over the time course (all but ECL3 converging to the active state). ECD: extracellular domain; TM: transmembrane helix; ECL: extracellular loop. The mwSuMD simulation was performed with four different settings over 1 µs in total. The red dashed lines show the initial RMSD value for reference.
Figure 3—figure supplement 1
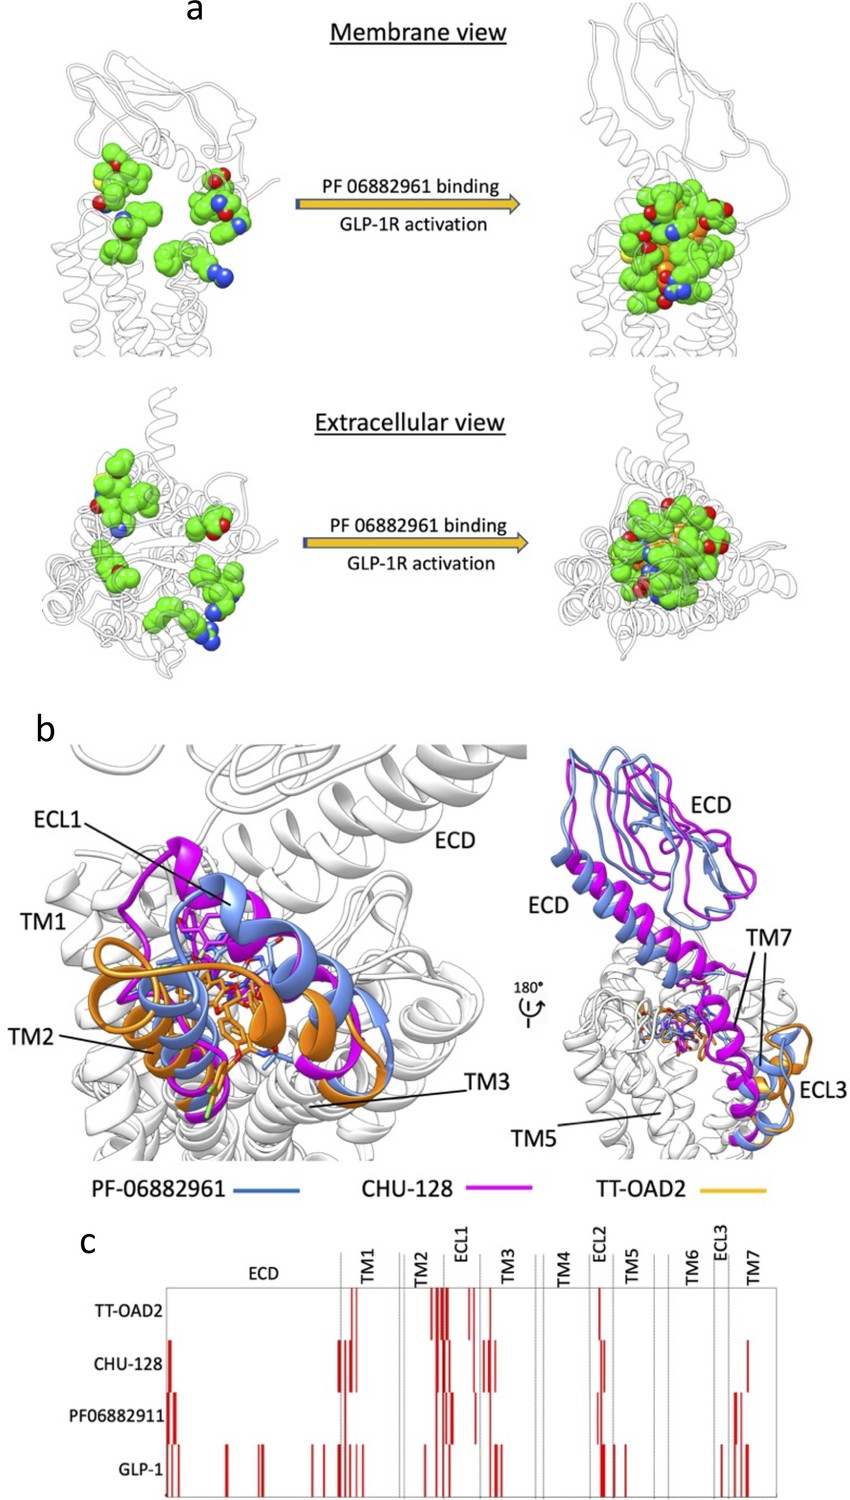
Multiple walker supervised molecular dynamics (mwSuMD) simulation of PF06882961, glucagon-like peptide-1 receptor (GLP-1R) activation, and guanosine diphosphate (GDP) release.
(a) PF06882961 binding site in the apo and holo GLP-1R. In the apo GLP-1R (left transparent ribbon) the residues forming the binding site of the NPA PF06882961 are scattered due to the different conformation of the receptor. (b, c) NPAs stabilize divergent GLP-1R active conformations: (a) Different orientations of TM2, ECL1, and TM3; (b) divergent conformations of extracellular domain (ECD), ECL3, and TM7; (c) interaction fingerprint of NPAs (TT-OAD2, CHU-128, and PF06882911) and the endogenous agonist peptide GLP-1. Red bars indicate interactions with distinct residues in the GLP-1R.
Figure 3—figure supplement 2
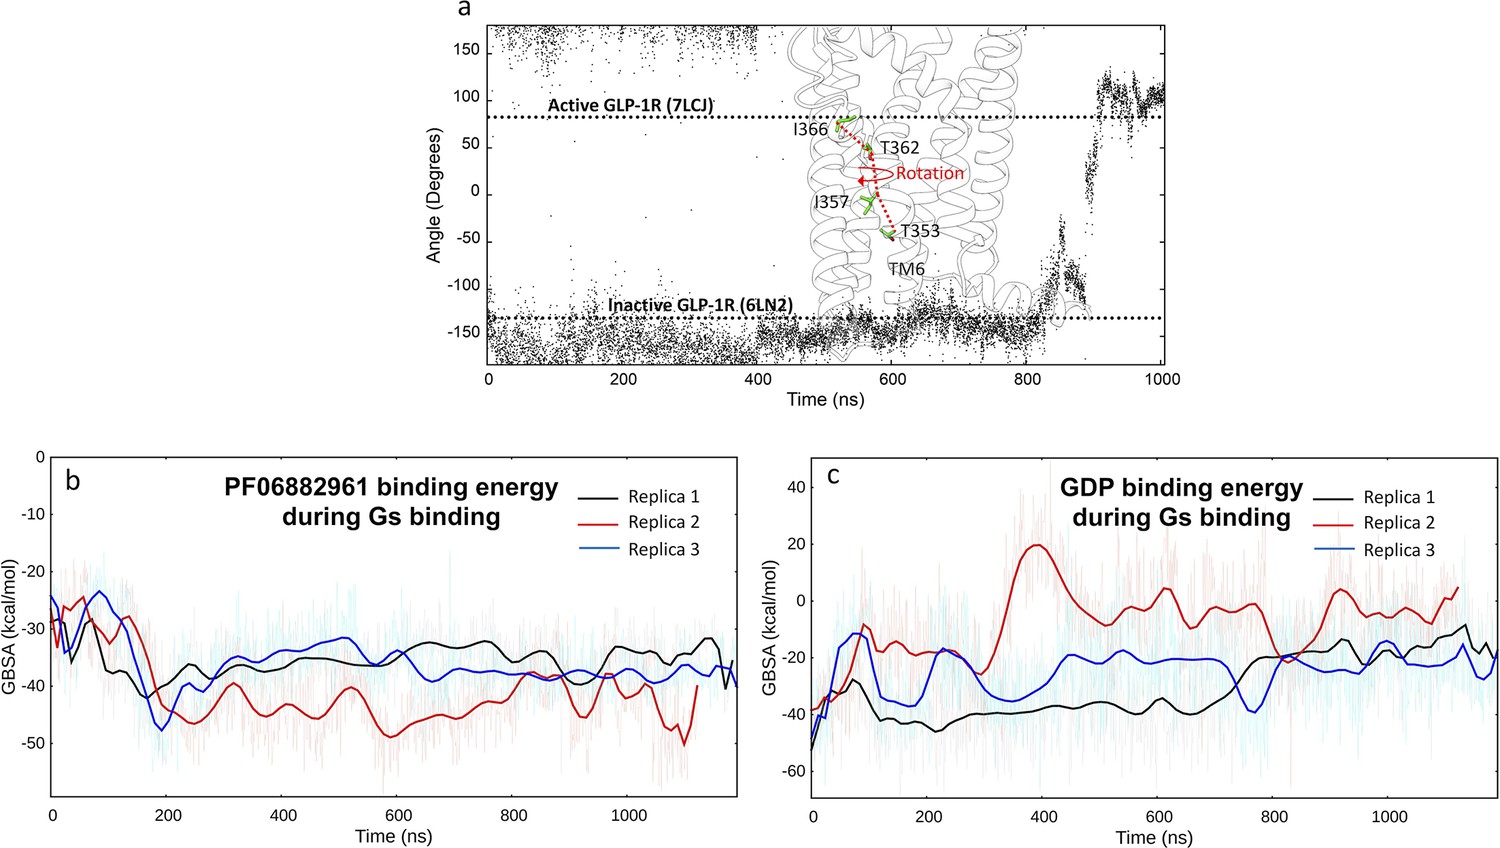
Dynamic feautures of GLP-1R activation and Gs binding.
(a) Rotation of TM6 during glucagon-like peptide-1 receptor (GLP-1R) activation simulated by multiple walker supervised molecular dynamics (mwSuMD). The angle was measured as the dihedral formed by the backbone alpha carbon atoms T353, I357, T362, and I366. The angle values of the inactive and active cryo-electron microscopy (cryo-EM) structures are reported as references; (b) PF06882961 MM-GBSA binding energy during Gs binding; (d) guanosine diphosphate (GDP) MM-GBSA binding energy during Gs binding.
Figure 4
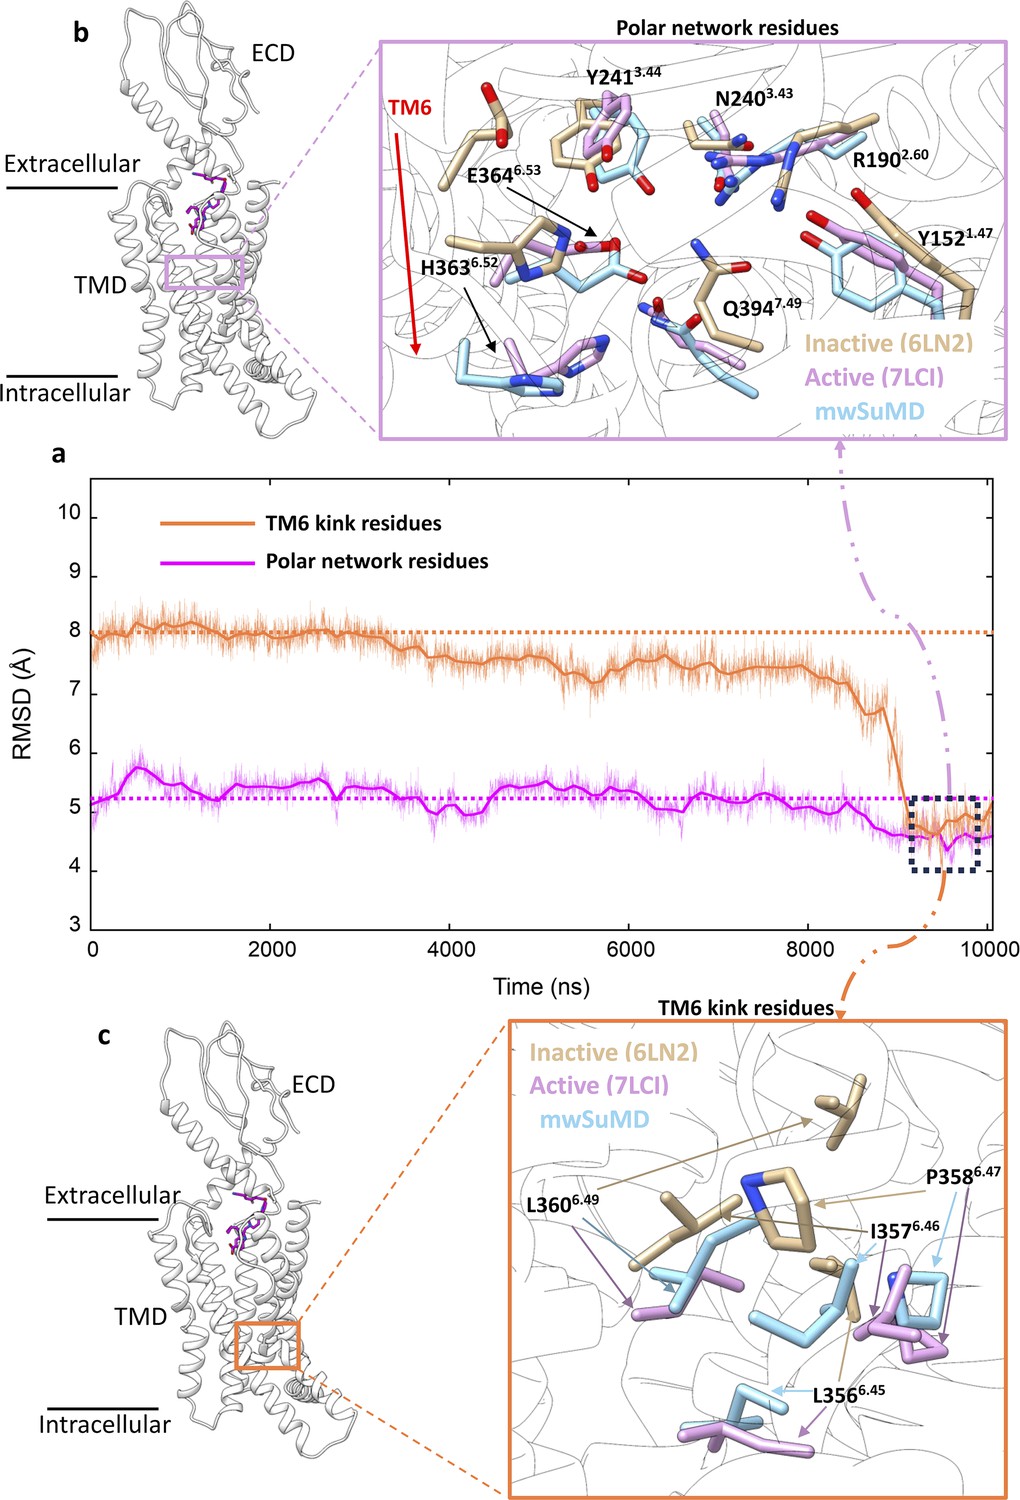
Glucagon-like peptide-1 receptor (GLP-1R) key structural motifs during multiple walker supervised molecular dynamics (mwSuMD) GLP-1R activation.
(a) Root mean square deviation (RMSD) to the active state GLP-1R (7LCI) of the residues forming the central polar network (magenta) and TM6 kink (orange) during mwSuMD of receptor activation; at the end of the simulations minimum values were reached (dashed square). (b) The position of the polar network within the core of transmembrane domain (TMD) (left-hand panel) and comparison between inactive, active, and mwSuMD final states for the side chains of the residues forming of the polar network. (c) The position of the TM6 kink (right-hand panel) and comparison between inactive, active, and mwSuMD final states for the side chains of the residues forming the TM6 kink.
Figure 5 with 2 supplements
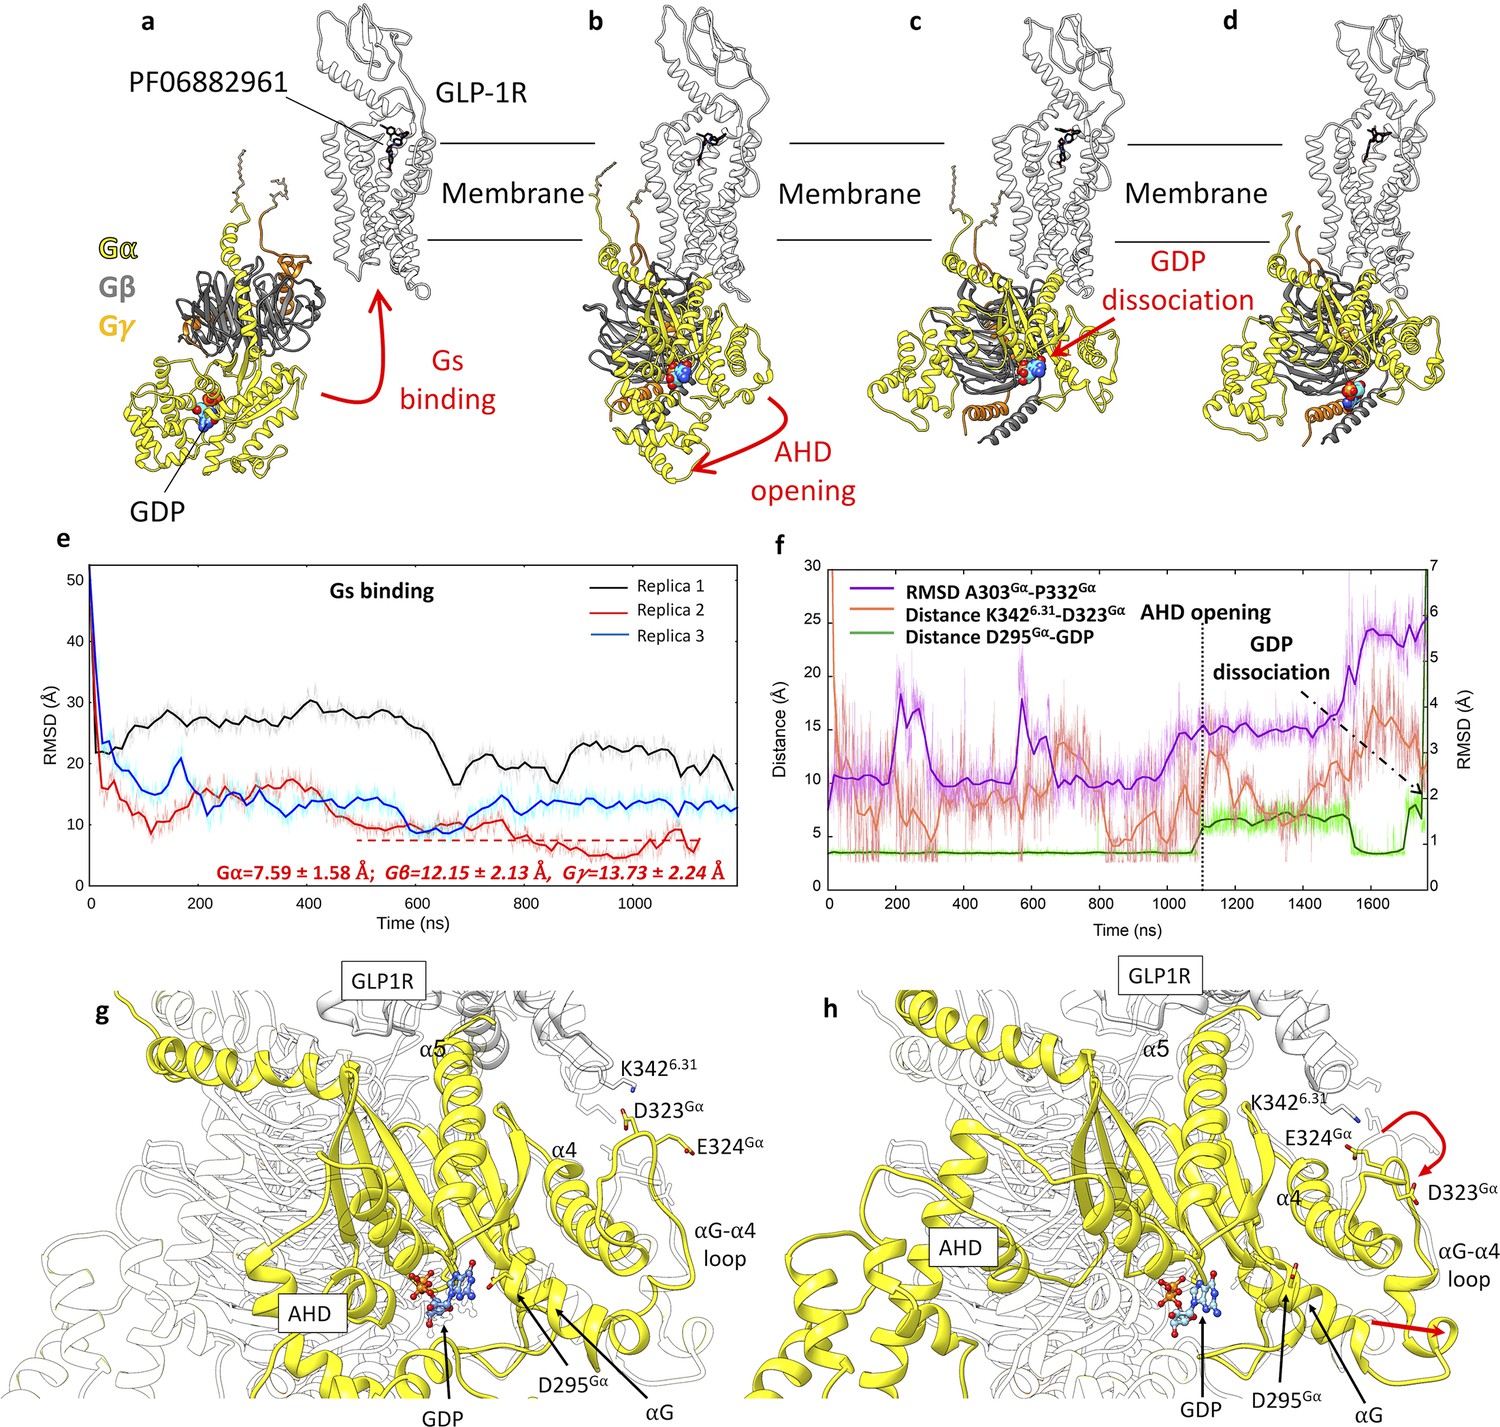
Glucagon-like peptide-1 receptor (GLP-1R) activation and Gs binding.
(a–d) Sequence of simulated events during the multiple walker supervised molecular dynamics (mwSuMD) Gs:GLP-1R simulations. (e) Root mean square deviation (RMSD) of Gsα to the experimental GLP-1R:Gs complex (PDB 7LCJ) during three mwSuMD replicas; the RMSD to the experiential bound conformation (7LCJ) during the second part of Replica 2 (red dashed line) is reported for each Gs subunit. RMSDs were computed on Gα residues 11–43 and 205–394 to the experimental structure 7LCI after superimposition on GLP-1R residues 140–240 Cα atoms. (f) RMSD of the αG-α4 loop (purple), the distance between K3426.31 and D323Gα (salmon), and the distance between guanosine diphosphate (GDP) and D295Gα (green) during Gs binding, alpha-helical domain (AHD) opening and GDP dissociation; (g) and (h) comparison between states extracted from before and after AHD opening. Before AHD opening (a), GLP-1R ICL3 interacted with D323Gα and D295Gα interacted with GDP; after AHD opening (b) and αG-α4 loop reorganization (curved red arrow), αG and D295Gα moved away from GDP (straight red arrow), destabilizing its binding to Gs.
Figure 5—figure supplement 1
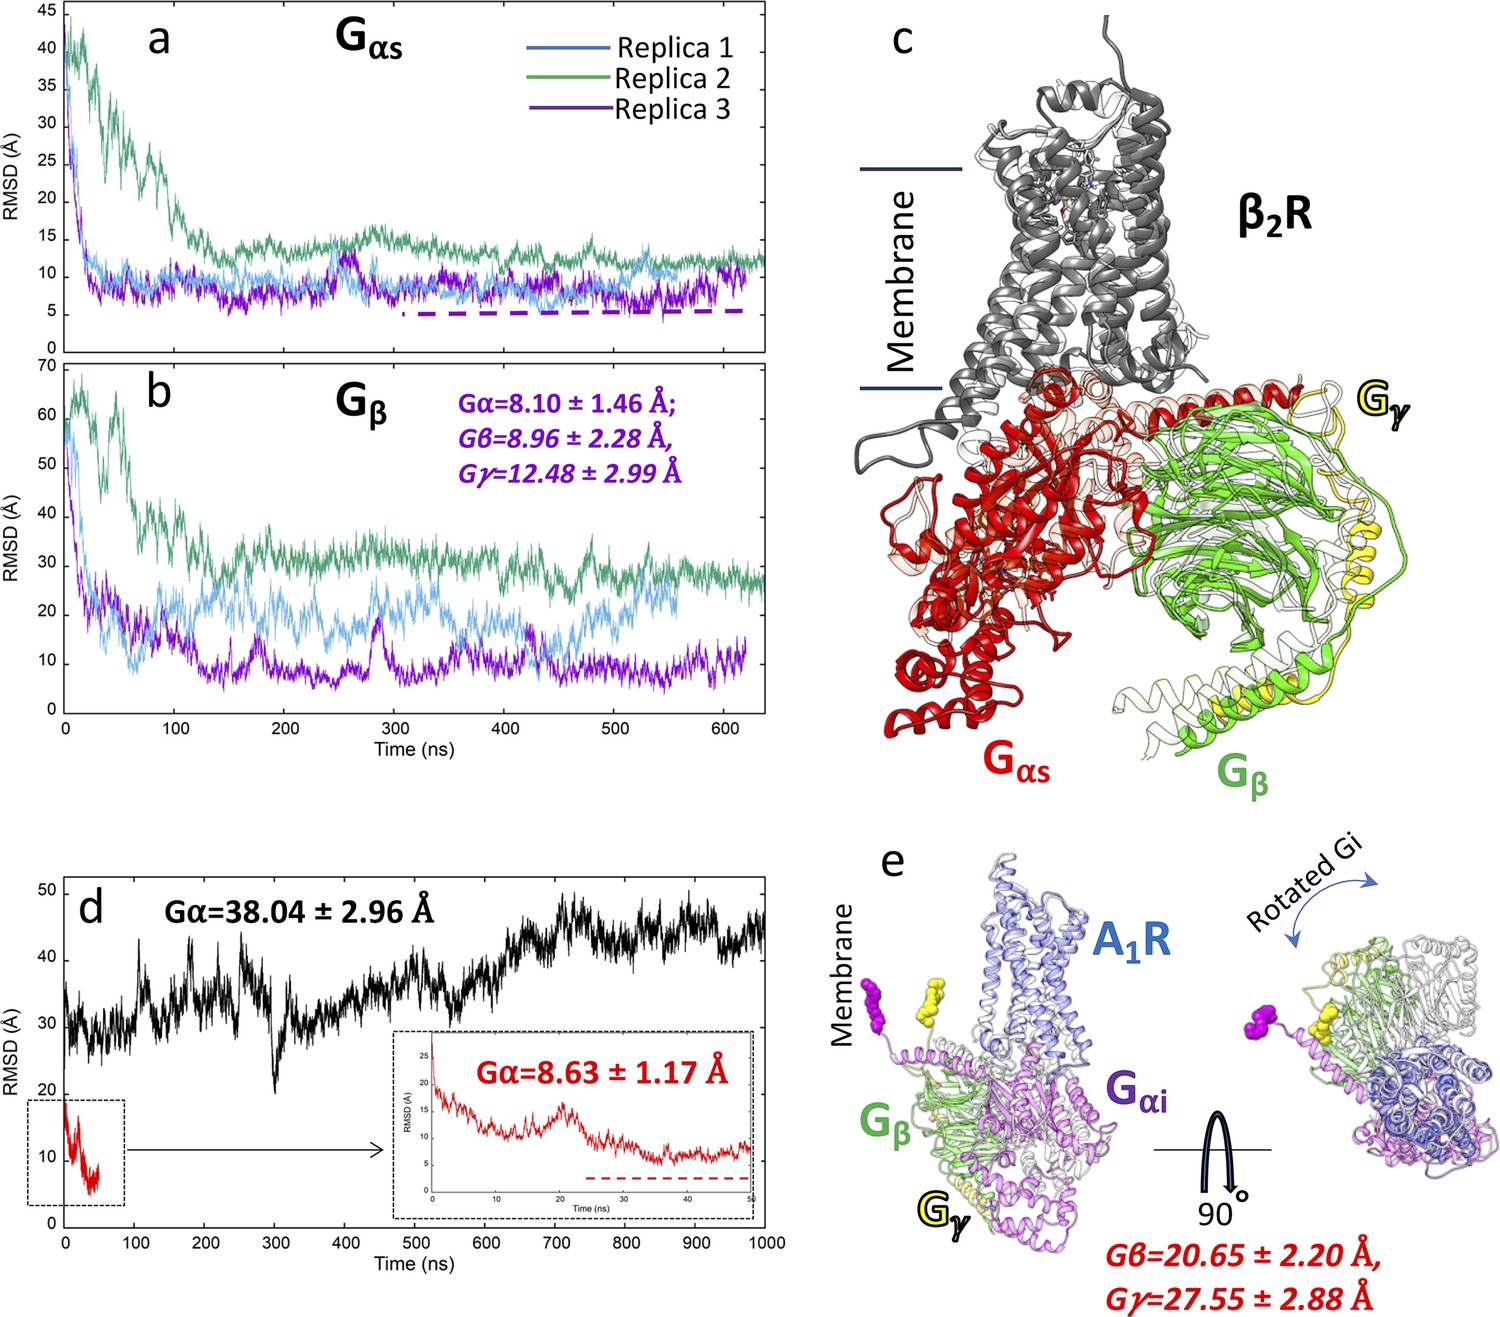
G protein binding simulations to β2 adrenoreceptor (β2 AR) and A1 receptor (A1R).
(a) Root mean square deviation (RMSD) of Gsα to the experimental complex (PDB 3NS6) during three multiple walker supervised molecular dynamics (mwSuMD) replicas; (b) RMSD of Gsβ to the experimental complex (PDB 3NS6) during three mwSuMD replicas; (c) superposition of the experimental Gs:β2 AR complex (transparent ribbon) and the MD frame with the lowest Gsα RMSD (3.94 Å); (d) RMSD of Giα (residues 243–355) to the A1R experimental complex (PDB 6D9H) during an mwSuMD simulation (red, magnified in the box) and a 1000-ns-long classic MD simulation (black); (e) two-view superposition of the experimental Gi:A1R complex (transparent ribbon) and the MD frame with the lowest Giα RMSD (4.82 Å).
Figure 5—figure supplement 2
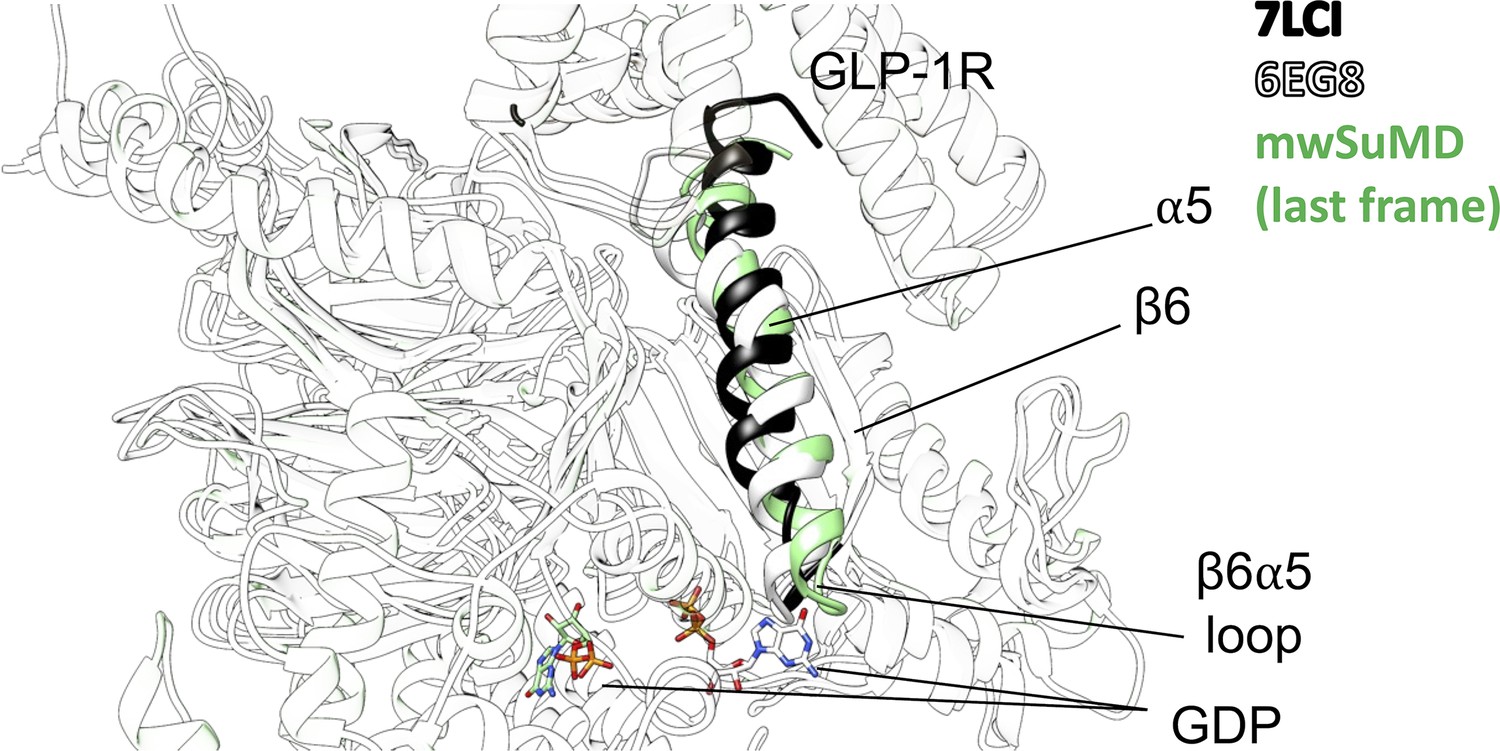
Comparison of the inactive (6EG8, white), nucleotide-free (7LCI, black), and guanosine diphosphate (GDP)-dissociated (multiple walker supervised molecular dynamics [mwSuMD] simulation, green) β6-α5 loop.
Bound (white, 6EG8) and dissociated (green, mwSuMD) GDP is shown as a stick representation.
Figure 6
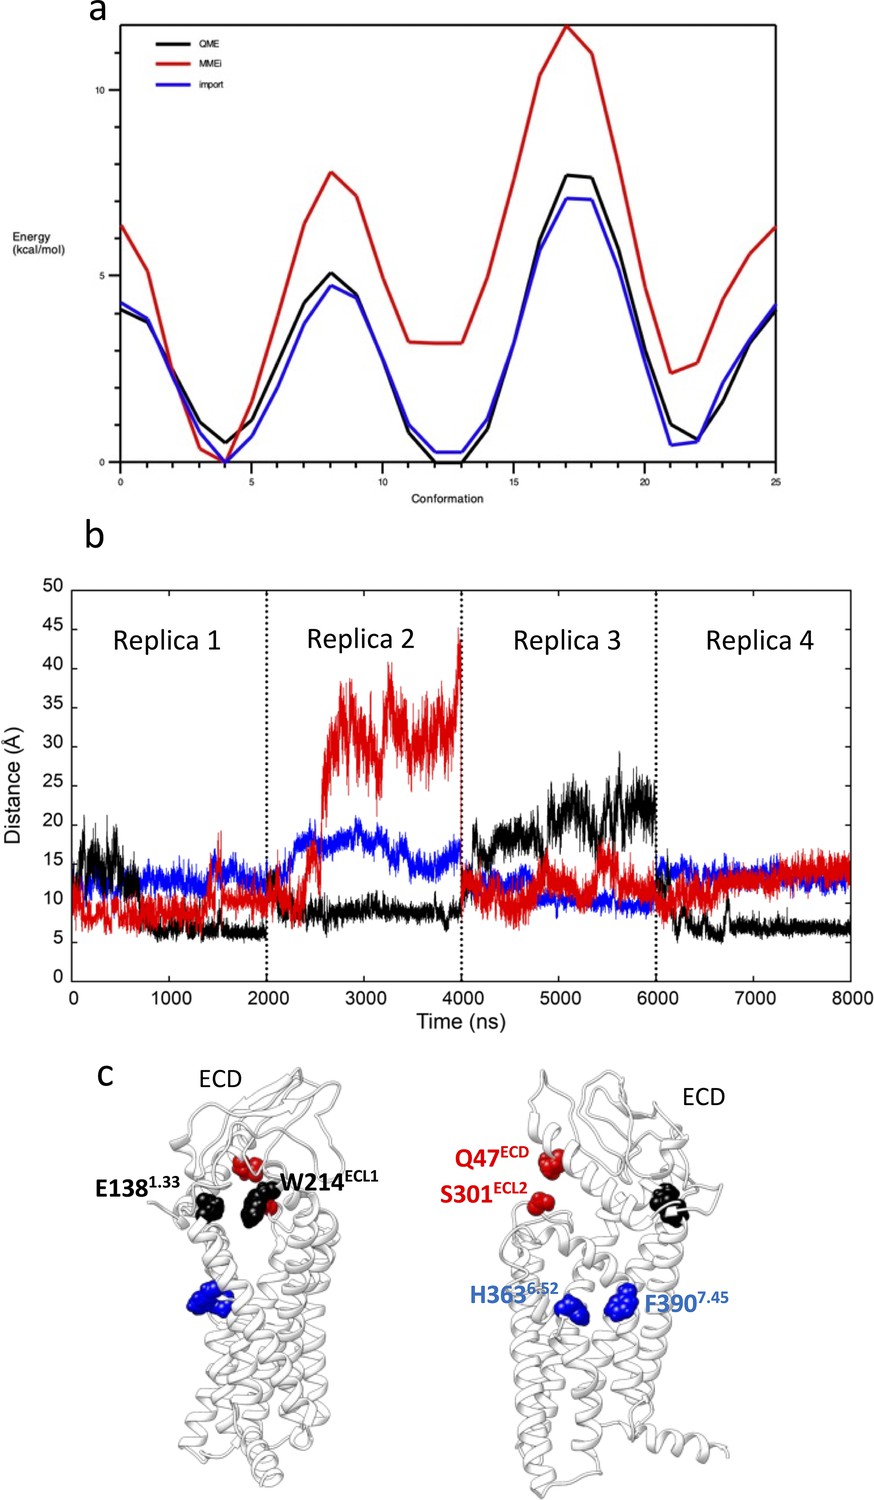
Preparation to GLP-1R mwSuMD simulations.
(a) Potential energy surface derived from the scan of the PF06882961 rotatable bond through which the dihedrals NG2R51-CG321-CG3C41-CG3C41 (penalty = 143.5) and NG2R51-CG321-CG3C41-OG3C51 (penalty = 152.4) pass. The curve obtained from the original CGenFF parameters (red) was optimized (blue) to resemble the energy profile from quantum-mechanics computations at the HF/6-31g(d) level of theory (black). (b) Distances between glucagon-like peptide-1 receptor (GLP-1R) key residues E1381.33 and W214ECL1 (black), H3636.52 and F3907.45 (blue) and Q47ECD and S310ECL2 (red) during 8 μs of classic molecular dynamics (MD); (c) positions of the three couples of residues reported as two-side views.
Videos
Video 1
Arginine vasopressin (AVP) binding (dynamic docking) to vasopressin 2 receptor (V2R).
Two-view of the mwSuMD replica better reproducing the AVP:V2R experimental complex. Left side: V2R is represented in white quick surface, while AVP is in transparent quick surface and green stick; right side: V2R is represented in white ribbon and cyan stick, while AVP is a green stick. The bound AVP conformation from PDB 7DW9 is reported as a reference in transparent orange ribbon and stick.
Video 2
Arginine vasopressin (AVP) unbinding from vasopressin 2 receptor (V2R).
Two-view of the five mwSuMD replicas performed. Left side: V2R is represented in white quick surface, while AVP is in transparent quick surface and green stick; right side: V2R is represented in white ribbon and cyan stick, while AVP is a green stick.
Video 3
Morph of the PF06882961 binding and glucagon-like peptide-1 receptor (GLP-1R) activation.
The first and last frames of the PF06882961 binding simulations have been interpolated to produce a smoothed representative transition.
Video 4
PF06882961 binding and glucagon-like peptide-1 receptor (GLP-1R) activation.
PF06882961 is represented in cyan van der Waals spheres, while GLP-1R is orange ribbon; the GLP-1R experimental active conformation is reported in transparent green ribbon as reference.
Video 5
Gs binding to β2 adrenoreceptor (β2 AR).
The inactive Gs (Gα subunit in orange, Gβ subunit in green, and Gγ subunit in yellow) recognizes β2AR (black ribbon) bound to epinephrine (van der Waals spheres). The experimental β2AR:Gs cryo-EM complex is reported in white ribbon for reference.
Video 6
Gi binding to A1 receptor (A1R).
The Gi (Gα subunit in magenta, Gβ subunit in green, and Gγ subunit in yellow) recognizes A1R (blue ribbon) bound to adenosine (not shown). The experimental A1R:Gi cryo-EM complex is reported in transparent ribbon for reference.
Video 7
Gs binding to glucagon-like peptide-1 receptor (GLP-1R) and guanosine diphosphate (GDP) release.
The Gs protein binds GLP-1R (light grey) in complex with PF06882961 (stick representation) before the alpha-helical domain opens and allows GDP release from Gsα. The Gsα subunit is yellow, Gβ is dark gray, and Gγ is orange.
Tables
Table 1
Summary of all the simulations performed and the settings employed.
| System | # Replicas | TWduration | # Walkers | Metric | Acceptance |
|---|---|---|---|---|---|
| V2R:AVP complex | 1 classic MD | 500 ns | N/A | N/A | N/A |
| V2R:AVP binding | 9 (SuMD) | 600 ps | N/A | Distance | Slope |
| 10 (mwSuMD) | 600 ps | 3 | Distance | Slope | |
| 11 (mwSuMD) | 600 ps | 3 | RMSD | Slope | |
| 8 (mwSuMD) | 600 ps | 3 | Distance | SMscore | |
| 9 (mwSuMD) | 600 ps | 3 | Distance and RMSD | DMscore | |
| 12 (mwSuMD) | 100 ps | 10 | Distance and RMSD | DMscore | |
| 11 (mwSuMD) | 100 ps | 10 | Distance | SMscore | |
| 11 (mwSuMD) | 100 ps | 10 | RMSD | SMscore | |
| 10 (SuMD) | 100 ps | N/A | Distance | Slope | |
| V2R:AVP unbinding | 5 (SuMD) | 100 ps | N/A | Distance | Slope |
| 5 (mwSuMD) | 100 ps | 10 | Distance | SMscore | |
| β2 AR:Gs protein binding | 3 (mwSuMD) | 100 ps | 5 | Distance and RMSD | DMscore |
| A1R:Gi binding | 1 (mwSuMD) | 100 ps | 3 | RMSD | SMscore |
| GLP-1R:PF06882961 | 1 (mwSuMD) | 100 ps | 5 | Distance or RMSD (or a combination) | SMscore or DMscore |
| GLP-1R:Gs protein binding | 3 (mwSuMD) | 200 ps | 3 | Distance or RMSD | SMscore or DMscore |
| Gs AHD opening | 1 (mwSuMD) | 100 ps | 3 | Distance | SMscore |
| GLP-1R:Gs GDP unbinding | 3 | 50 ps | 5 | Distance | SMscore |
-
N/A: not applicable; SuMD was not performed.
Appendix 1—table 1
GLP-1R:Gs contacts during multiple walker supervised molecular dynamics (mwSuMD) Gs binding simulations.
| GLP-1R residue | Gs residue | Occupancy (% MD frames) |
|---|---|---|
| ASP344 (6.33) | ARG385 | 87.7 |
| ARG348 (6.37) | LEU394 | 83 |
| GLU408 (7.63) | ARG356 | 64.4 |
| LEU254 (3.57) | TYR391 | 58.1 |
| ARG419 (7.83) | ASP312 | 55.3 |
| LYS415 (7.70) | ASP312 | 47.6 |
| TYR250 (3.53) | TYR391 | 46.3 |
| LEU254 (3.57) | LEU393 | 43.7 |
| ARG419 (7.83) | HIS311 | 43.2 |
| LEU254 (3.57) | LEU388 | 42.4 |
| VAL259 (ICL2) | ARG38 | 39.4 |
| SER352 (6.41) | LEU393 | 37.4 |
| LYS351 (6.40) | LEU394 | 36 |
| PHE257 (3.60) | GLN384 | 35.2 |
| GLU262 (4.38) | ARG38 | 35 |
| ARG348 (6.37) | ARG385 | 30.8 |
| ARG348 (6.37) | LEU393 | 30.6 |
| LEU251 (3.54) | LEU393 | 29.4 |
| ILE345 (6.34) | ARG385 | 23.8 |
| LEU349 (6.38) | LEU394 | 23.2 |
| HIS171 (ICL1) | ASP312 | 22.3 |
| LYS342 (6.31) | ASP323 | 21.6 |
| PHE260 (ICL2) | ARG38 | 21.5 |
| LEU254 (3.57) | GLN384 | 20.6 |
| ILE345 (6.34) | LEU394 | 19.9 |
| GLU262 (4.38) | TYR391 | 19,7 |
| SER261 (ICL2) | GLN35 | 19.7 |
| ARG348 (6.37) | ARG389 | 18.8 |
| LEU254 (3.57) | HIS387 | 18.6 |
| HIS171 (ICL1) | ASN313 | 17.6 |
| VAL259 (ICL2) | HIS387 | 16.8 |
| SER352 (6.41) | LEU394 | 16.7 |
| PHE257 (3.60) | HIS387 | 16.3 |
| LYS351 (6.40) | LEU393 | 16.3 |
| TYR250 (3.53) | LEU393 | 15.7 |
| LEU255 (3.58) | GLN384 | 15.6 |
| GLU412 (7.67) | ARG356 | 15 |
| LYS415 (7.70) | ASP354 | 14 |
| HIS173 (ICL1) | PHE335 | 13.9 |
| VAL259 (ICL2) | GLN35 | 13.8 |
| PHE257 (3.60) | LEU388 | 13.6 |
| HIS171 (ICL1) | ASP333 | 13.5 |
| SER258 (ICL2) | HIS387 | 13.1 |
| SER261 (ICL2) | ARG38 | 12.9 |
| ASN407 (7.62) | ARG356 | 12.5 |
| VAL259 (ICL2) | TYR391 | 12.4 |
| ARG170 (ICL1) | ASP312 | 12.3 |
| LEU255 (3.58) | LEU388 | 11.6 |
| LEU411 (7.66) | ARG356 | 11.5 |
| ARG176 (2.46) | GLU392 | 11.5 |
| GLN263 (4.39) | TRP332 | 11.5 |
| ILE345 (6.34) | LEU388 | 11.3 |
| HIS171 (ICL1) | ARG314 | 11.2 |
| VAL259 (ICL2) | ALA39 | 10.7 |
| TRP264 (4.40) | PHE335 | 10.5 |
| ARG267 (4.43) | ASP333 | 10.5 |
| HIS171 (ICL1) | TRP332 | 10.5 |
| PHE257 (3.60) | ARG38 | 10.2 |
| LEU349 (6.38) | LEU393 | 10 |
| GLN263 (4.39) | ASP333 | 10 |
| GLN263 (4.39) | ASN313 | 9.9 |
| ARG419 (7.83) | ASP354 | 9.7 |
| THR343 (6.32) | ARG385 | 9.1 |
| SER258 (ICL2) | ARG38 | 9 |
| LYS342 (6.31) | GLU322 | 8.7 |
| SER261 (ICL2) | ASP333 | 8.6 |
| LEU255 (3.58) | LEU394 | 8.6 |
| PHE260 (ICL2) | TYR391 | 8.5 |
| ASN406 (7.61) | GLU392 | 8.4 |
| SER258 (ICL2) | HIS41 | 8.4 |
| HIS171 (ICL1) | ARG337 | 8.4 |
| SER258 (ICL2) | GLN384 | 8.1 |
| ARG348 (6.37) | LEU388 | 7.9 |
| ARG267 (4.43) | ASN313 | 7.9 |
| HIS173 (ICL1) | ARG337 | 7.8 |
| PHE260 (ICL2) | GLN35 | 7.4 |
| ARG176 (2.46) | TYR391 | 7.3 |
| ARG267 (4.43) | PHE335 | 7.2 |
| ALA256 (3.59) | GLN384 | 7 |
| VAL259 (ICL2) | HIS41 | 7 |
| CYS174 (2.44) | ARG356 | 6.5 |
| GLU408 (7.63) | GLU392 | 6.1 |
| PHE257 (3.60) | TYR391 | 6.1 |
| SER261 (ICL2) | LYS34 | 6 |
| HIS173 (ICL1) | ARG314 | 6 |
| LEU251 (3.54) | LEU388 | 6 |
| HIS173 (ICL1) | ASP312 | 5.9 |
| HIS173 (ICL1) | TRP332 | 5.9 |
| VAL259 (ICL2) | LEU55 | 5.9 |
| ASN407 (7.62) | ARG389 | 5.8 |
| HIS171 (ICL1) | GLY310 | 5.8 |
| TYR178 (2.48) | ASP312 | 5.7 |
| SER258 (ICL2) | VAL217 | 5.7 |
| SER261 (ICL2) | GLN31 | 5.7 |
| LYS342 (6.31) | THR325 | 5.6 |
| LYS342 (6.31) | ALA324 | 5.5 |
| LEU254 (3.57) | LEU394 | 5.4 |
| CYS341 (6.30) | ASP323 | 5.4 |
| TRP264 (4.40) | ARG52 | 5.3 |
| GLU408 (7.63) | ARG389 | 5.2 |
| SER258 (ICL2) | TYR391 | 5.1 |
Additional files
Download links
A two-part list of links to download the article, or parts of the article, in various formats.
Downloads (link to download the article as PDF)
Open citations (links to open the citations from this article in various online reference manager services)
Cite this article (links to download the citations from this article in formats compatible with various reference manager tools)
Hidden GPCR structural transitions addressed by multiple walker supervised molecular dynamics (mwSuMD)
eLife 13:RP96513.
https://doi.org/10.7554/eLife.96513.4


