Endocannabinoids and their receptors modulate endometriosis pathogenesis and immune response
- Department of Biomedical and Molecular Sciences, Queen’s University, Canada
- Rosalind and Morris Goodman Cancer Institute, McGill University, Canada
- Division of Cancer Biology and Genetics, Queen’s University, Canada
Figures
Figure 1
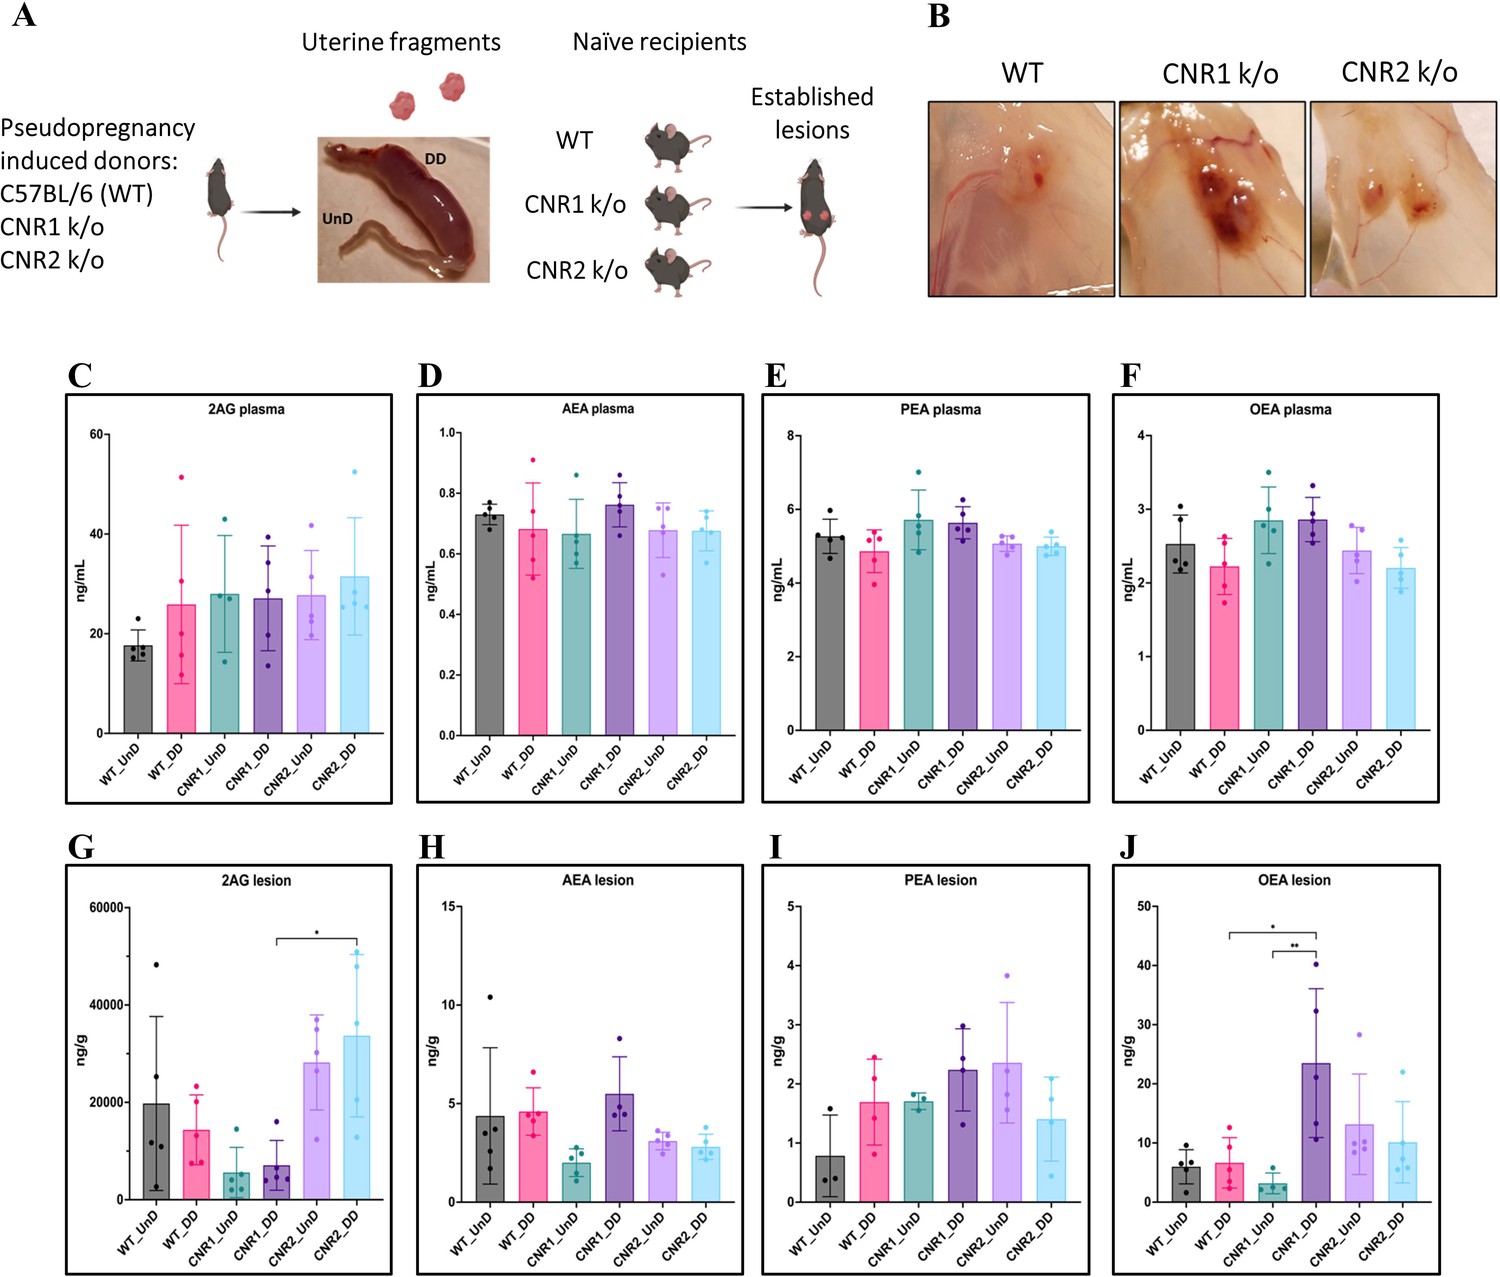
Characterization of endocannabinoid ligands in a modified syngeneic mouse model of endometriosis.
(A) Overview of the modified syngeneic mouse model of endometriosis (EM) where pseudo-pregnant wild-type (WT), CNR1 k/o, and CNR2 k/o mice were induced with decidualized (DD) by injecting sesame oil into the lumen of one uterine horn and the contralateral horn served as undecidualized (UnD) control. Two, 3 mm UnD and DD harvested fragments were implanted into their respective recipient mouse strain to induce EM. (B) Representative images of the EM lesions from WT, CNR1 k/o, and CNR2 k/o mice retrieved from the peritoneal cavity at end point (7 days post EM induction surgery). (C–J) Bar plots (mean ± SD) showing the concentration of endocannabinoid (EC) ligands 2-Arachidonoylglycerol (2AG), arachidonoylethanolamine (AEA), Palmitoylethanolamide (PEA), and oleoylethanolamide (OEA) identified in the plasma and EM lesions from mice using targeted liquid chromatography-mass spectrometry (LC-MS) approach. (C–F) 2AG, AEA, PEA, and OEA were detected in plasma samples without any significant differences between groups. (G, J) Significantly higher concentration of 2AG was observed between the DD lesions of CNR2 k/o and CNR1 k/o mice, and significantly higher levels of OEA in the DD lesions from CNR1 k/o mice compared to DD lesions from WT mice. (H, I) AEA and PEA levels in the tissue samples did not differ significantly between the comparison groups. n=4–5 individual biological samples per genotype. Statistical analyses were performed using the ordinary one-way ANOVA with Holm-Sidak post hoc test. *p<0.05 and **p<0.01.
Figure 2 with 1 supplement
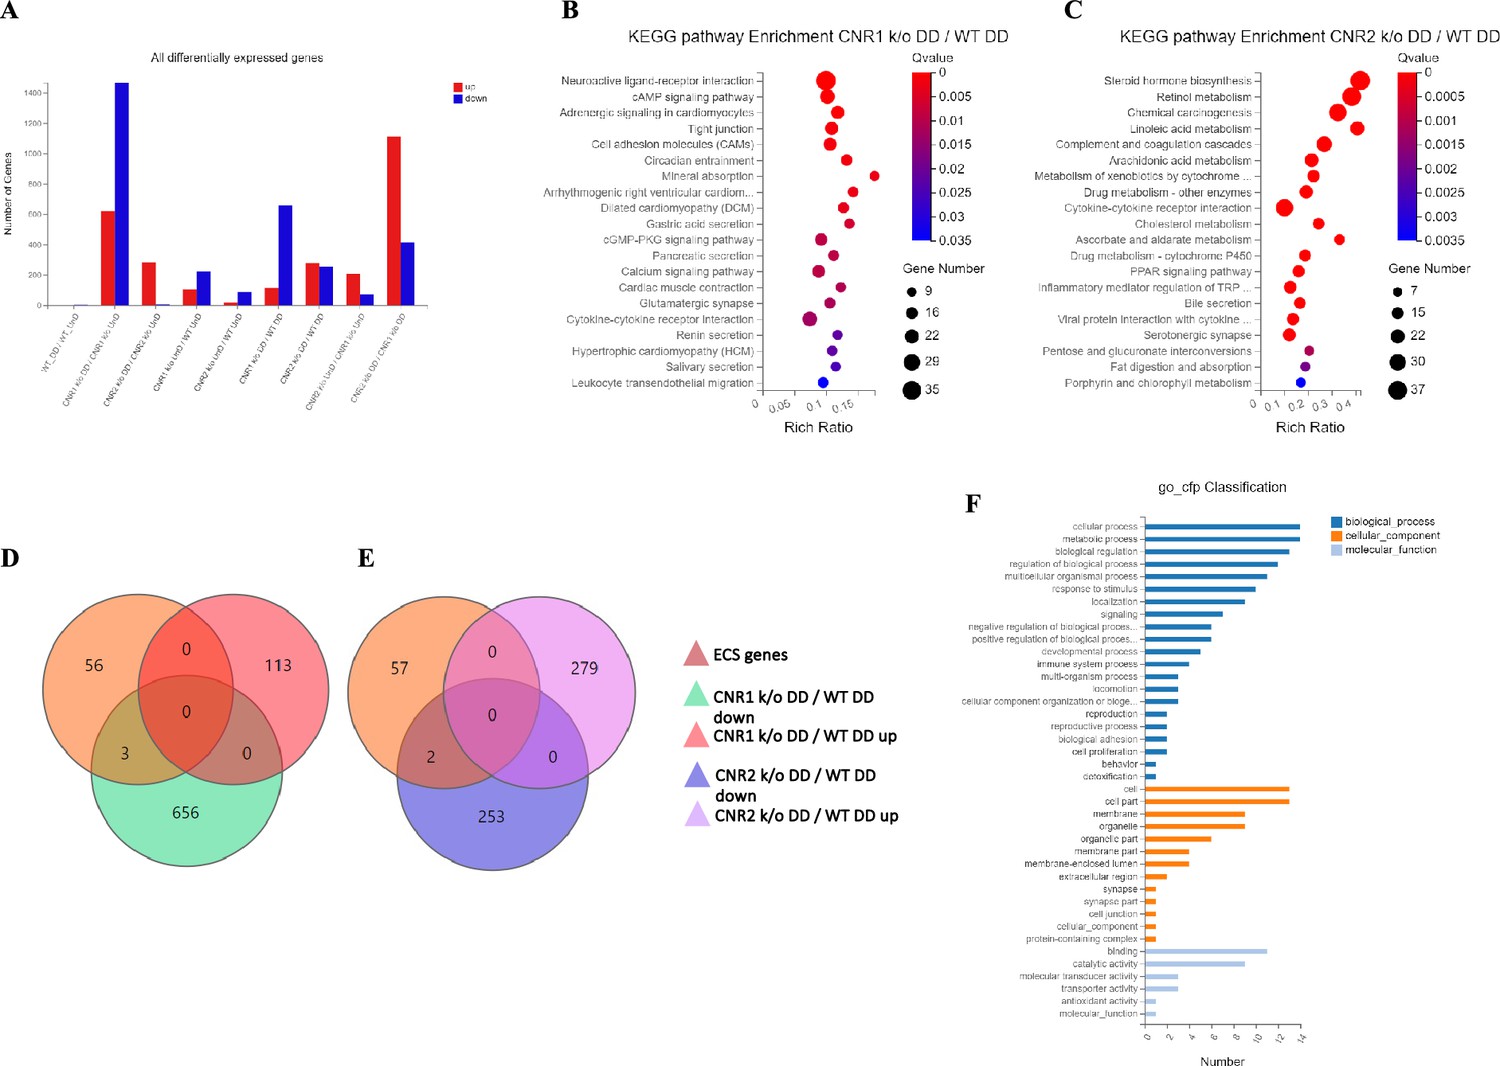
Transcriptomic profiling of endometriosis-like lesions from canonical receptors (CNR1 and CNR2) knockout mice reveals extensive differential gene expression and altered pathways.
(A) Summary of the differentially expressed genes (DEGs) from bulk RNA sequencing analysis conducted on both undecidualized (UnD) and decidualized (DD) lesions from wild-type (WT), CNR1 k/o, and CNR2 k/o mice, revealing extensive changes in gene expression profiles among the different genotypes and lesion types. A total of 1100 and 639 DEGs were identified in both UnD and DD lesions of CNR1 k/o and CNR2 k/o mice, respectively, compared to WT controls. (B) Kyoto Encyclopedia of Genes and Genomes (KEGG) pathway analysis revealed significantly altered cell adhesion molecules and cyclic adenosine monophosphate (cAMP) signaling pathways in DD lesions of CNR1 k/o. (C) KEGG pathway analysis in DD lesions of CNR2 k/o mice showed changes associated with cytokine receptor interactions and steroid hormone biosynthesis pathways. (D, E) Venn diagrams showing the DEGs among the 59 genes directly associated with the endocannabinoid system (ECS), where we found limited DEGs in DD lesions of CNR1 k/o (3) and CNR2 k/o mice (2), respectively. (F) A comprehensive gene ontology analysis highlighting the roles of 59 ECS genes across diverse biological processes (blue), cellular (orange), and molecular functions (light blue), accentuating their broader impact beyond canonical ECS functions. Gene Number indicates the number of DEGs enriched in pathway. Rich Ratio indicates the ratio of enriched DEGs to background genes and Q-value indicates significance, with a value closer to zero being more significant and is corrected by Benjamini-Hochberg method.
Figure 2—figure supplement 1
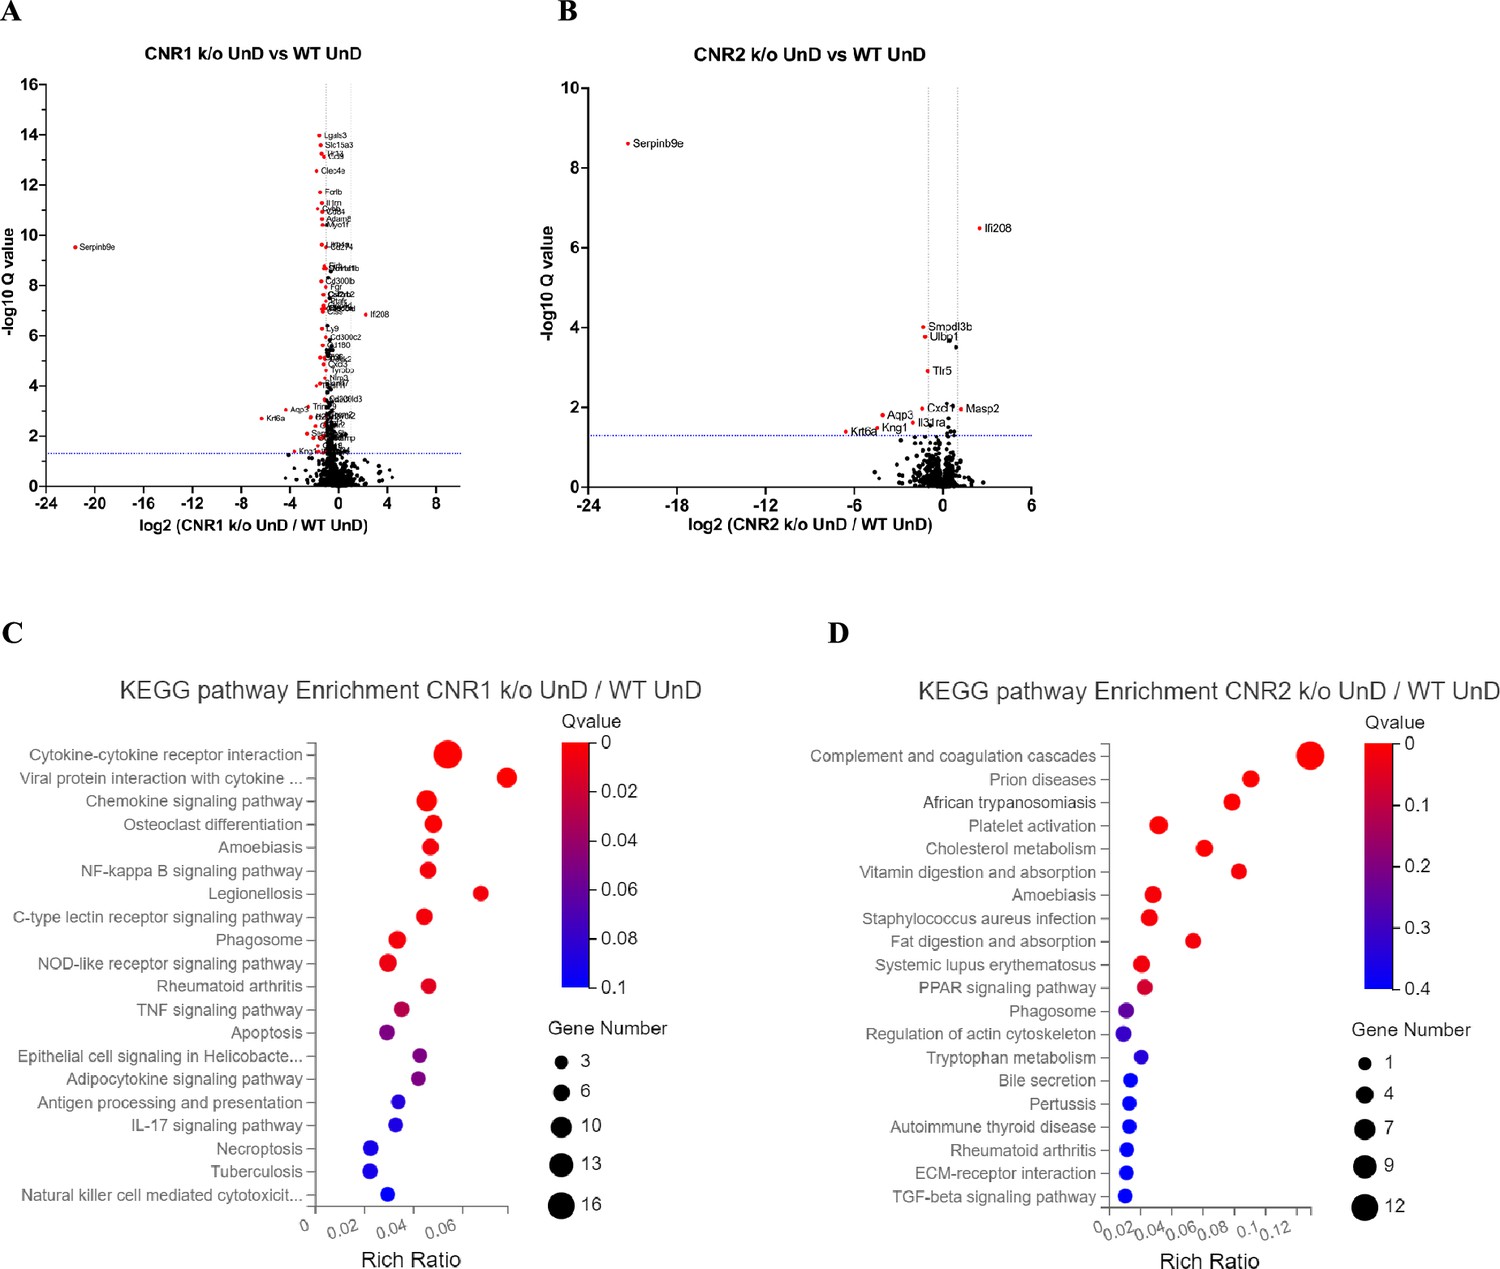
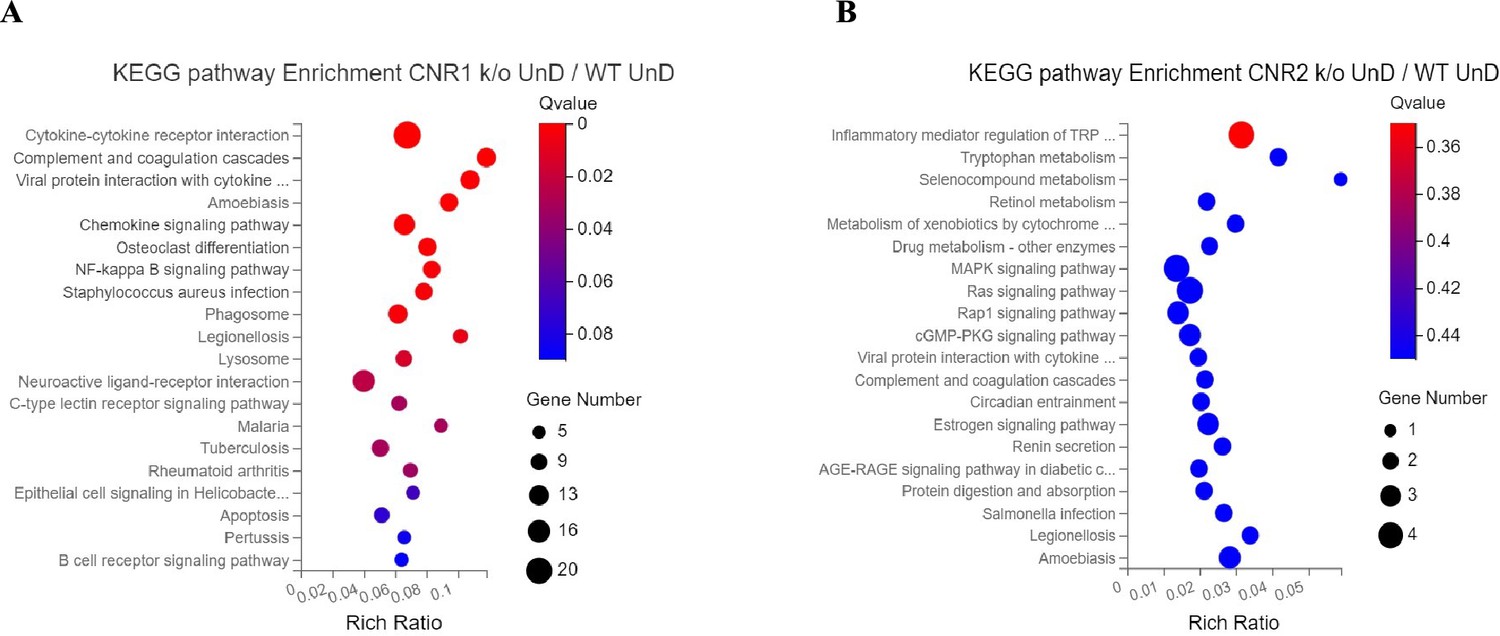
Differentially expressed genes (DEGs) of bulk RNA sequencing between the undecidualized (UnD) lesions from CNR1 k/o and CNR2 k/o compared to wild-type (WT) controls.
(A, B) The volcano plots for decidualized (DD) lesions of CNR1 k/o and CNR2 k/o compared to WT, respectively. Log2 fold change is represented on the x-axis and log10 Q-value (FDR adjusted) as the y-axis. Vertical dotted lines on the x-axis indicate ± onefold change and vertical dotted line on the y-axis indicate Q-value of 0.05. (C, D) Kyoto Encyclopedia of Genes and Genomes (KEGG) pathway analysis of DEGs of CNR1 k/o UnD lesions and CNR2 k/o UnD lesions compared to WT controls, respectively. Gene Number represents the number of DEGs enriched in the pathway. Rich Ratio shows the ratio of enriched DEGs to background genes and Q-value indicates significance, with a value closer to zero being more significant and is corrected by Benjamini-Hochberg method.
Figure 3 with 1 supplement
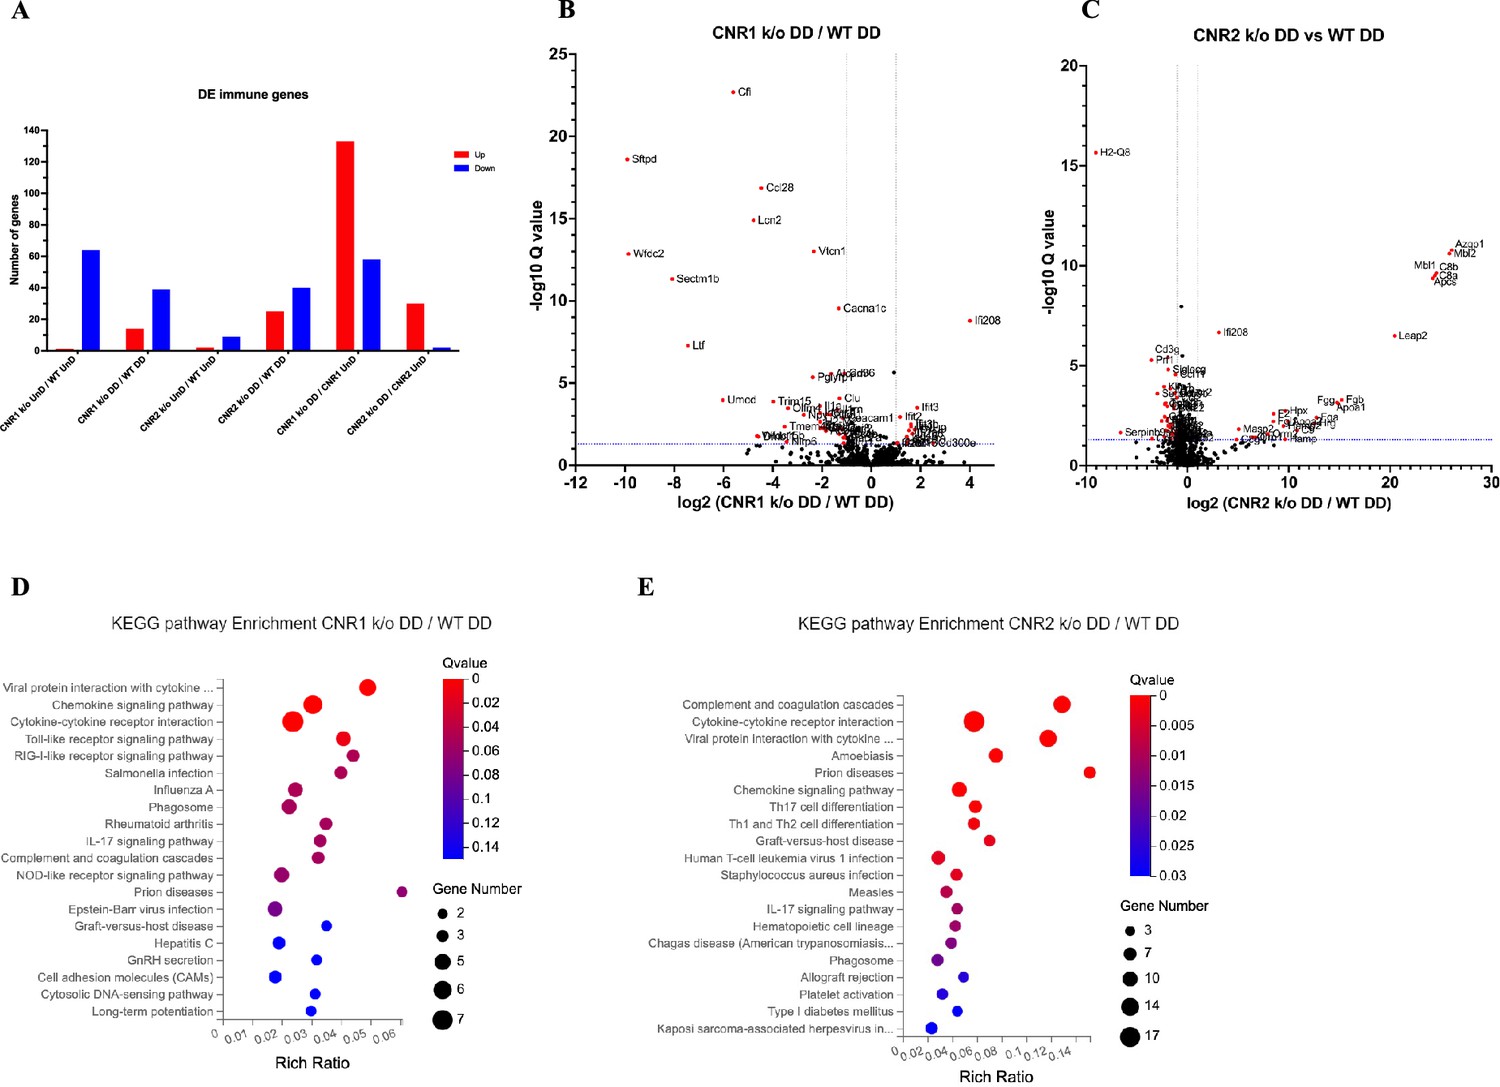
Bulk RNA sequencing revealed alterations in immune-related gene expression and pathway in endometriosis (EM) lesions from CNR1 k/o and CNR2 k/o mice.
(A) Bar plot overview of the differentially expressed (DE) immune-related genes among different genotypes and lesion types. (B, C) The volcano plots for decidualized (DD) lesions of CNR1 k/o vs. wild-type (WT) and CNR2 k/o vs. WT, respectively, revealed 39 downregulated and 14 upregulated genes in CNR1 k/o DD lesions, while CNR2 k/o DD lesions exhibited 40 downregulated and 25 upregulated genes. Log2 fold change as the x-axis and log10 Q-value (FDR adjusted) as the y-axis. Vertical dotted lines on the x-axis indicate ±onefold change and vertical dotted line on the y-axis indicate Q-value of 0.05. (D, E) Kyoto Encyclopedia of Genes and Genomes (KEGG) pathway analysis of differentially expressed genes (DEGs) in CNR1 k/o DD lesions show significant alteration in the chemokine signaling pathway, cytokine-cytokine receptor interaction, and toll-like receptor signaling pathways, while in CNR2 k/o DD lesions, alterations were observed in pathways related to cytokine-cytokine receptor interaction, Th17, Th1, and Th2 cell differentiation.
Figure 3—figure supplement 1
Kyoto Encyclopedia of Genes and Genomes (KEGG) pathway analysis of immune specific differentially expressed genes (DEGs).
(A, B) Immune specific genes that were differentially expressed were subjected to KEGG pathway analysis between CNR1 k/o undecidualized (UnD) lesions and CNR2 k/o UnD lesions compared to wild-type (WT) UnD controls, respectively.
Figure 4 with 2 supplements
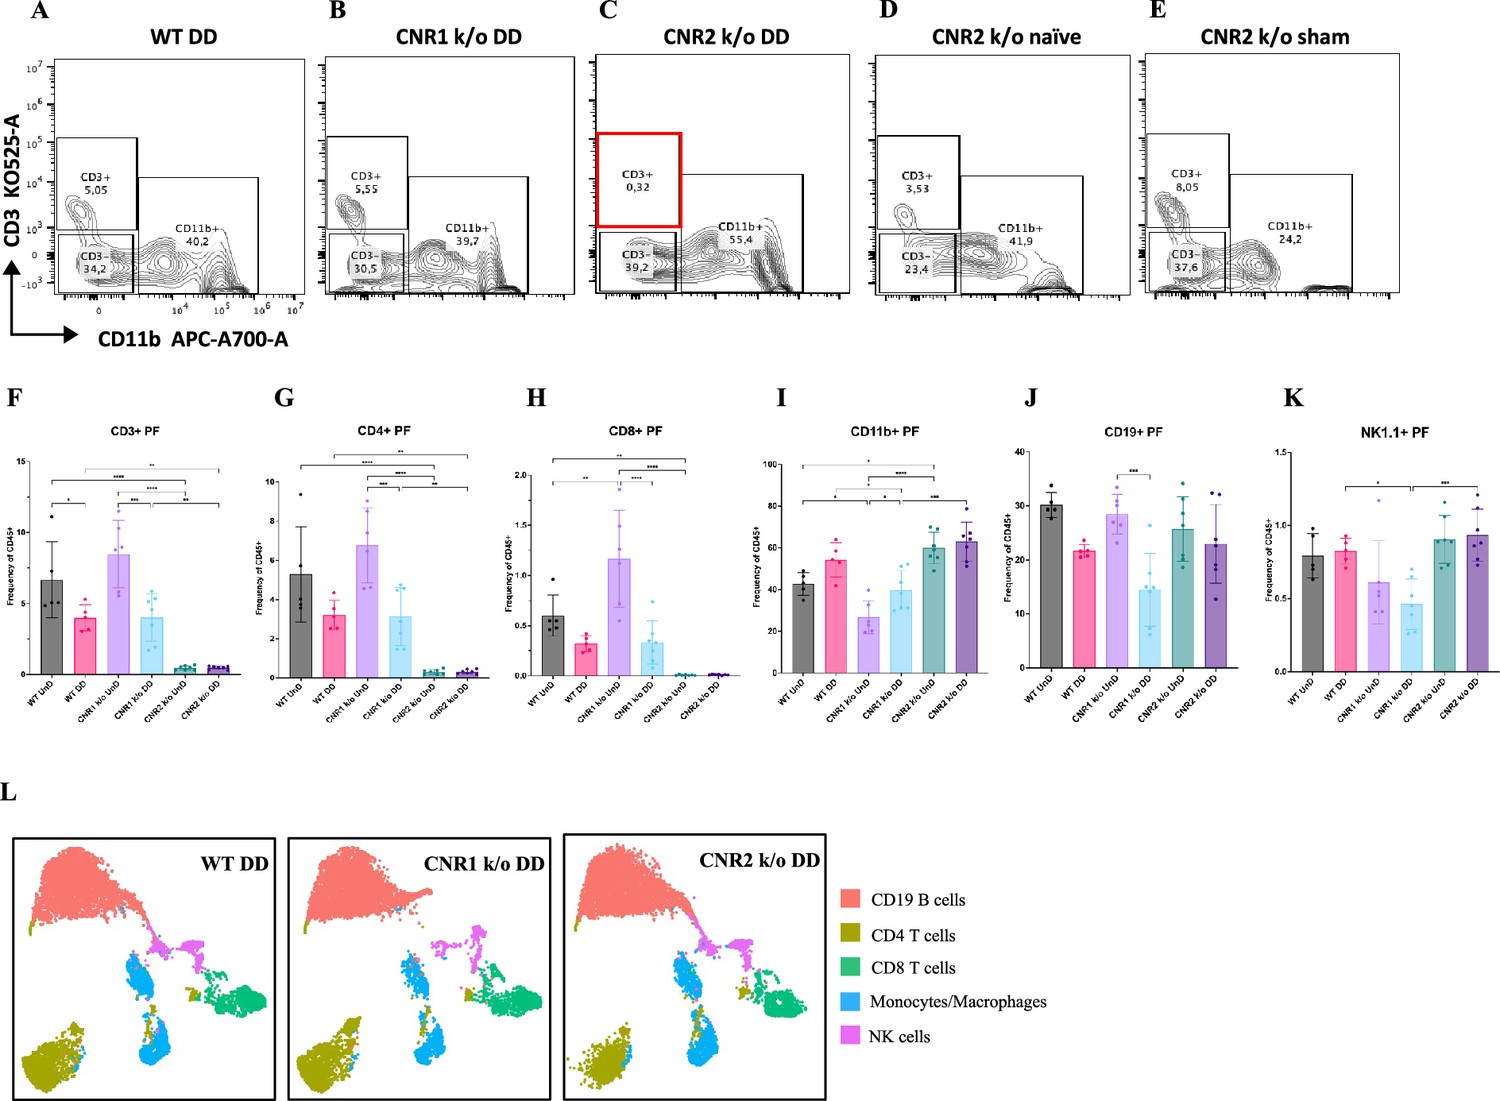
Flow cytometry profiling of peritoneal fluid (PF) and splenic cells show altered immune cell phenotypes in CNR1 k/o and CNR2 k/o mice with endometriosis (EM).
(A–E) Gating panels of PF cells showing CD3 KO525-A on the y-axis vs CD11b APC-A700-A on the x-axis among wild-type (WT), CNR1 k/o, and CNR2 k/o mice with decidualized (DD) EM lesions, as well as CNR2 k/o naive and CNR2 k/o sham-operated controls. (F) CD3 + total T cells in the PF of CNR2 k/o mice with EM lesions, regardless of lesion types, were significantly reduced compared to WT and CNR1 k/o mice with EM, as well as CNR2 k/o naïve and sham operated mice. (G, H) This extended to the subsets of CD3 + T cells, CD4+, and CD8 + T cells, respectively. CNR1 k/o mice with DD lesions also exhibited significantly decreased CD3 + total T cells, CD4 + helper T cells, and CD8 + cytotoxic T cell frequencies compared to their undecidualized (UnD) counterparts. (I) CD11b+ monocyte/macrophage populations were increased in the PF of CNR2 k/o mice with UnD and DD lesions compared to WT and CNR1 k/o mice. CNR1 k/o mice with DD lesions displayed higher monocyte/macrophage populations compared to their UnD counterparts. (K, J) CNR1 k/o mice with DD lesions exhibited lower CD19 + B cells and NK1.1+ NK cell populations compared to WT and CNR2 k/o mice. (L) Immune cell populations in splenocytes were analogous to findings from PF cells, depicted by tSNE plots. n=5–7 individual biological samples per genotype. Statistical analyses were performed using the ordinary one-way ANOVA with Holm-Sidak post hoc test. *p<0.05, **p<0.01, ***p<0.001, and ****p<0.0001. Data presented as mean ± SD.
Figure 4—figure supplement 1
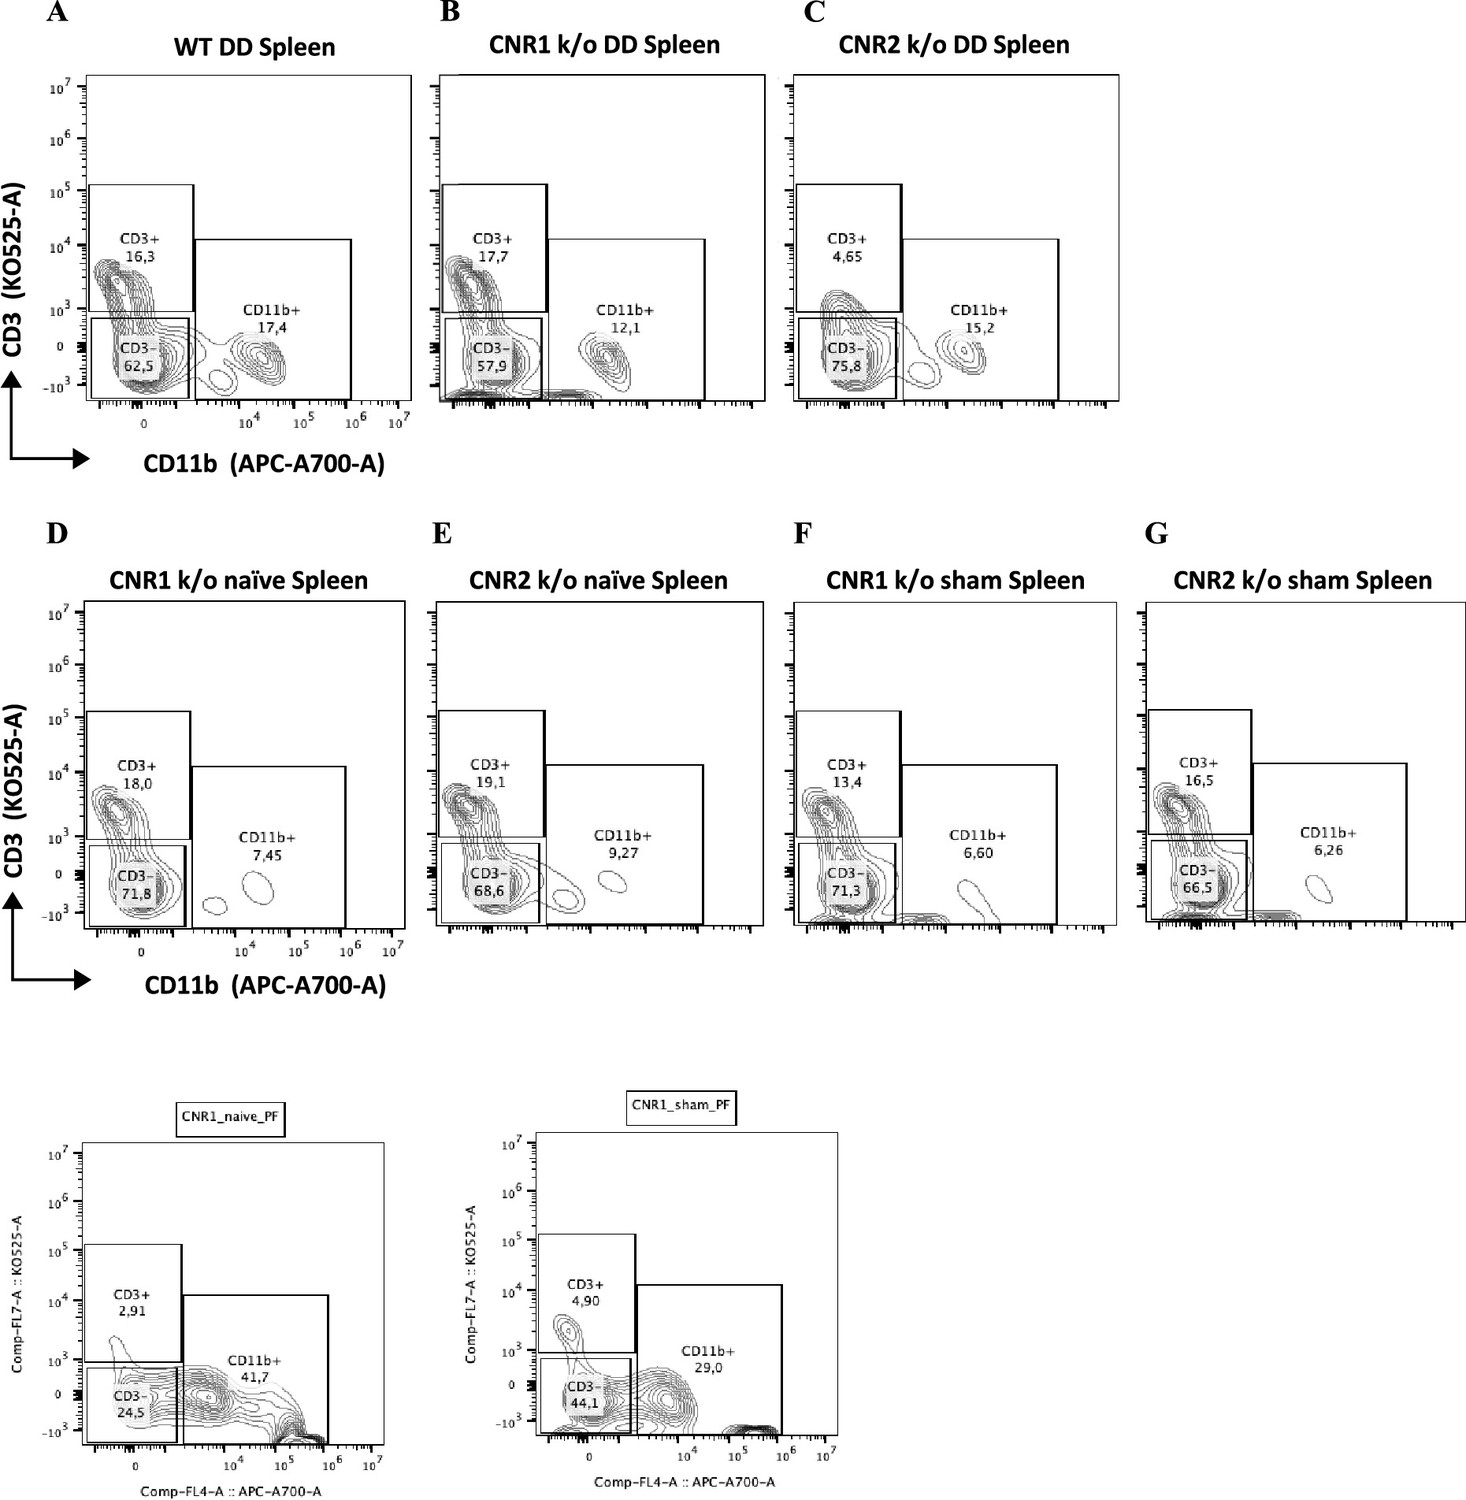
Gating panel representing T cells from splenocytes.
(A–G) Splenocytes stained for CD3 on the y-axis and CD11b on the x-axis among wild-type (WT), CNR1 k/o, and CNR2 k/o mice with endometriosis (EM) like condition, as well as CNR1 k/o and CNR2 k/o naive and sham-operated controls.
Figure 4—figure supplement 2
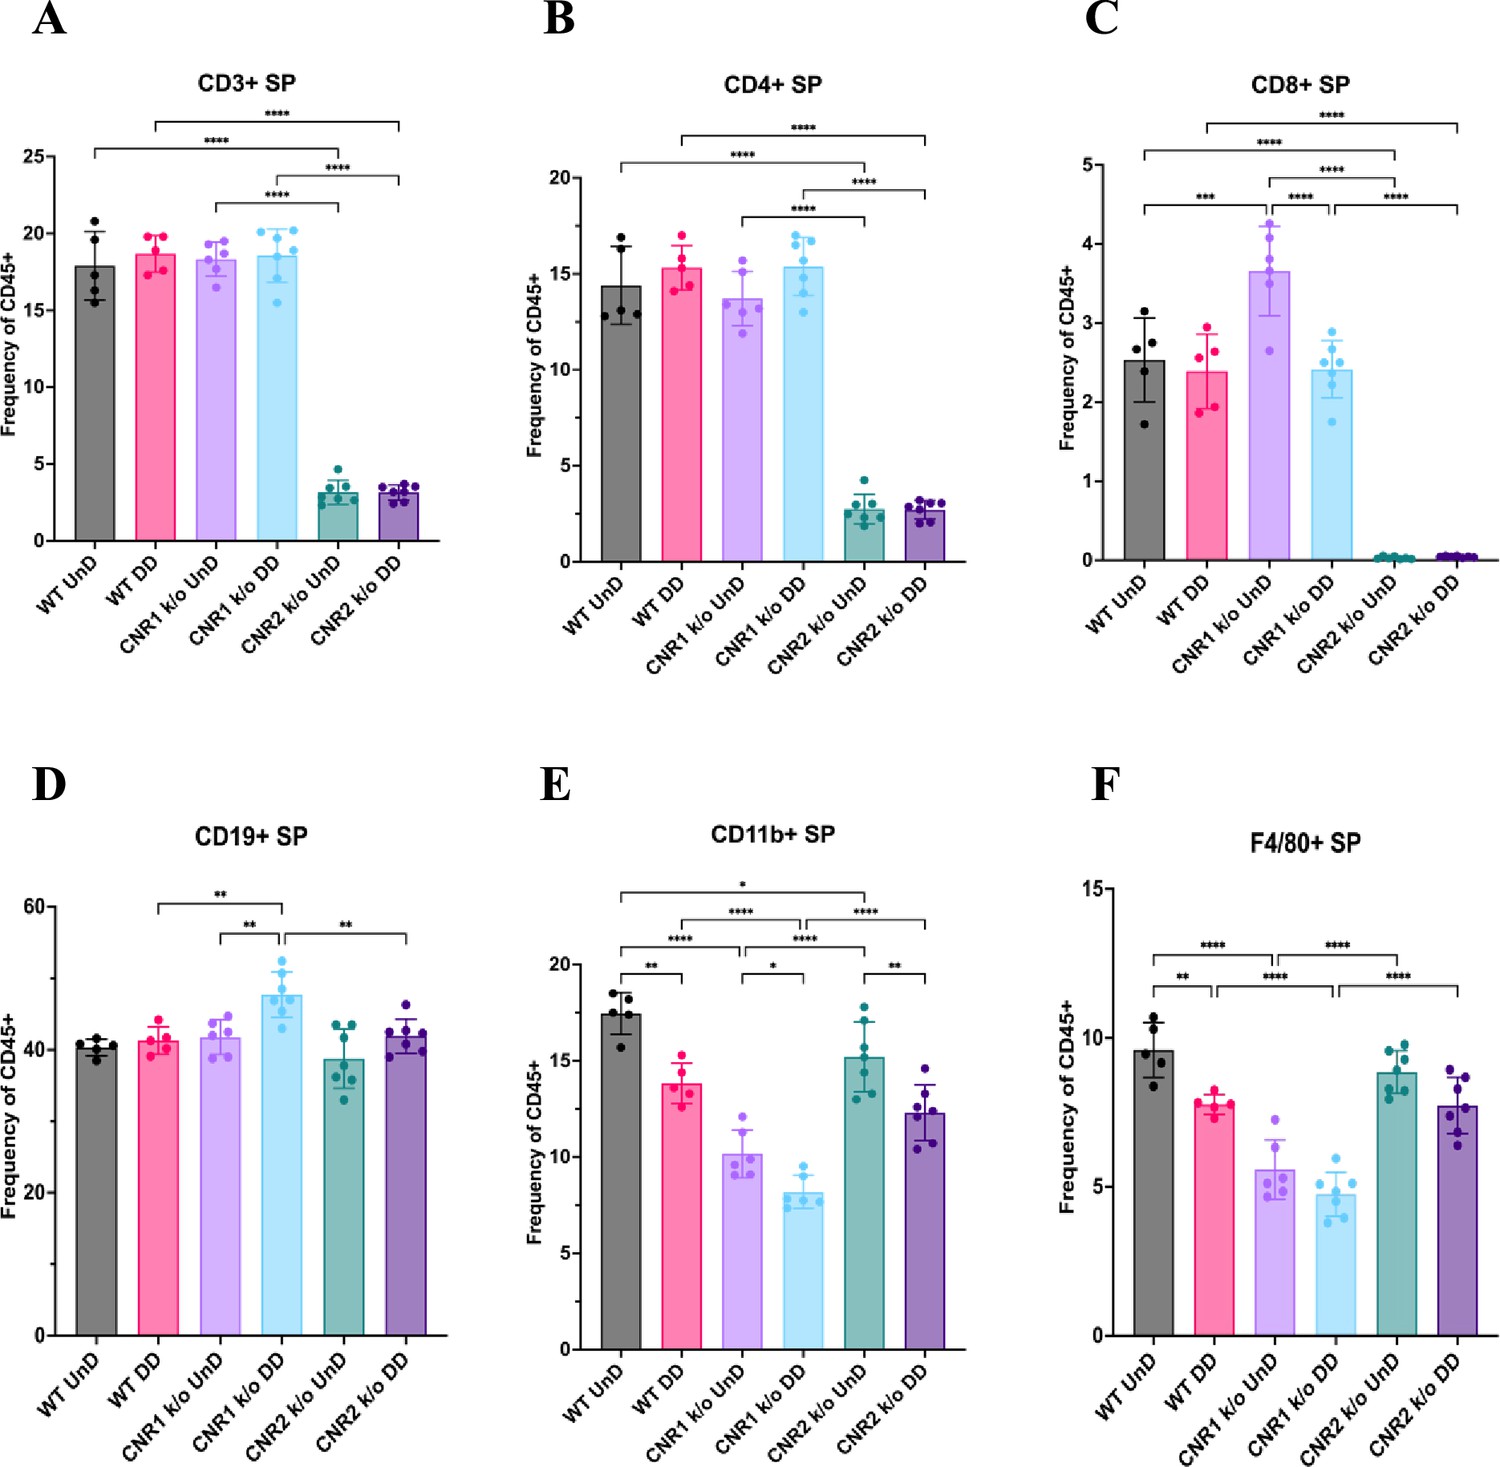
Flow cytometry analysis of immune cell phenotypes in the splenocytes of wild-type (WT), CNR1 k/o and CNR2 k/o mice with EMS.
(A–F) Bar plot (mean ± SD) representation of splenocytes (SP) stained for CD3 + total T cells, CD4 + helper T cells, CD8 + cytotoxic T cells, CD19 + B cells, CD11b+ monocytes, and F4/80 monocytes/macrophages of all the genotypes with endometriosis (EM) lesions, respectively. n=5–7 individual biological samples per genotype. Statistical analyses were performed using the ordinary one-way ANOVA with Holm-Sidak post hoc test. *p<0.05, **p<0.01, ***p<0.001, and ****p<0.0001.
Figure 5 with 1 supplement
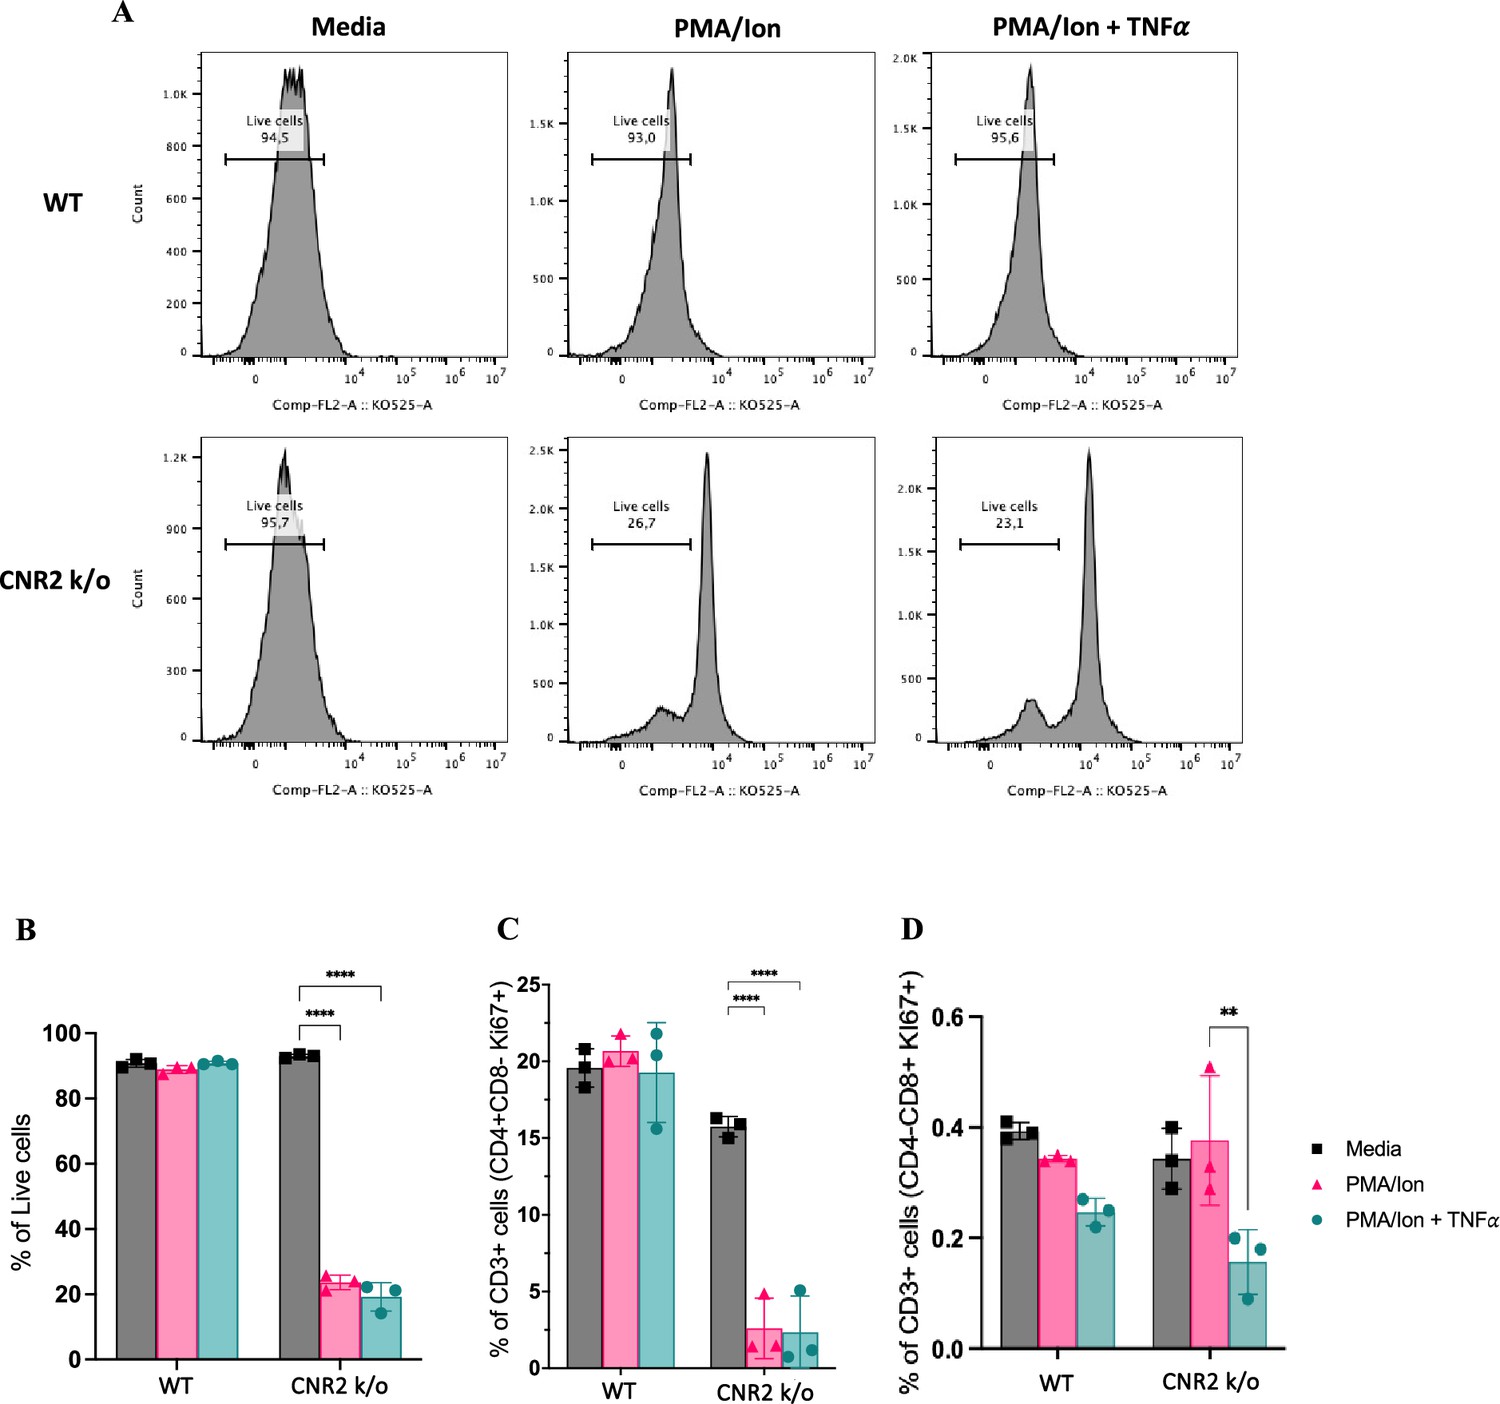
In-vitro validation of CNR2 deficiency on CD3 T cell viability and functionality in conditions representative of Endometriosis (EM) lesion microenvironment.
(A) Representative gating of percentage live, CD3 + total T cells from wild-type (WT) and CNR2 k/o mice activated with or without PMA/Ionomycin cocktail in the presence or absence of tumor necrosis factor-alpha (TNFα) and media control. Graph with live gating shows count on the y axis and live/dead-KO525 marker on the x-axis. (B) Bar graphs of percentage live population of CD3 + total T cells from CNR2 k/o mice show a significant decrease in the viability of cells activated with PMA/ionomycin with or without TNFα. Whereas, no significant changes were observed in the CD3 + total T cells from WT mice as well as from CNR2 k/o mice in media. (C) Activation of CD3 + T cells of CNR2 k/o mice with PMA/ionomycin affected proliferation of CD4 + helper T cells specifically, with or without the presence of TNFα when compared to both their media control and WT controls. (D) No significant changes were observed in the proliferative CD8 + cytotoxic T cells from CNR2 k/o mice compared to their WT controls across different activation and non-activation groups. Ordinary two-way ANOVA with Tukey’s post hoc test was performed to assess statistical significance. **p<0.05, ****p<0.0001. n=3 technical replicates. Data presented as mean ± SD.
Figure 5—figure supplement 1
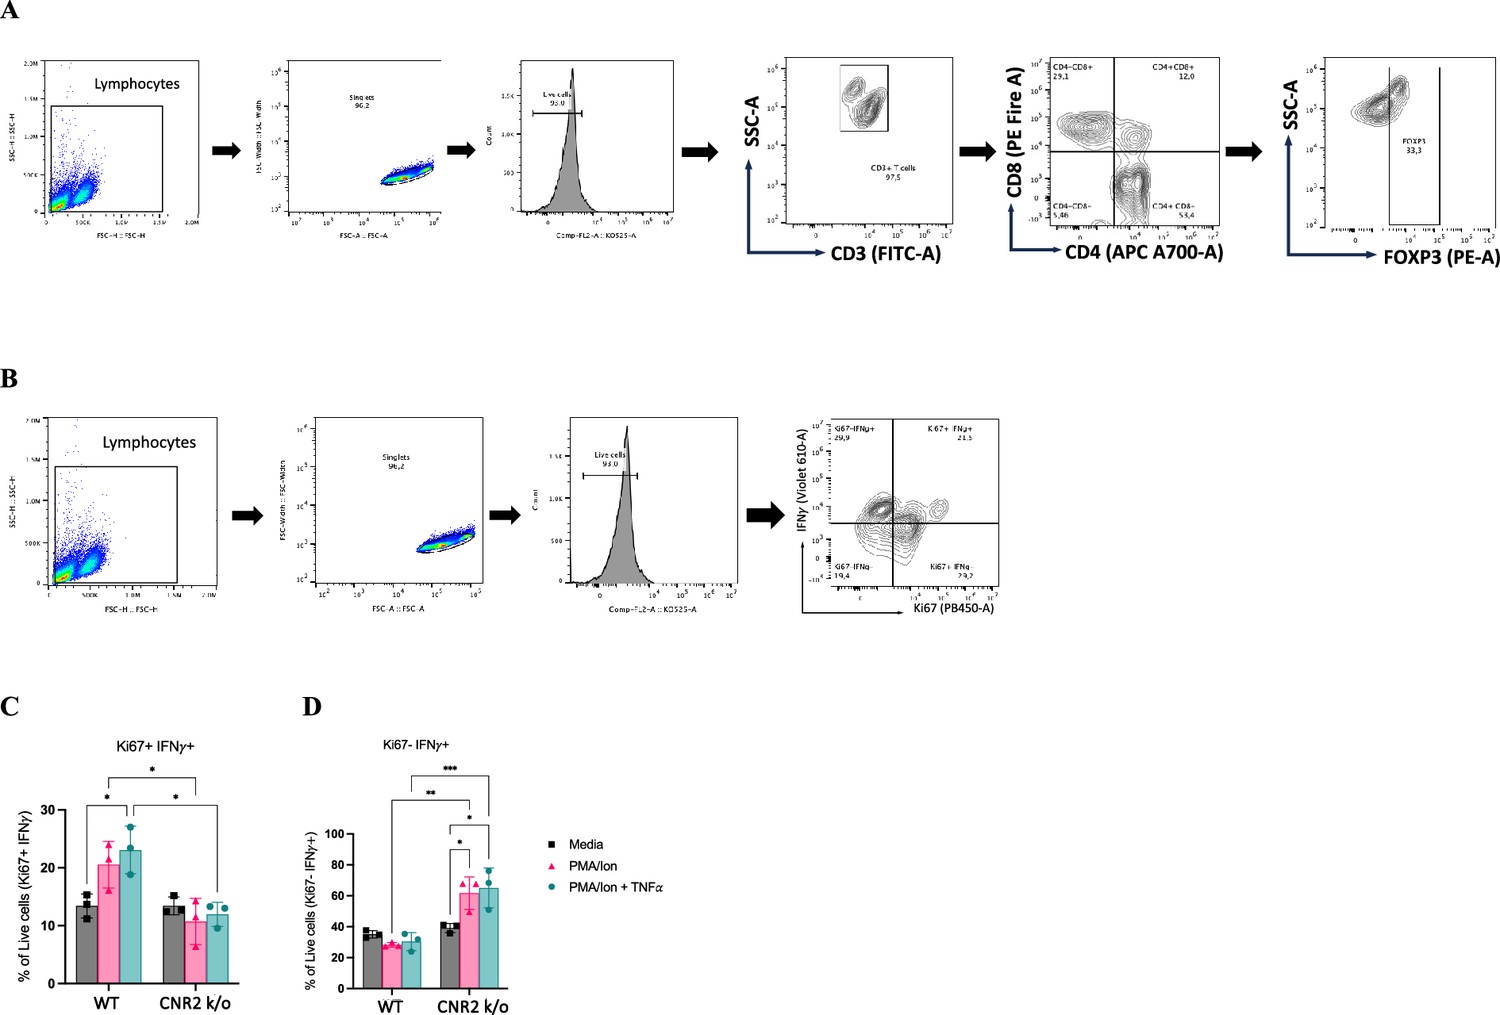
In vitro functional assay and flow cytometry evaluation of activated CD3 T cells from naïve wild-type (WT) and CNR2 k/o mice.
(A, B) Flow cytometry gating strategies for CD3 + T cells to identifiy the different phenotypes and functional state, respectively. (C) Bar plots representing the percentage positive live cells that are double positive for proliferation (Ki67) and interferon-gamma (IFNγ) markers. (D) Bar plots showing the percentage positive live cells that are negative for Ki67 and positive for IFNγ. Statistical analyses were performed using the ordinary one-way ANOVA with Holm-Sidak post hoc test. *p<0.05, **p<0.01, ***p<0.001, and ****p<0.0001. Data presented as mean ± SD.
Figure 6
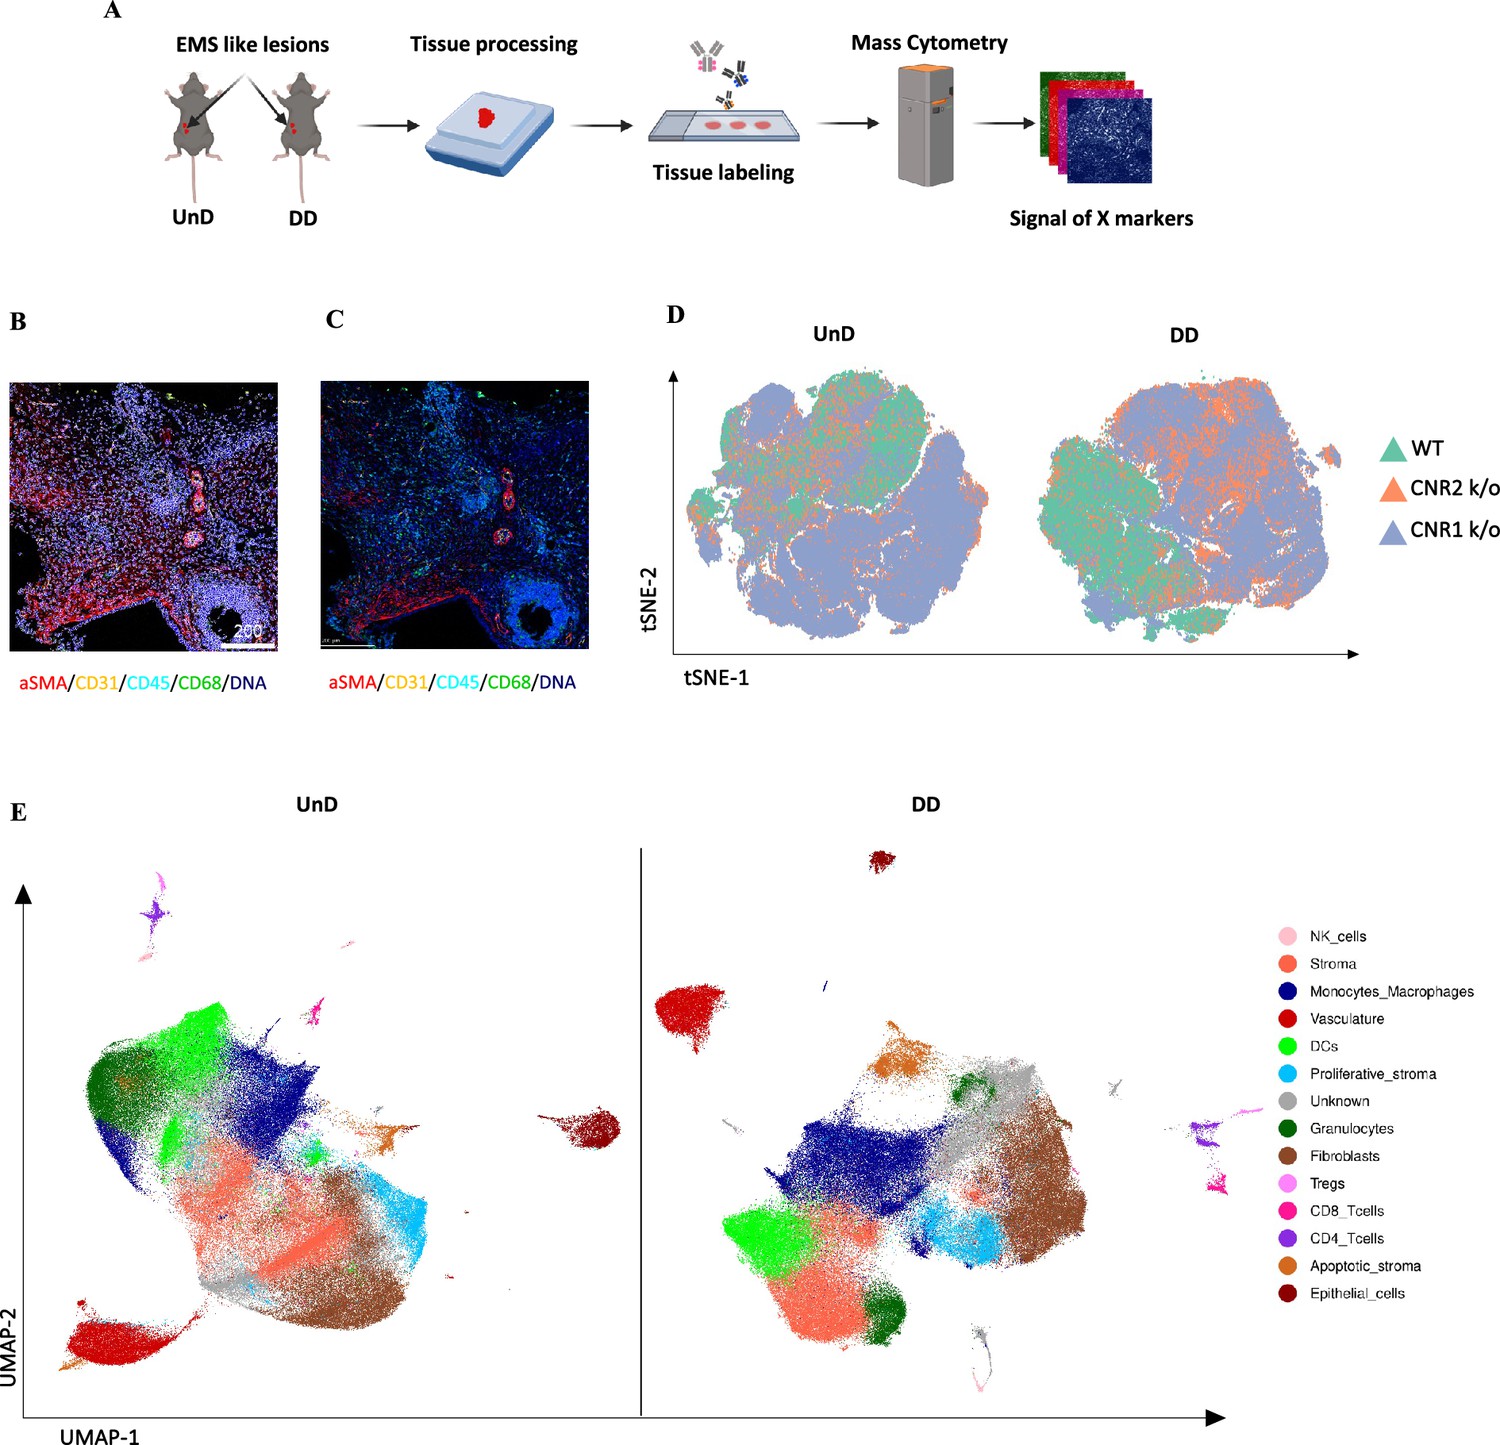
Imaging mass cytometry spatial profiling of immune cell distribution and cellular patterns in endometriosis (EM) lesions in CNR1 k/o, CNR2 k/o, and wild-type (WT) mice.
(A) The imaging mass cytometry (IMC) data collection and analysis workflow outlines the steps involved in gaining comprehensive insights into the spatial distribution of immune cells and relevant cell types within undecidualized (UnD) and decidualized (DD) EM-like lesions of WT, CNR1 k/o, and CNR2 k/o mice. (B, C) Representative images showing the single-cell segmentation performed following the acquisition of two regions of interest (ROI) per section (three biological samples per genotype) and segmentation quality of the data after segmentation analysis was conducted, respectively. (D) Non-linear dimensionality reduction after batch effect correction showed distinct expression patterns of immune cells and cell state markers between UnD and DD lesions. DD lesions from the CNR1 k/o and CNR2 k/o mice showed expression pattern that was significantly different from the DD lesions of WT mice, as well as compared to UnD lesions among different genotypes. (E) Uniform manifold approximation and projection (UMAP) dimensionality reduction highlighted key cell types and differences in composition between UnD and DD lesions. DD lesions exhibited increased stroma and fibroblasts, decreased epithelial cells, and heightened macrophage infiltration compared to UnD lesions.
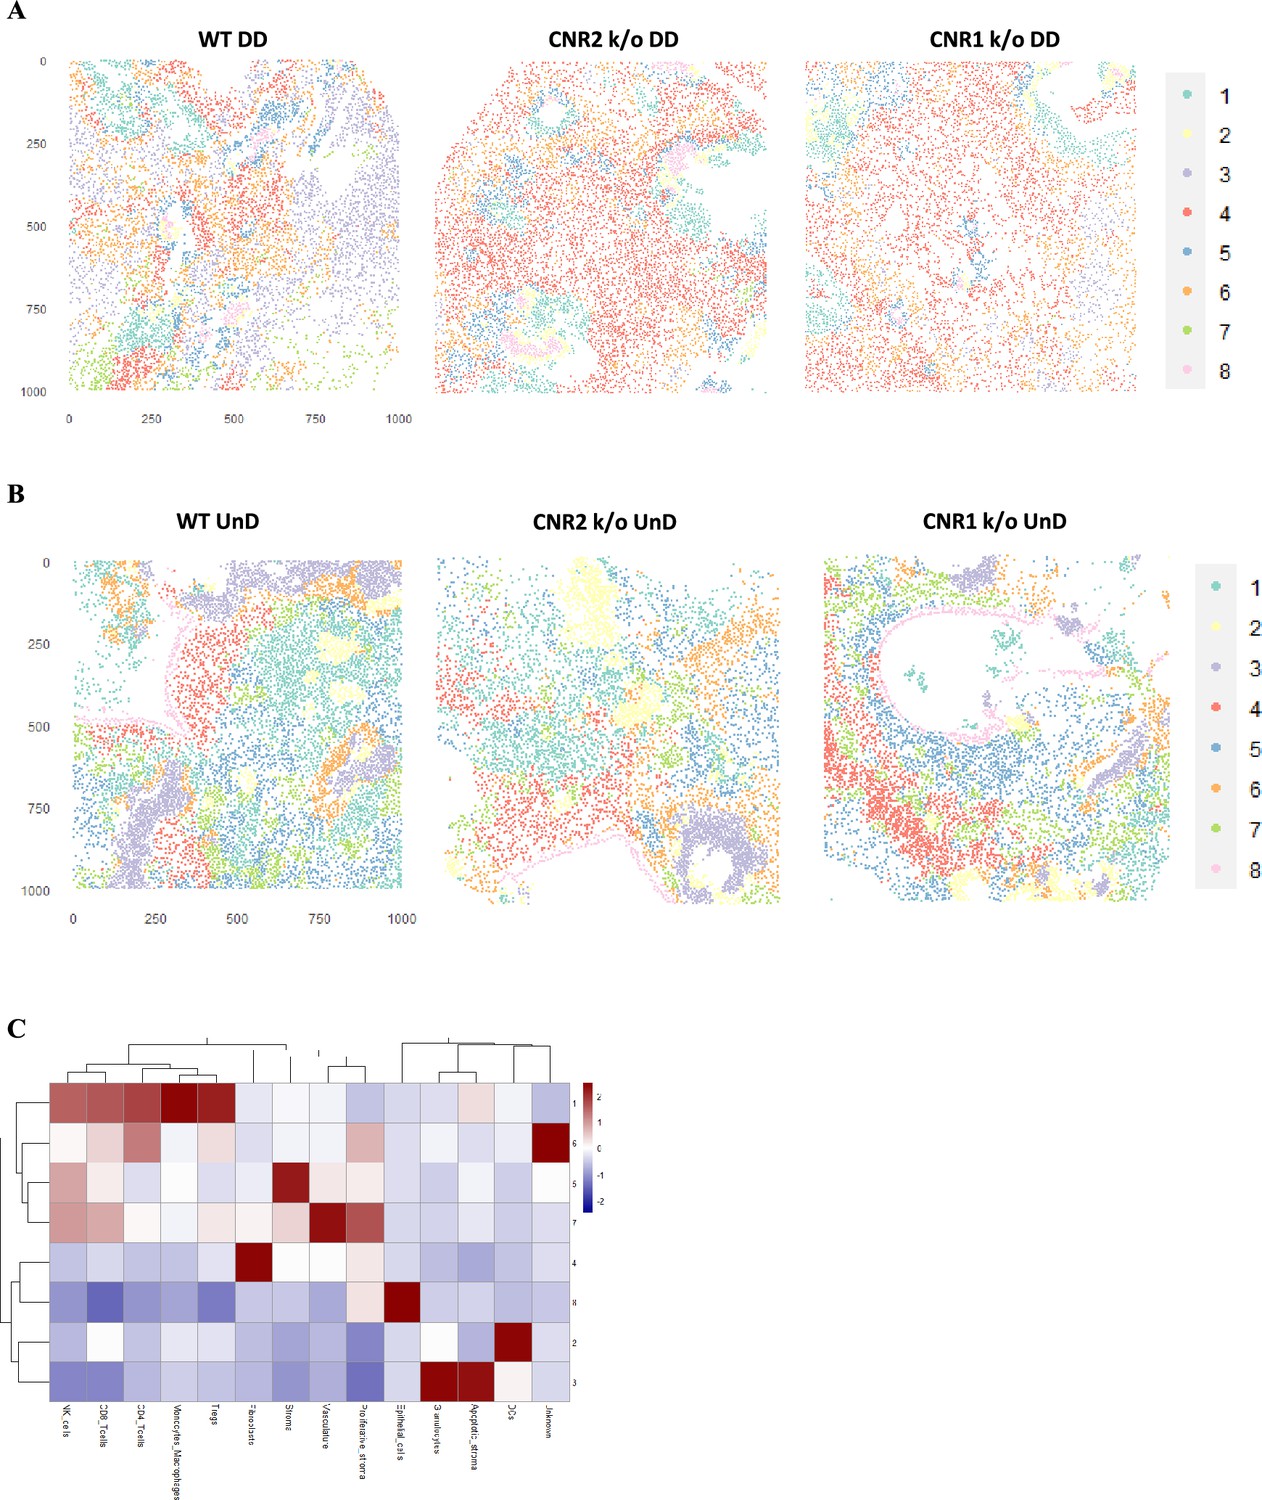
Figure 7 with 1 supplement
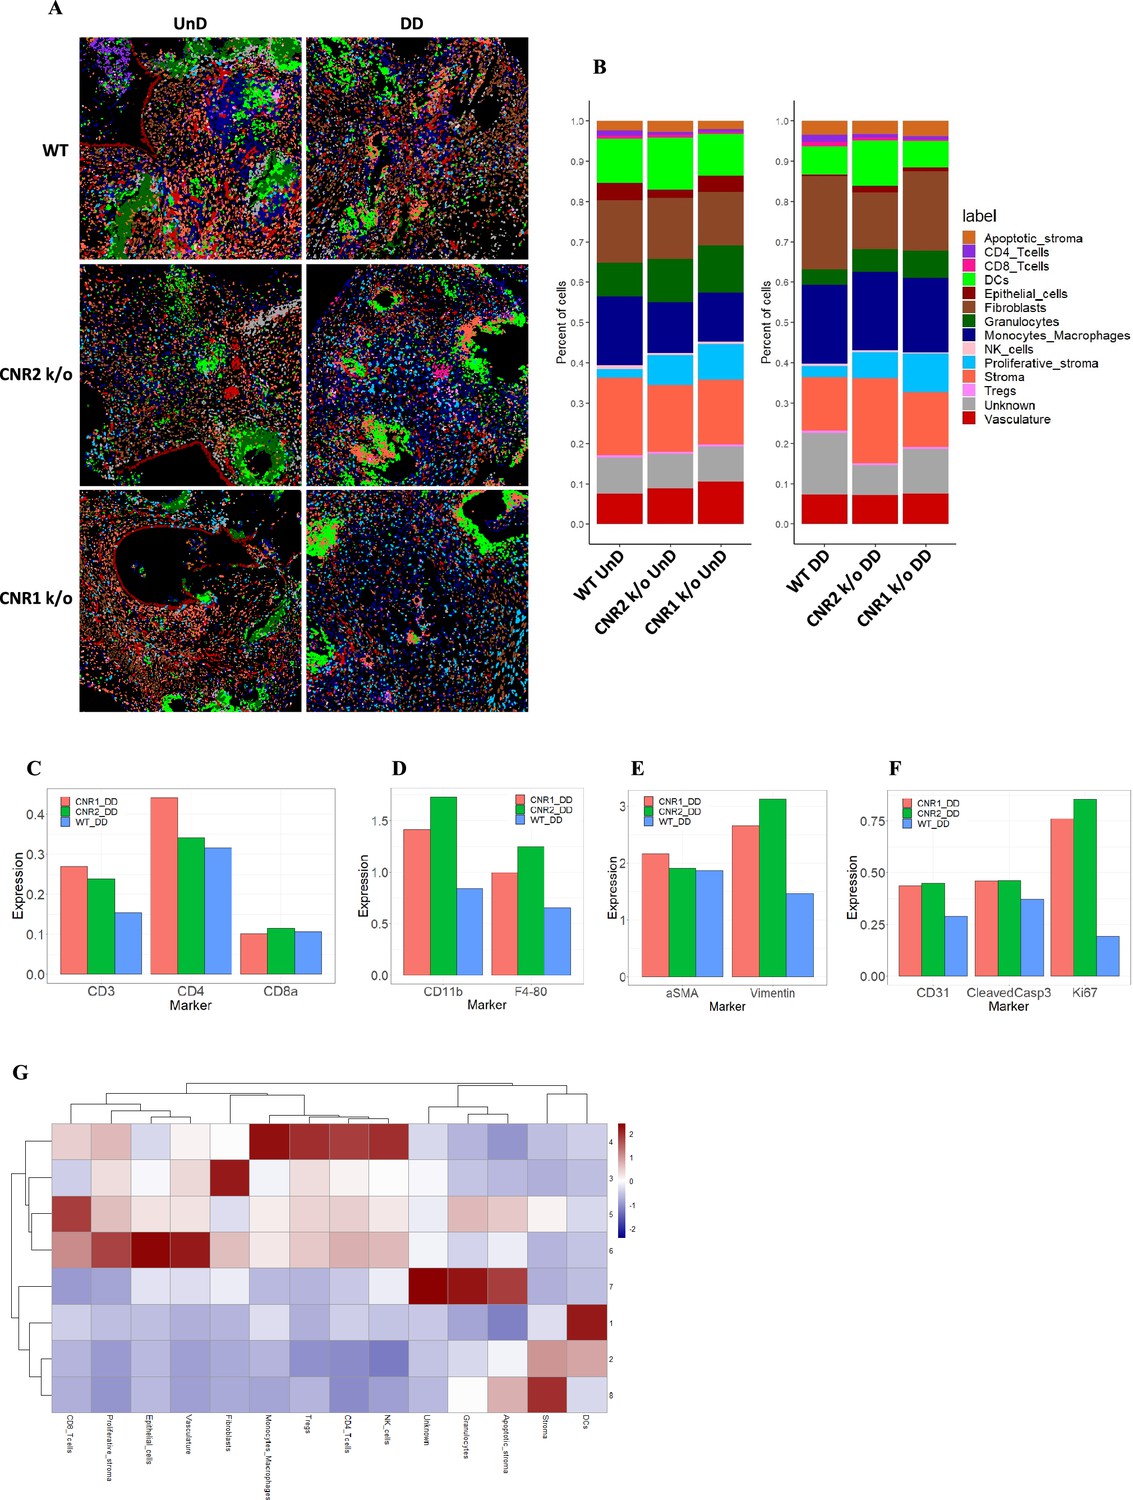
Imaging mass cytometry revealed altered cellular composition and neighborhoods in endometriosis (EM) lesions from CNR1 k/o, CNR2 k/o, and wild-type (WT) mice.
(A) Representative image showing the distribution of different cell types within EM lesions (n=2–3 per tissue type) based on unsupervised clustering and labeling. (B) Stacked bar plots reveal the distribution of various cell types within undecidualized (UnD) and decidualized (DD) lesions of CNR1 k/o and CNR2 k/o mice compared to WT mice. (C) Increased CD3 + T cells and CD4 + helper T cells expression was found in the DD, EM lesions from CNR1 and CNR2 k/o mice compared to WT mice highlighting that T cells residing in the lesions were not affected. (D) CD11b+ monocyte and F4/80+ macrophage expression was significantly increased in the DD, EM lesions from mice lacking CNR1 and CNR2 compared to the WT controls. (E) Vimentin expressing stromal compartments that predominantly make up the EM lesions were also significantly increased in the DD lesions from CNR1 k/o and CNR2 k/o mice compared to WT mice. (F) Hallmark features of EM lesions, such as proliferation (Ki67+) and vascularization (CD31+) were significantly increased in the DD, EM lesions from mice lacking CNR1 and CNR2 compared to the WT controls. Combined, it highlights the effect on early lesion development and further progression through sustained proliferation due to dysregulated CNR1 and CNR2. (G) Heatmap representation of the CN analysis show distinct clustering patterns observed in the DD lesions among the different genotypes, where immune cells mainly clustered together in CN 4, while other cell types such as stroma, epithelial cells, and vasculature exhibited distinct clustering patterns across CN 6, 3, and 8, respectively.
Figure 7—figure supplement 1
Imaging mass cytometry (IMC) and cellular neighbourhoods (CN) in undecidualized (UnD), EMS lesions from CNR1 k/o, CNR2 k/o, and wild-type (WT) mice.
(A, B) Representative image of eight distinct cell types from cellular neighborhood (CN) analysis of decidualized (DD) and UnD lesions from WT, CNR1 k/o, and CNR2 k/o mice, respectively. (C) Heatmap representation of CN analysis shows distinct clustering patterns observed in the UnD lesions among the different genotypes. The clustering reveals distinct spatial patterns of immune cell populations within the UnD lesions, which appear to differ from the observations in Figure 7G. This suggests potential spatial heterogeneity in the immune landscape of endometriosis (EM) like lesions under conditions of decidualization.
Additional files
-
Supplementary file 1
Deuterated and non-deuterated standards, experimental LC-MS conditions for ECS ligand identification, and IMC antibodies with dilutions.
- https://cdn.elifesciences.org/articles/96523/elife-96523-supp1-v1.xlsx
-
Supplementary file 2
List of total differentially expressed genes in the lesions of wild-type (WT), CNR1 k/o, and CNR2 k/o mice.
- https://cdn.elifesciences.org/articles/96523/elife-96523-supp3-v1.xlsx
-
Supplementary file 3
Differentially expressed immune related genes in the lesions of wild-type (WT), CNR1 k/o, and CNR2 k/o mice.
- https://cdn.elifesciences.org/articles/96523/elife-96523-supp4-v1.xlsx
-
MDAR checklist
- https://cdn.elifesciences.org/articles/96523/elife-96523-mdarchecklist1-v1.docx
-
Source data 1
Normalized, total bulk RNA sequencing data along with sample ID.
- https://cdn.elifesciences.org/articles/96523/elife-96523-data1-v1.xlsx
Download links
A two-part list of links to download the article, or parts of the article, in various formats.
Downloads (link to download the article as PDF)
Open citations (links to open the citations from this article in various online reference manager services)
Cite this article (links to download the citations from this article in formats compatible with various reference manager tools)
Endocannabinoids and their receptors modulate endometriosis pathogenesis and immune response
eLife 13:RP96523.
https://doi.org/10.7554/eLife.96523.3


