Sex-dependent, lateralized engagement of anterior insular cortex inputs to the dorsolateral striatum in binge alcohol drinking
- Department of Pharmacology & Toxicology, Indiana University School of Medicine, United States
- Stark Neurosciences Research Institute, Indiana University School of Medicine, United States
Figures
Figure 1 with 1 supplement
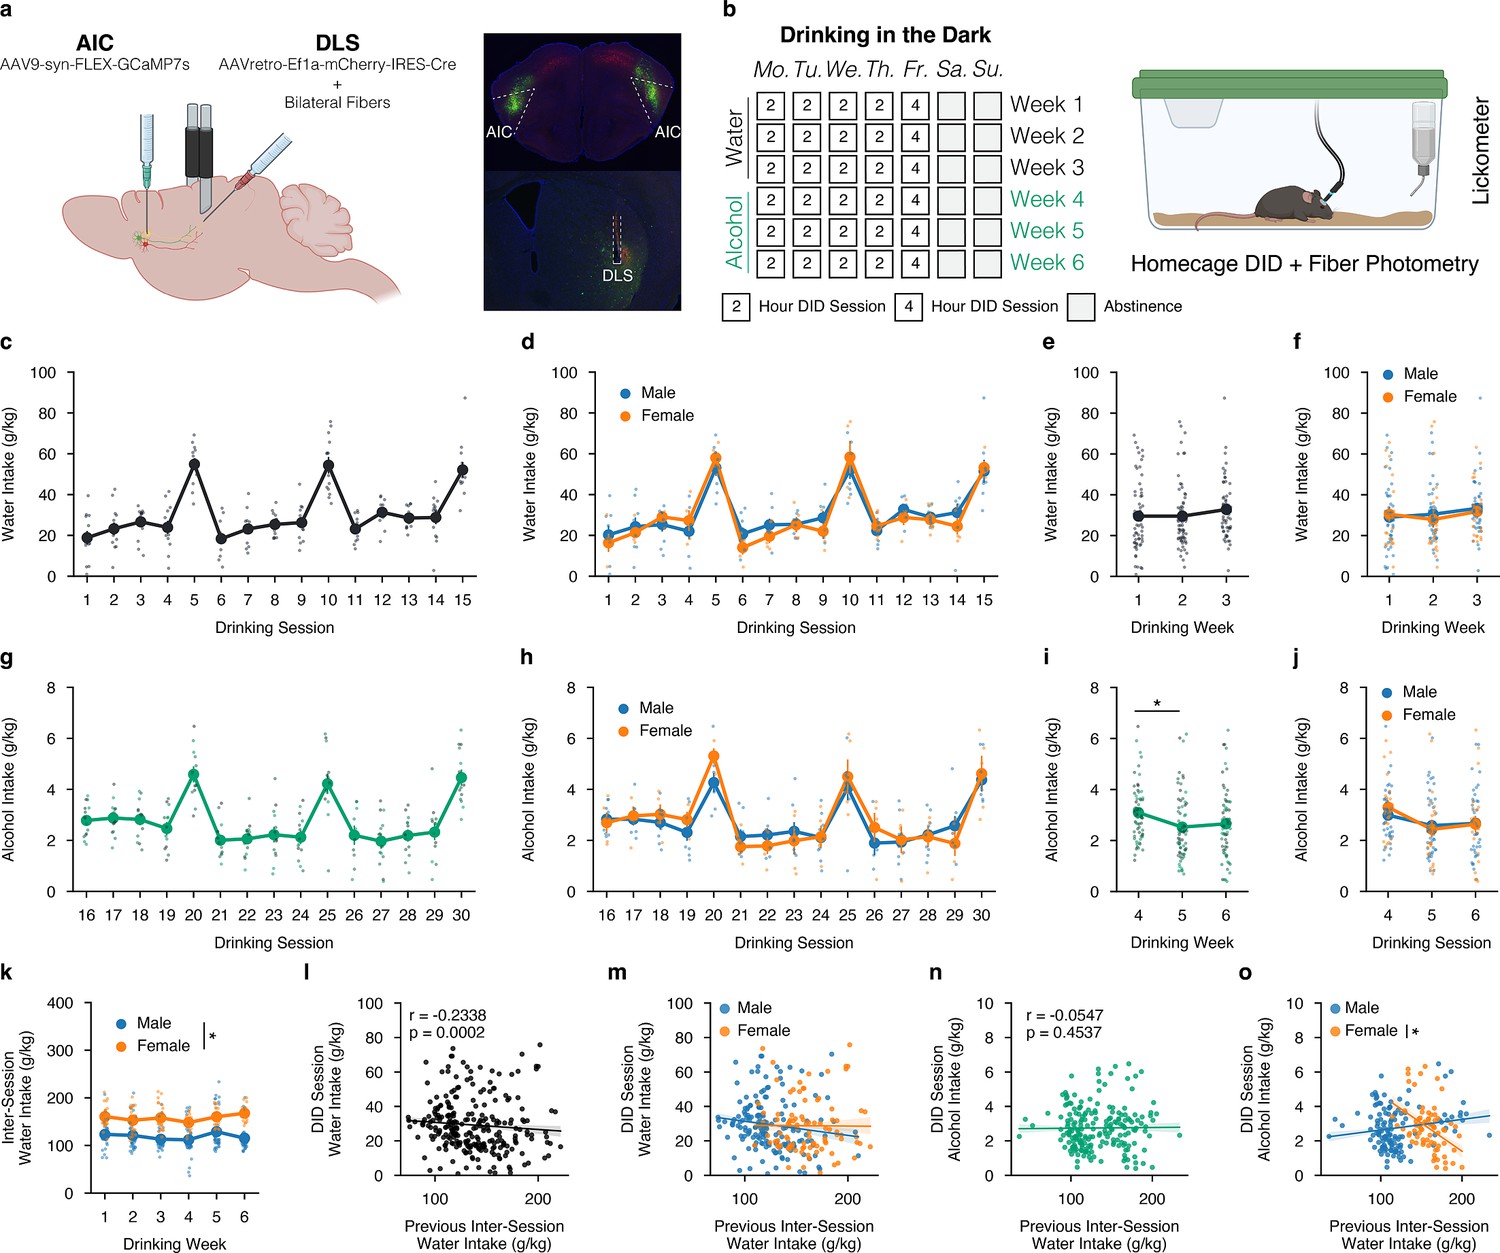
Sex-dependent differences in water and alcohol drinking in the dark (DID).
(a) Representation of viral strategy and expression to record presynaptic calcium activity of anterior insular cortex (AIC) inputs within the dorsolateral striatum (DLS).(b) Schematic of drinking in the dark (DID) protocol. (c) Group and individual animals’ water consumption by DID session (n=14 animals). (d) Group and individual animals’ water consumption by DID session and by sex (mixed ANOVA, Sex F(1,12) = 0.1032, p=0.7535; male n=9, female n=5). (e) Group and individual animals’ water consumption by DID week (rmANOVA, Week F(2,26) = 2.4712, p=0.1041). (f) Group and individual animals’ water consumption by DID week and by sex (mixed ANOVA, Sex F(1,7) = 0.1032, p=0.7535; male n=9, female n=5). (g) Group and individual animals’ alcohol consumption by DID session (n=14 animals). (h) Group and individual animals’ alcohol consumption by DID session and by sex (mixed ANOVA, Sex F(1,7) = 0.4714, p=0.5144; male n=9, female n=5). (i) Group and individual animals’ alcohol consumption by DID week (rmANOVA, Week F(2,26) = 7.8861, p=0.002, np2=0.0992, Power (1 - β)=0.9999; Week 4 to Week 5, p=0.0012; male n=9, female n=5). (j) Group and individual animals’ alcohol consumption by DID week and by sex (mixed ANOVA, Sex F(1,7) = 0.4714, p=0.5144; male n=9, female n=5). (k) Group and individual animals’ inter-session water consumption by DID week and by sex (mixed ANOVA, Sex x Drinking Week F(5,60) = 2.411, p=0.0466, np2=0.1673, Power (1 - β)=1.0; male n=9, female n=5). (l) Previous inter-session water intakes negatively correlate with the next DID session water intake (Shepherd’s pi correlation, r=–0.2383, p=0.0002). (m) Previous inter-session water intakes do not correlate with next DID session water intake by sex (ANCOVA, Sex F(1,257) = 0.3048, p=0.5814; male n=9, female n=5). (n) Previous inter-session water intakes do not correlate with the next DID session alcohol intake (Shepherd’s pi correlation, r=–0.0547, p=0.4537). (o) Previous inter-session water intakes do not correlate with next DID session alcohol intake by sex (ANCOVA, Sex F(1,315) = 0.0101, p=0.9201; male n=9, female n=5), but when a priori splitting by sex females, but not males, future alcohol intakes are negatively correlated with increasing amounts of inter-session water intakes (males only r=0.1554, p=0.0916; females only r=–0.4133, p=0.0007, Power (1 - β)=0.9328).
Figure 1—figure supplement 1
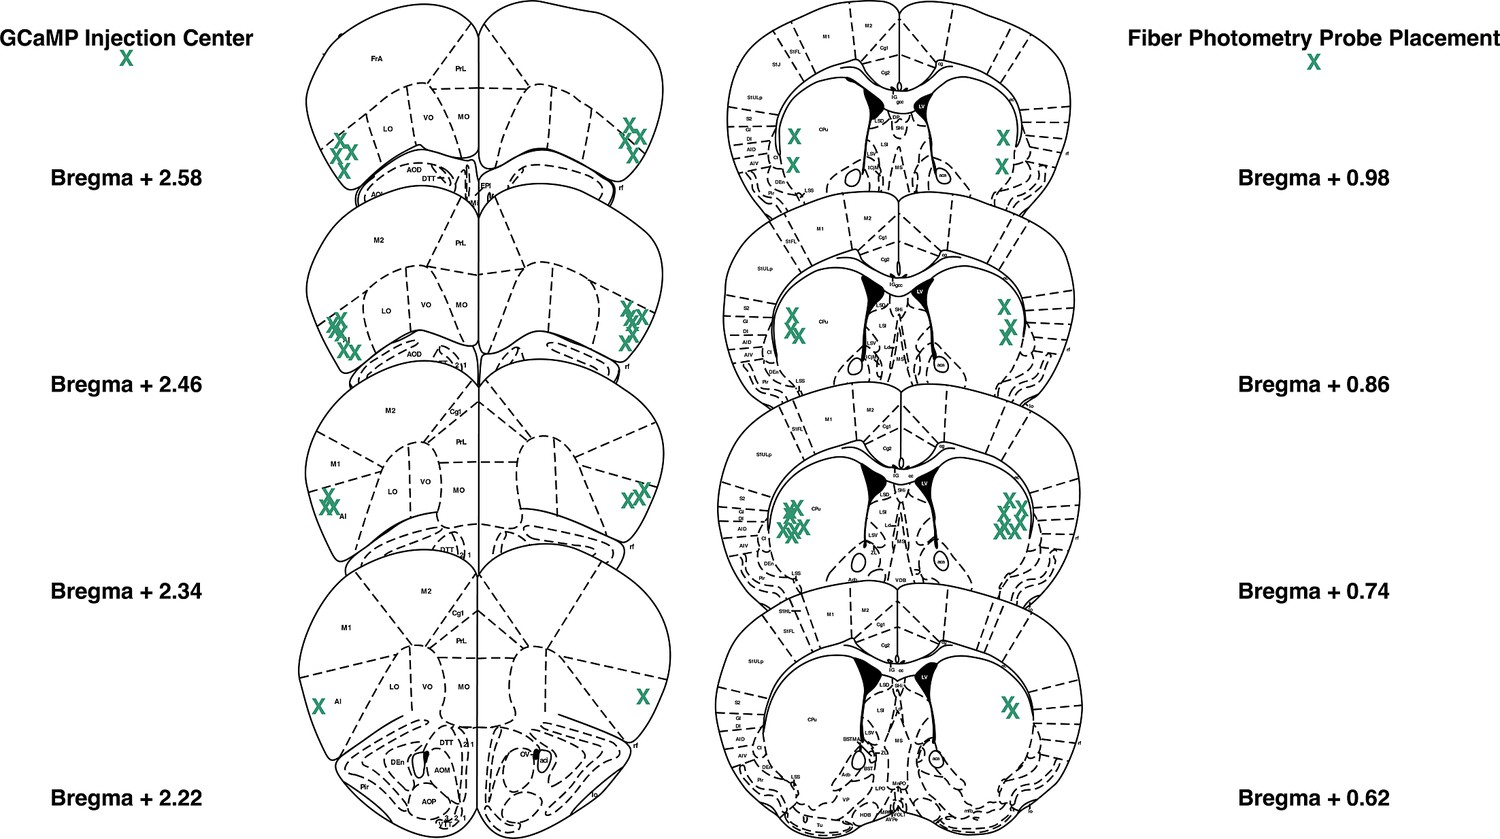
Locations of anterior insular cortex (AIC) injections and dorsolateral striatum (DLS) injections and fiber optic cannula placements.
Bilateral injection centers of AAV-FLEX-GCaMP in the AIC and bilateral injection centers of AAVrg-cre-mCherry and fiber optic cannula placements as verified by histology (male: n=9 animals; female n=5 animals).
Figure 2 with 1 supplement
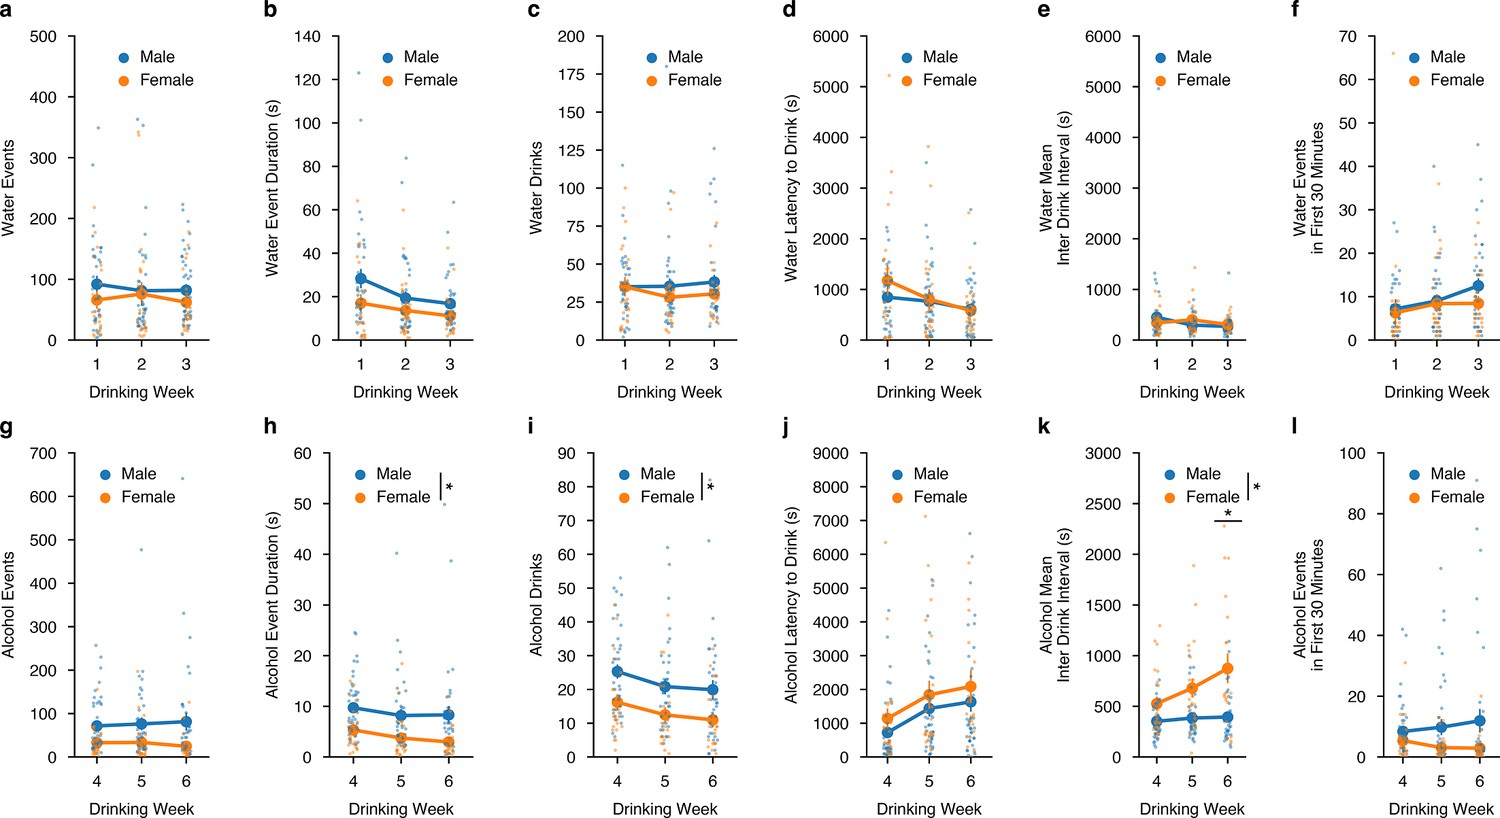
Alterations in drinking microstructure represent different strategies used to consume similar levels of alcohol, but not water intake in a sex-dependent manner.
Water (a) events (mixed ANOVA, Sex F(1,11) = 0.6164, p=0.4490; male n=9, female n=5), (b) total event duration (mixed ANOVA, Sex F(1,11) = 1.422, p=0.2582; male n=9, female n=5), (c) drinks (mixed ANOVA, Sex F(1,11) = 0.3957, p=0.5422; male n=9, female n=5), (d) latency to drink (mixed ANOVA, Sex F(1,11) = 0.3911, p=0.5746; male n=9, female n=5) (e), mean inter-drink interval (mixed ANOVA, Sex F(1,11) = 0.0339, p=0.8572; male n=9, female n=5), and (f) events in the first 30 min of a DID session (mixed ANOVA, Sex F(1,11) = 0.538, p=0.4786; male n=9, female n=5) do not differ by sex across drinking week. Alcohol (g) events do not differ by sex across the week (mixed ANOVA, Sex F(1,12) = 3.183, p=0.0997; male n=9, female n=5), but alcohol (h) event duration (mixed ANOVA, Sex F(1,12) = 7.286, p=0.0193, np2=0.3778, Power (1 - β)=1.0; male n=9, female n=5), and (i) drinks are decreased in female compared to male binge alcohol drinkers (mixed ANOVA, Sex F(1,12) = 6.681, p=0.0239, np2=0.3576, Power (1 - β)=1.0; male n=9, female n=5). There were no sex differences in alcohol (j) latency to drink (mixed ANOVA, Sex F(1,12) = 1.914, p=0.1917; male n=9, female n=5) (k), but alcohol mean inter-drink interval is increased in females compared to males (mixed ANOVA, Sex x Week F(2,24) = 3.623, p=0.0422, np2=0.2319, Power (1 - β)=1.0; Week 6t(6.81)=3.623, p=0.01882; male n=9, female n=5). There are no sex-dependent changes in (l) events in the first 30 min of an alcohol DID session by week (mixed ANOVA, Sex F(1,12) = 1.972, p=0.1856; male n=9, female n=5).
Figure 2—figure supplement 1
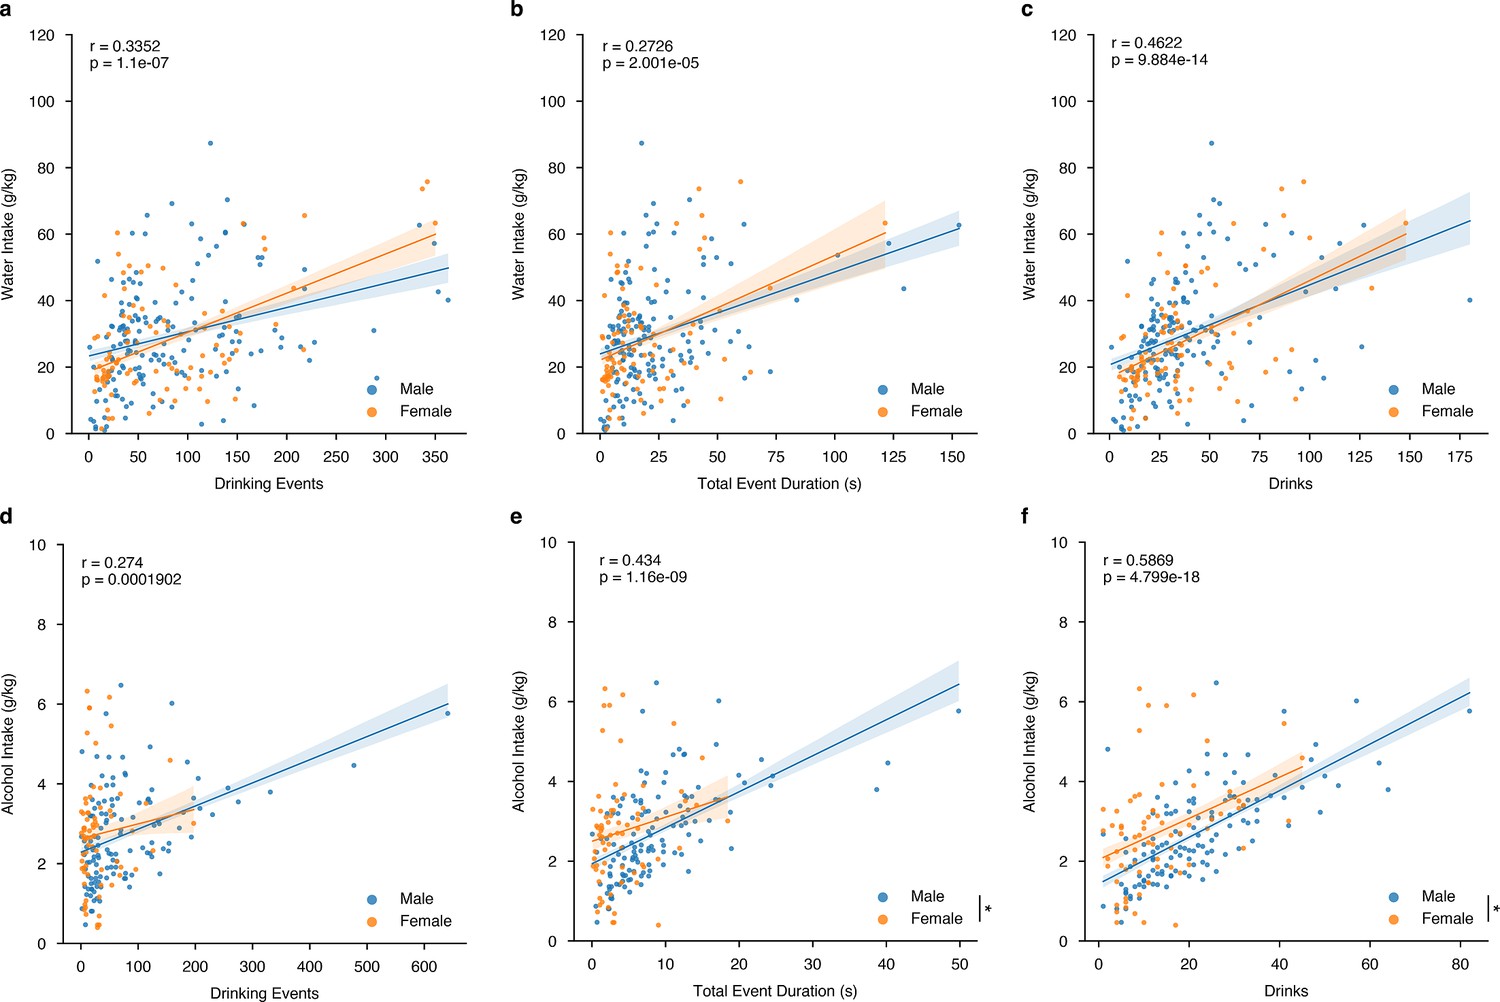
Microstructure features measured from lickometers correlate with alcohol and water intakes in a sex-dependent manner.
(a) Water events (Shepherd’s pi correlation, r=0.3352, p=1.1e-07; ANCOVA, Sex F(1, 252)=0.3203, p=0.5719; male n=9, female n=5), (b) total event duration (Shepherd’s pi correlation, r=0.2726, p=2.001e-05; ANCOVA, Sex F(1, 252)=0.0757, p=0.7834; male n=9, female n=5), and (c) drinks (Shepherd’s pi correlation, r=0.4622, p=9.884e-14; ANCOVA, Sex F(1, 252)=0.9928, p=0.32; male n=9, female n=5) correlate with water intakes in a non-sex-dependent manner. (d) Alcohol events (Shepherd’s pi correlation, r=0.274, p=0.0001902; ANCOVA, Sex F(1, 191)=2.13, p=0.1461; male n=9, female n=5) correlate with alcohol intakes in a non-sex dependent manner. Yet, alcohol (e) event duration (Shepherd’s pi correlation, r=0.434, p=1.16e-09; ANCOVA, Sex F(1, 191)=5.689, p=0.01805, np2=0.02893, Power (1 - β)=0.6934; male n=9, female n=5) and (f) drinks (Shepherd’s pi correlation, r=0.5869, p=4.799e-18; ANCOVA, Sex F(1, 191)=9.7152, p=0.00211, np2=0.0484, Power (1 - β)=0.8965; male n=9, female n=5) correlate with alcohol intakes and females display a sex-dependent increase in intake for these metrics. Individual datapoints represent a microstructure feature and intake taken from a single drinking in the dark (DID) session. Data were fit to a linear model represented by a line of best fit with shading indicating ± SEM. Axes histograms display the distribution of microstructure features and intakes across all DID sessions.
Figure 3 with 2 supplements
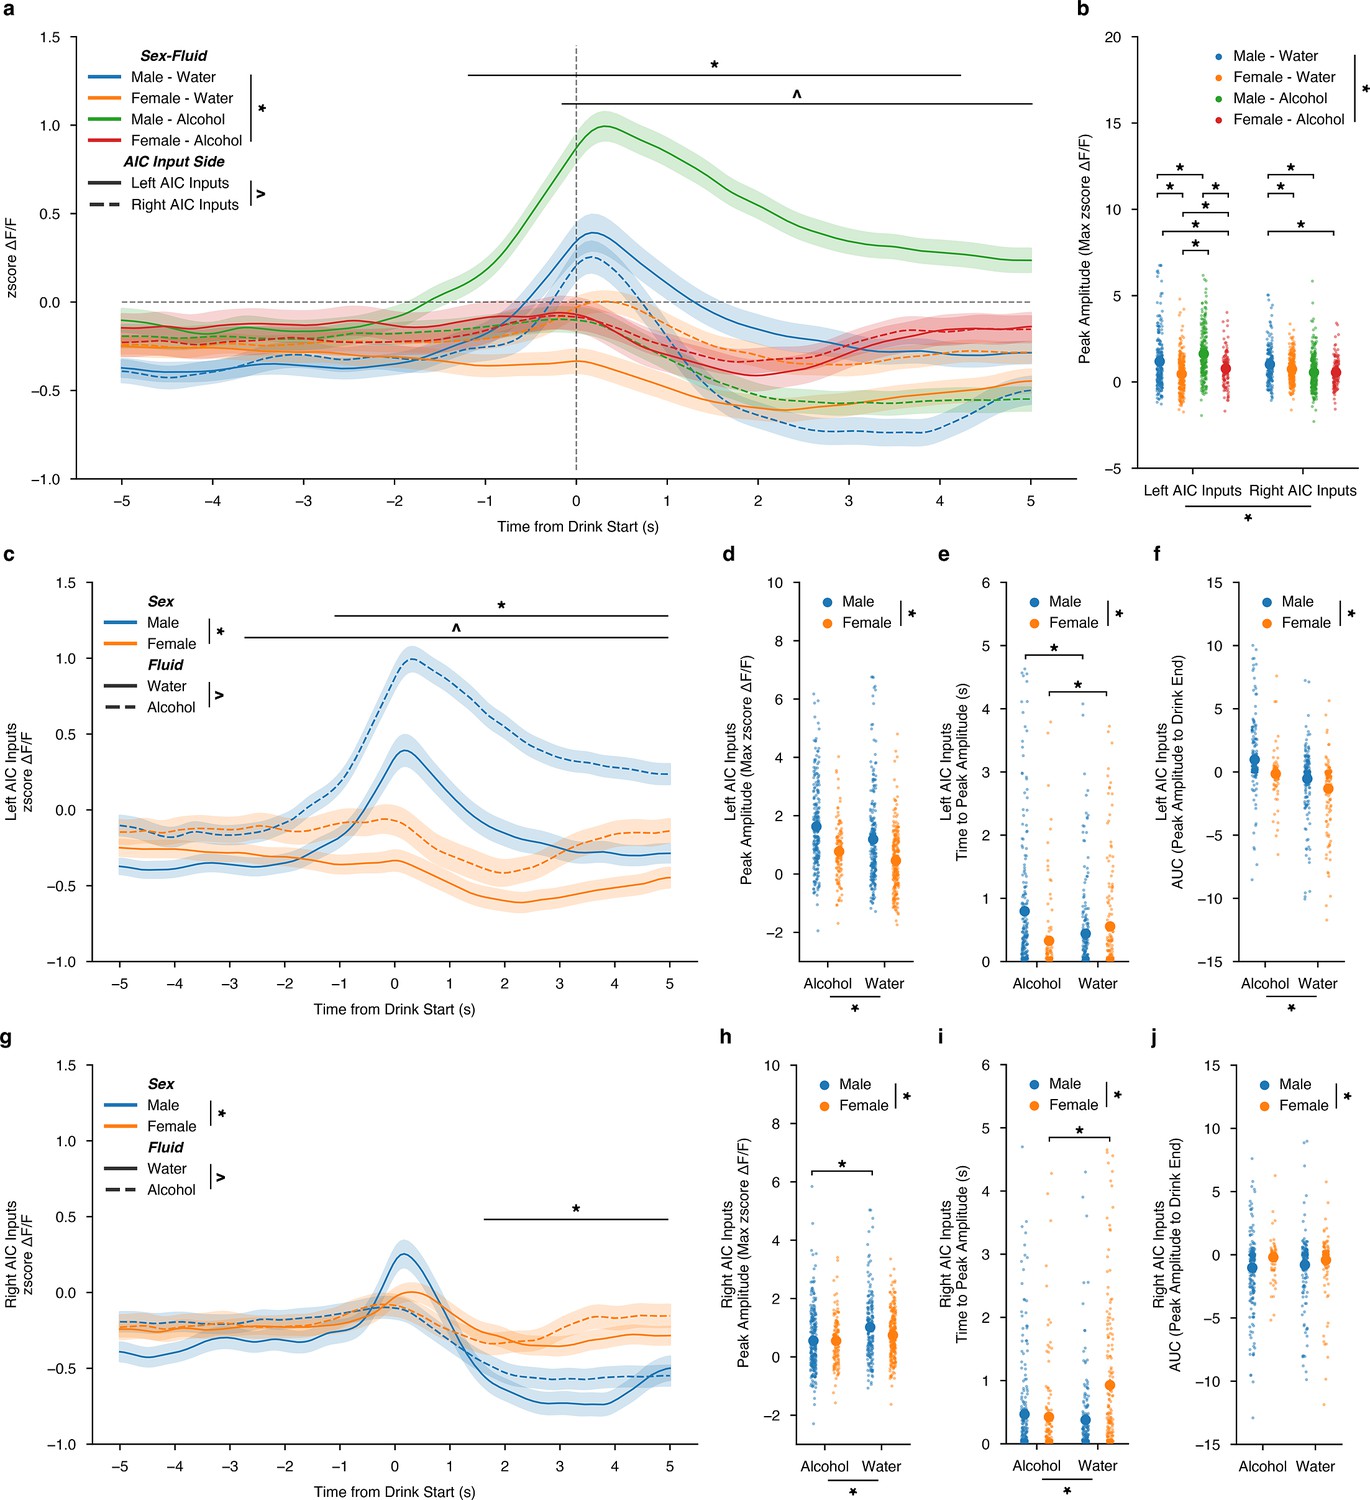
Sex-dependent calcium dynamics of anterior insular cortex (AIC) inputs into the left and right dorsolateral striatum (DLS) during water and drinking bouts.
(a) AIC inputs to the DLS are most strongly engaged by alcohol at AIC inputs into the left DLS (ANOVA, Sex × Fluid × Time × Input Side F(149, 200.7)=1.383, p=0.001383, np2=0.000786, Power (1 - β)=1.0; *=Time from Drink Start × AIC Input Side, –0.0369128 (s) – 5 (s),p<0.05; ^=Time from Drink Start × Sex-Fluid, –1.308725 (s) – 4.95733 (s),p<0.05) and (b) peak amplitudes ΔF/F changes are strongly associated with changes in AIC inputs to the left DLS than with the right DLS (ANOVA, Sex x Fluid x Input Side F(3,122.6)=31.15, p=1.298e-19, np2=0.05083, Power (1 - β)=1.0). (c) For left AIC inputs into the DLS, there were both sex and fluid interactions by time for changes in ΔF/F (ANOVA, Sex × Fluid × Time F(149,221.9)=1.404, p=8.419e-4, np2=0.05083, Power (1 - β)=1.0; *=Time from Drink Start × Sex, –1.107383 (s) – 5 (s), p<0.05; ^=Time from Drink Start × Fluid, –2.181208 (s) – 5 (s),p<0.05) and (d) increases in peak amplitude for ΔF/F for alcohol compared to water were observed, but no interaction was present between sex and fluid (ANOVA, Fluid F(1,32.45)=19.46, p=1.152e-5; Sex F(1,132.2)=79.27, p=2.919e-18, np2=0.05083, Power (1 - β)=1.0). (e) Time to peak values for males increased due to alcohol exposure, yet the opposite occurred for females (ANOVA, Sex × Fluid F(1,14.25)=19.44, p=0.000012, np2=0.02688, Power (1 - β)=0.9929; paired t-test, males t(375.5)=4.0864, p=0.000107; paired t-test, females, t(280.5)=–2.532, p=0.02361). (f) Left AUC were increased in males in comparison to females, but no interaction was present between sex and fluid (ANOVA, Fluid F(1,332.3)=56.58, p=1.652e-13; Sex F(1,149.8)=25.51, p=5.613e-7, np2=0.074388, Power (1 - β)=1.0). (g) For right AIC inputs into the DLS, there were both sex by time and fluid by time for changes in ΔF/F, but no three-way interaction (ANOVA, Sex × Time F(149,772.6)=5.881, p=6.559e-103, np2=0.006891, Power (1 - β)=1.0; ^=Time from Drink Start × Sex, –1.778523 (s) – 5 (s), p<0.05; Fluid × Time F(149,340.7)=2.594, p=5.977e-23, np2=0.003051, Power (1 - β)=1.0). (h) Decreases in peak amplitude ΔF/F for alcohol compared to water were observed for males, but not females (ANOVA, Sex × Fluid F(1,3.652)=3.925, p=0.04787, np2=0.004641, Power (1 - β)=0.5096; paired t-test, males t(407.1)=4.490, p=0.000009; paired t-test, females, t(271.9)=–2.248, p=0.05015). (i) For females, time to peak decreased when transitioning from water to alcohol exposure, but there was no effect in males (ANOVA, Sex × Fluid F(1,15.02)=20.99, p=0.000005, np2=0.02852, Power (1 - β)=0.9957; paired t-test, males t(410) = 1.288, p=0.1985; paired t-test, females, t(289.6) = - 4.558, p=0.000008). (j) For AUC, there was only a main effect of sex, with females displaying larger AUCs across both water and alcohol compared to males (ANOVA, Sex F(1,61.39)=11.41, p = 0.00077, np2=0.01571, Power (1 - β)=0.9226). Genetically encoded calcium indicator (GCaMP) activity is aligned to the initiation of the water drinking bout with 5 s before and 5 s after the bout plotted. Solid lines represent means, and shading or error bars represent the standard error of the mean.
Figure 3—figure supplement 1
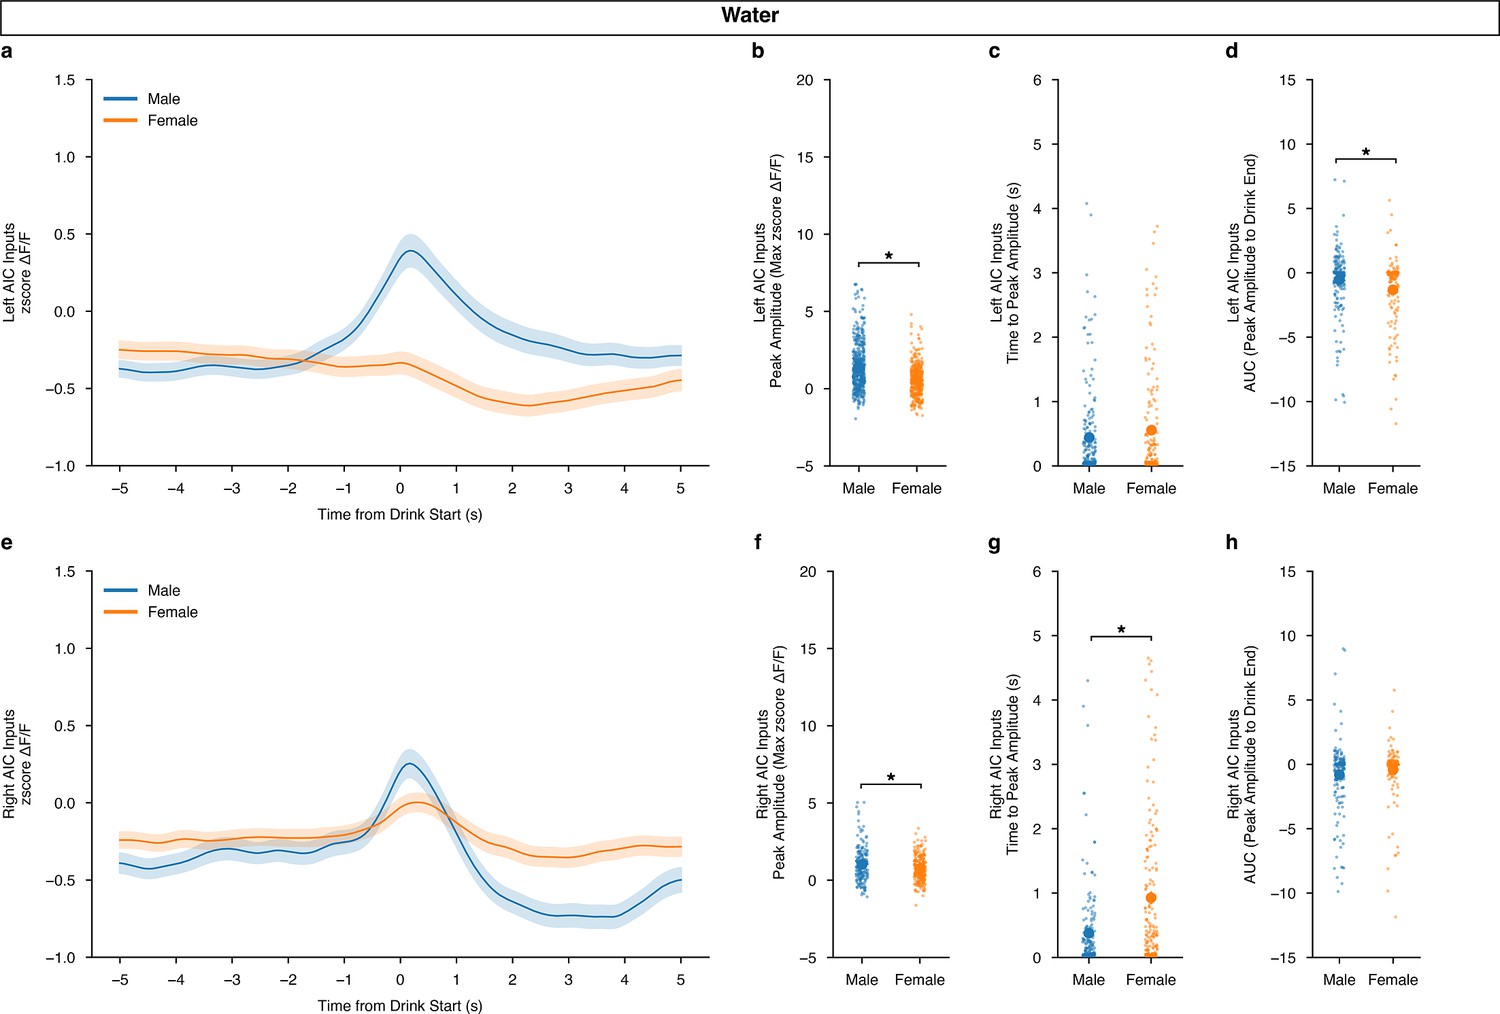
Calcium dynamics of anterior insular cortex (AIC) inputs into the left and right dorsolateral striatum (DLS) during water drinking.
(a) Left AIC inputs to the DLS do not display a sex by time-dependent change in ΔF/F (mixed ANOVA, Sex × Time F(149,1341)=0.6601, p=0.9993) (b) but for peak amplitude, males show larger maximum ΔF/F after water drinking events (MWU, U=4465, p=1.339e-8, Cohen’s d=0.5607, Power (1 - β)=0.9999). (c) There were no differences in time to peak (MWU, U=16410, p=0.7269), (d) but the AUC for males was larger than females for left AIC inputs (MWU, U=20100, p=0.001031, Cohen’s d=0.3061, Power (1 - β)=0.8289). (e) Right AIC inputs to the DLS also do not display a sex by time-dependent change in ΔF/F (mixed ANOVA, Sex × Time F(149,1192)=0.5882, p=0.9996) (f) but like left AIC inputs, peak amplitudes in males were increased in males (MWU, U=27902, p=0.02137, Cohen’s d=0.2912, Power (1 - β)=0.8625). (g) Female time to peak values also increased in comparison to males (MWU, U=989, p=5.238e-8, Cohen’s d=0.5953, Power (1 - β)=0.9998), (h) but no changes in AUC were observed by sex (MWU, U=13242, p=0.06568). Genetically encoded calcium indicator (GCaMP) activity is aligned to the initiation of the water drinking bout with 5 s before and 5 s after the bout plotted. Solid lines represent means and shading or error bars represent the standard error of the mean.
Figure 3—figure supplement 2
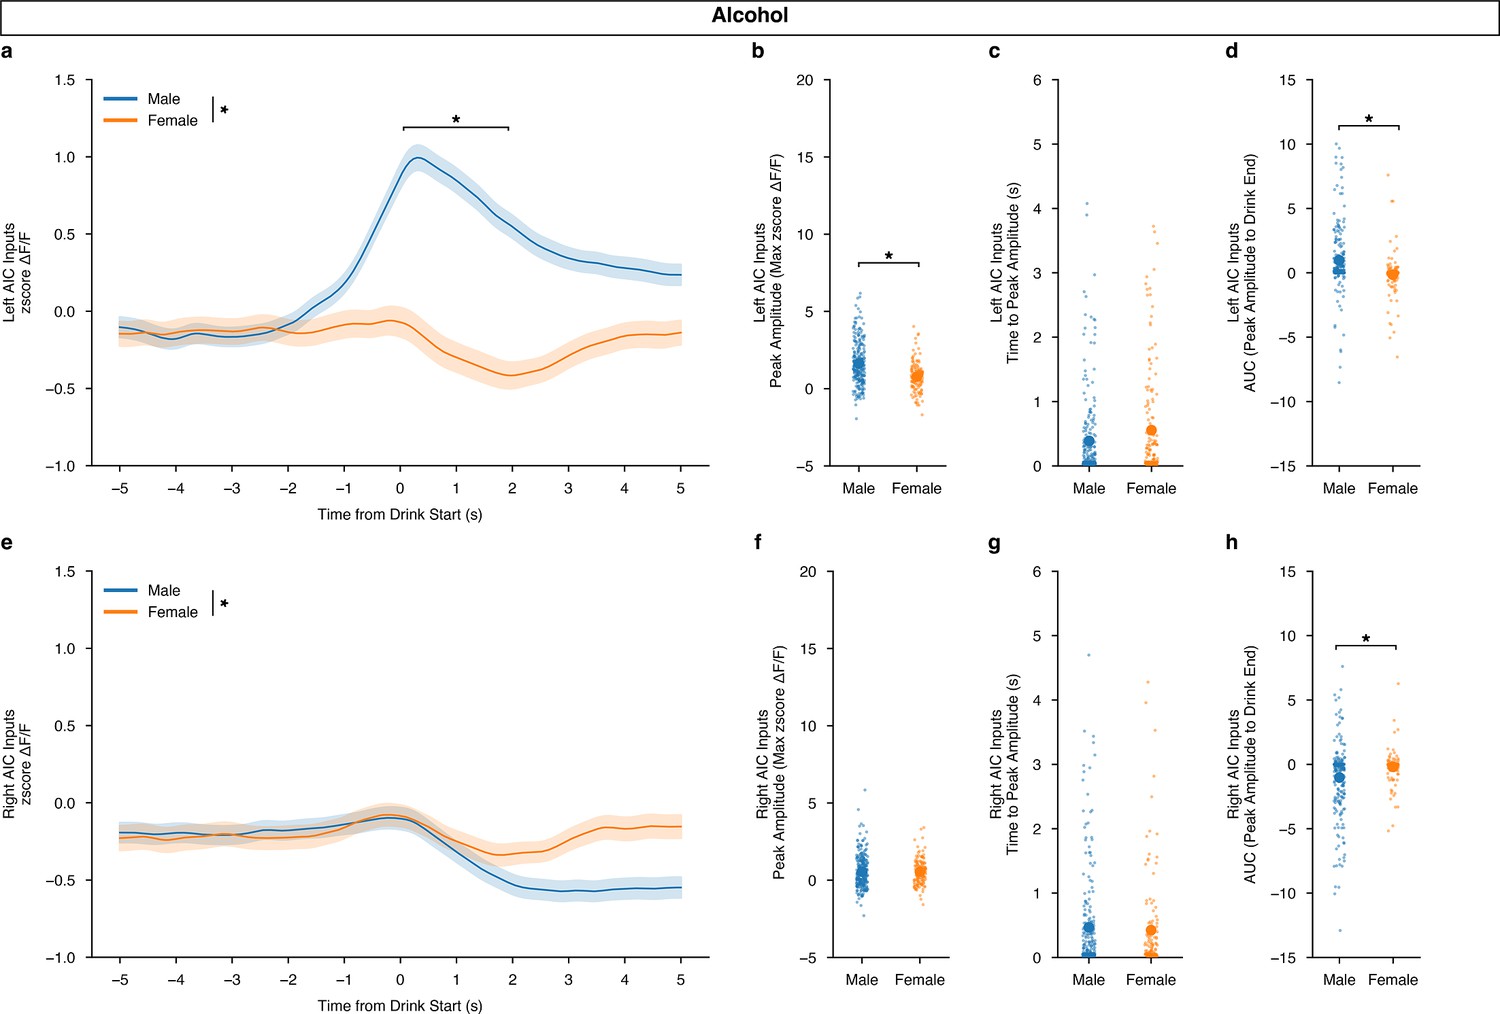
Left anterior insular cortex (AIC) inputs into the dorsolateral striatum (DLS) encode binge alcohol drinking in males, but not females.
(a) Left AIC inputs to the DLS display an increase in sex by time-dependent change in ΔF/F, with males displaying an increased calcium signal after alcohol drinking initiation compared to (mixed ANOVA, Sex × Time F(149,1788) = 3.125, p=4.006e-29, np2=0.2066, Power (1 - β)=1.0; Time from Drink Start, 0.0369128 (s) – 1.989866 (s), p ≤ 0.05) and (b) male peak amplitudes are increased compared to females (MWU, U=22385,,p=2.379e-9, Cohen’s d=0.6703, Power (1 - β)=0.9999). (c) There were no differences in time to peak (MWU, U=18174.5, p=0.2148), (d) but the AUC for males was larger than females for left AIC inputs during binge alcohol drinking (MWU, U=19025, p=1.281e-11, Cohen’s d=0.4987, Power (1 - β)=0.9924). (e) Right AIC inputs to the DLS also display a sex by time-dependent change in ΔF/F, but no post hoc significance for any individual timepoint was discovered (mixed ANOVA, Sex × Time F(149,1788)=1.2821, p=0.00151, np2=0.09653, Power (1 - β)=1.0) (f) nor were right AIC peak amplitudes different by sex (MWU, U=17217, p=0.5484). (g) No change in time to peak values were observed (MWU, U=16045, p=0.8015), (h) but female AUC measurements were greater than males (MWU, U=12561.5, p=0.001092, Cohen’s d=0.3601, Power (1 - β)=0.9108). Genetically encoded calcium indicator (GCaMP) activity is aligned to the initiation of the water drinking bout with 5 s before and 5 s after the bout plotted. Solid lines represent means, and shading or error bars represent the standard error of the mean.
Figure 4
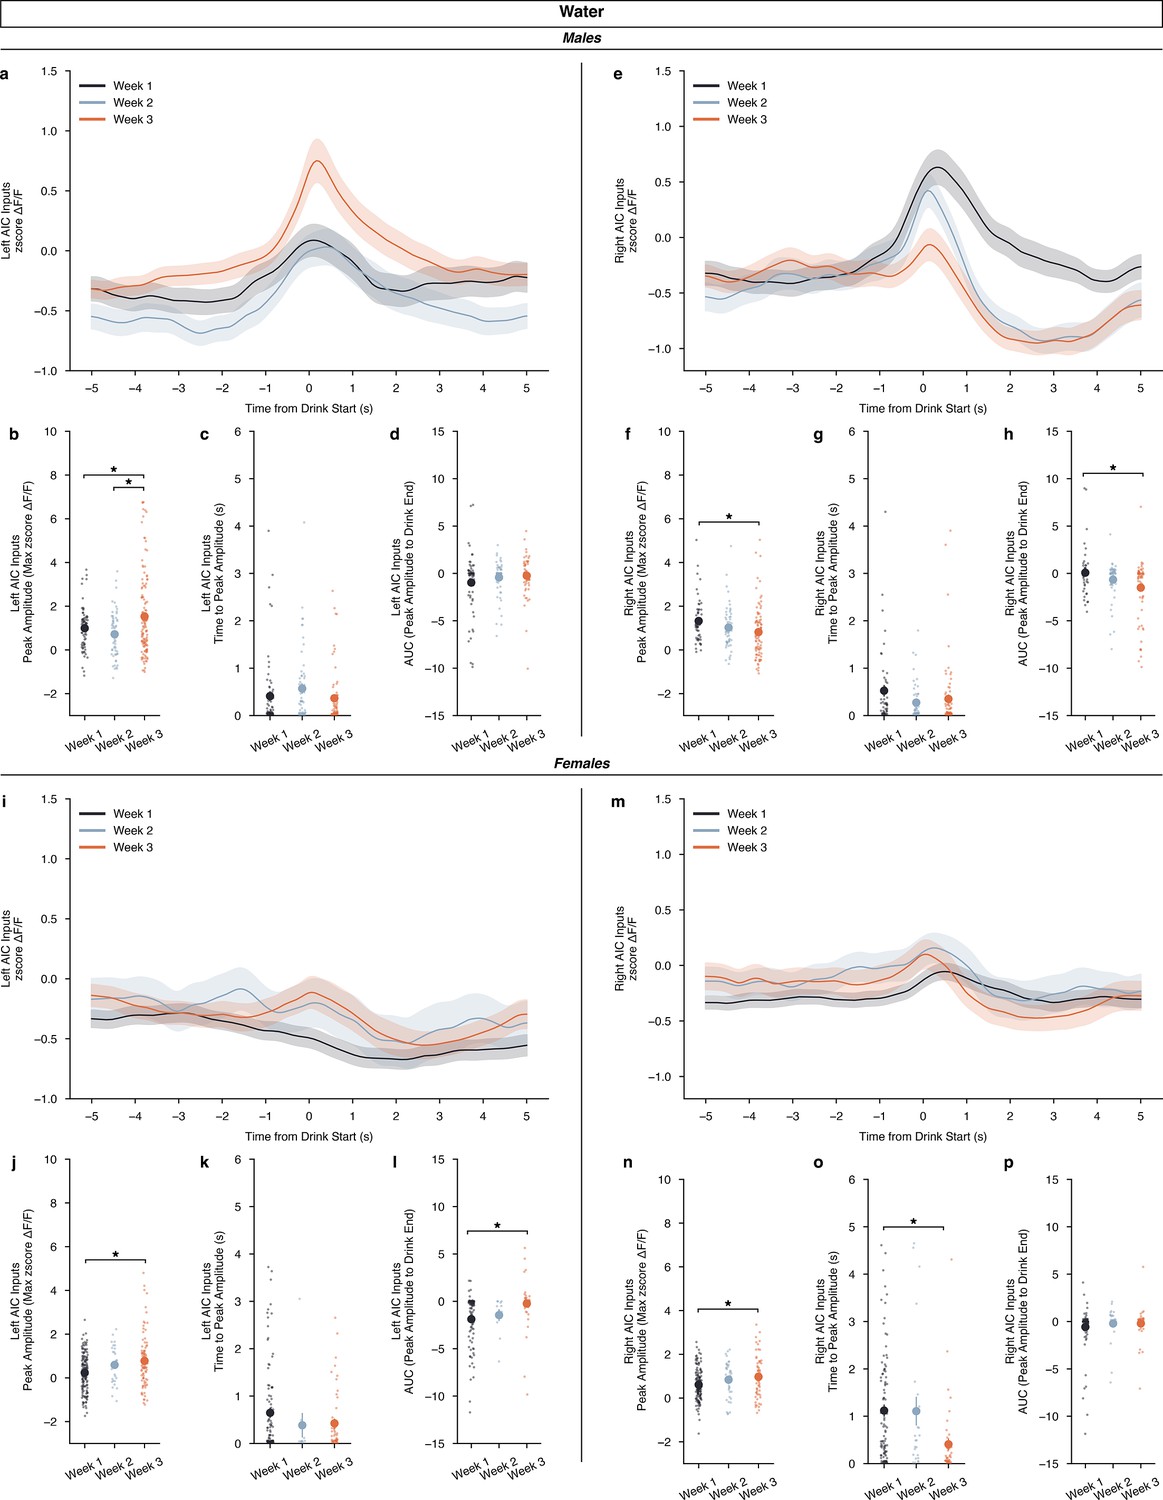
Calcium dynamics of anterior insular cortex (AIC) inputs into the left and right dorsolateral striatum (DLS) across water drinking weeks.
(a) For males, left AIC inputs to the DLS do not display a by week-dependent change in ΔF/F (rmANOVA, DID Week × Time from Drink F(298,298) = 0.6953, p=0.5575), but (b) peak amplitudes increased in the final week of water drinking compared to the first two (ANOVA, DID Week F(2,163.8)=7.235, p=0.000975, np2=0.05062, Power (1 - β)=0.9999; Week 3 – Week 1, p=0.02478; Week 3 – Week 2, p=0.000557). Yet, no difference in (c) time to peak (ANOVA, drinking in the dark (DID) Week F(2,127.4)=1.556, p=0.215) or (d) AUC were observed by week (ANOVA, DID Week F(2,129.9)=1.405, p=0.2491) for male, left AIC inputs. (I) Right AIC inputs to the DLS did also not display a by-week dependent change in ΔF/F (rmANOVA, DID Week × Time from Drink F(298,596) = 2.166, p=0.2743), but (f) a decrease in peak amplitudes in the final water drinking week was observed in comparison to the first week (ANOVA, DID Week F(2,192) = 3.5774, p=0.02983, np2=0.03593, Power (1 - β)=0.9978; Week 3 – Week 1, p=0.02206). (g) No change in time to peak was observed by week (ANOVA, DID Week F(2,104.6)=2.139, p=0.1229), but (h) a decrease in AUC was observed with the final week of water drinking displaying a deceased off-kinetic of the calcium signal in comparison to the initial drinking week (ANOVA, DID Week F(2,113.9)=5.301, p=0.006291, np2=0.06266, Power (1 - β)=0.9999; Week 3 – Week 1, p=0.004061). (i) For females, left AIC inputs to the DLS do not display a by week dependent change in ΔF/F (rmANOVA, DID Week × Time from Drink F(298,298) = 1.308, p=0.5817), but (j) like males, peak amplitudes increased in the final week of water drinking (ANOVA, DID Week F(2,78.83)=7.529, p=0.001017, np2=0.060465, Power (1 - β)=1.0; Week 3 – Week 1, p=0.00108). No difference in (k) time to peak (ANOVA, DID Week F(2,30.37)=1.591, p=0.2203) was observed, but (l) AUC increased in the final week of water drinking compared to the initial week (ANOVA, DID Week F(2,34.22)=7.0389, p=0.002751, np2=0.07152, Power (1 - β)=0.9999; Week 3 – Week 1, p=0.000801). (m) Right AIC inputs to the DLS did also not display a by week dependent change in ΔF/F (rmANOVA, DID Week x Time from Drink F(298,596) = 1.022, p=0.4966), but (n) an increase in peak amplitudes in the final water drinking week was observed in comparison to the initial week (ANOVA, DID Week F(2,93.65)=4.533, p=0.01321, np2=0.03957, Power (1 - β)=0.9999; Week 3 – Week 1, p=0.01778). (o) A decline in time to peak was observed in the final week of water drinking (ANOVA, DID Week F(2,58.75)=10.26, p=0.000151, np2=0.07598, Power (1 - β)=0.9999; Week 3 – Week 1, p=0.00066), but (p) no change in AUC was observed by week (ANOVA, DID Week F(2,64.13)=0.7386, p=0.4818). Genetically encoded calcium indicator (GCaMP) activity is aligned to the initiation of the water drinking bout with 5 s before and 5 s after the bout plotted. Solid lines represent means, and shading or error bars represent the standard error of the mean.
Figure 5
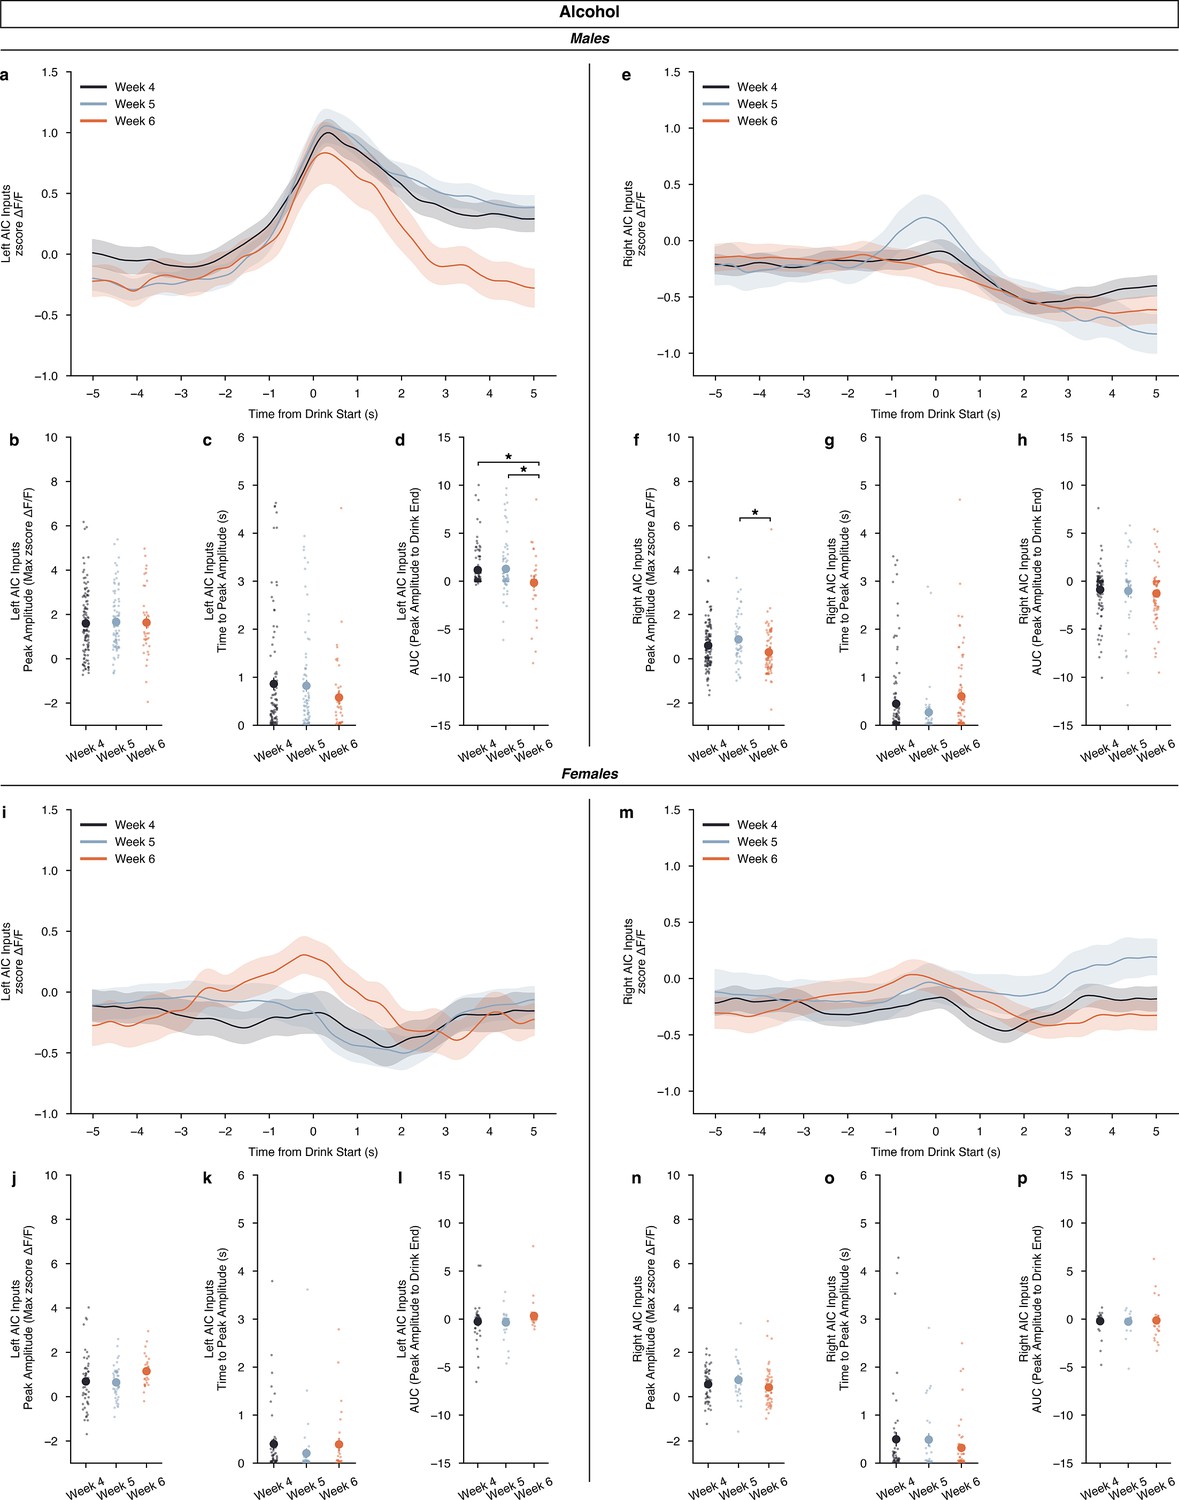
Calcium dynamics of anterior insular cortex (AIC) inputs into the left and right dorsolateral striatum (DLS) across binge alcohol drinking.
(a) For males, left AIC inputs to the DLS do not display a week-dependent change in ΔF/F (rmANOVA, drinking in the dark (DID) Week × Time from Drink F(298,298) = 2.271, p=0.3729), nor (b) did peak amplitudes change by binge week (ANOVA, DID Week F(2,246) = 0.05842, p=0.9433). No difference in (c) time to peak were seen (ANOVA, DID Week F(2,113.7)=1. 359, p=0.2609) but (d) decreases in AUC were observed in the final binge week compared to the first two (ANOVA, DID Week F(2,91.76)=3.481, p=0.03491, np2=0.04435, Power (1 - β)=0.9998: Week 4 – Week 6, p=0.04111; Week 5 – Week 6, p=0.03777) for male, left AIC inputs. (e) Right AIC inputs to the DLS did also not display a by week dependent change in ΔF/F (rmANOVA, DID Week × Time from Drink F(298,596) = 2.166, p=0.2743), but (f) an increase in peak amplitudes in the second week of binge drinking week was observed in comparison to the final week (ANOVA, DID Week F(2,256) = 4.8388, p=0.008655, np2=0.03643, Power (1 - β)=0.9996; Week 5 – Week 6, p=0.007429). (g) No change in time to peak was observed by week (ANOVA, DID Week F(2,109.8)=2.933, p=0.05744) (h), and no change in AUC was observed across binge drinking weeks for male, right AIC inputs into the DLS (ANOVA, DID Week F(2,87.91)=0.5946, p=0.5539). (i) For females, left AIC inputs to the DLS do not display a by-week dependent change in ΔF/F (rmANOVA, DID Week × Time from Drink F(298,596) = 1.544, p=0.3716). (j) No change in peak amplitudes, (ANOVA, DID Week F(2,128) = 2.961, p=0.05534) (k) time to peak, (ANOVA, DID Week F(2,70.21)=1.238, p=0.2962) or (l) AUC were observed (ANOVA, DID Week F(2,69.62)=2.089, P=0.1315). (m) Right AIC inputs to the DLS did also not display a by week dependent change in ΔF/F (rmANOVA, DID Week x Time from Drink F(298,596) = 0.8997, p=0.4538). Similar to female, left AIC inputs, there were no changes in (n) peak amplitudes, (ANOVA, DID Week F(2,135) = 1.606, p=0.2045) (o) time to peak, (ANOVA, DID Week F(2,70.11)=1.067, p=0.3495), or (p) AUC by binge drinking week either (ANOVA, DID Week F(2,73.17)=0. 1216, p=0.8857). Genetically encoded calcium indicator (GCaMP) activity is aligned to the initiation of the water drinking bout with 5 s before and 5 s after the bout plotted. Solid lines represent means, and shading or error bars represent the standard error of the mean.
Figure 6 with 2 supplements
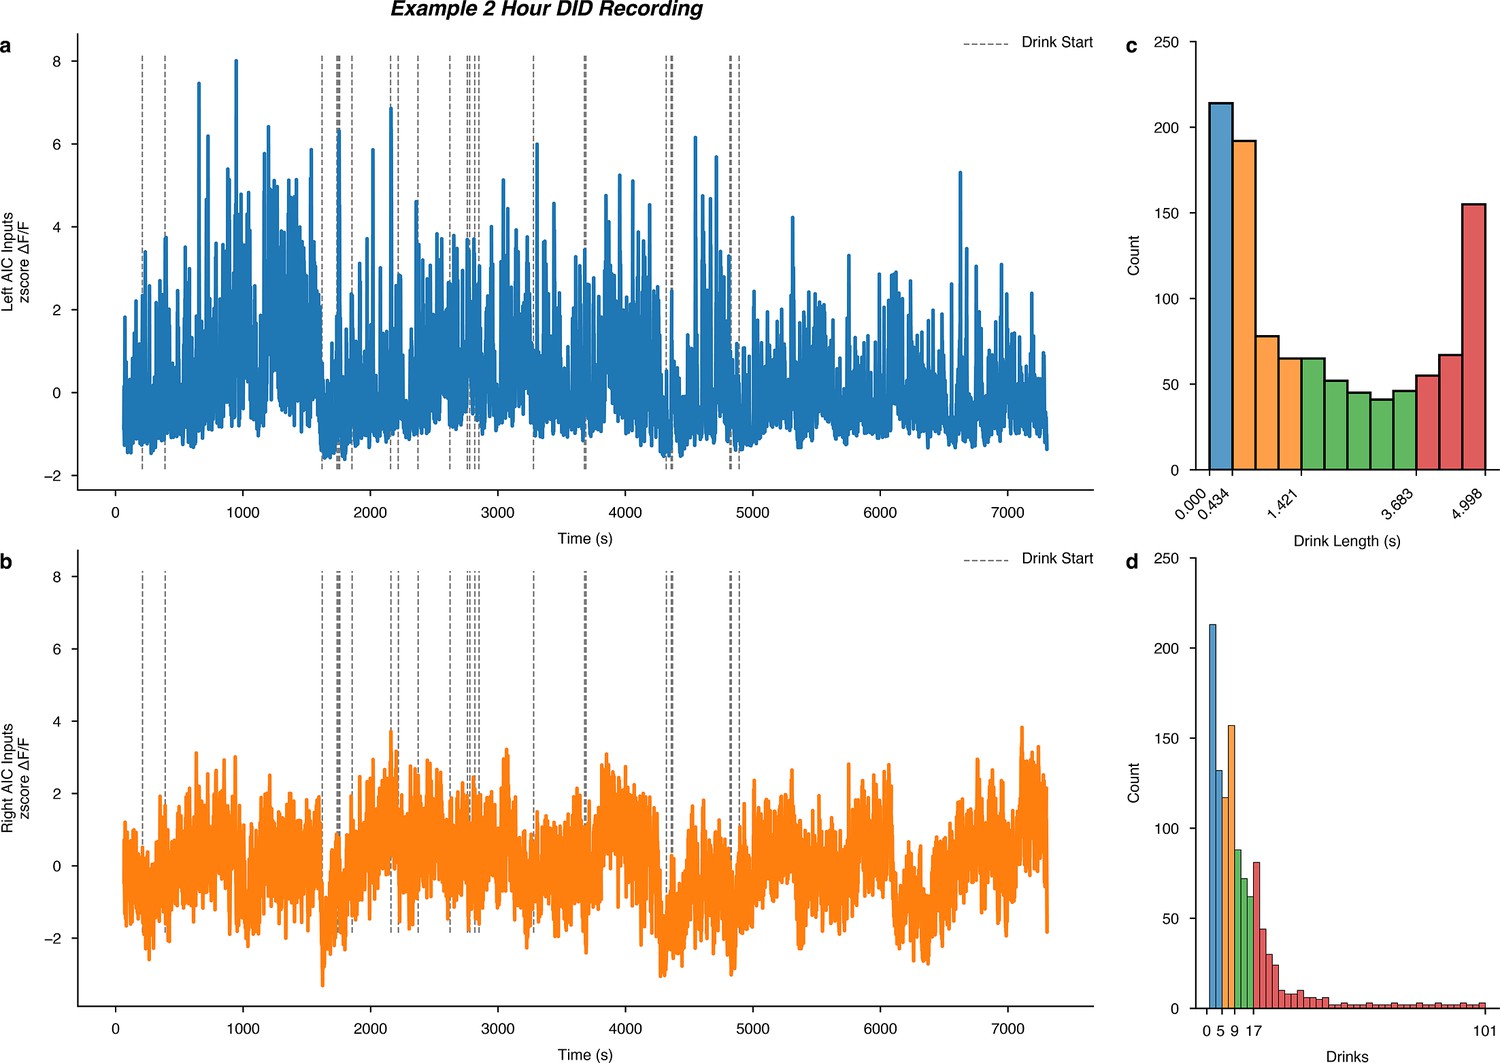
Intra-drinking in the dark (DID) session calcium signals and global quantiles of drink length and total number of drinks per session.
Example male (a) left and (b) right anterior insular cortex (AIC) input to dorsolateral striatum (DLS) calcium recordings from a single 2 hr binge alcohol drinking in the dark (DID) recording (animal ‘P7,’ session 17), with dashed vertical lines indicating the start of an alcohol drinking event overlayed on the time-resolved genetically encoded calcium indicator (GCaMP) signal. A histogram of all measured (c) drink lengths and (d) the number of drinks observed across all water and alcohol drinking sessions. On the x-axis, the quartile ranges are printed and colored to visualize the quartile ranges of drink length and total number of drinks that occurred across all water and alcohol DID sessions.
Figure 6—figure supplement 1
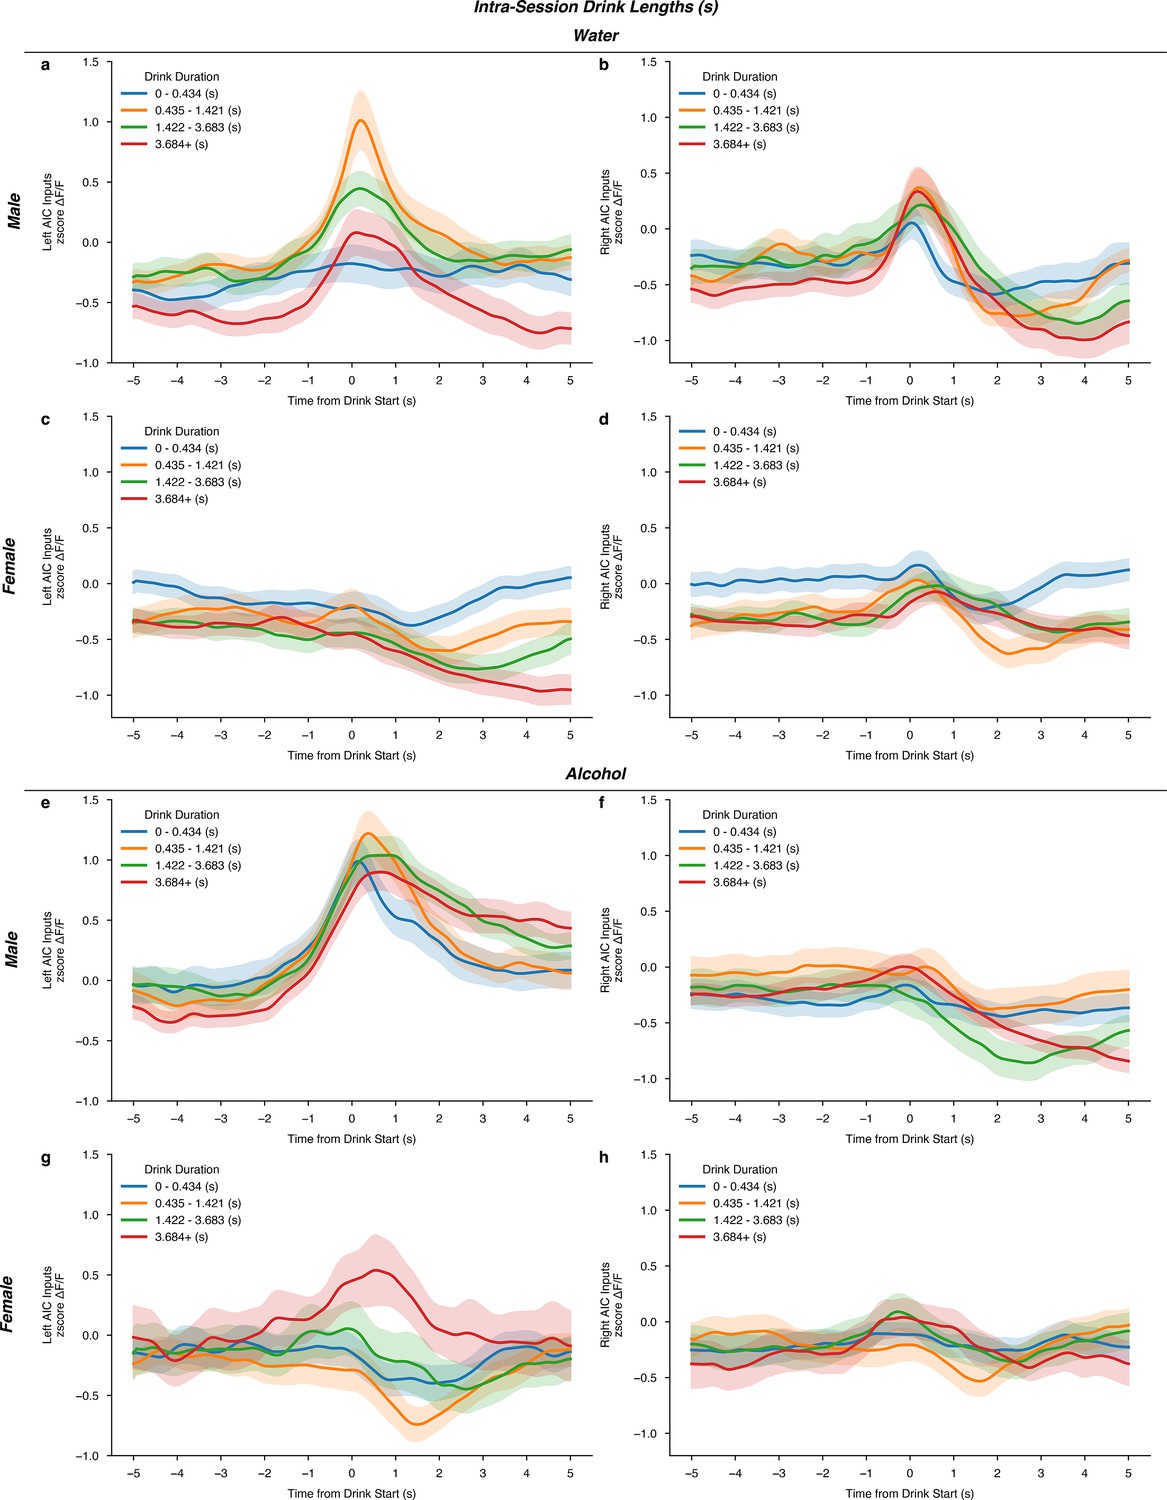
Intra-drinking in the dark (DID) session calcium signals do not differ by the duration of each drinking event.
For water drinking, neither (a) left (rmANOVA, Drink Duration × Time from Drink F(596,1192)=0.4524, p=0.9999) or (b) right (rmANOVA, Drink Duration × Time from Drink F(596,596) = 0.06445, p=0.9999) male AIC inputs calcium signals are altered by the length of the drinking event. Nor, do females display any difference in (c) left (rmANOVA, Drink Duration × Time from Drink F(596,1788)=0.1412, p=0.9999) or (d) right (rmANOVA, Drink Duration × Time from Drink F(596,1788)=0.05649, p=0.9493) anterior insular cortex (AIC) calcium signals by the length of the drinking event. For alcohol drinking events, neither (e) left (rmANOVA, Drink Duration × Time from Drink F(447,2682)=1.594, p=0.2461) or (f) right (rmANOVA, Drink Duration × Time from Drink F(596,596) = 0.8884, p=0.9557) male AIC inputs calcium signals are altered by the length of the drinking event. Nor, do females display any difference in (g) left (rmANOVA, Drink Duration × Time from Drink F(447,1788)=0.4118, p=0.9999) or (h) right (rmANOVA, Drink Duration × Time from Drink F(447,1788)=0.5659, p=0.9999) AIC calcium signals by the length of the alcohol drinking event. Genetically encoded calcium indicator (GCaMP) activity is aligned to the initiation of the water drinking bout with 5 s before and 5 s after the bout plotted. Solid lines represent means, and shading or error bars represent the standard error of the mean.
Figure 6—figure supplement 2
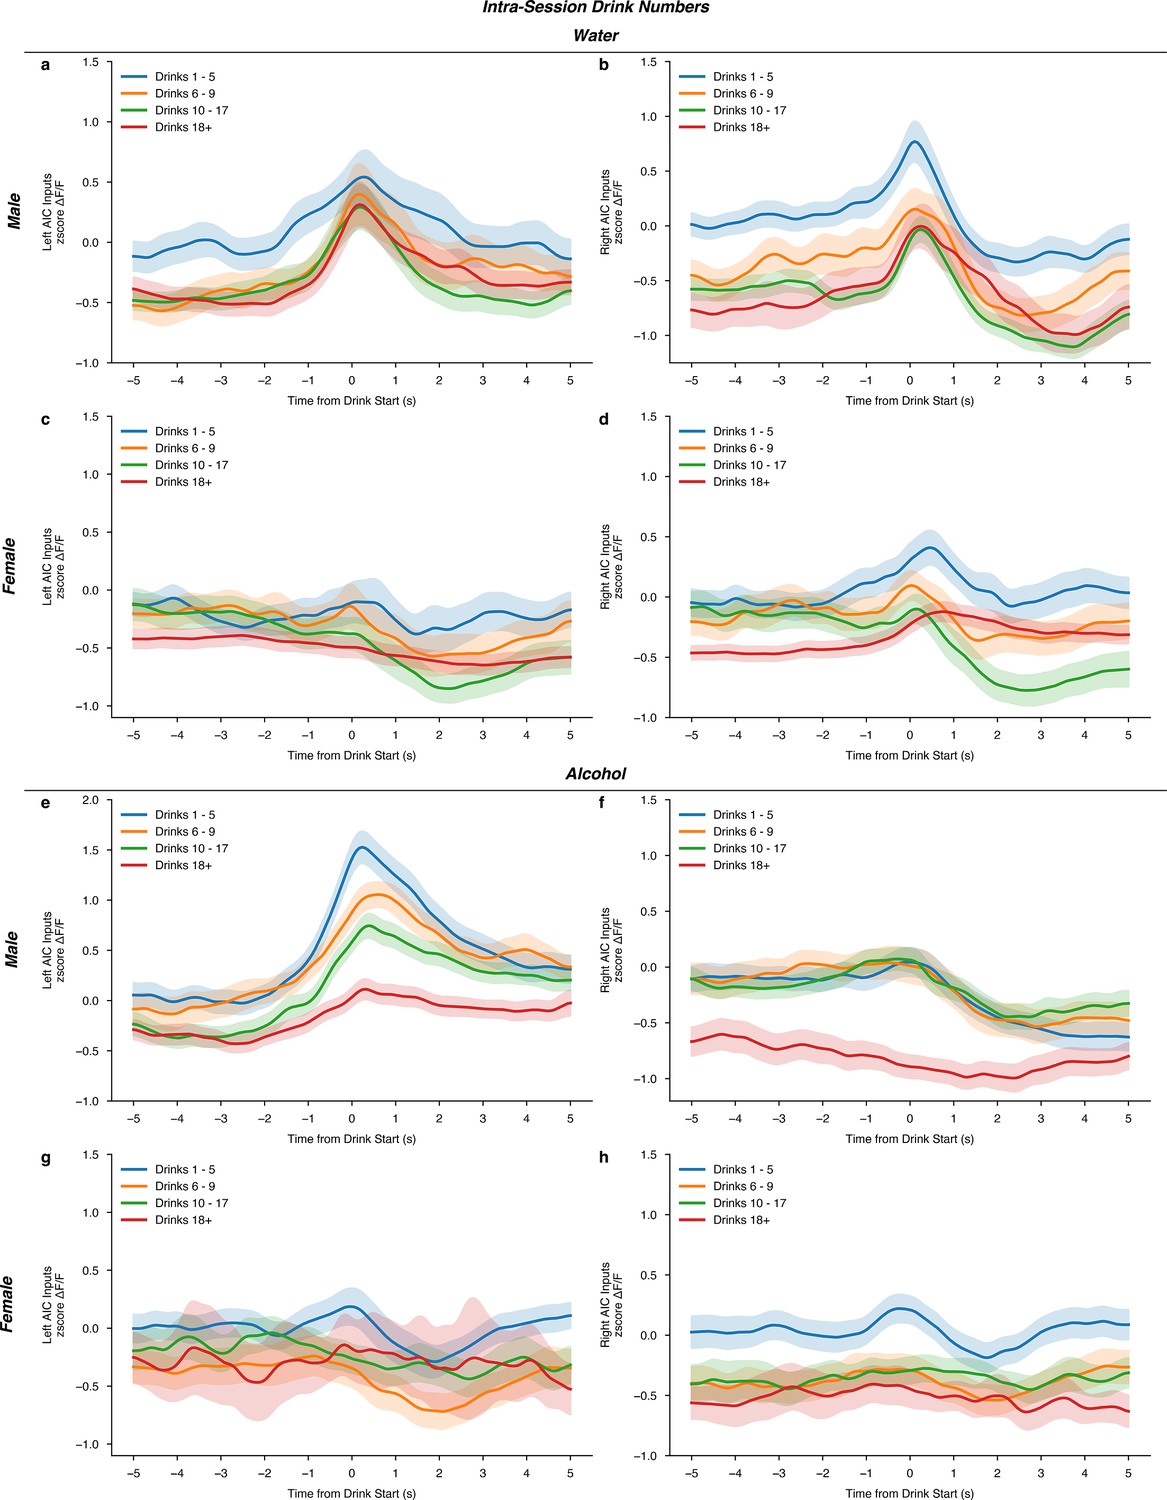
Intra-drinking in the dark (DID) session calcium signals do not differ by the number of drinking events within a single session.
For water drinking, neither (a) left (rmANOVA, Drink number × Time from Drink F(596,2980)=0.8228, p=0.4185) or (b) right (rmANOVA, Drink number × Time from Drink F(447,1788)=1.016, p=0.3921) male anterior insular cortex (AIC) inputs calcium signals are altered by the number of water drinking events within a DID session. Females do not display any difference in (c) left (rmANOVA, Drink number × Time from Drink F(447,1341)=3.346, p=0.1347) or (d) right (rmANOVA, Drink number × Time from Drink F(447,1341)=2.598, p=0.1741) AIC calcium signals by the increasing number of the drinking events. For alcohol drinking events, neither (e) left (rmANOVA, Drink number × Time from Drink F(447,1788)=1.608, p=0.2557) or (f) right (rmANOVA, Drink number × Time from Drink F(447,2235)=1.664, p=0.2435) male AIC inputs calcium signals are altered by increasing number of drinking events. Nor, do females display any difference in (g) left (rmANOVA, Drink number × Time from Drink F(447,447) = 0.8444, p=0.5269) or (h) right (rmANOVA, Drink number × Time from Drink F(447,894) = 0.7267, p=0.5078) AIC calcium signals by the number of alcohol drinking events. genetically encoded calcium indicator (GCaMP) activity is aligned to the initiation of the water drinking bout with 5 s before and 5 s after the bout plotted. Solid lines represent means, and shading or error bars represent the standard error of the mean.
Additional files
Download links
A two-part list of links to download the article, or parts of the article, in various formats.
Downloads (link to download the article as PDF)
Open citations (links to open the citations from this article in various online reference manager services)
Cite this article (links to download the citations from this article in formats compatible with various reference manager tools)
Sex-dependent, lateralized engagement of anterior insular cortex inputs to the dorsolateral striatum in binge alcohol drinking
eLife 13:RP96534.
https://doi.org/10.7554/eLife.96534.3


