Serum proteomic profiling of physical activity reveals CD300LG as a novel exerkine with a potential causal link to glucose homeostasis
- Department of Endocrinology, Morbid Obesity and Preventive Medicine, Oslo University Hospital, Norway
- Institute of Clinical Medicine, Faculty of Medicine, University of Oslo, Norway
- Department of Nutrition, Institute of Basic Medical Sciences, Faculty of Medicine, University of Oslo, Norway
- Institute for Molecular Bioscience, The University of Queensland, Australia
- The Frazer Institute, The University of Queensland, Australia
- Department of Public Health and Nursing, K.G. Jebsen Center for Genetic Epidemiology, NTNU, Norwegian University of Science and Technology, Norway
- MRC Integrative Epidemiology Unit, University of Bristol, United Kingdom
- Division of Endocrinology, Department of Medicine, David Geffen School of Medicine, University of California, Los Angeles, United States
- Department of Human Genetics, University of California, Los Angeles, United States
- Division of Cardiology, Department of Medicine, David Geffen School of Medicine at UCLA, United States
- Department of Biological Chemistry, University of California, Irvine, United States
- Departments of Population and Public Health Sciences, Keck School of Medicine, University of Southern California, United States
- Department of Biochemistry and Molecular Medicine, Keck School of Medicine, University of Southern California, United States
- Department of Chronic Diseases and Ageing, Norwegian Institute of Public Health, Norway
- Vitas Ltd, Norway
Figures
Figure 1
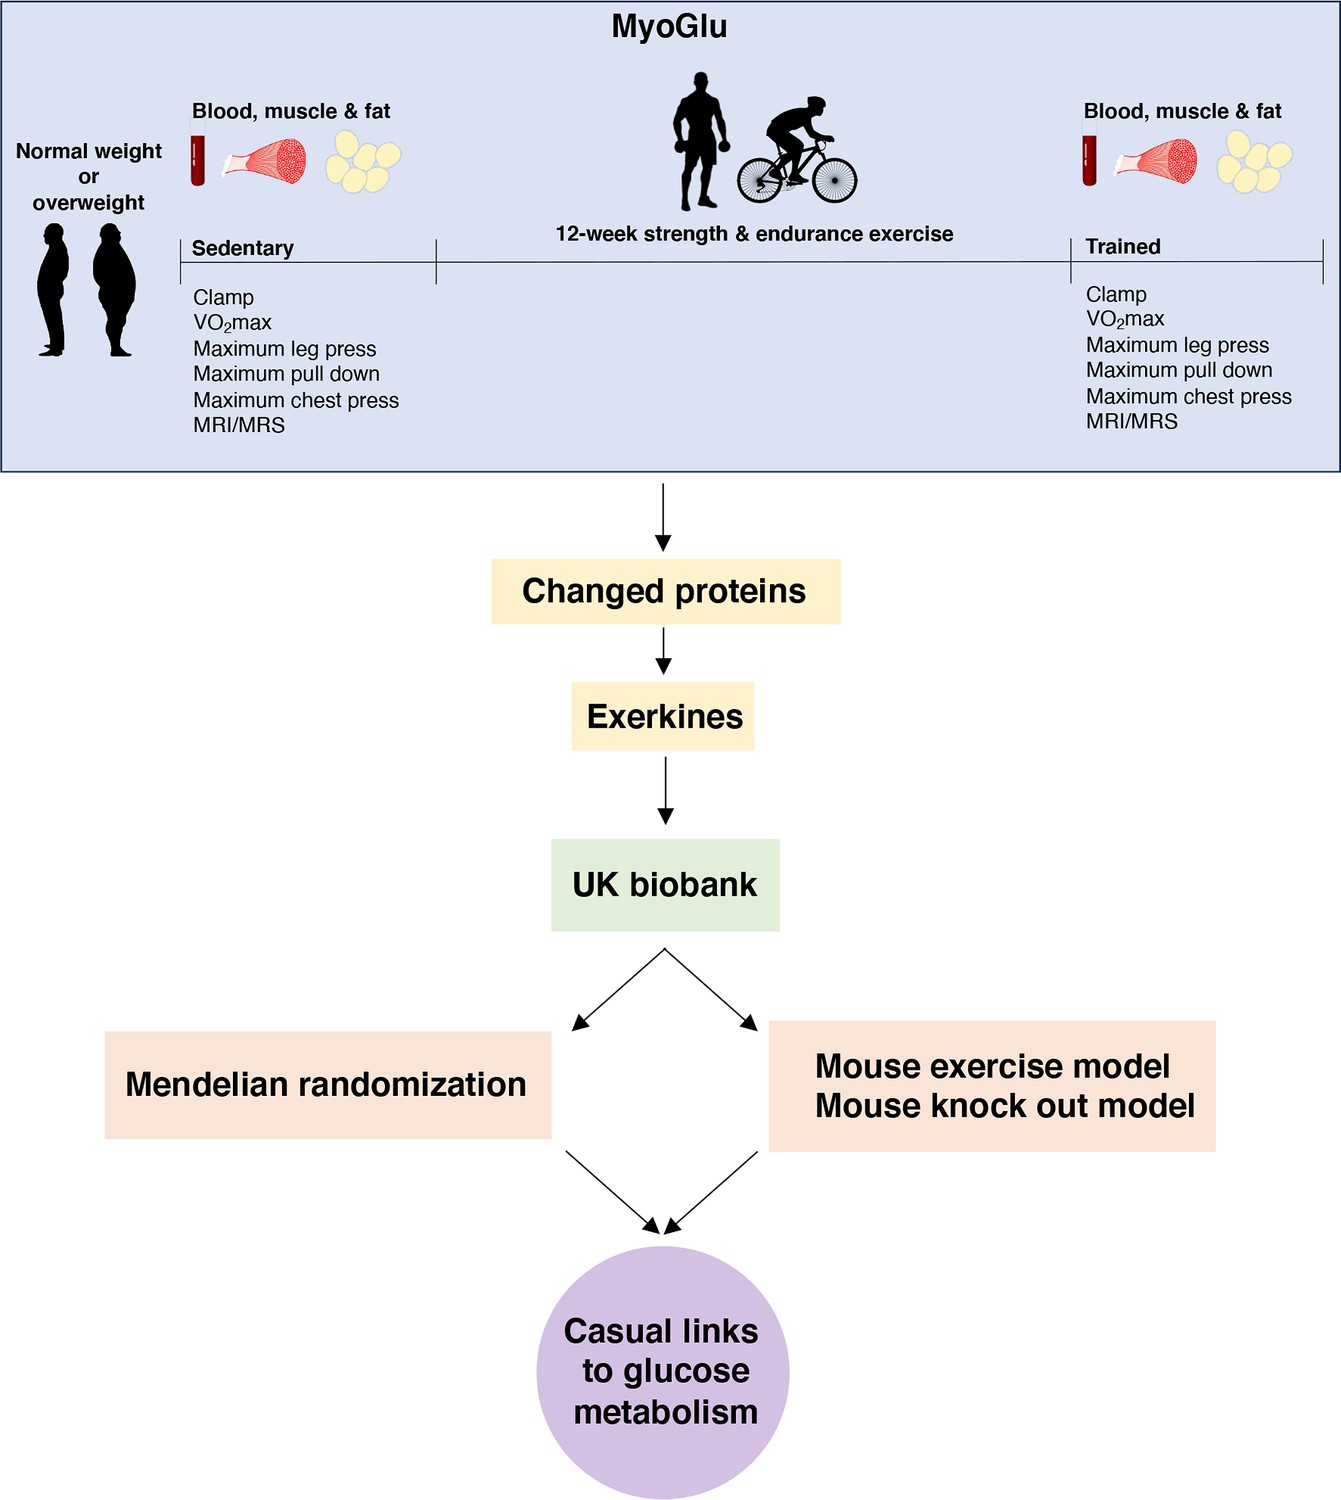
Study overview.
We recruited sedentary men with either normal weight or overweight for deep phenotyping before and after a prolonged exercise intervention. Multi-omic analyses, including serum proteomics, clinical traits, and muscle and fat transcriptomics, identified changed proteins and potential exerkines. Candidate exerkines were subsequently analyzed in serum samples from the UK Biobank and tested for associations with physical activity and glucometabolic traits. Top candidates were then subjected to Mendelian randomization and investigated in a mouse exercise model and in a mouse knock-out model to assess casual links between exerkines and glucometabolic traits.
Figure 2 with 1 supplement
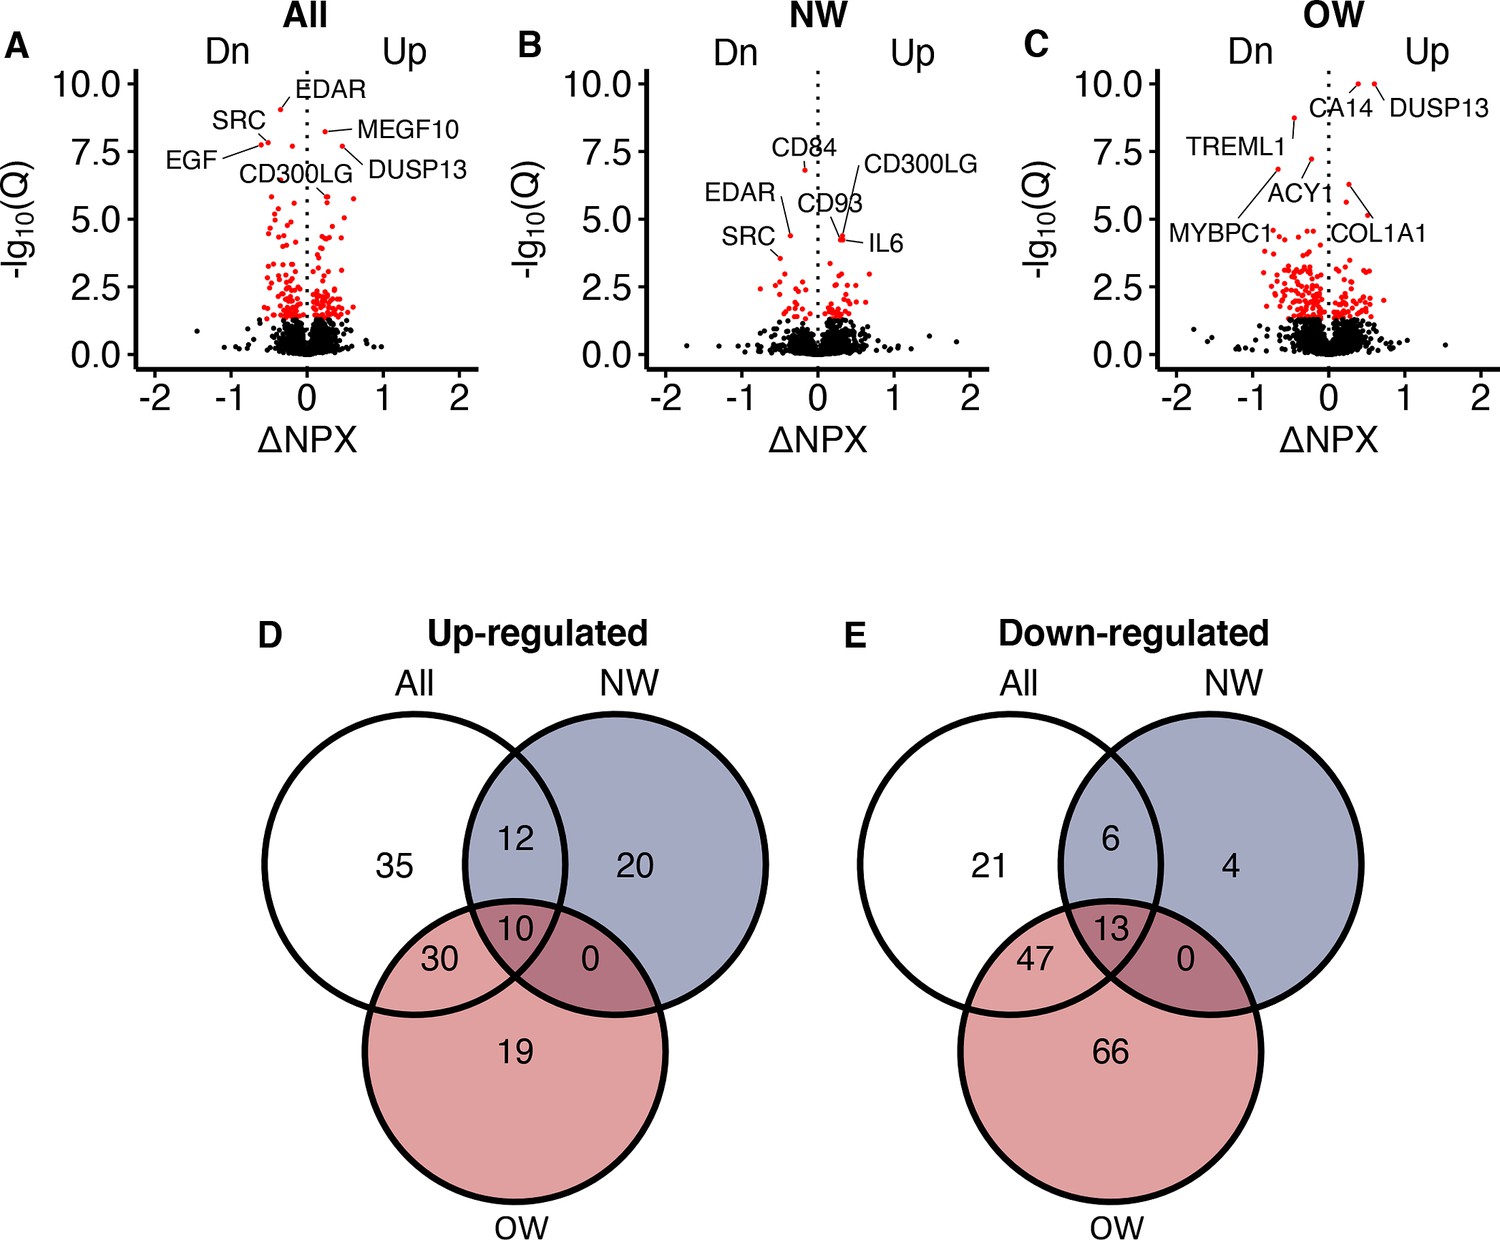
Serum proteomic responses to prolonged exercise.
(A) A volcano plot showing responses in all participants. The x-axis shows log2(fold-changes) and the y-axis shows negative log10(Q-values). The red dots indicate statistical significance (Q < 0.05). Only the top three up-/downregulated proteins are annotated. (B, C) Similar to (A), but in normal weight and overweight men only. (D, E) Venn diagrams of the significant change in proteins shown in (A–C). NPX = normalized protein expression; Q = p-values corrected using Benjamini–Hochberg’s method; NW = normal weight; OW = overweight.
Figure 2—figure supplement 1

Olink vs. ELISA for (A) serum leptin and (B) IL6 protein levels.
Figure 3
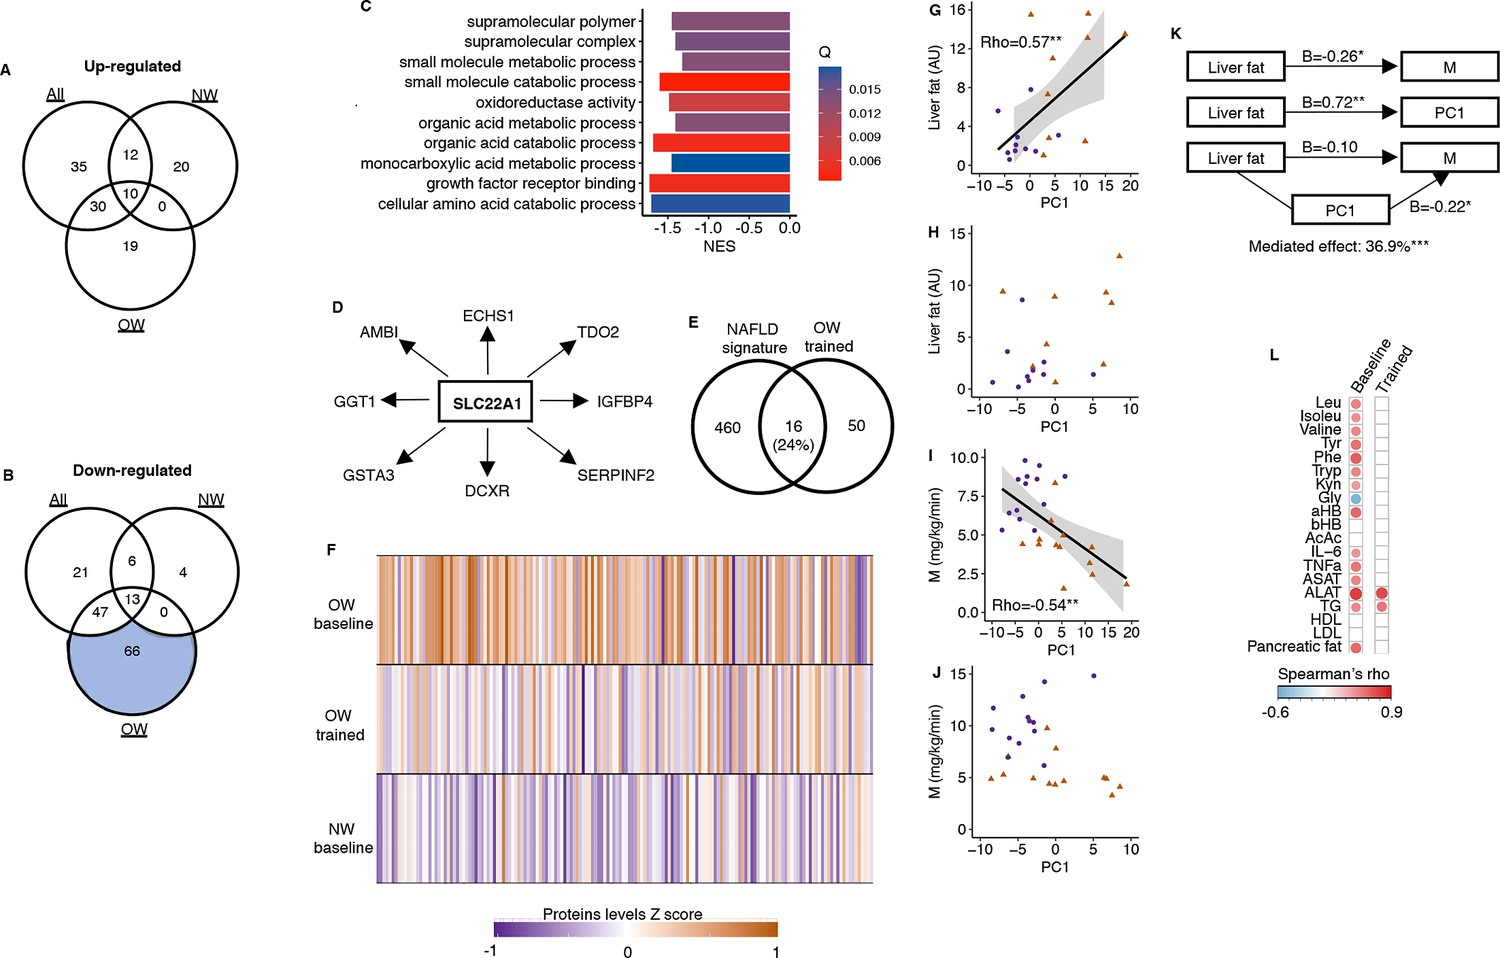
A serum proteomic liver fat signature.
(A) No upregulated proteins after prolonged exercise overlapped with known pathways. (B) Only the 66 downregulated proteins in the OW group overlapped with known pathways. (C) Top 10 gene sets overlapping with these 66 proteins. (D) SLC22A1 is a key driver among these 66 proteins. (E) These 66 proteins overlapped with a known human serum proteomic nonalcoholic fatty liver disease signature from Govaere et al., 2023. (F) The downregulated proteins in the OW group were elevated in OW vs. NW at baseline but normalized in the OW group after prolonged exercise. The principal component of these 66 proteins correlated with (G) liver fat content at baseline, but (H) not after prolonged exercise, with (I) the clamp M value at baseline, but (J) not after prolonged exercise. (K) The principal component (PC) of these 66 proteins mediated 36.9% of the association between liver fat and M. (L) The principal component of these 66 proteins correlated with several liver-related markers at baseline, but not after prolonged exercise except for aspartate transaminase (ASAT) and alanin aminotransferase (ALAT). White = nonsignificant, red/blue = significant. *p<0.05 and **p<0.01.
Figure 4
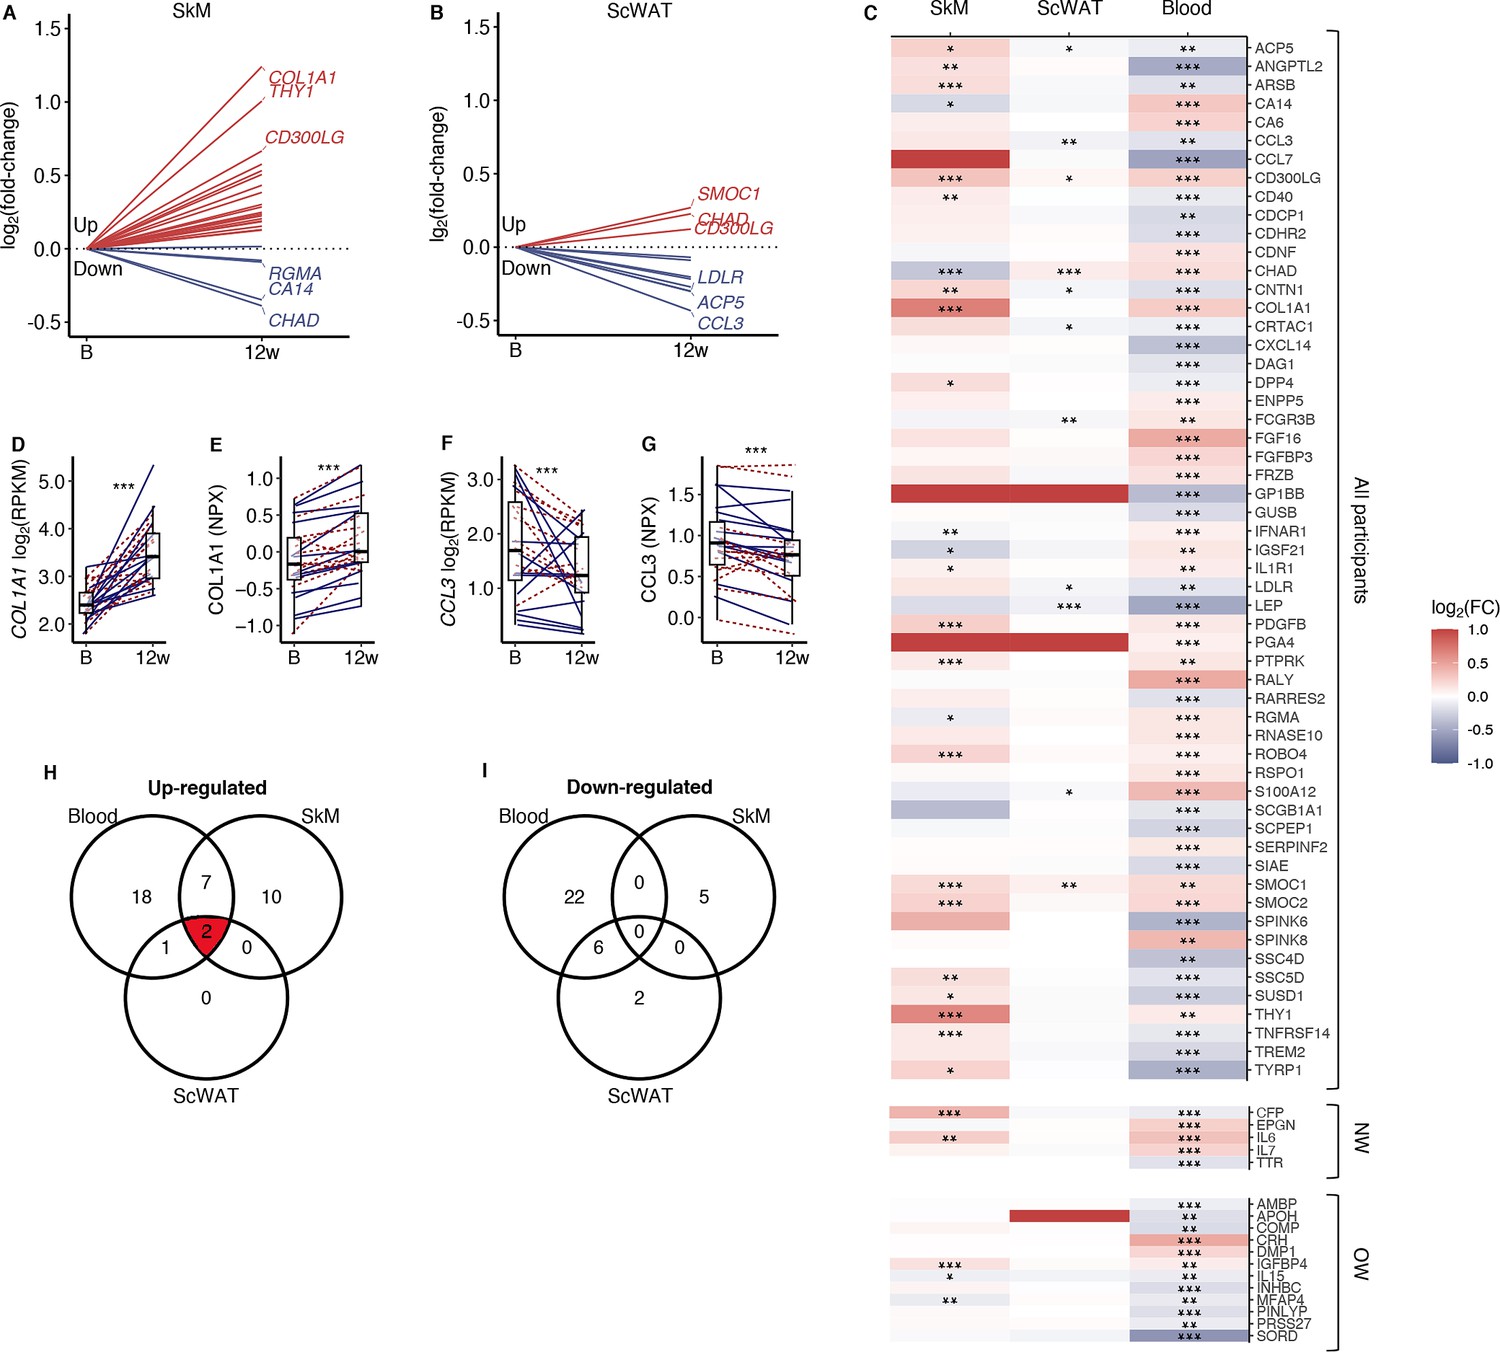
Comparison of secretory protein responses to prolonged exercise in blood with corresponding mRNA levels in skeletal muscle and adipose tissue.
(A) mRNA levels in skeletal muscle and (B) adipose tissue for proteins that responded significantly to prolonged exercise. (C) A heatmap of log2 (fold-changes) in blood, skeletal muscle, and adipose tissue. (D) The most responding mRNA in skeletal muscle, and (E) the response in the blood protein. (F) The most responding mRNA in adipose tissue, and (G) the response in the blood. (H, I) Venn diagrams of significant changes in blood, skeletal muscle, and adipose tissue. FC = fold-change; SkM = skeletal muscle; ScWAT = subcutaneous adipose tissue; NPX = normalized protein expression; RPKM = reads per kilobase per million mapped read. *p<0.05, **p<0.01, and ***p<0.001.
Figure 5 with 6 supplements
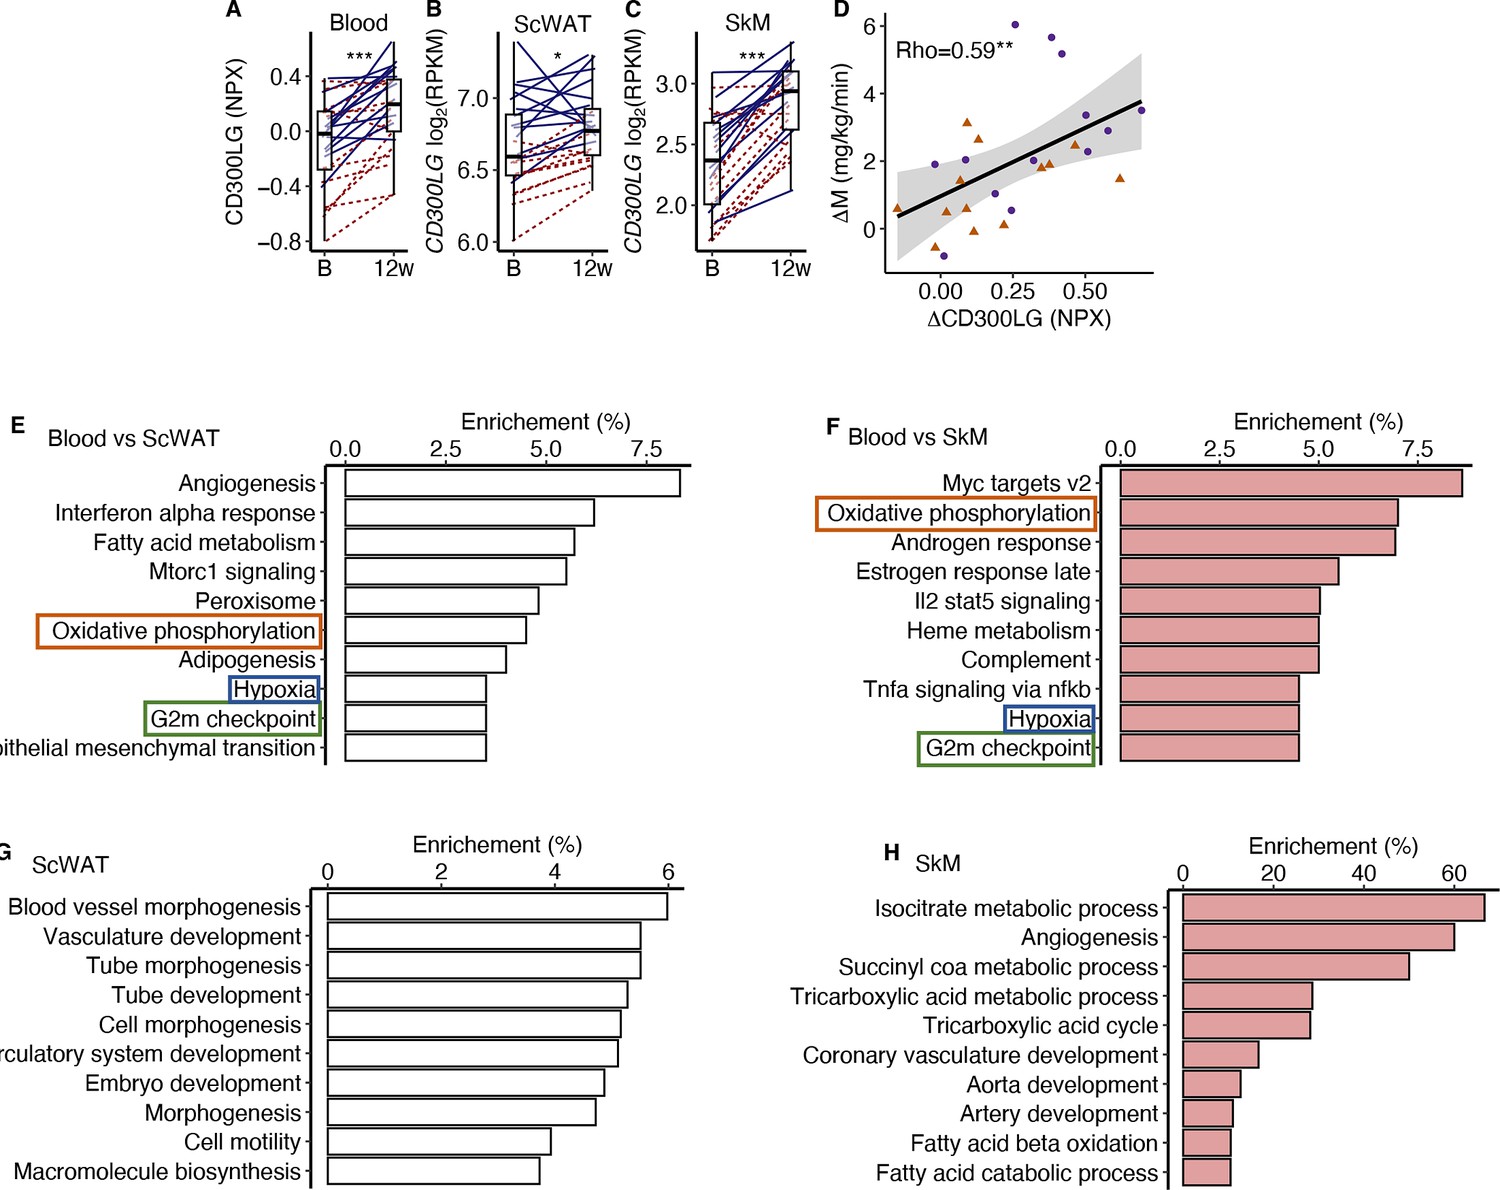
CD300LG.
(A) The response from baseline to week 12 in serum CD300LG and CD300LG mRNA in (B) subcutaneous adipose tissue (ScWAT) and (C) skeletal muscle (SkM). (D) Correlation between the change from before to after prolonged exercise in serum CD300LG and insulin sensitivity. (E–H) Pathway enrichment analyses were performed on the top 500 most correlated (and p<0.05) genes in (E) ScWAT or (F) SkM to the change in serum CD300LG levels, or to the change in CD300LG mRNA levels in (G) ScWAT or (H) SkM. Only the top 10 pathways with Q < 0.05 are presented. *p<0.05, **p<0.01, and ***p<0.001.
Figure 5—figure supplement 1
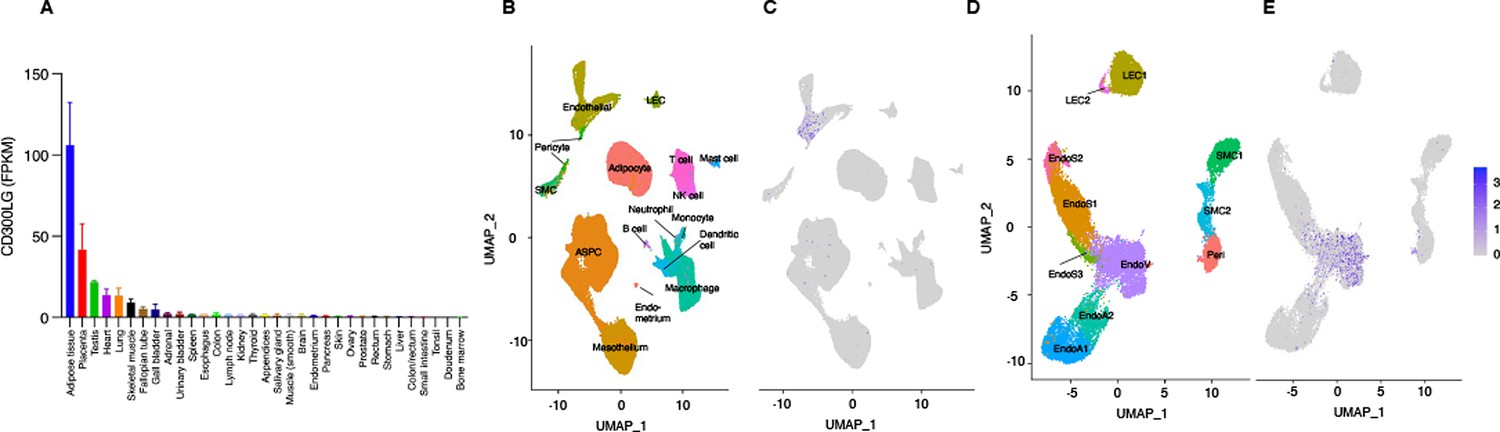
Tissue- and cell-specific expression of CD300LG.
(A) mRNA levels of CD300LG in a human tissue panel (see ‘Methods’). (B, C) snRNAseq of human adipose tissue, displaying (B) all detected cell clusters and (C) CD300LG related to the clusters (purple color). (D, E) Similar to (B, C), but showing the (D) vascular cell clusters and (E) the corresponding expression of CD300LG (purple color). FPKM = fragments per kilobase of transcript per million mapped reads. Data were obtained from Uhlén et al., 2015 and Emont et al., 2022 and can be explored at https://singlecell.broadinstitute.org/single_cell.
Figure 5—figure supplement 2
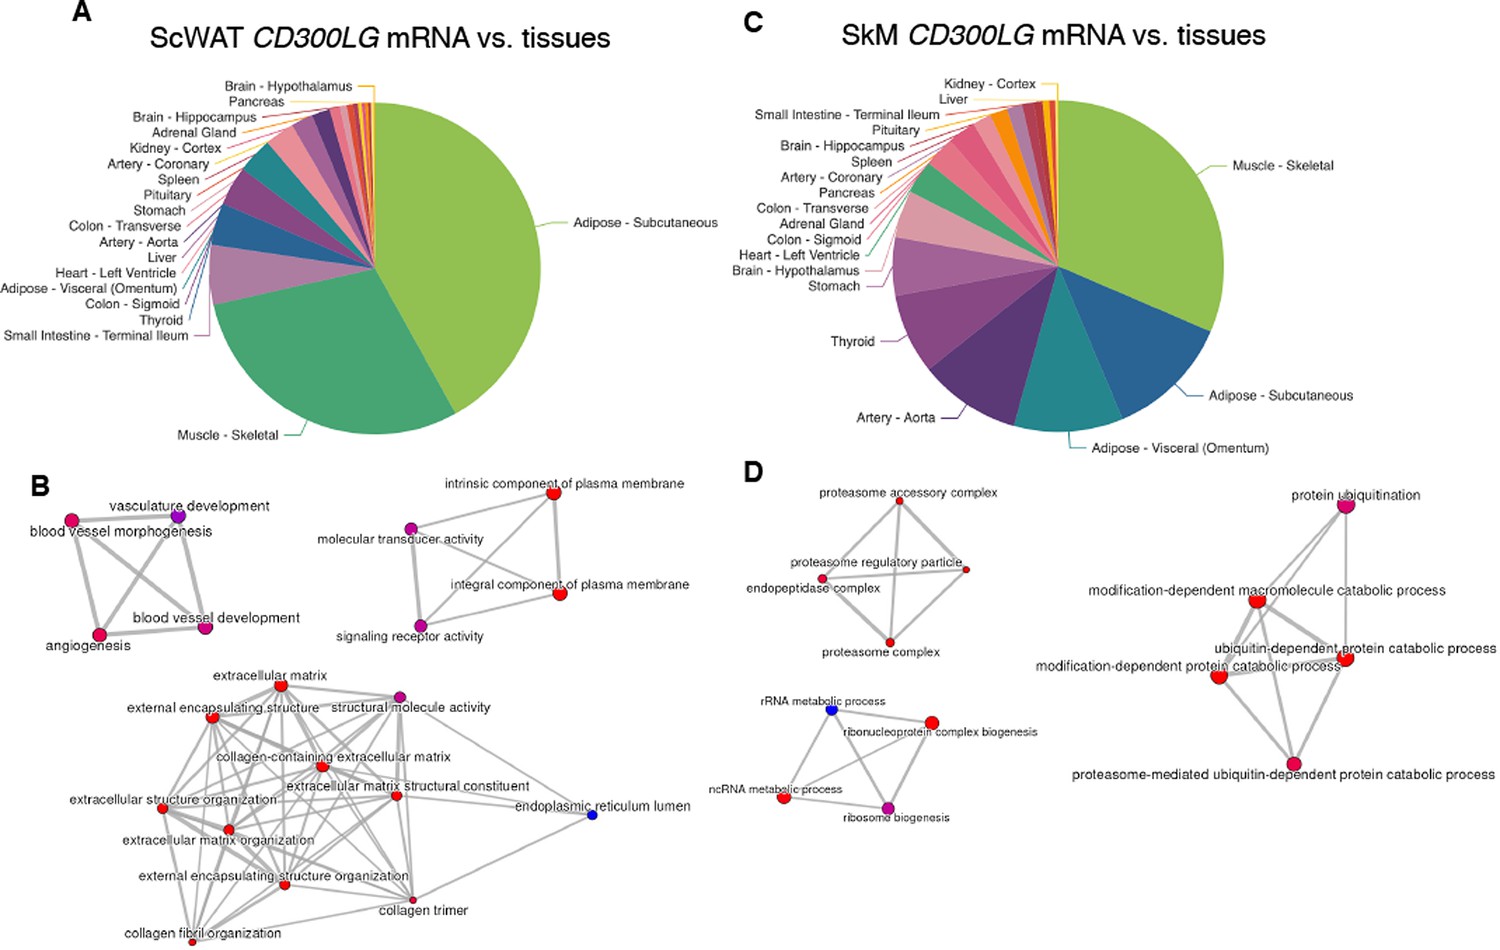
CD300LG mRNA correlations in men.
(A) Subcutaneous white adipose tissue (ScWAT) CD300LG mRNA and correlations with tissue gene expression. (B) The top three networks of CD300LG-related biological processes in adipose tissue. (C) Skeletal muscle (SkM) CD300LG mRNA and correlations with tissue gene expression. (D) The top three networks of CD300LG-related biological processes in skeletal muscle. Data were obtained from the GD-CAT (Genetically Derived Correlations Across Tissues) database described in Battle et al., 2017 and Zhou et al., 2024.
Figure 5—figure supplement 3
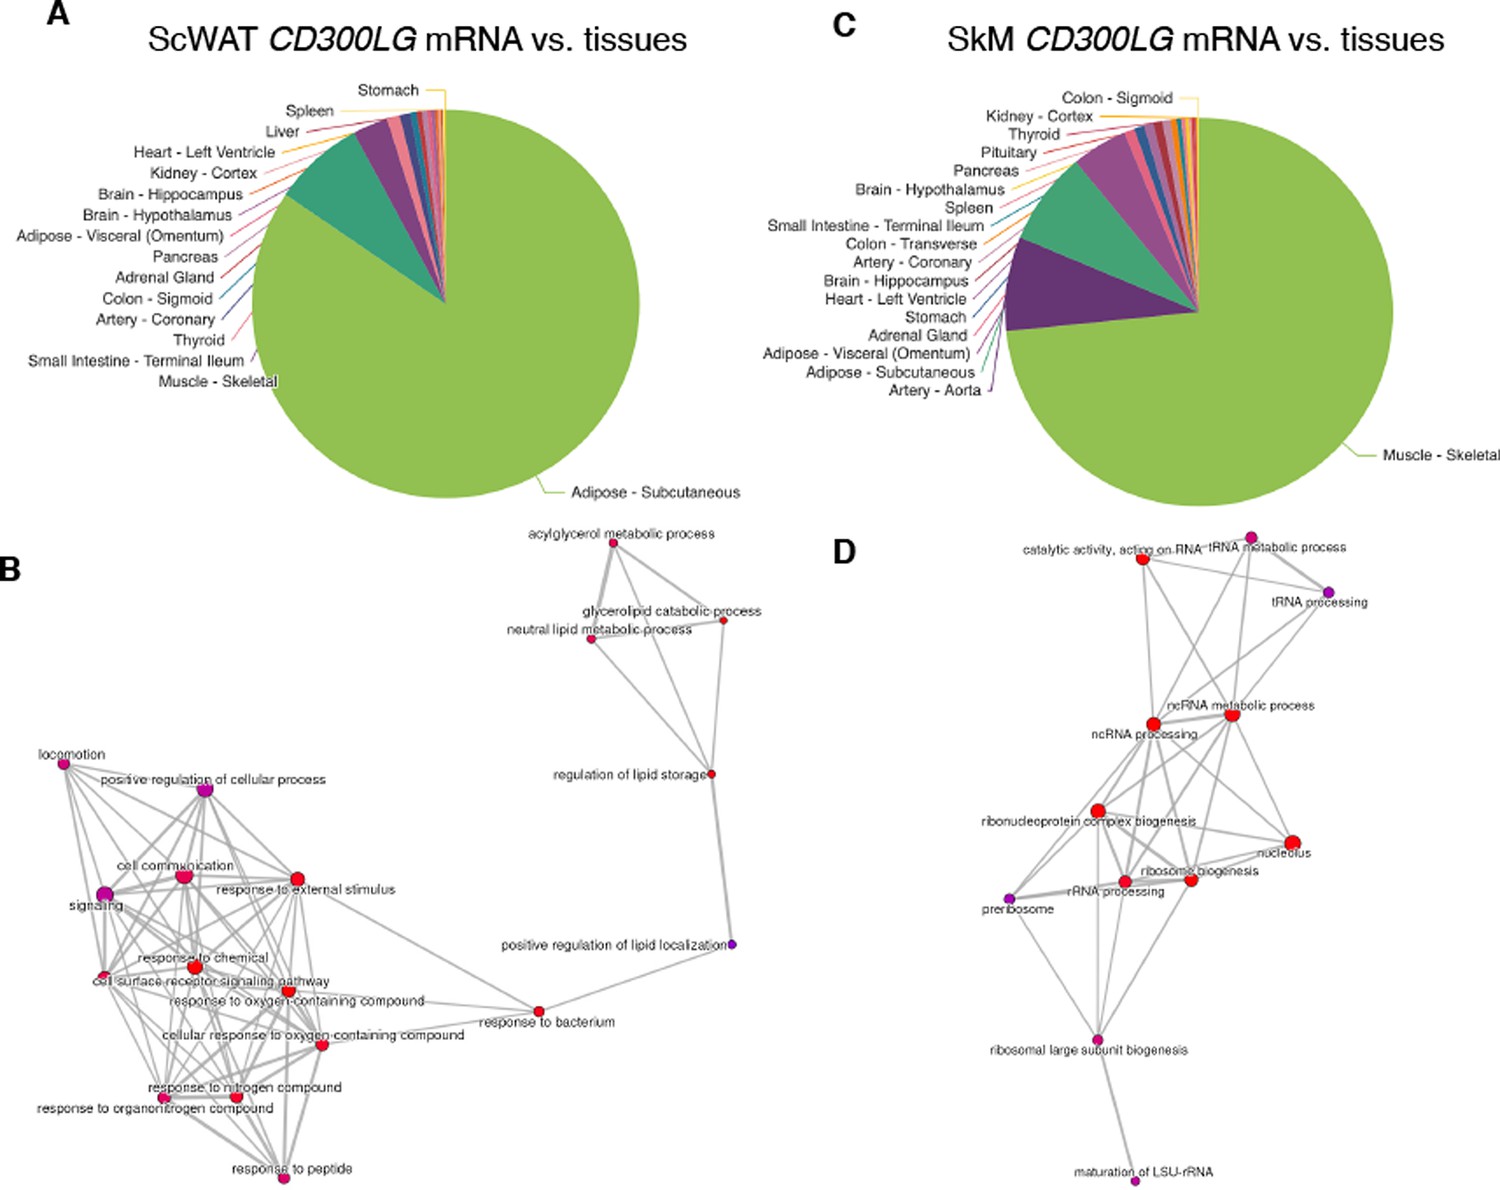
CD300LG mRNA correlations in women.
(A) Subcutaneous white adipose tissue (ScWAT) CD300LG mRNA and correlations with tissue gene expression. (B) The top network of CD300LG-related biological processes in adipose tissue. (C) Skeletal muscle (SkM) CD300LG mRNA and correlations with tissue gene expression. (D) The top network of CD300LG-related biological processes in skeletal muscle. Data were obtained from the GD-CAT (Genetically Derived Correlations Across Tissues) database described in Bowden et al., 2015 and Zhou et al., 2024.
Figure 5—figure supplement 4
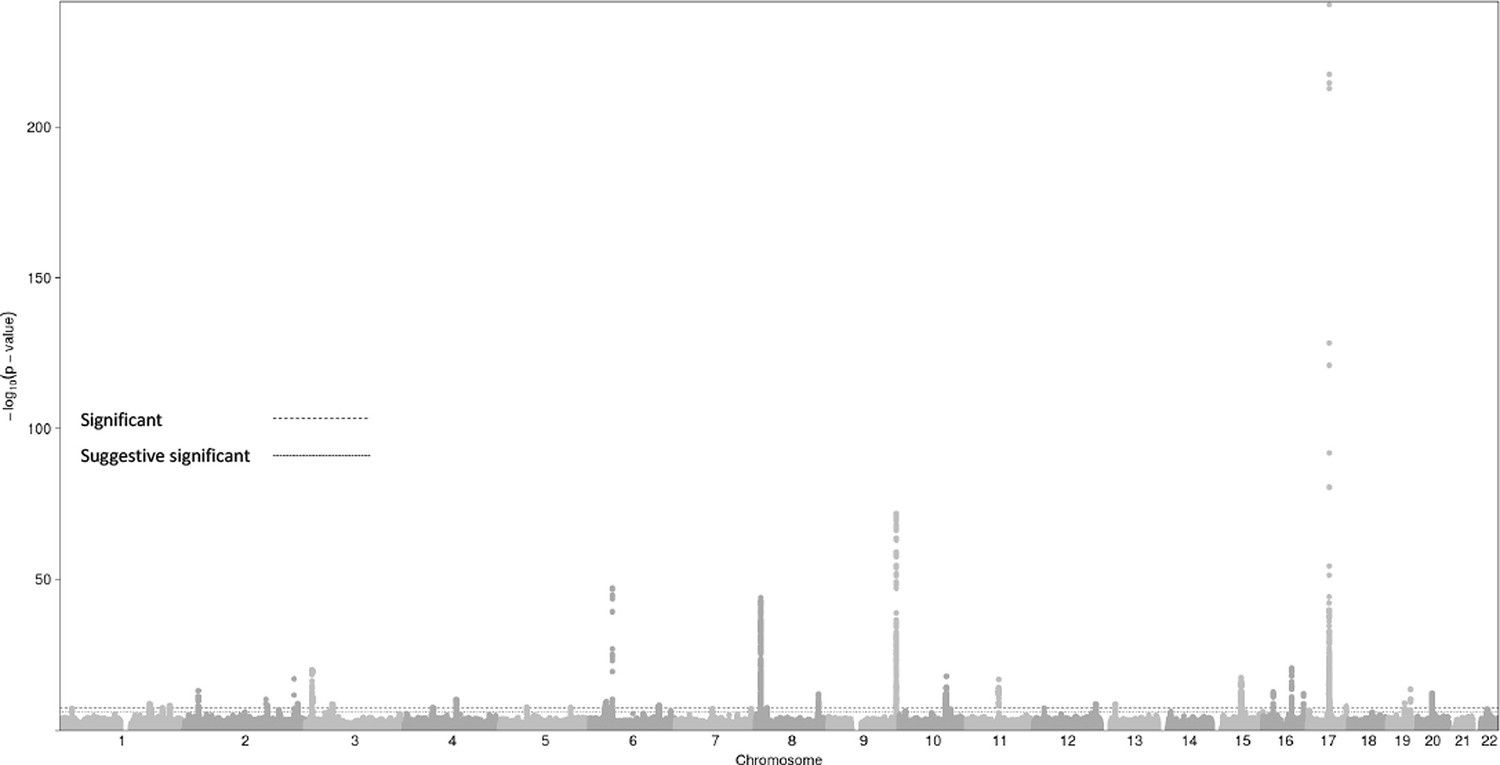
Manhattan plot for serum CD300LG protein levels GWAS.
The dashed line denotes ‘genome-wide significance’ threshold of p<5 × 10⁻⁸ whilst the dotted line denotes ‘suggestive significance’ threshold of p<1 × 10⁻⁶.
Figure 5—figure supplement 5
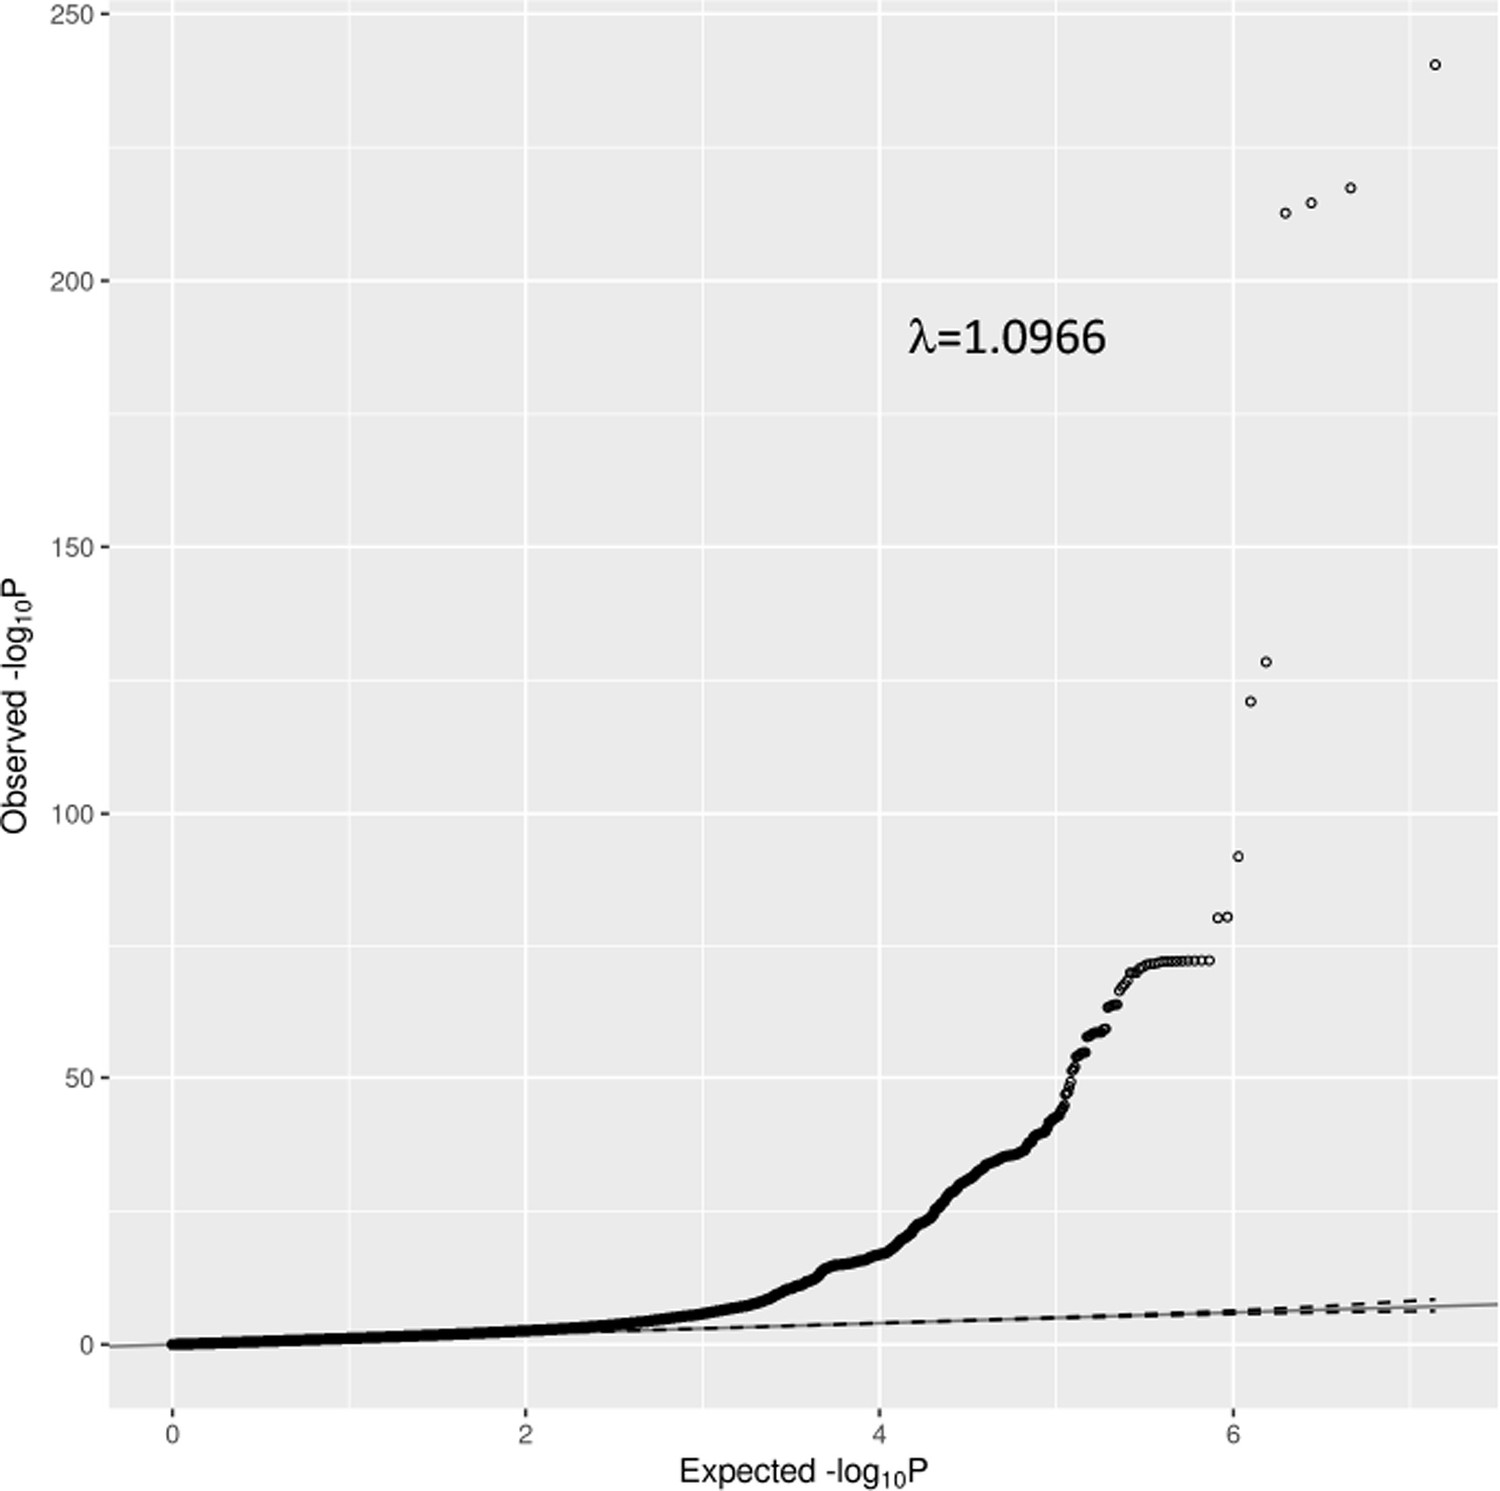
Quantile–quantile plot for CD300LG protein GWAS.
Comparison of observed and expected -log10 p-values expected under the null distribution of no genetic association across the genome. The dotted line represent the pointwise 95% confidence interval expected under the null hypothesis of no association. The genomic inflation factor (lambda = 1.0966) and LD score intercept (1.039) were consistent with our GWAS being well controlled for population stratification and other possible biases.
Figure 5—figure supplement 6
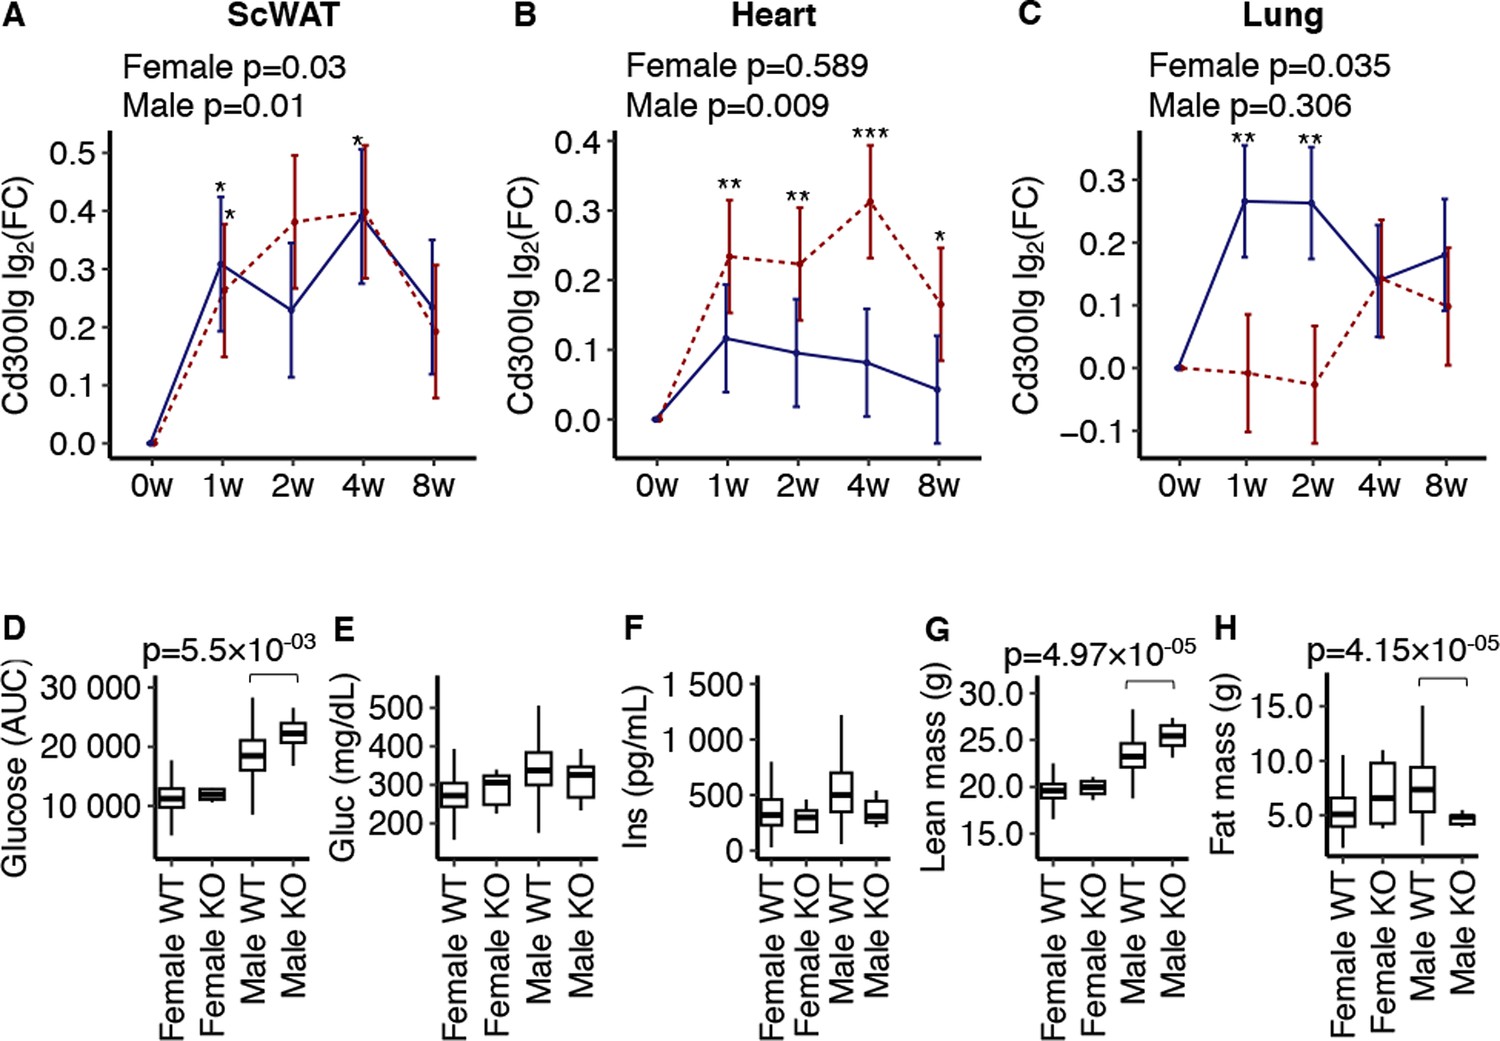
Functional validations.
MoTrPAC mice data (n = 12–15 female and n = 12–15 male mice) from Sanford et al., 2020 showing Cd300lg protein levels in (A) subcutaneous white adipose tissue (scWAT), (B) heart muscle, and (C) lung tissue in response to endurance exercise for 8 weeks. Error bars are standard error of the mean. International Mouse Phenotyping Consortium data obtained from Dickinson et al., 2016 showing (D) effects of Cd300lg on glucose tolerance, (E) fasting glucose concentration, (F) fasting insulin concentration, (G) lean body mass, and (H) body fat mass. Mice included wild type (WT) (n = 1516 females and n = 1520 males), and n = 7 females and n = 7 males knock out (KO) mice.Data were analyzed using mixed linear regression. *p<0.05, **p<0.01, and ***p<0.001. AUC = areal under the curve; w = week.
Tables
Table 1
Multiple regression analyses between serum CD300LG, and measures of physical activity and glucometabolic traits in the UK Biobank.
| Women | Men | Interaction | ||||||||||
|---|---|---|---|---|---|---|---|---|---|---|---|---|
| Beta-estimate | SE | p | Beta-estimate | SE | p | Beta-estimate | SE | p | Description | No. of women | No. of men | |
| NPX ~ physical activity | ||||||||||||
| MET per week all activity | 1.0E-06 | 1.2E-06 | 0.384 | 4.5E-06 | 9.9E-07 | <0.001 | 4.3E-06 | 1.5E-06 | 0.005 | MET minutes per week | 22,527 | 20,726 |
| MET minutes walking | –6.0E-07 | 2.6E-06 | 0.818 | –1.8E-06 | 2.6E-06 | 0.478 | 1.7E-07 | 3.7E-06 | 0.962 | MET minutes per week | 22,527 | 20,726 |
| MET minutes moderate activity | –2.5E-06 | 2.4E-06 | 0.294 | 1.9E-07 | 2.3E-06 | 0.932 | 1.9E-06 | 3.3E-06 | 0.554 | MET minutes per week | 22,527 | 20,726 |
| MET minutes vigorous activity | 1.0E-05 | 2.8E-06 | <0.001 | 2.2E-05 | 2.1E-06 | <2e-16 | 1.5E-05 | 3.5E-06 | <0.001 | MET minutes per week | 22,527 | 20,726 |
| Sedentary overall average | 0.077 | 0.053 | 0.147 | 0.042 | 0.054 | 0.441 | –0.100 | 0.075 | 0.185 | Proportion sedentary activity. | 7430 | 5825 |
| Light overall average | –0.119 | 0.062 | 0.053 | –0.420 | 0.071 | <0.001 | –0.232 | 0.094 | 0.013 | Proportion light activity. | 7430 | 5825 |
| Moderate/vigorous overall average | 0.633 | 0.171 | <0.001 | 1.357 | 0.194 | <0.001 | 1.043 | 0.254 | <0.001 | Proportion moderate/vigorous activity. | 7430 | 5825 |
| IPAQ activity group | 9.6E-03 | 3.8E-03 | 0.012 | 3.1E-02 | 3.8E-03 | <0.001 | 2.6E-02 | 5.4E-03 | <0.001 | IPAQ category | 22,527 | 20,726 |
| Summed days activity | 1.9E-03 | 5.9E-04 | <0.001 | 3.8E-03 | 5.7E-04 | <0.001 | 2.7E-03 | 8.1E-04 | <0.001 | Days performing walking, moderate and vigorous activity | 23,199 | 21,138 |
| Summed minutes activity | –1.8E-05 | 3.0E-05 | 0.550 | 6.4E-05 | 2.7E-05 | 0.017 | 9.9E-05 | 4.0E-05 | 0.013 | Mins performing walking, moderate and vigorous activity | 22,527 | 20,726 |
| Moderate/vigorous recommendation* | 7.5E-03 | 5.6E-03 | 0.186 | 4.8E-02 | 5.8E-03 | <2e-16 | 4.6E-02 | 8.0E-03 | <0.001 | Yes/no | 22,527 | 20,726 |
| Moderate/vigorous walking recommendation* | –1.3E-05 | 7.2E-03 | 0.999 | 4.0E-02 | 7.4E-03 | <0.001 | 4.6E-02 | 1.0E-02 | <0.001 | Yes/no | 22,521 | 20,723 |
| Trait ~ NPX | 28,108 | 23,841 | ||||||||||
| Body fat percentage impedance | –0.137 | 0.051 | 0.007 | –0.552 | 0.052 | <0.001 | –0.375 | 0.073 | <0.001 | Body fat percentage | 28,099 | 23,802 |
| Whole body fat mass impedance | 0.345 | 0.049 | <0.001 | 0.023 | 0.051 | 0.656 | –0.209 | 0.071 | 0.003 | Fat mass (kg) | 28,108 | 23,866 |
| Whole body fat free mass impedance | 0.450 | 0.050 | <0.001 | 1.045 | 0,090 | <0.001 | 0.622 | 0,101 | <0.001 | Fat free mass (kg) | 28,107 | 23,870 |
| Body mass index | - | - | - | - | - | - | - | - | - | kg/m2 | 24,810 | 21,509 |
| Glucose | –0.066 | 0.016 | <0.001 | –0.041 | 0.022 | 0.062 | 0.033 | 0.026 | 0.202 | mmol/L | 27,271 | 23,294 |
| HbA1c | –0.898 | 0.078 | <0.001 | –0.911 | 0.107 | <0.001 | –0.010 | 0.130 | 0.936 | mmol/mol | 27,323 | 23,292 |
| Triglycerides | –0.399 | 0.011 | <0.001 | –0.413 | 0.017 | <0.001 | –0.058 | 0.020 | 0.004 | mmol/L | 28,387 | 24,332 |
| Type 2 diabetes | –0.012 | 0.002 | <0.001 | –0.018 | 0.004 | <0.001 | 0.000 | 0.004 | 0.982 | Yes/no | 24,802 | 21,483 |
| TyG | –2.189 | 0.074 | <0.001 | –2.228 | 0.120 | <0.001 | –0.203 | 0.136 | 0.138 | mmol/L × mmol/L | 22,527 | 23,841 |
-
Model 1 (NPX ~ physical activity) was a linear regression model of NPX values as a function of a measure of physical activity.
-
Model 2 (Trait ~ NPX) indicates the measures of body composition and glucometabolic traits were the outcomes and NPX values were set as the exposure.
-
Models 1 and 2 were adjusted for age, batch, study centre, storage time, and BMI.
-
*
Indicates whether a person met the 2017 UK Physical activity guidelines of 150 min of moderate activity per week or 75 min of vigorous activity.
-
MET = metabolic equivalent of task. NPX = normalized protein expression. SE = standard error. IPAQ = International Physical Activity Questionnaire. TyG = triglyceride glucose index on insulin resistance.
Table 2
Mendelian randomization (MR) of serum CD300LG levels and glucose outcomes using MR PRESSO.
| Outcome | MR analysis | Number of outliers | Effect | SD | p-value |
|---|---|---|---|---|---|
| 2 hr post OGTT glucose (mmol/L) | Raw | –0.3722 | 0.0998 | 6.2 × 10⁻⁴ | |
| 2 hr post OGTT glucose (mmol/L) | Outlier-corrected | 2 | –0.3049 | 0.0855 | 1.04 × 10⁻² |
| Fasting glucose (mmol/L) | Raw | –0.0307 | 0.0358 | 0.3963 | |
| Fasting glucose (mmol/L) | Outlier-corrected | 2 | –0.0556 | 0.0133 | 1.73 × 10⁻⁴ |
| Fasting insulin (pmol/L) | Raw | –0.0870 | 0.0558 | 0.1271 | |
| Fasting insulin (pmol/L) | Outlier-corrected | 10 | –0.0534 | 0.0252 | 0.0432 |
| HbA1c (%) | Raw | –0.0485 | 0.0155 | 3.28 × 10⁻³ | |
| HbA1c (%) | Outlier-corrected | 3 | –0.0560 | 0.0155 | 1.04 × 10⁻⁴ |
-
For detailed results, see Supplementary file 1H and I. Fasting glucose adjusted for body mass index (BMI) n = 200,622, 2 hr post oral glucose tolerance test (OGTT) glucose adjusted for BMI n = 63,396, fasting insulin adjusted for BMI n = 15,1013, and HbA1c n = 146,806.
Additional files
-
MDAR checklist
- https://cdn.elifesciences.org/articles/96535/elife-96535-mdarchecklist1-v1.docx
-
Supplementary file 1
Detailed results.
(A) Subject characteristics at baseline and changes observed after 12 weeks of exercise. (B) All mixed model results for Olink proteins in response to prolonged exercise. (C) Common and specific upregulated proteins in response to prolonged exercise in all participants, only normal weight men and in only overweight men. (D) Common and specific downregulated proteins in response to prolonged exercise in all participants, only normal weight men and in only overweight men. (E) Descriptive statistics UK Biobank. (F) Serum CD300LG cis-pQTLs. (G) Serum CD300LG trans-pQTLs. (H) Results of cis-only pQTLs MR analysis for serum protein level (log2) on outcomes of interest (2-hr post OGTT glucose [mmol/L], fasting glucose [mmol/L], fasting insulin [mmol/L], and HbA1c [%]). (I) Results of cis- and trans-combined pQTLs MR analysis for outcomes of interest (2-hr post OGTT glucose, fasting glucose, fasting insulin, and HbA1c). (J) SNPs and their prior associations. (K) All available phenotype data on the Cd300lg knock-out mice model.
- https://cdn.elifesciences.org/articles/96535/elife-96535-supp1-v1.xlsx
Download links
A two-part list of links to download the article, or parts of the article, in various formats.
Downloads (link to download the article as PDF)
Open citations (links to open the citations from this article in various online reference manager services)
Cite this article (links to download the citations from this article in formats compatible with various reference manager tools)
Serum proteomic profiling of physical activity reveals CD300LG as a novel exerkine with a potential causal link to glucose homeostasis
eLife 13:RP96535.
https://doi.org/10.7554/eLife.96535.3


