A transcription network underlies the dual genomic coordination of mitochondrial biogenesis
- National Heart, Lung, and Blood Institute, National Institutes of Health, United States
Figures
Figure 1
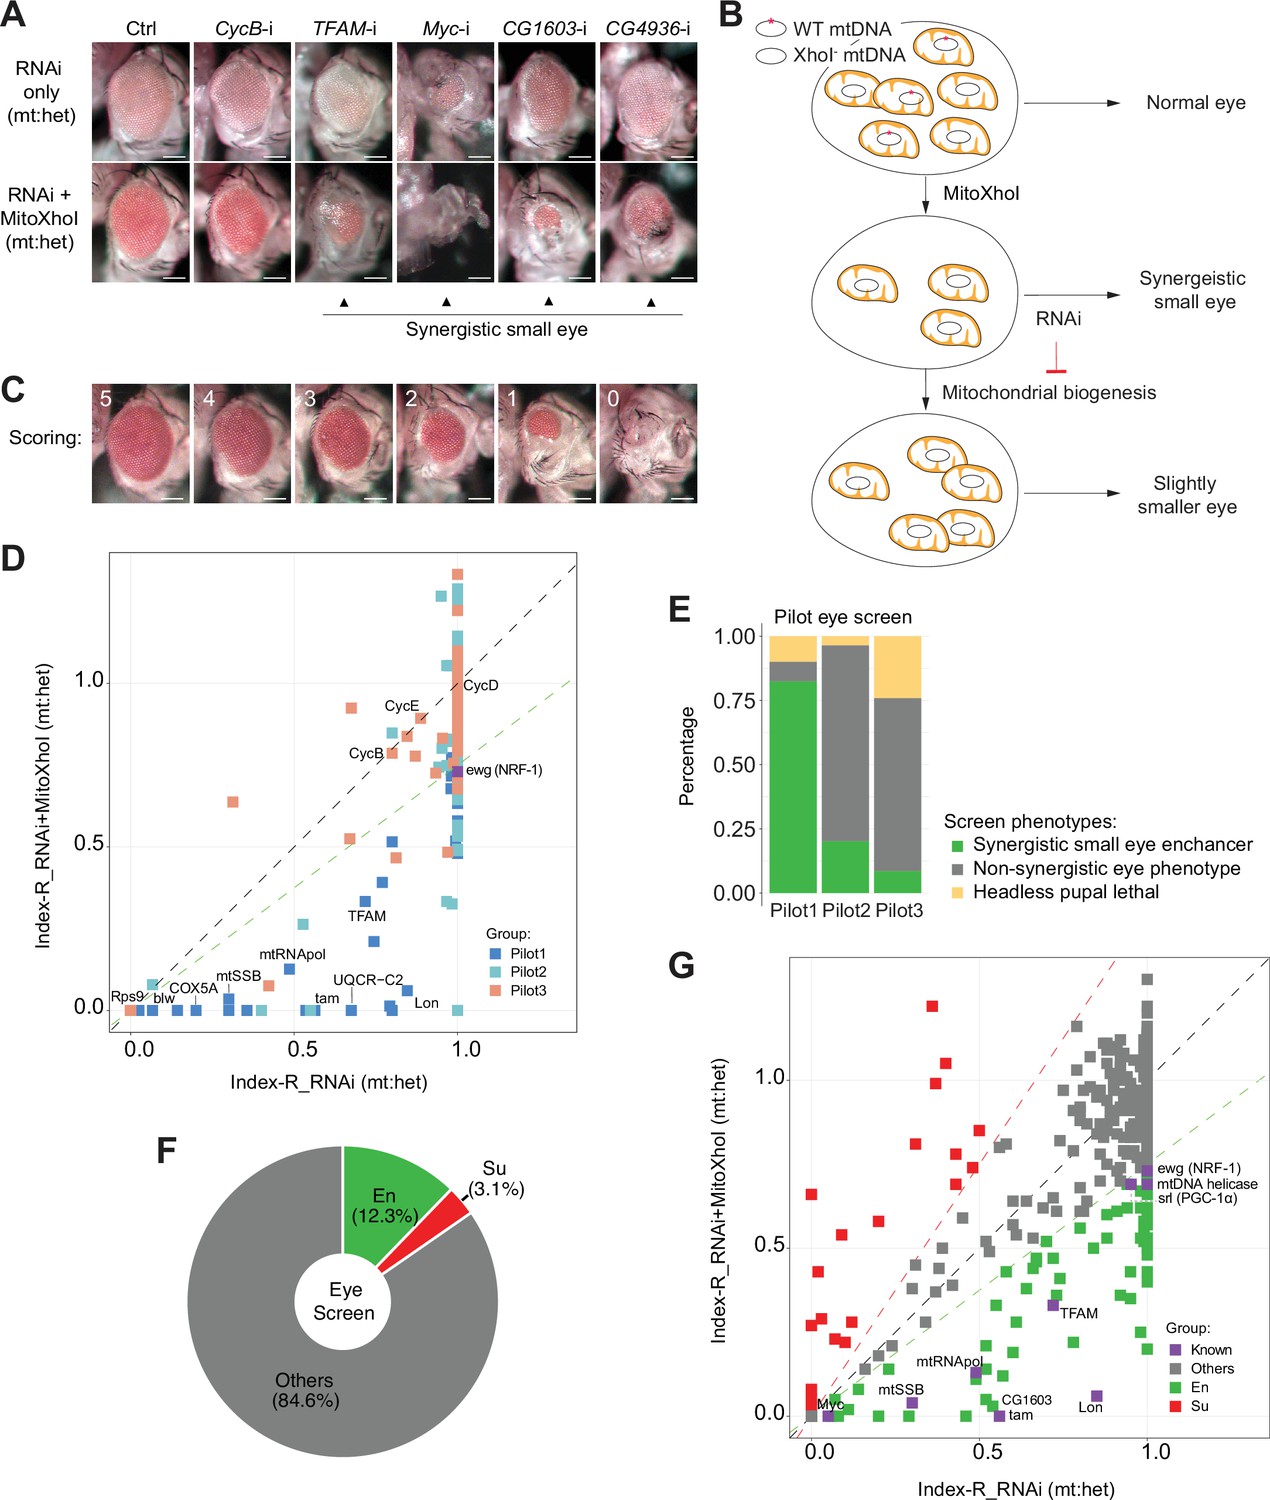
A genetic modifier screen identifying transcription factors regulating electron transport chain (ETC) biogenesis.
(A) Representative images of adult eye of the control RNAi (Ctrl) and RNAi of selected genes tested in the eye screen, including CycB RNAi (CycB-i), TFAM RNAi (TFAM-i), Myc RNAi (Myc-i), CG1603 RNAi (CG1603-i), and CG4936 RNAi (CG4936-i). The upper panel shows eyes from RNAi-only offspring, and lower panel displays eyes from RNAi+MitoXhoI offspring cultured at the same condition. Arrowheads indicate the synergistic small-eye phenotype resulting from the combination of gene knockdown and the mitochondrial DNA (mtDNA) deficiency caused by mitoXhoI in the background of heteroplasmic mtDNAs. Scale bars: 100 µm. (B) Schematic of the genetic modifier screen methodology (see text for details). (C) Representative images illustrating the scoring of eye size. Scale bars: 100 µm. (D) A plot illustrating the calling of positive hits in the pilot screen. Each datapoint represents the Index-R of RNAi (X values) or RNAi+MitoXhoI flies (Y values) for each gene belonging to the different groups (see (E) and Supplementary file 1 for details). Genes with datapoints below the gray diagonal dash line exhibited a synergistic effect when combining their RNAi with mtDNA deficiency suggesting a potential role in regulating ETC biogenesis. The datapoint for ewg, the fly homolog of NRF-1, is labeled in purple. The green dashed line of slope 0.75 outlines the threshold for calling out positive hits based on ewg’s performance in the screen. (E) Graph summarizing the pilot screen of nuclear-encoded genes, demonstrating the efficacy of this screen in identifying genes involved in mitochondrial ETC biogenesis. Pilot group 1 (Pilot1) has 40 genes that are either nuclear-encoded ETC subunits or related to mtDNA maintenance and gene expression (Mito-EBR). Pilot2 has 84 genes involved in other mitochondrial processes. Pilot3 has 58 essential genes from other cellular components. (F) Graph summarizing the percentages of synergistic enhancers (En) and suppressors (Su) identified in the screen (see (G) and Supplementary file 1 for details). (G) A plot illustrating the calling of positive hits in the screen of transcription factor (TF) genes. Factors that are known to be involved in mitochondrial or ETC biogenesis are marked in purple (Known). The green dashed line outlines the threshold for calling out synergistic enhancers (En, green square). The red dashed line of slope 1.5 outlines the threshold for calling out suppressors (Su, red square).
-
Figure 1—source data 1
Raw data used to generate Figure 1D–G.
- https://cdn.elifesciences.org/articles/96536/elife-96536-fig1-data1-v1.xlsx
Figure 2 with 1 supplement

Regulatory network of mitochondrial biogenesis.
(A) The transcriptional regulatory network of nuclear-encoded mitochondrial genes. (B) Bar graphs illustrating the promoter binding profiles of 49 synergistic enhancer transcription factors (TFs) within different groups of genes (nuclear-encoded mitochondrial genes, Mito-EBR genes, 49 synergistic enhancer TFs, and electron transport chain [ETC] genes). The number of genes in each group (orange) and the number of these bound by CG1603 (cyan) were highlighted.
-
Figure 2—source data 1
Raw data used to generate Figure 2B.
- https://cdn.elifesciences.org/articles/96536/elife-96536-fig2-data1-v1.xlsx
Figure 2—figure supplement 1
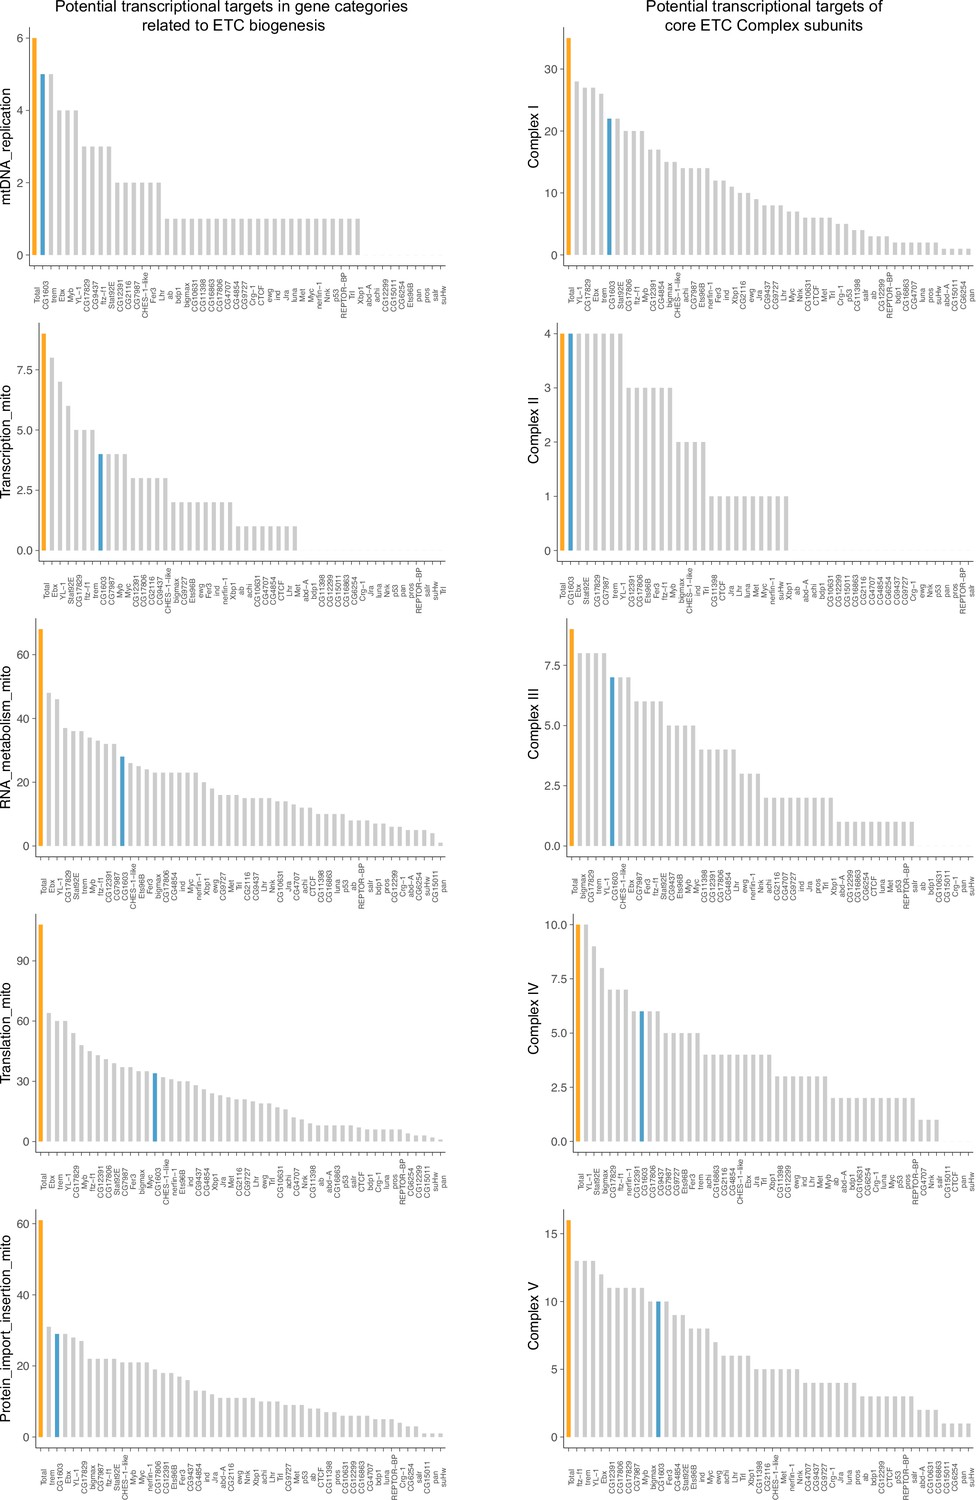
The promoter binding profiles of the enhancer transcription factors (TFs) in different mitochondrial biogenesis-related groups.
Bar graphs summarizing the promoter binding profiles of the 49 synergistic enhancer TFs within subgroups of genes involved in different processes of electron transport chain (ETC) biogenesis. The number of genes in each subgroup (orange) and the number of these bound by CG1603 (cyan) were highlighted.
-
Figure 2—figure supplement 1—source data 1
Raw data used to generate Figure 2—figure supplement 1.
- https://cdn.elifesciences.org/articles/96536/elife-96536-fig2-figsupp1-data1-v1.xlsx
Figure 3 with 1 supplement
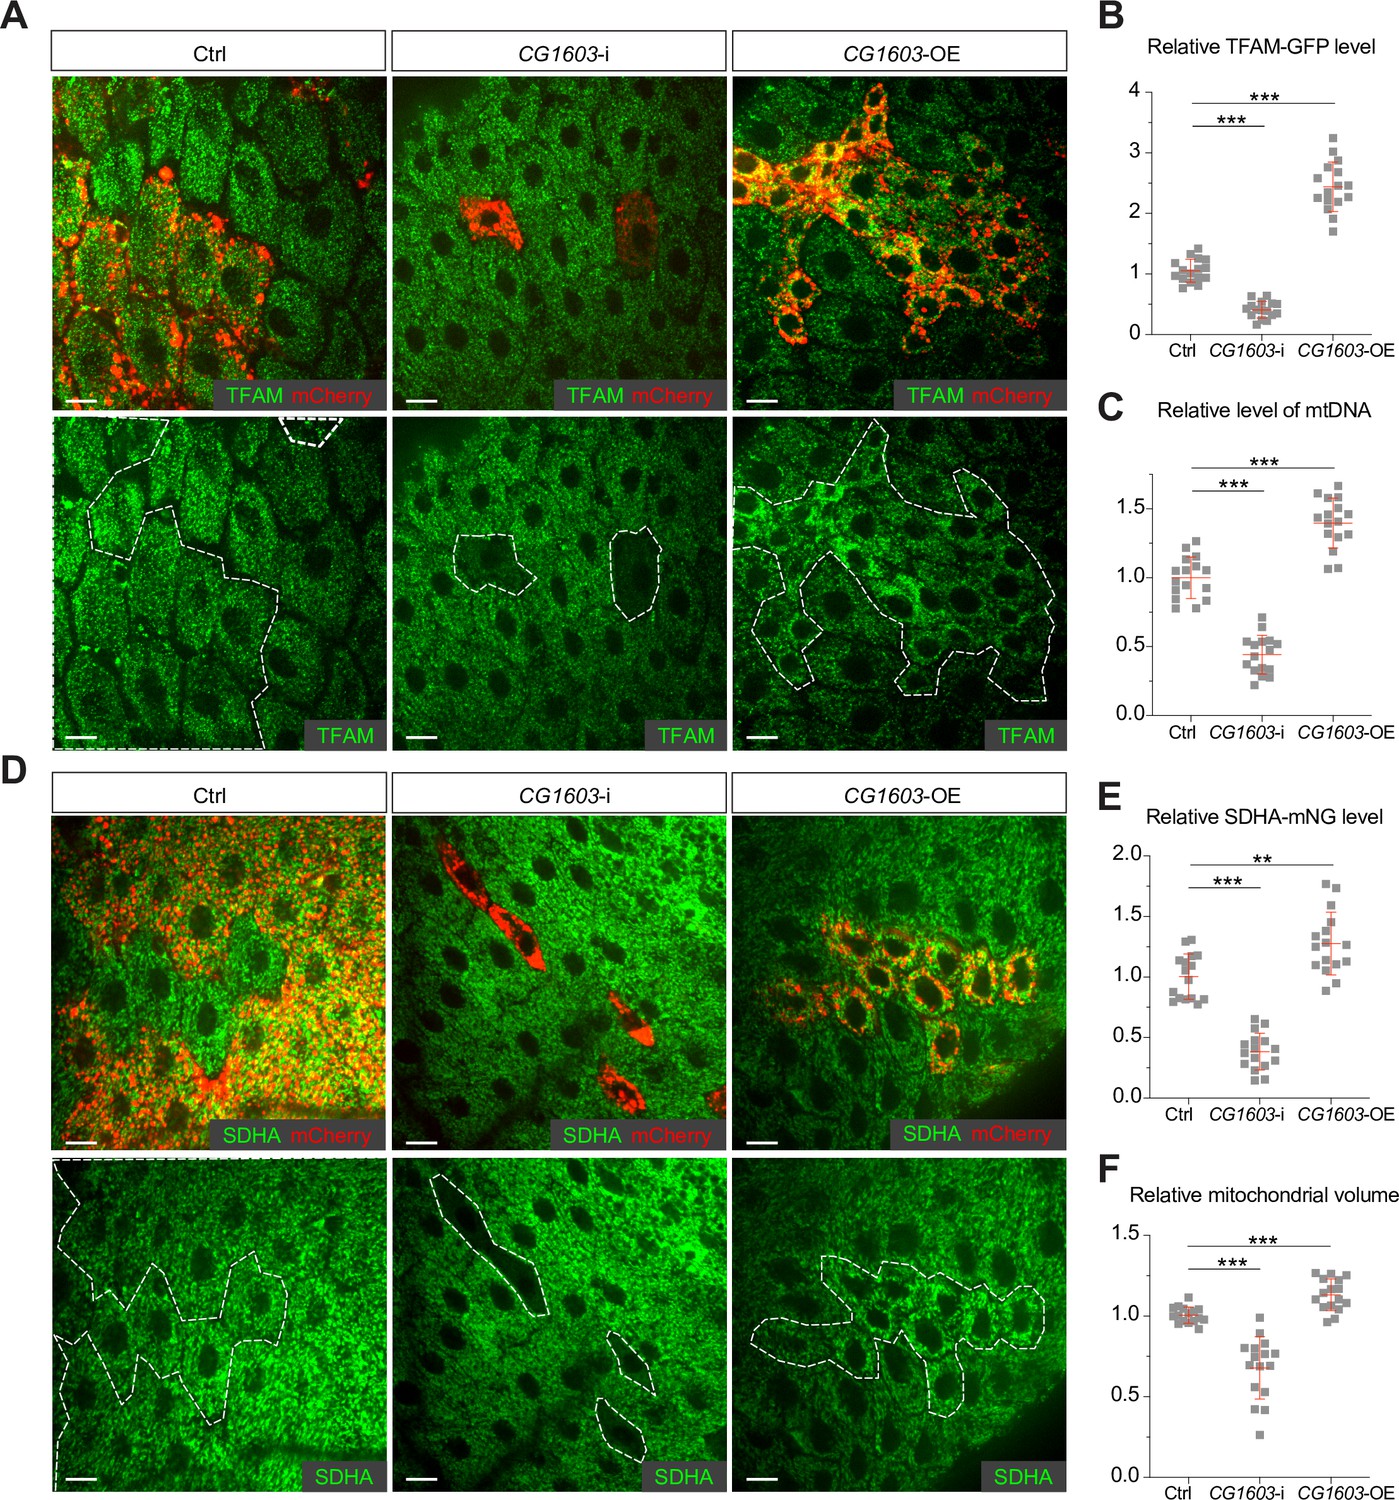
CG1603 promotes electron transport chain (ETC) gene expression and mitochondrial biogenesis.
(A, D) Representative images of control RNAi (Ctrl), CG1603 RNAi (CG1603-i), and CG1603 overexpression (CG1603-OE) midgut enterocytes (EC) clones with endogenously expressed TFAM-GFP (A) or SDHA-mNG (D) visualized in green. Clones were labeled by mCherry red and compared with wild type (wt) neighbors. White dashed lines aided in illustrating clones. Scale bars: 10 µm. (B, C, E, F) Quantification of the relative TFAM-GFP level (B), the relative levels of mtDNA (C), the relative SDHA-mNG level (E), and the relative mitochondrial volume (F) in the EC clones to their wt neighbors. n=16 from 8 midguts for each group, error bar: SD. Two-tailed Student's t-test, **: p<0.01, ***: p<0.001.
-
Figure 3—source data 1
Raw data used to generate Figure 3B, C, E, and F.
- https://cdn.elifesciences.org/articles/96536/elife-96536-fig3-data1-v1.xlsx
Figure 3—figure supplement 1

CG1603 RNAi led to fewer enterocytes (EC) clone cells.
Number of EC clone cells in control RNAi (Ctrl) and CG1603 RNAi (CG1603-i) midguts. n=8, error bar: SD. Two-tailed Student's t-test, ***: p<0.001.
-
Figure 3—figure supplement 1—source data 1
Raw data used to generate Figure 3—figure supplement 1.
- https://cdn.elifesciences.org/articles/96536/elife-96536-fig3-figsupp1-data1-v1.xlsx
Figure 4 with 2 supplements
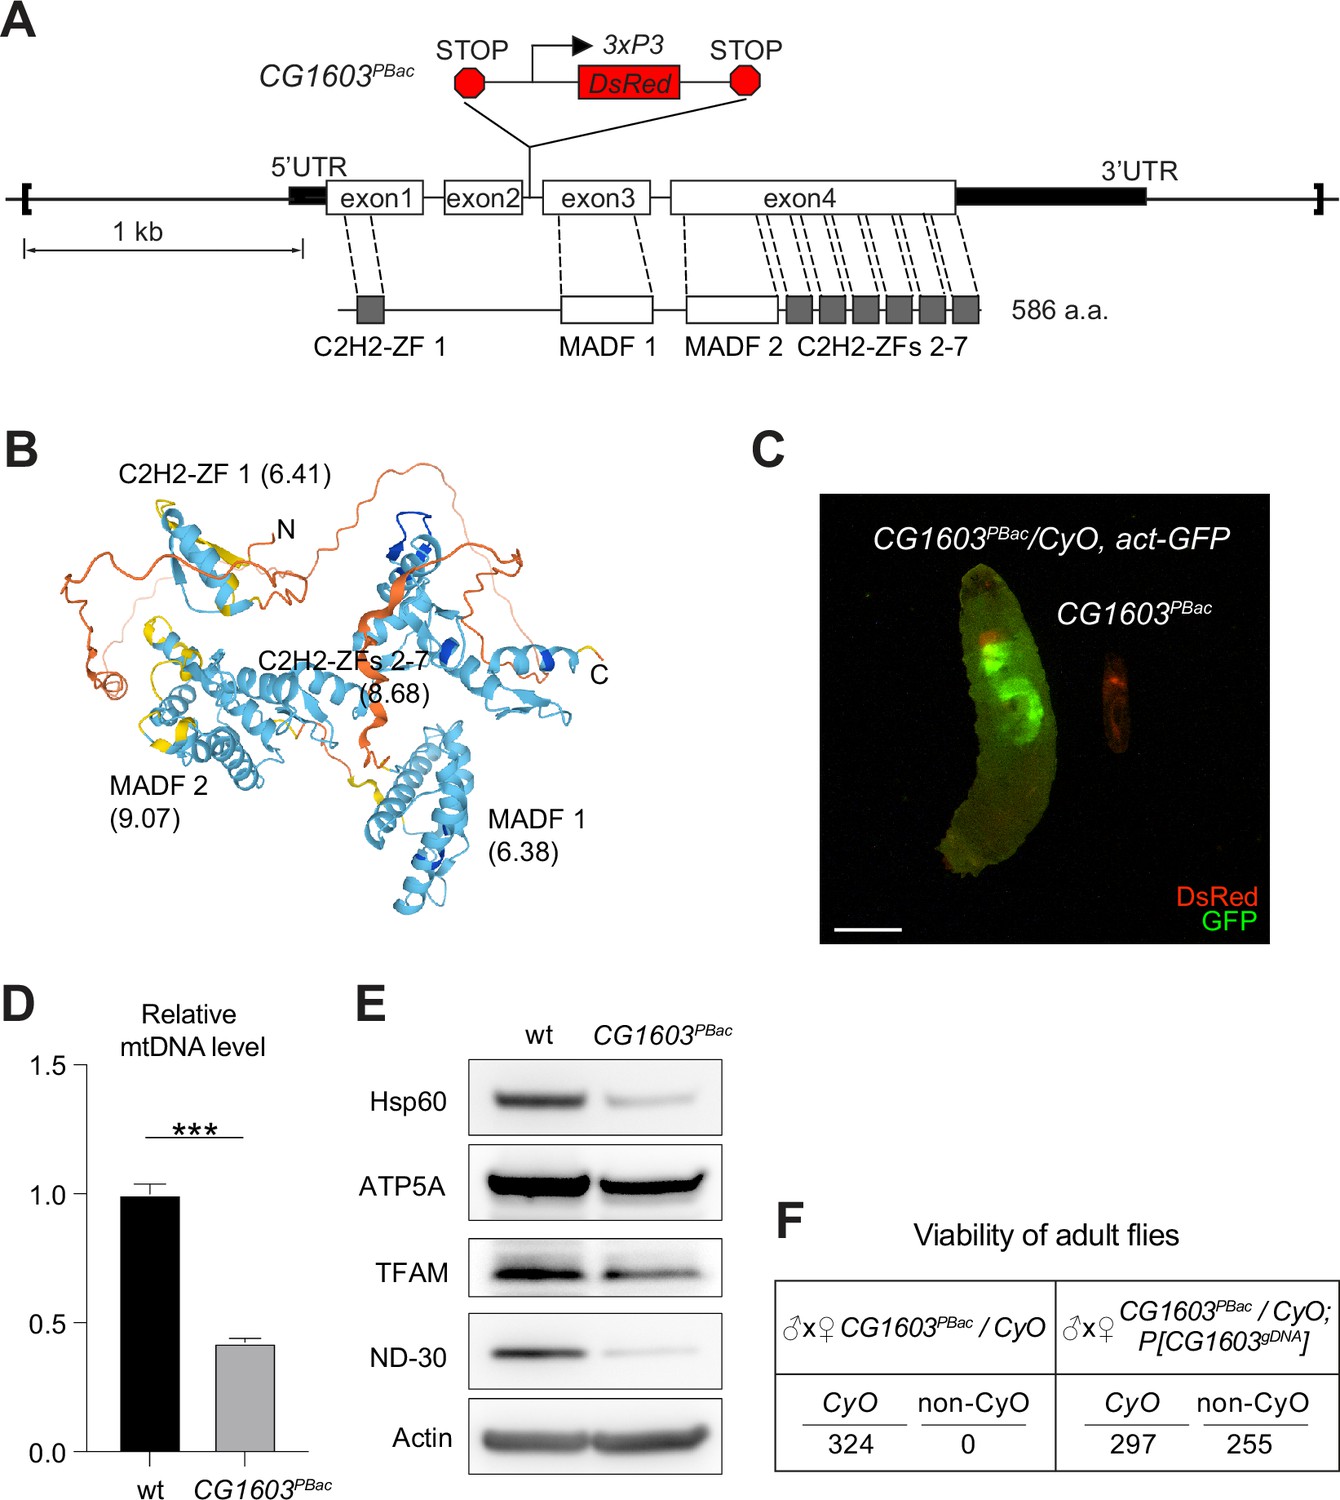
CG1603 gene model, product, mutant, and the genomic DNA transgene.
(A) Schematic representation of CG1603 genomic locus, showing the CG1603 transcript (5’ and 3’UTR in black bar and four exons in white), its protein product (586 amino acids in length, and characterized by seven C2H2-ZF and two MADF domains), the CG1603PBac mutant allele (with a PiggyBac insertion in the second intron, which is marked by fluorescent DsRed driven by an eye-specific 3xP3 promoter and flanked by stop codons in all three reading frames terminating translation through downstream), and the genomic region (in square brackets, from 955 bp upstream of the CG1603 5’UTR to 656 bp downstream of CG1603 3’UTR) used for the P[CG1603gDNA] transgene. (B) Predicted 3D structure of the CG1603 protein by AlphaFold. Labels indicate the N- and C-terminus, as well as the specific protein domains along with their predicted isoelectric point (pI). (C) Images of CG1603PBac/CyO, Act-GFP, and homozygous CG1603PBac larvae cultured together at 25°C, day 4 after egg laying. Green: GFP; red: DsRed. Scale bars: 1 mm. (D) Relative mitochondrial DNA (mtDNA) levels in CG1603PBac mutant larvae to wild type (wt) control. n=3, error bar: SD. Two-tailed Student's t-test, ***: p<0.001. (E) Western blots of mitochondrial proteins in CG1603PBac mutant larvae to wt control. (F) P[CG1603gDNA] restored viability of CG1603PBac flies. The number of progenies for each genotype is listed.
-
Figure 4—source data 1
Raw data used to generate Figure 4D.
- https://cdn.elifesciences.org/articles/96536/elife-96536-fig4-data1-v1.xlsx
-
Figure 4—source data 2
PDF file containing original western blots for Figure 4E, indicating the relevant bands and treatments.
- https://cdn.elifesciences.org/articles/96536/elife-96536-fig4-data2-v1.zip
-
Figure 4—source data 3
Original files for western blot analysis displayed in Figure 4E.
- https://cdn.elifesciences.org/articles/96536/elife-96536-fig4-data3-v1.zip
Figure 4—figure supplement 1
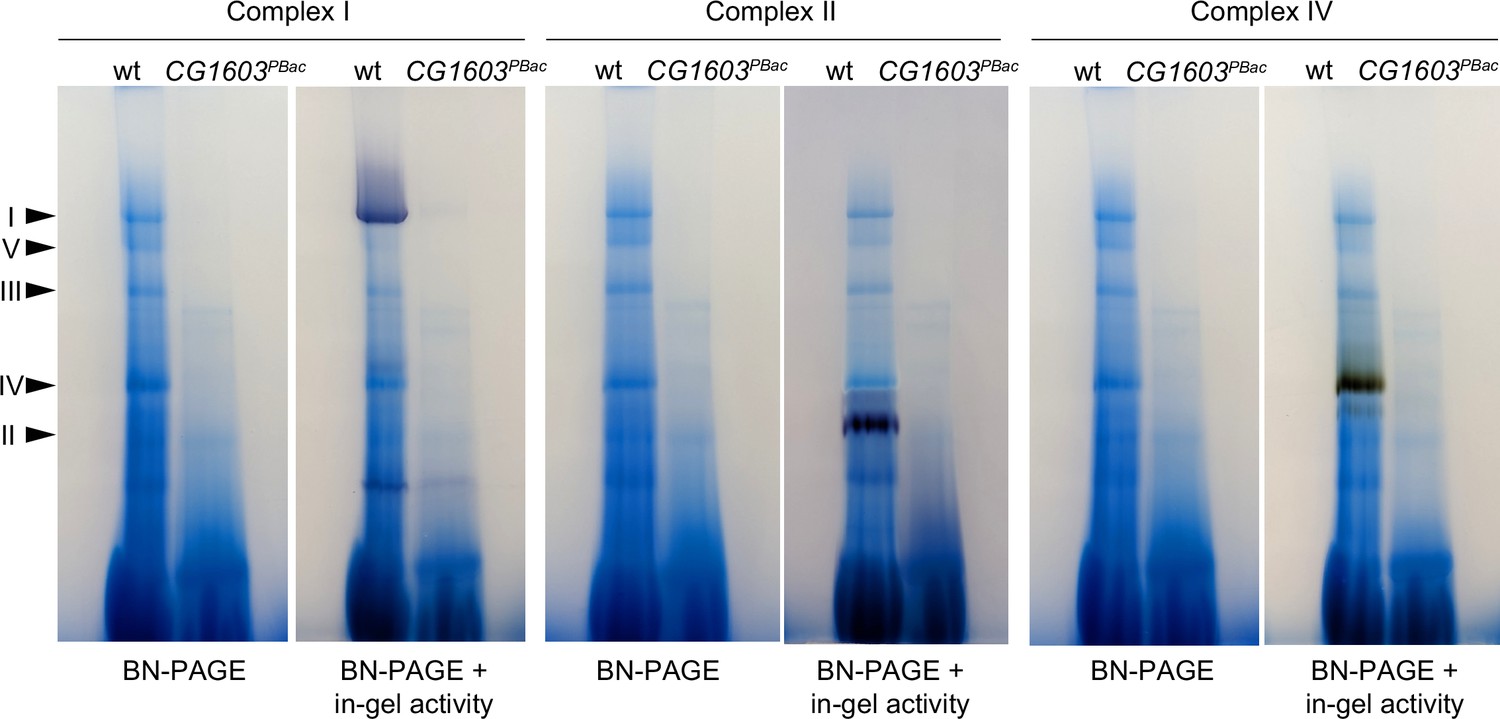
The integrities and activities of electron transport chain (ETC) complexes were reduced in CG1603PBac mutant.
Blue native PAGE and in-gel activity analyses of ETC Complex I, II, and IV isolated from wild type (wt) and CG1603PBac mutant. An equal amount of protein was used for each sample.
-
Figure 4—figure supplement 1—source data 1
PDF file containing original Blue native PAGE and in-gel activity images for Figure 4—figure supplement 1.
- https://cdn.elifesciences.org/articles/96536/elife-96536-fig4-figsupp1-data1-v1.zip
-
Figure 4—figure supplement 1—source data 2
Original files for Blue native PAGE and in-gel activity analyses displayed in Figure 4—figure supplement 1.
- https://cdn.elifesciences.org/articles/96536/elife-96536-fig4-figsupp1-data2-v1.zip
Figure 4—figure supplement 2

Adult viability phenotypes of combinations of CG1603PBac mutant, P[CG1603gDNA] transgene, and deficiency chromosomes.
(A) Summary of adult viability phenotypes of combinations of CG1603PBac mutant, P[CG1603gDNA] transgene, and deficiency chromosomes. (B) Schematic map of deficiency chromosomes spanning CG1603 genomic region.
Figure 5 with 1 supplement
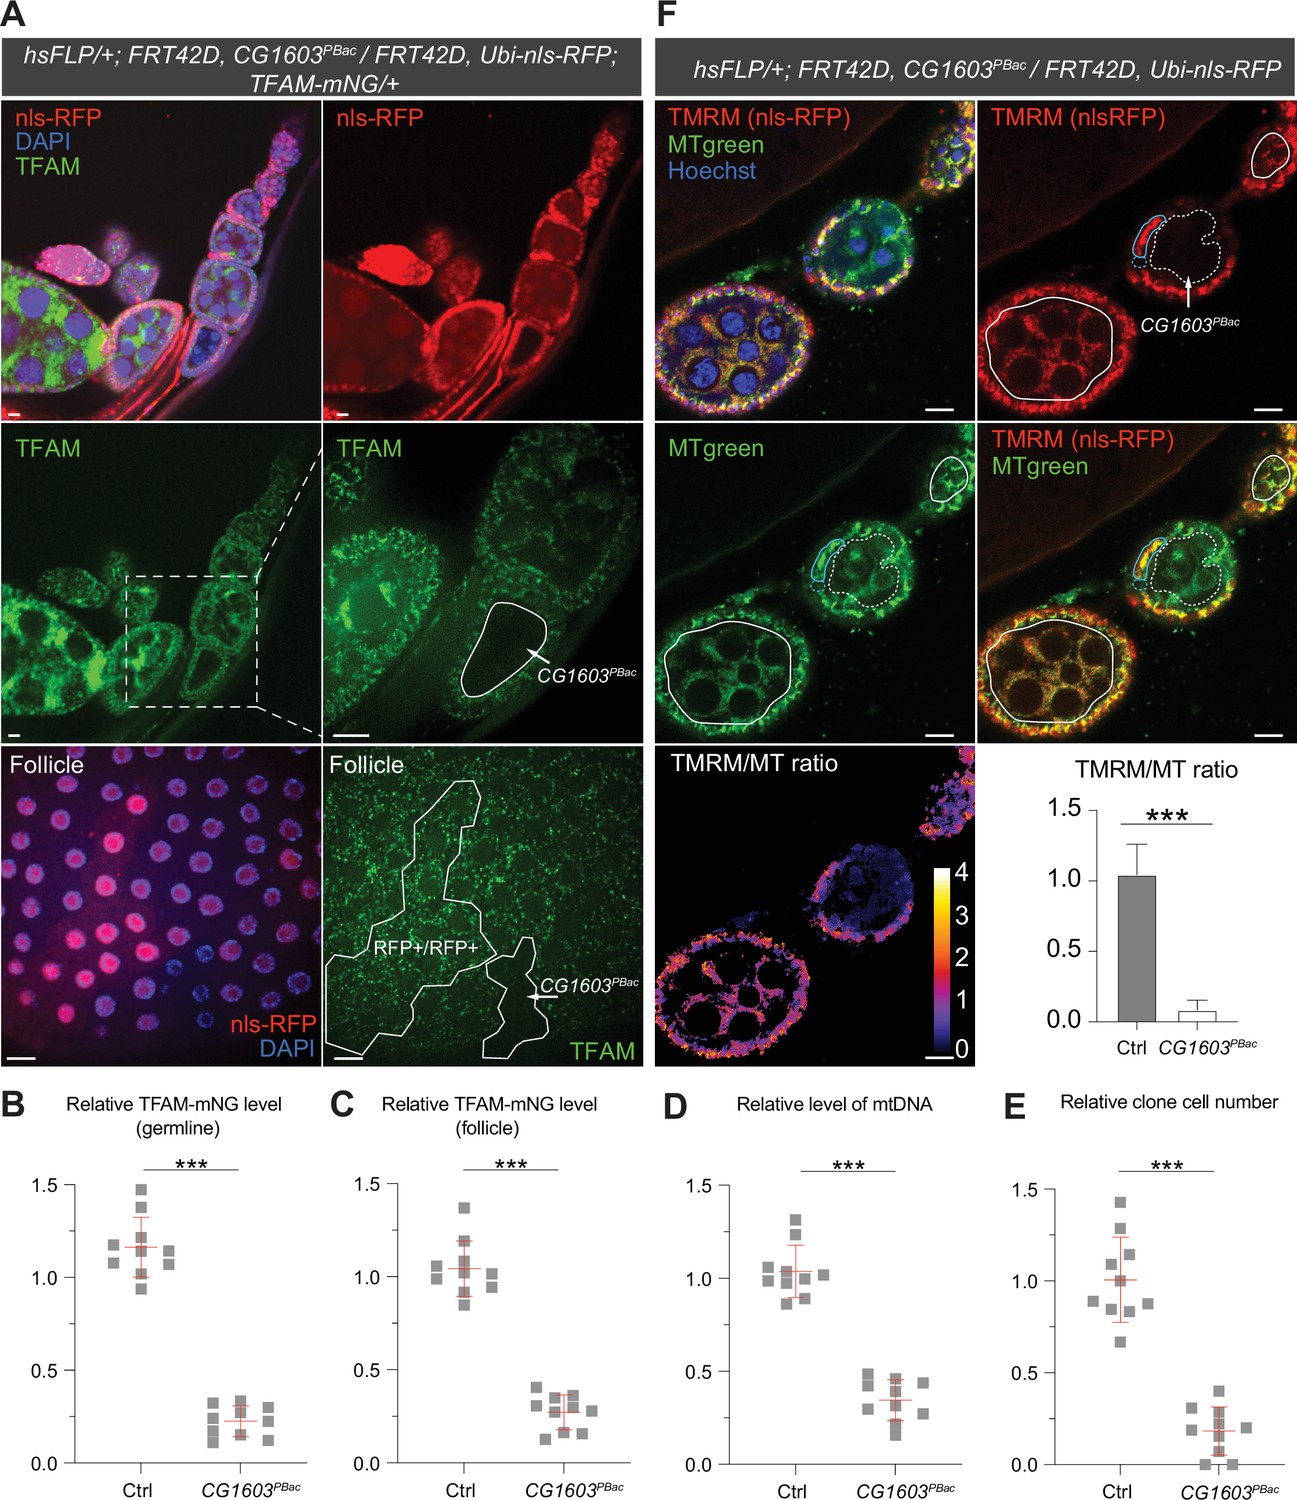
Clonal analyses confirmed CG1603’s role in mitochondrial biogenesis and activity.
(A) Representative images of CG1603PBac mutant germline (top and middle panel) and follicle (bottom panel) clones in late-stage egg chambers of adult ovaries with endogenously expressed TFAM-mNG visualized in green. Homozygous mutant clones lacked RFP and were compared with either flanking RFP-positive cysts (germline) or homozygous wild type (wt) twin (follicle). White dashed lines aided in illustrating clones. The wt (RFP+/RFP+) follicle clone showed markedly higher RFP intensity than the heterozygous (RFP+/RFP-) cells, as shown in Figure 5—figure supplement 1B. Red: nls-RFP; blue: DAPI. Scale bars: 10 μm. (B) Quantification of the relative TFAM-mNG level in the homozygous FRT42D control and CG1603PBac mutant germline clone in the early-stage egg chamber to the adjacent anterior RFP-positive cyst within the same ovariole. As shown in Figure 5—figure supplement 1A. n=10 for each group, error bar: SD. Two-tailed Student's t-test, ***: p<0.001. (C–E) Quantification of the relative TFAM-mNG level (C), the relative levels of mtDNA (D), and the relative clone cell number (E) in the homozygous FRT42D control and CG1603PBac mutant follicle clones to their wt twins. n=10 for each group, error bar: SD. Two-tailed Student's t-test, ***: p<0.001. (F) TMRM/MitoTracker Green (MT) ratiometric live imaging and quantification of ovarioles containing homozygous CG1603PBac mutant germline clones (highlighted by white dashed lines). Notably, in contrast to flanking control cysts (highlighted by white lines), Δψm was almost absent in mutant clones. Please note that compared to TMRM, nls-RFP signal was too low to be detected in ratiometric imaging. Nonetheless, the nls-RFP was readily detected in control cysts, but not in homozygous CG1603PBac clones, via visual observation, as depicted in (A), Figure 5—figure supplement 1A and B. A twin pair of follicle clones in the same egg chamber were also highlighted (cyan line for control and cyan dashed line for homozygous CG1603PBac mutant). The MT intensity was reduced in both the germline and follicle CG1603PBac clones, compared to germ cells in adjacent egg chambers and follicle cells in the same egg chamber, respectively. Quantification with background correction for MT intensity in germline clones is shown in Figure 5—figure supplement 1C. Blue: Hoechst. Scale bars: 10 µm. n=8, error bar: SD. Two-tailed Student's t-test, ***: p<0.001.
-
Figure 5—source data 1
Raw data used to generate Figure 5B–F.
- https://cdn.elifesciences.org/articles/96536/elife-96536-fig5-data1-v1.xlsx
Figure 5—figure supplement 1

Clonal analyses confirmed CG1603’s role in mitochondrial biogenesis.
(A) Representative images of homozygous FRT42D control and CG1603PBac mutant germline clones in early-stage egg chambers of adult ovaries with endogenously expressed TFAM-mNG visualized in green. Homozygous mutant clones lacked RFP and were compared to the adjacent RFP-positive cysts. Red: RFP; blue: DAPI. Scale bars: 10 μm. (B) Representative images of homozygous FRT42D control follicle cell clone (RFP-/RFP-) and its wild type (wt) twin (RFP+/RFP+) with endogenously expressed TFAM-mNG visualized in green. Red: nls-RFP; blue: DAPI. Scale bars: 10 μm. (C) The relative intensity of MitoTracker (MT) Green in CG1603PBac mutant germline clones to control (Ctrl). n=8, error bar: SD. Two-tailed Student's t-test, **: p<0.01.
-
Figure 5—figure supplement 1—source data 1
Raw data used to generate Figure 5—figure supplement 1C.
- https://cdn.elifesciences.org/articles/96536/elife-96536-fig5-figsupp1-data1-v1.xlsx
Figure 6
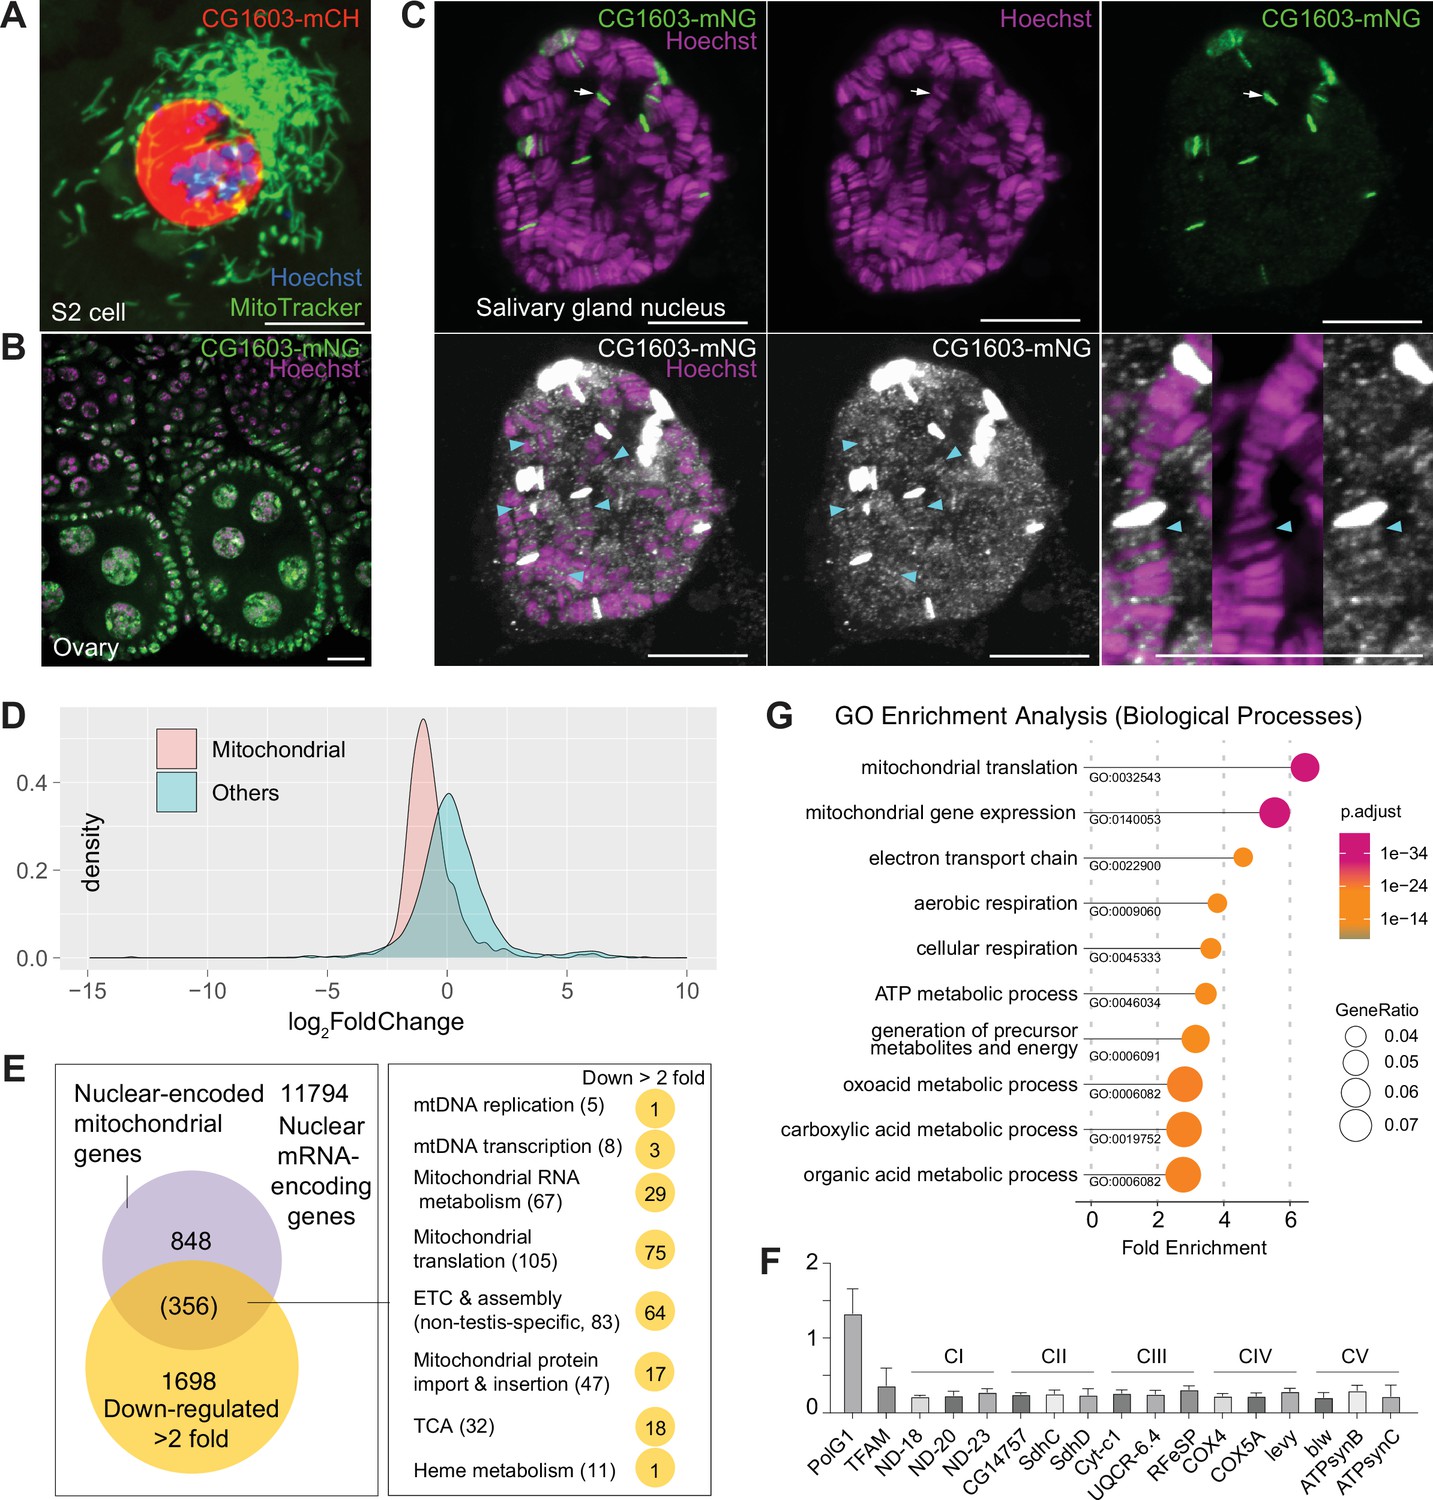
CG1603 localizes in the nucleus and is essential for regulating nuclear mitochondrial gene expression.
(A–B) Representative images showing the nuclear localization of CG1603 protein in cultured S2 cells (A) and adult ovary (B). Green: MitoTracker Green in S2 cell, and CG1603-mNG in tissues; red: CG1603-mCH; blue and magenta: Hoechst. Scale bars: 10 μm. (C) Representative images showing bindings of endogenously expressed CG1603 proteins to less condensed euchromatin regions in the polytene chromosomes of a salivary gland. High-intensity CG1603-mNG bands were visualized in green in the upper panel and indicated by arrows, and low-intensity bands were pesudo-colored in white in theblower panel and indicated by arrow heads. The images of the lower panel were same as these in the upper panel, but digitally enhanced. Magenta: Hoechst. Scale bars: 10 μm. (D) Density plot illustrating the distribution of expression changes of the nuclear-encoded mitochondrial and non-mitochondrial genes in CG1603PBac mutant. (E) Graph illustrating the overlap between nuclear-encoded mitochondrial genes and differentially expressed genes (DEGs) that down-regulated >2-fold, as well as the distribution of the overlapped genes in different mitochondrial function categories. (F) Relative mRNA levels of several electron transport chain (ETC) biogenesis-related genes in CG1603PBac mutant larvae to control, measured by real-time PCR. n=3, error bar: SD. (G) Gene Ontology (GO) enrichment analyses of DEGs that down-regulated >2-fold. The top 10 enriched biological processes are shown.
-
Figure 6—source data 1
Raw data used to generate Figure 6D, F, and G.
- https://cdn.elifesciences.org/articles/96536/elife-96536-fig6-data1-v1.xlsx
Figure 7
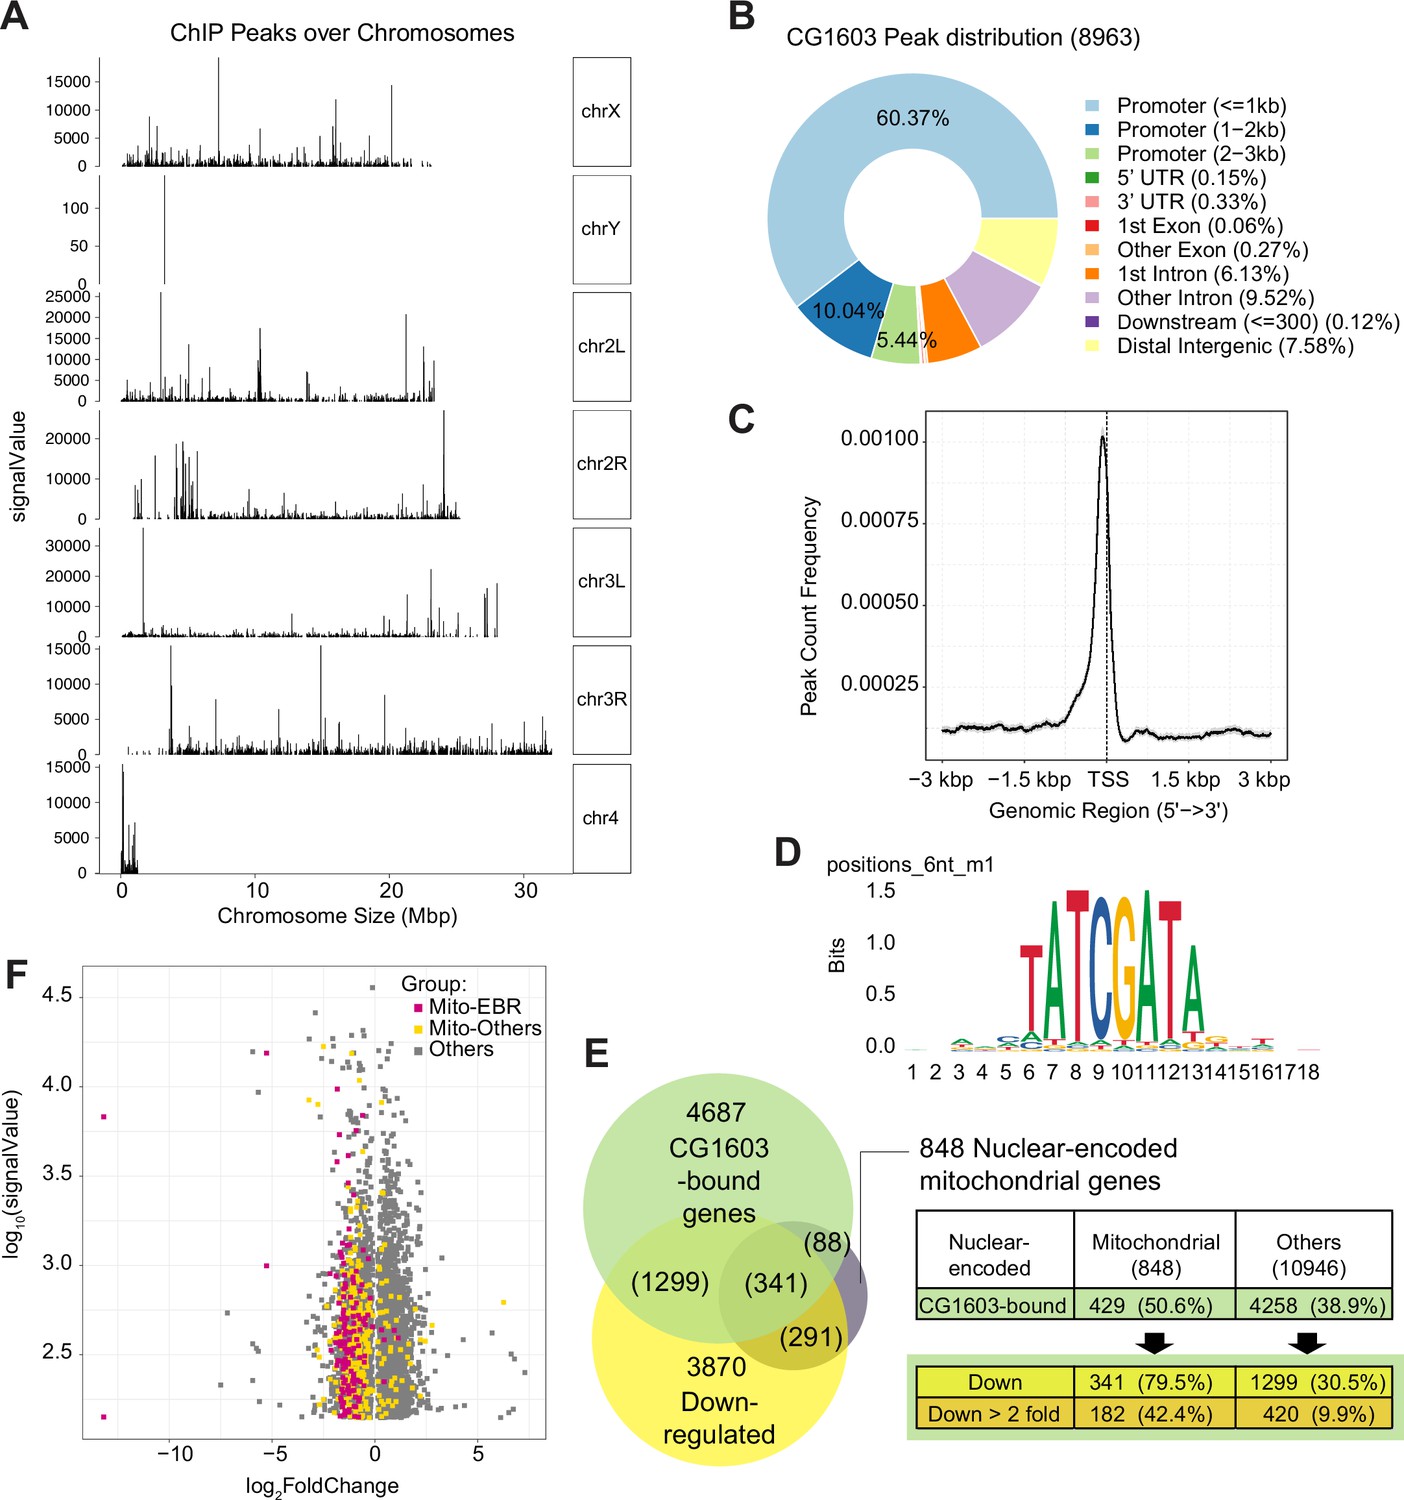
ChIP analysis identified nuclear mitochondrial genes that may be directly regulated by CG1603.
(A) CG1603 ChIP peaks over all chromosomes. (B) Genomic distribution of CG1603 peaks. (C) Average profile of CG1603 peaks binding to transcription start site (TSS) regions. (D) Representative binding motif discovered with CG1603 ChIP peaks. (E) The number of nuclear-encoded mitochondrial and non-mitochondrial genes bound by CG1603, and the overlapping down-regulated differentially expressed genes (DEGs) in each group. (F) Scatterplot illustrating the signalValue of CG1603 ChIP peaks (y-axis) and log2 fold change in expression of DEGs between CG1603PBac mutant and control (x-axis). Mito-EBR: genes related to electron transport chain (ETC) biogenesis and maintenance, including ETC subunits and assembly factors, mitochondrial DNA (mtDNA) replication and transcription, mitochondrial RNA metabolism and translation, as well as mitochondrial protein import and membrane insertion machinery.
-
Figure 7—source data 1
Raw data used to generate Figure 7A–D and F.
- https://cdn.elifesciences.org/articles/96536/elife-96536-fig7-data1-v1.xlsx
Figure 8 with 2 supplements
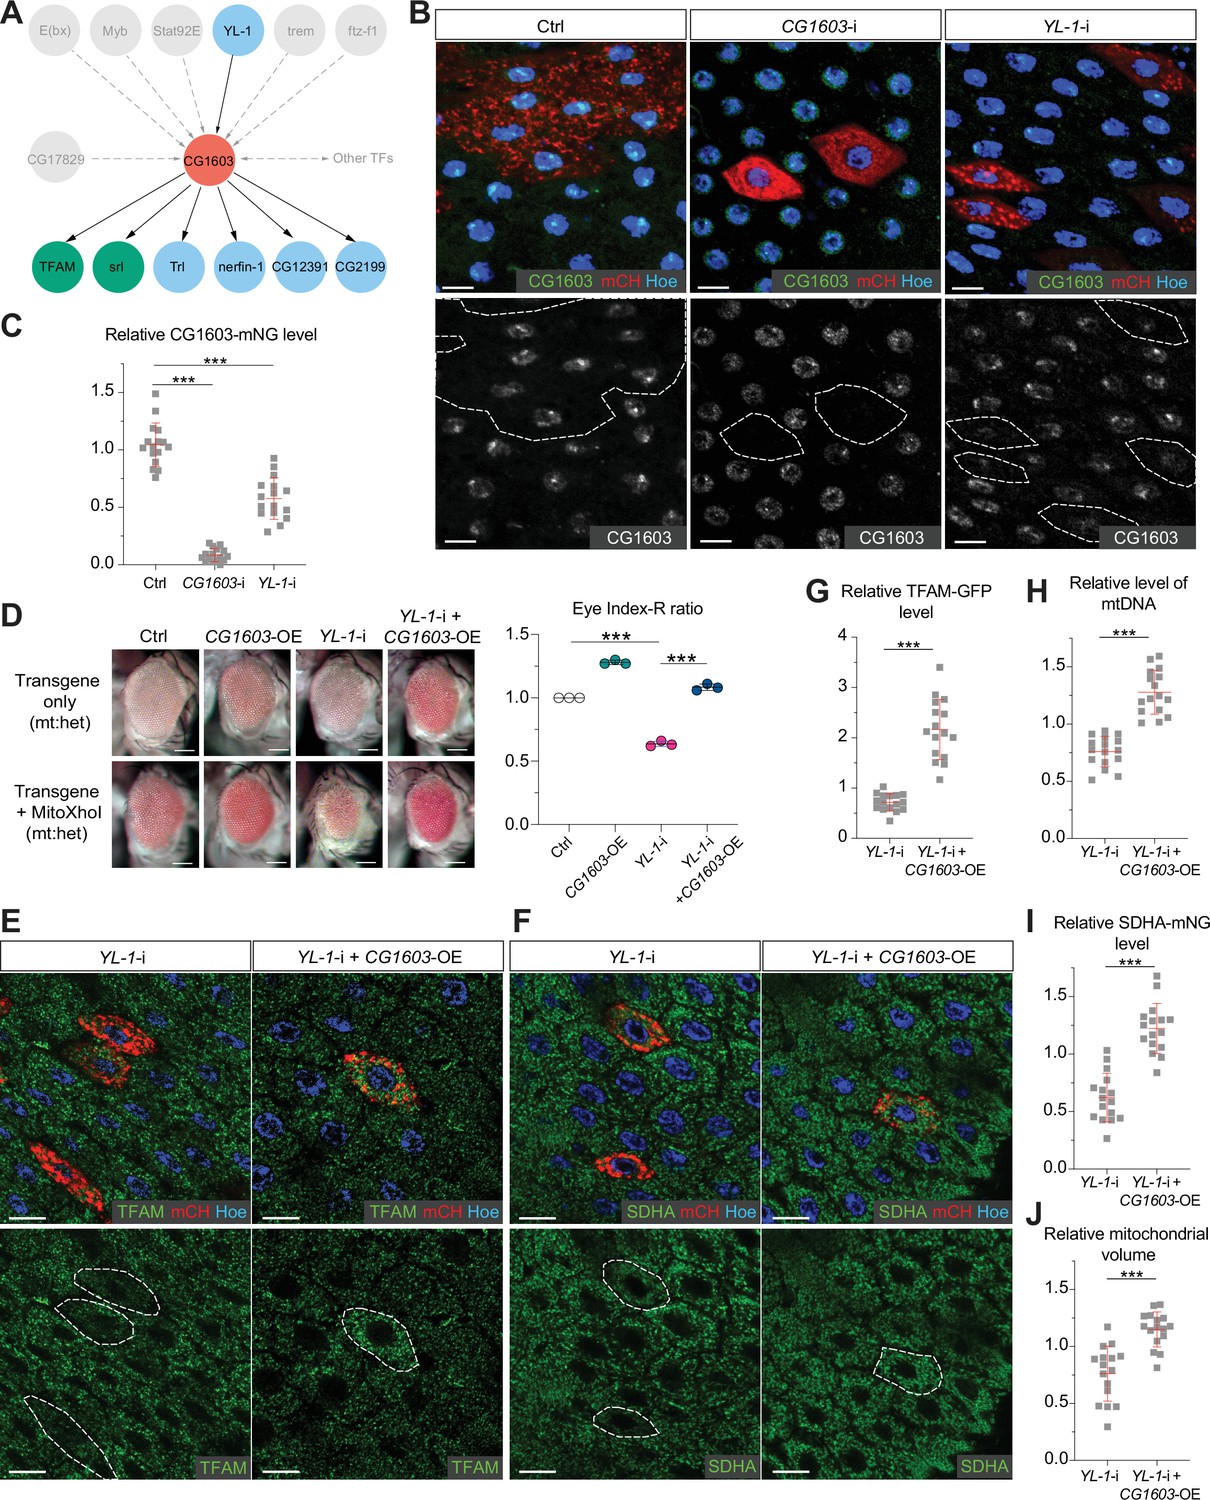
YL-1 is an upstream regulator of CG1603.
(A) Schematic graph illustrating the CG1603 upstream and downstream (co-)TFs (transcription factors) involved in regulating mitochondrial electron transport chain (ETC) biogenesis, inferred from ChIP-seq, RNA-seq, and genetics data. (B) Representative images of control RNAi (Ctrl), CG1603 RNAi (CG1603-i), and YL-1 RNAi (YL-1-i) midgut enterocytes (EC) clones with endogenously expressed CG1603-mNG visualized in green or white. Clones were labeled by mCherry red and compared with wild type (wt) neighbors. White dashed lines aided in illustrating clones. Blue: Hoechst. Scale bars: 10 μm. (C) Quantification of the relative CG1603-mNG level in the EC clones to their wt neighbors. n=16 from 8 midguts for each group, error bar: SD. Two-tailed Student's t-test, ***: p<0.001. (D) Representative eye image and Index-R ratio (RNAi+mitoXhoI/RNAi-only) of adult flies with indicated genotypes. Three biological repeats were performed for each group, error bar: SD. Two-tailed Student's t-test, ***: p<0.001. Scale bars: 100 µm. (E–F) Representative images of YL-1 RNAi (YL-1-i) and YL-1 RNAi+CG1603 overexpression (YL-1-i+CG1603 OE) midgut EC clones with endogenously expressed TFAM-GFP (E) or SDHA-mNG (F) visualized in green. Clones were labeled by mCherry red and compared with wt neighbors. Blue: Hoechst. Scale bars: 10 µm. (G–J) Quantification of the relative TFAM-GFP level (G), the relative levels of mtDNA (H), the relative SDHA-mNG level (I), and the relative mitochondrial volume (J) in the EC clones to their wt neighbors. n=16 from 8 midguts for each group, error bar: SD. Two-tailed Student's t-test, ***: p<0.001.
-
Figure 8—source data 1
Raw data used to generate Figure 8C, D, and G–J.
- https://cdn.elifesciences.org/articles/96536/elife-96536-fig8-data1-v1.xlsx
Figure 8—figure supplement 1
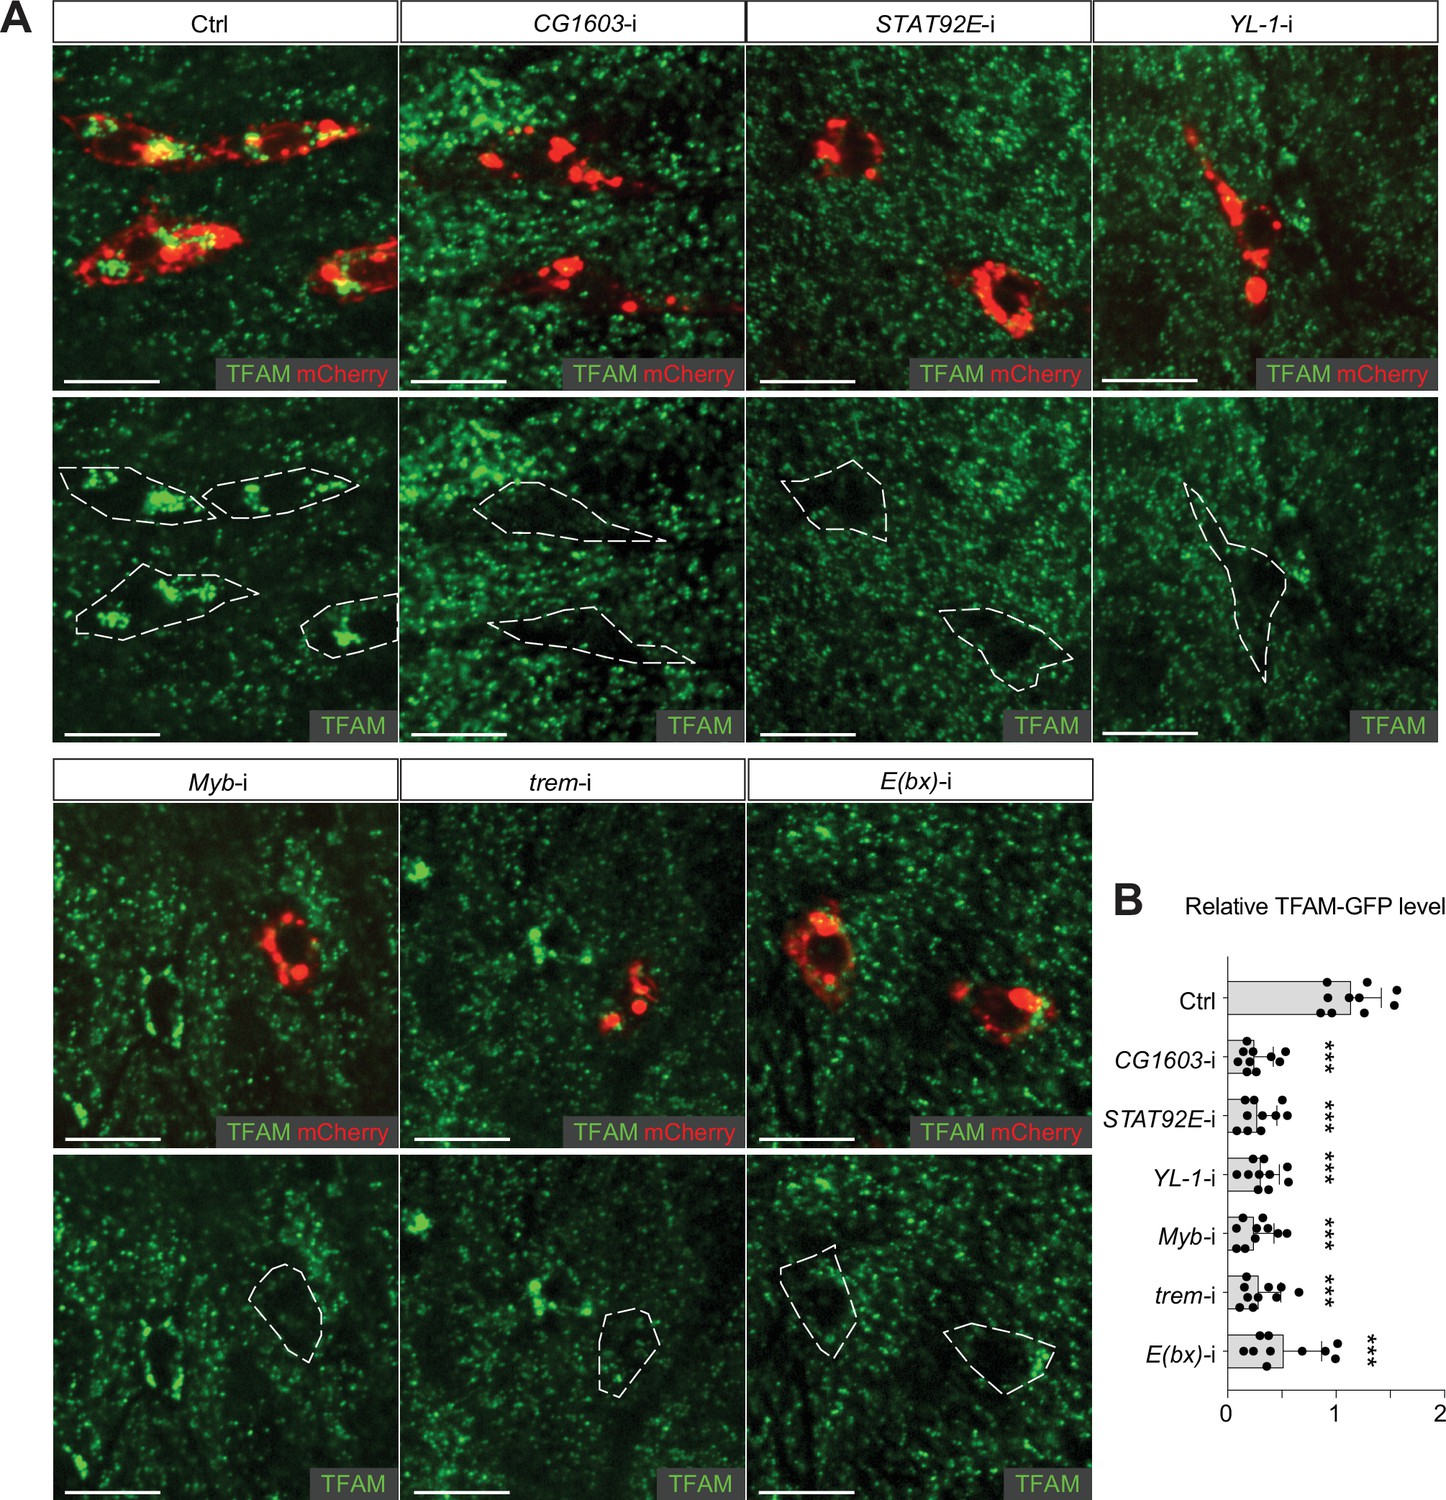
TFAM levels in the RNAi midgut clones of transcription factors (TFs) upstream of CG1603 in the network.
(A) Representative images of control RNAi (Ctrl), CG1603 RNAi (CG1603-i), STAT92E RNAi (STAT92E-i), YL-1 RNAi (YL-1-i), Myb RNAi (Myb -i), trem RNAi (trem-i), and E(bx) RNAi (E(bx)-i) midgut ISC/EB clones labeled by mCherry red, with endogenously expressed TFAM-GFP visualized in green. White dashed lines aided in illustrating clones. Scale bars: 10 µm. (B) Quantification of the relative TFAM-GFP level in midgut ISC/EB clones to their wt neighbors for different groups. n=10, error bar: SD. Two-tailed Student's t-test, ***: p<0.001.
-
Figure 8—figure supplement 1—source data 1
Raw data used to generate Figure 8—figure supplement 1B.
- https://cdn.elifesciences.org/articles/96536/elife-96536-fig8-figsupp1-data1-v1.xlsx
Figure 8—figure supplement 2

Overexpression of CG1603 restored the reduced mitochondrial DNA (mtDNA) level caused by YL-1 RNAi in the eye discs.
Relative mtDNA levels in eye discs of different RNAi groups. n=3, error bar: SD. Two-tailed Student's t-test, *: p<0.05, ***: p<0.001.
-
Figure 8—figure supplement 2—source data 1
Raw data used to generate Figure 8—figure supplement 2.
- https://cdn.elifesciences.org/articles/96536/elife-96536-fig8-figsupp2-data1-v1.xlsx
Tables
Key resources table
| Reagent type (species) or resource | Designation | Source or reference | Identifiers | Additional information |
|---|---|---|---|---|
| Gene (Drosophila melanogaster) | CG1603 | GenBank | FLYB:FBgn0033185 | |
| Genetic reagent (D. melanogaster) | w1118 | Bloomington Drosophila Stock Center | BDSC: 3605; RRID:BDSC_3605 | |
| Genetic reagent (D. melanogaster) | Heteroplasmic Sco/CyO, UAS-mitoXhoI; eyeless-GAL4 | This paper | See Materials and methods, Section Fly genetics | |
| Genetic reagent (D. melanogaster) | RNAi stains used for genetic screen | Bloomington Drosophila Stock Center; Vienna Drosophila Resource Center | See ‘ID’, ‘SYMBOL’, and ‘Stock #’ column in Supplementary file 1 | Stock # begins with ‘v’ is from VDRC, otherwise BDSC |
| Genetic reagent (D. melanogaster) | UAS-Luciferase | Bloomington Drosophila Stock Center | BDSC:35788 | |
| Genetic reagent (D. melanogaster) | TFAM‐GFP | PMID:27053724 | ||
| Genetic reagent (D. melanogaster) | hsFLP | Bloomington Drosophila Stock Center | BDSC:7 | |
| Genetic reagent (D. melanogaster) | Act >CD2>GAL4, UAS-mCD8::mCherry | This paper | See Materials and methods, Section Fly genetics | |
| Genetic reagent (D. melanogaster) | PBac[SAstopDsRed]LL06826 | Kyoto Drosophila Stock Center | Kyoto:141919 | |
| Genetic reagent (D. melanogaster) | CyO, act-GFP | Bloomington Drosophila Stock Center | BDSC:4533 | |
| Genetic reagent (D. melanogaster) | FRT42D | Bloomington Drosophila Stock Center | BDSC:1802 | |
| Genetic reagent (D. melanogaster) | FRT42D, Ubi-nls-RFP | Bloomington Drosophila Stock Center | BDSC:35496 | |
| Genetic reagent (D. melanogaster) | Defk08815 | Bloomington Drosophila Stock Center | BDSC:10818 | |
| Genetic reagent (D. melanogaster) | DefExel6052 | Bloomington Drosophila Stock Center | BDSC:7534 | |
| Genetic reagent (D. melanogaster) | DefExel6053 | Bloomington Drosophila Stock Center | BDSC:7535 | |
| Genetic reagent (D. melanogaster) | UASz-CG1603 | This paper | See Materials and methods, Section Transgenic flies | |
| Genetic reagent (D. melanogaster) | P[CG1603gDNA] | This paper | See Materials and methods, Section Transgenic flies | |
| Genetic reagent (D. melanogaster) | SDHA-mNeonGreen | This paper | See Materials and methods, Section Transgenic flies | |
| Genetic reagent (D. melanogaster) | TFAM-mNeonGreen | This paper | See Materials and methods, Section Transgenic flies | |
| Genetic reagent (D. melanogaster) | CG1603-Halo-mNeonGreen | This paper | See Materials and methods, Section Transgenic flies | |
| Cell line (D. melanogaster) | S2 | Drosophila Genomics Resource Center | FLYB:FBtc0000181; RRID:CVCL_Z992 | |
| Antibody | Anti-Actin (Mouse monoclonal) | MilliporeSigma | Cat# MAB1501; RRID:AB_2223041 | WB (1:1000) |
| Antibody | Anti-ATP5A (Mouse monoclonal) | abcam | Cat# 15H4C4; RRID:AB_301447 | WB (1:2000) |
| Antibody | Anti-ND30 (Mouse monoclonal) | abcam | Cat# 17D95; | WB (1:1000) |
| Antibody | Anti-TFAM (Rabbit polyclonal) | PMID:35449456 | WB (1:1000) | |
| Antibody | Anti-HSP60 (Rabbit polyclonal) | Cell Signaling | Cat# 4870; RRID:AB_2295614 | WB (1:1000) |
| Antibody | Anti-rabbit IgG, HRP-linked (Goat polyclonal) | Cell Signaling | Cat# 7074; RRID:AB_2099233 | WB (1:2000) |
| Antibody | Anti-mouse IgG, HRP-linked (Horse polyclonal) | Cell Signaling | Cat# 7076; RRID:AB_330924 | WB (1:2000) |
| Recombinant DNA reagent | pIB-CG1603-mCherry (plasmid) | This paper | See Materials and methods, Section Cell culture and gene expression | |
| Recombinant DNA reagent | pIB/V5-His (plasmid) | Thermo Fisher Scientific | Cat# V802001 | |
| Sequence-based reagent | Primers for real-time PCR | This paper | Listed in Supplementary file 8 | |
| Commercial assay or kit | Effectene Transfection Reagent | QIAGEN | Cat# 301425 | |
| Commercial assay or kit | NativePAGE Sample Prep Kit | Thermo Fisher Scientific | Cat# BN2008 | |
| Commercial assay or kit | Pierce BCA Protein Assay Kit | Thermo Fisher Scientific | Cat# 23225 | |
| Commercial assay or kit | NativePAGE Running Buffer Kit | Thermo Fisher Scientific | Cat# BN2007 | |
| Commercial assay or kit | DNeasy Blood & Tissue Kit | QIAGEN | Cat# 69504 | |
| Commercial assay or kit | RNeasy Mini Kit | QIAGEN | Cat# 74104 | |
| Commercial assay or kit | SuperScript VILO cDNA Synthesis Kit | Thermo Fisher Scientific | Cat# 11754050 | |
| Commercial assay or kit | PowerTrack SYBR Green Master Mix | Thermo Fisher Scientific | Cat# A46012 | |
| Chemical compound, drug | TRIzol | Thermo Fisher Scientific | Cat# 15596026 | |
| Chemical compound, drug | DAPI | Thermo Fisher Scientific | Cat# D1306 | |
| Chemical compound, drug | Hoechst 33342 | Thermo Fisher Scientific | Cat# H1399 | |
| Chemical compound, drug | TMRM | Thermo Fisher Scientific | Cat# I34361 | |
| Chemical compound, drug | MitoTracker Green | Thermo Fisher Scientific | Cat# M7514 | |
| Software, algorithm | Imaris | Oxford Instruments | See Materials and methods, Section Imaging analyses | |
| Software, algorithm | Fiji/ImageJ | NIH | See Materials and methods, Section Imaging analyses | |
| Software, algorithm | FastQC | Babraham Bioinformatics | See Materials and methods, Section RNA-seq analysis | |
| Software, algorithm | STAR | PMID:23104886 | See Materials and methods, Section RNA-seq analysis | |
| Software, algorithm | HTseq | PMID:35311944 | See Materials and methods, Section RNA-seq analysis | |
| Software, algorithm | DESeq2 | PMID:25516281 | See Materials and methods, Section RNA-seq analysis | |
| Software, algorithm | clusterProfiler | PMID:22455463 | See Materials and methods, Section RNA-seq analysis | |
| Software, algorithm | BWA | PMID:19451168 | See Materials and methods, Section ChIP-seq computational analysis | |
| Software, algorithm | Samtools | PMID:19505943 | See Materials and methods, Section ChIP-seq computational analysis | |
| Software, algorithm | MACS2 | PMID:18798982 | See Materials and methods, Section ChIP-seq computational analysis | |
| Software, algorithm | ChIPseeker | PMID:25765347 | See Materials and methods, Section ChIP-seq computational analysis | |
| Software, algorithm | VertexSort | PMID:19690563 | See Materials and methods, Section ChIP-seq computational analysis | |
| Software, algorithm | RSAT | PMID:22836136 | See Materials and methods, Section ChIP-seq computational analysis | |
| Software, algorithm | SMART | PMID:10592234 | See Materials and methods, Section Prediction of protein domains, isoelectric point, net charge, and structure | |
| Software, algorithm | AlphaFold | PMID:34265844 | See Materials and methods, Section Prediction of protein domains, isoelectric point, net charge, and structure |
Additional files
-
Supplementary file 1
List of all genes assessed in the eye screen, including gene IDs, symbols, group information, representative RNAi lines, and the Index-R of the ‘RNAi-only’ and ‘RNAi+mitoXhoI’ flies under the same heteroplasmic-mitochondrial DNAs (mtDNAs) background.
- https://cdn.elifesciences.org/articles/96536/elife-96536-supp1-v1.zip
-
Supplementary file 2
Vertices, edges, and vertex.sort analysis information of the potential transcriptional regulatory network of nuclear-encoded mitochondrial genes.
- https://cdn.elifesciences.org/articles/96536/elife-96536-supp2-v1.zip
-
Supplementary file 3
Gene binding profiles of 49 synergistic enhancer transcription factors (TFs), including TF-target matrix, TF binding profile summary, and list of nuclear-encoded mitochondrial genes with subgroup information as well as the counts of 49 TFs binding to each promoter.
- https://cdn.elifesciences.org/articles/96536/elife-96536-supp3-v1.zip
-
Supplementary file 4
List of nuclear-encoded mitochondrial genes with symbols, IDs, subgroup information, and RNA-seq status.
- https://cdn.elifesciences.org/articles/96536/elife-96536-supp4-v1.zip
-
Supplementary file 5
Differentially expressed nuclear-encoded genes in CG1603 PBac mutant flies.
(a) List of differentially expressed nuclear-encoded genes in CG1603 PBac mutant flies compared to controls. (b) Summary of nuclear-encoded electron transport chain (ETC) genes that down-regulated more than twofold in CG1603PBac mutant.
- https://cdn.elifesciences.org/articles/96536/elife-96536-supp5-v1.zip
-
Supplementary file 6
List of CG1603 peaks from modERN (model organism Encyclopedia of Regulatory Networks) ChIP-seq data, including gene annotation, group information, combined with RNA-seq analysis result of CG1603 PBac mutant flies.
- https://cdn.elifesciences.org/articles/96536/elife-96536-supp6-v1.zip
-
Supplementary file 7
CG1603 binding motifs discovered by RSAT peak-motifs.
- https://cdn.elifesciences.org/articles/96536/elife-96536-supp7-v1.zip
-
Supplementary file 8
Primer sequences for quantitative real-time PCR.
- https://cdn.elifesciences.org/articles/96536/elife-96536-supp8-v1.zip
-
MDAR checklist
- https://cdn.elifesciences.org/articles/96536/elife-96536-mdarchecklist1-v1.docx
Download links
A two-part list of links to download the article, or parts of the article, in various formats.
Downloads (link to download the article as PDF)
Open citations (links to open the citations from this article in various online reference manager services)
Cite this article (links to download the citations from this article in formats compatible with various reference manager tools)
A transcription network underlies the dual genomic coordination of mitochondrial biogenesis
eLife 13:RP96536.
https://doi.org/10.7554/eLife.96536.3


