Expression of most retrotransposons in human blood correlates with biological aging
- Comprehensive Cancer Centre, School of Cancer & Pharmaceutical Sciences, Faculty of Life Sciences & Medicine, King's College London, United Kingdom
- MRC LMS, Imperial College London, United Kingdom
Figures
Figure 1 with 1 supplement
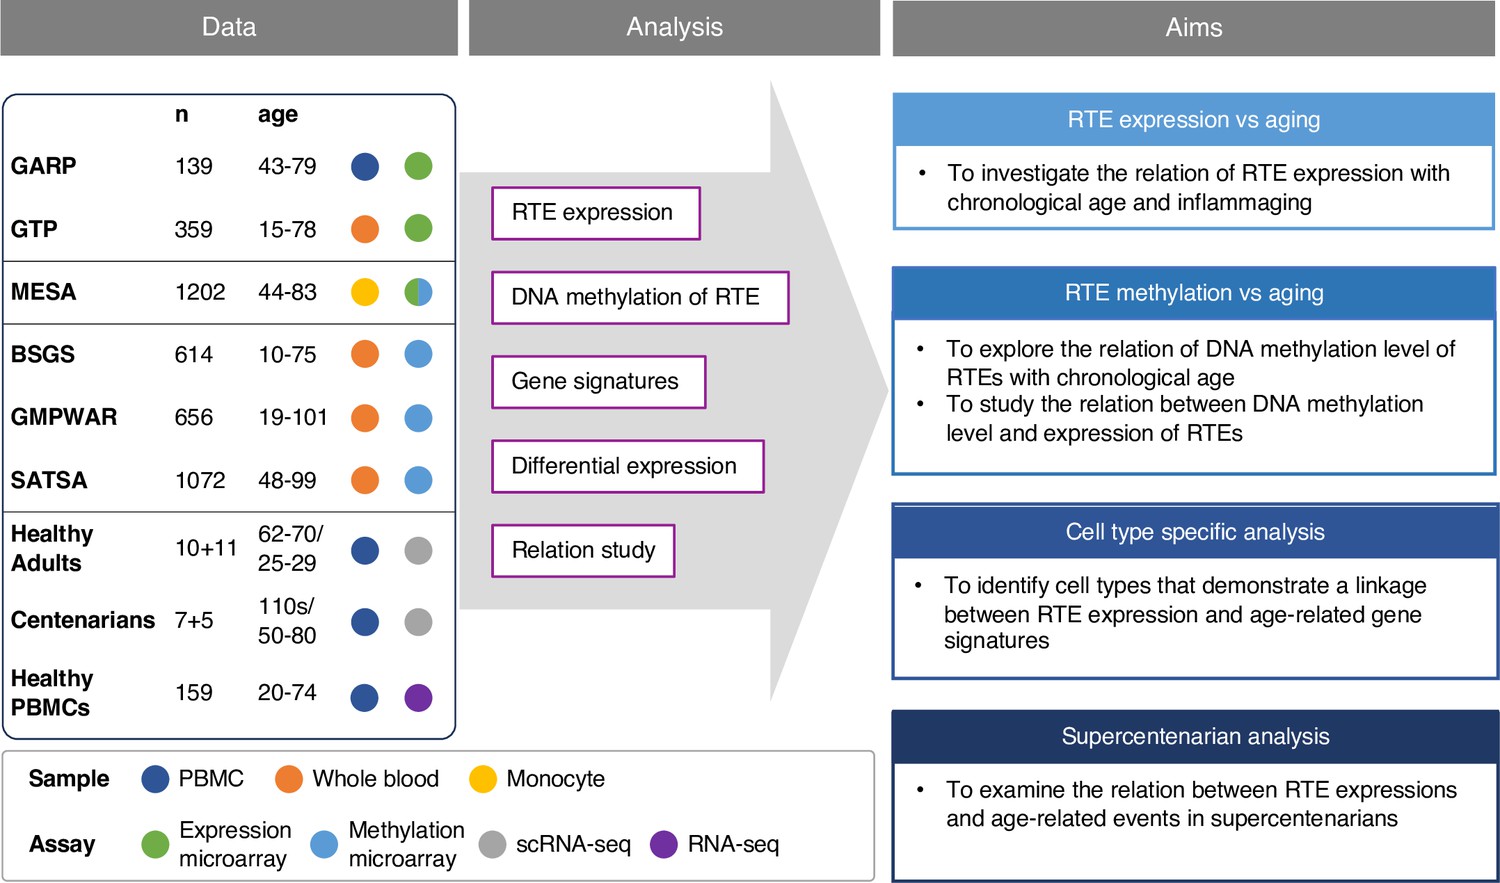
Conceptual framework and the study design.
We collected published datasets of human blood samples for gene expression, DNA methylation, and single-cell transcriptomic data. The analysis aimed to study the relation between the expression and DNA methylation of retrotransposons (RTEs) versus chronological and biological aging in large human cohorts. The single-cell transcriptomic datasets were employed for cell type-specific analysis of RTEs in peripheral blood mononuclear cell (PBMC) to identify the relation between RTE expression and aging events for annotated cell types within old versus young PBMC samples.
Figure 1—figure supplement 1
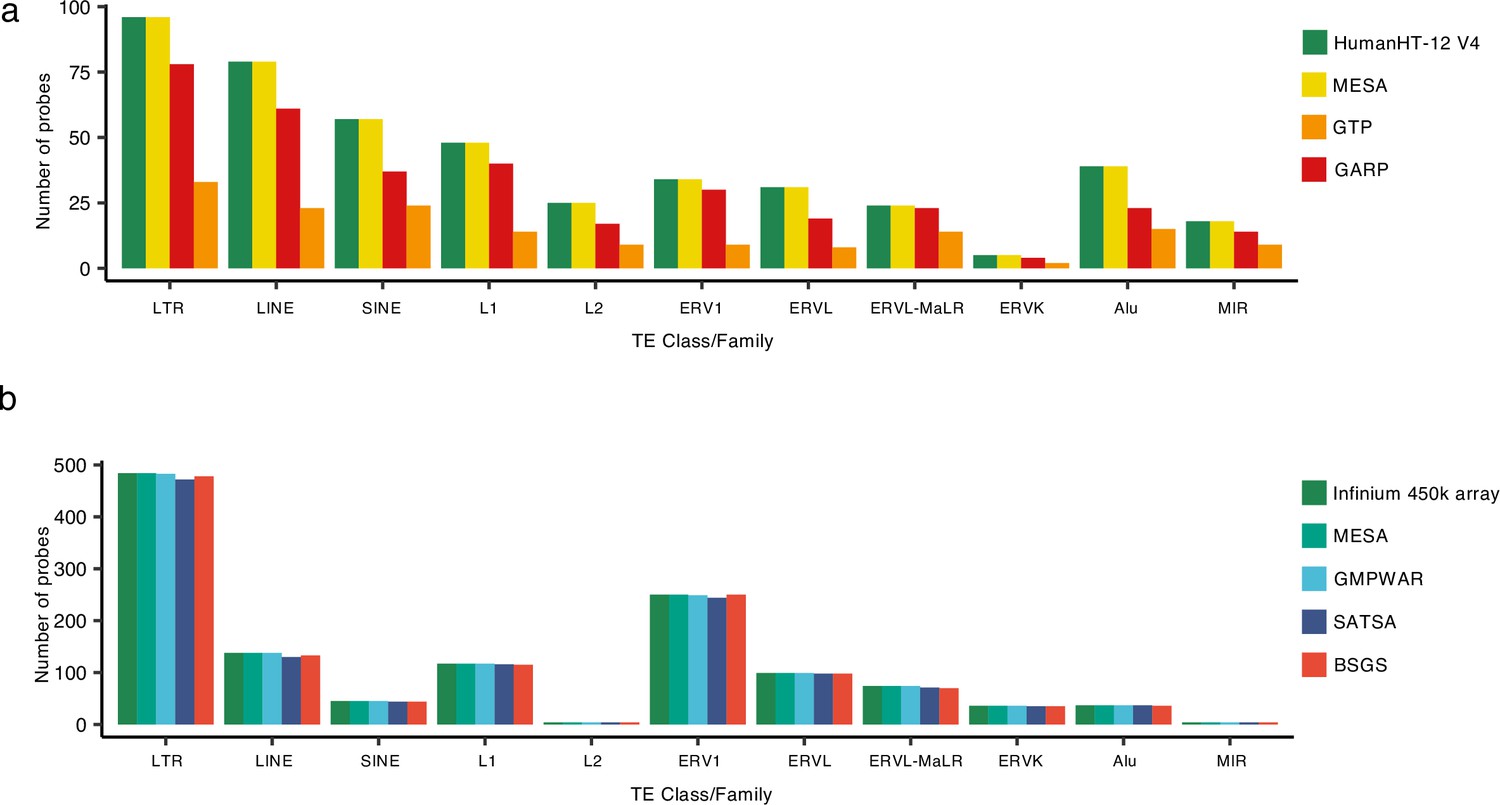
Number of retrotransposon (RTE)-covering probes.
(a), The number of microarray probes covering RTE regions in multi-ethnic study of atherosclerosis (MESA), Grady Trauma Project (GTP), and GARP compared to the total number of RTE probes available in Illumina HumanHT-12 V4. (b), The number of microarray probes covering RTE regions in MESA, GMPWAR, SATSA, and BSGS compared to the total number of RTE probes available in Illumina Infinium 450 k array.
Figure 2 with 8 supplements
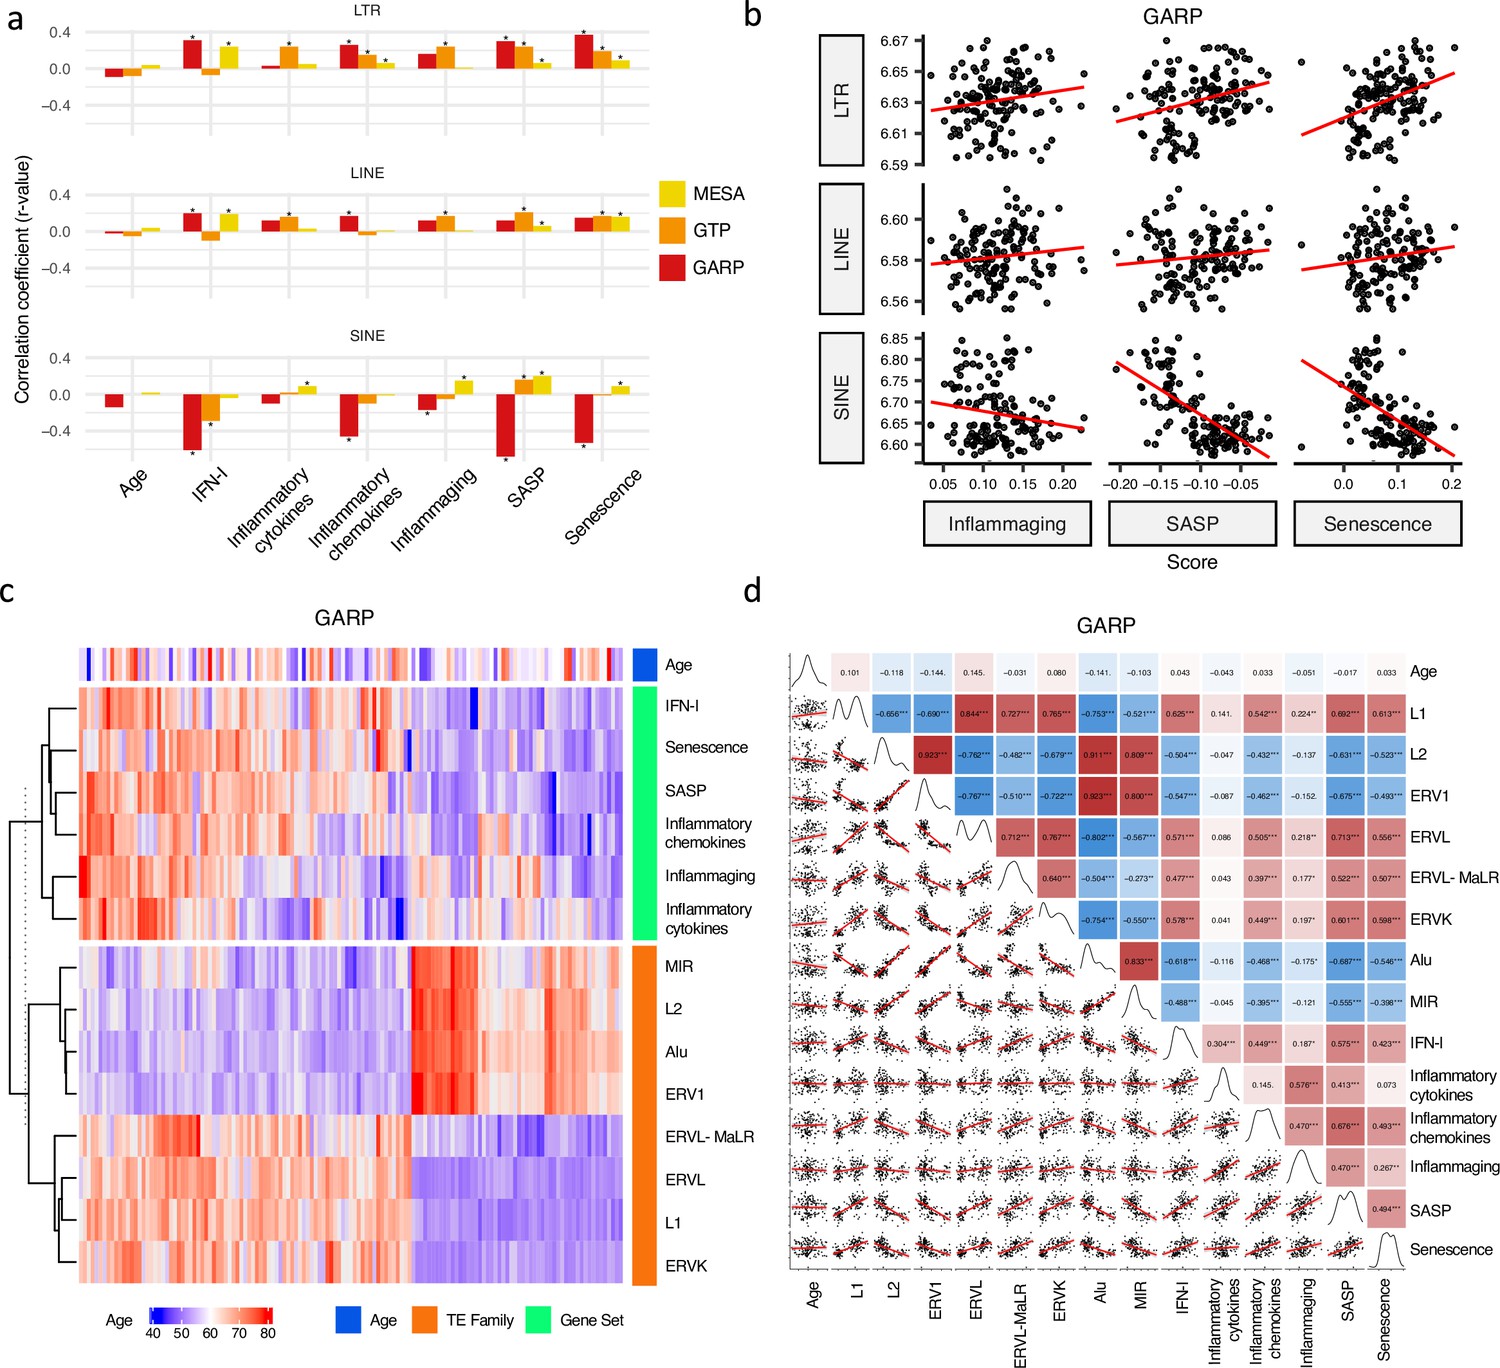
Correlation analysis between retrotransposon (RTE) expression, chronological age, and age-associated gene signature scores.
(a) No correlation between RTE expression and chronological age versus positive correlations between biological age-related (BAR) gene signature scores and LINE and long terminal repeat (LTR) expressions. Pair-wise correlation coefficients were calculated between the expression of different RTE classes (LTR, LINE, and SINE) and chronological age and six BAR gene signature scores in monocytes (Multi-Ethnic Study of Atherosclerosis, MESA), peripheral blood mononuclear cells (PBMCs) (GARP), and the whole blood (WB) (GTP). (b), Scatter plots displaying a positive correlation between LINE and LTR expressions and inflammaging, senescence associated secretory phenotype (SASP), and senescence gene signature scores in PBMCs. (c), Different families of RTEs were divided into two major groups based on their correlation and inverse correlation with BAR gene signature scores in PBMC samples. (d), Correlation matrix depicting all pair-wise combinations to identify the correlation between chronological age, RTE family expressions, and six age-associated signature scores in PBMCs. **p≤0.01, ***p≤0.001, Pearson’s correlation. MESA, n=1202; GARP, n=139; GTP, n=359.
Figure 2—figure supplement 1

Correlation analysis between biological age-related (BAR) gene signatures and retrotransposon (RTE) family expressions in human cohorts.
(a), Weak correlation between a few RTE families and chronological age and strong positive correlation between L1, ERVL, ERVK, and MaLR with BAR signature scores in peripheral blood mononuclear cell (PBMC) samples (GARP cohort). (b, c), Correlation matrix depicting all pair-wise combinations to identify the correlation between chronological age, RTE family expressions, and six age-associated gene expressions in monocytes (Multi-Ethnic Study of Atherosclerosis, MESA) and the whole blood (WB) (GTP). *p≤0.05, **p≤0.01, ***p≤0.001, ****p≤0.0001, Pearson’s correlation.
Figure 2—figure supplement 2
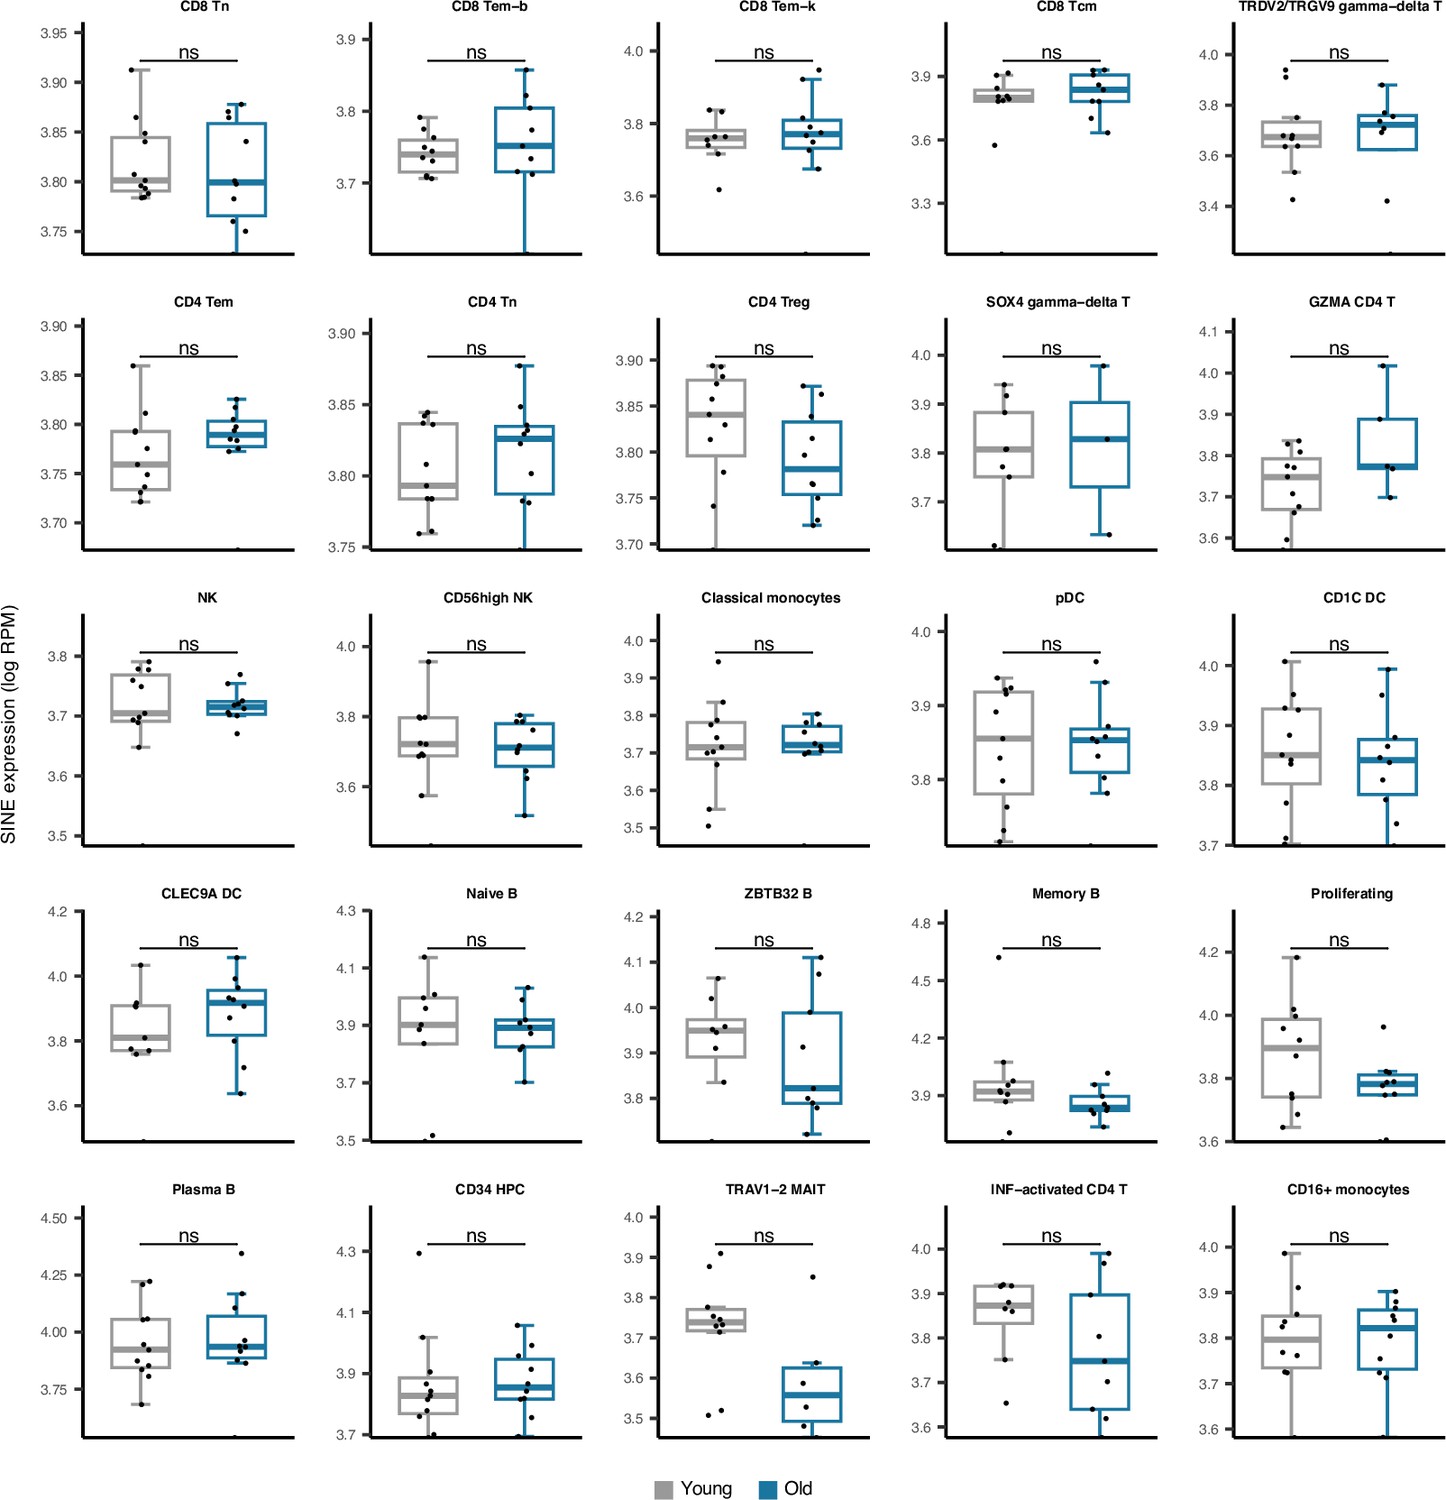
Comparing SINE expression in 25 cell types obtained from young versus old peripheral blood mononuclear cell (PBMC) human samples.
No significant difference was observed in any cell type. The young group comprises healthy male donors aged 25–29, n=11; the old groups are healthy male donors aged 62–70, n=10; Wilcoxon test; ns: not significant.
Figure 2—figure supplement 3
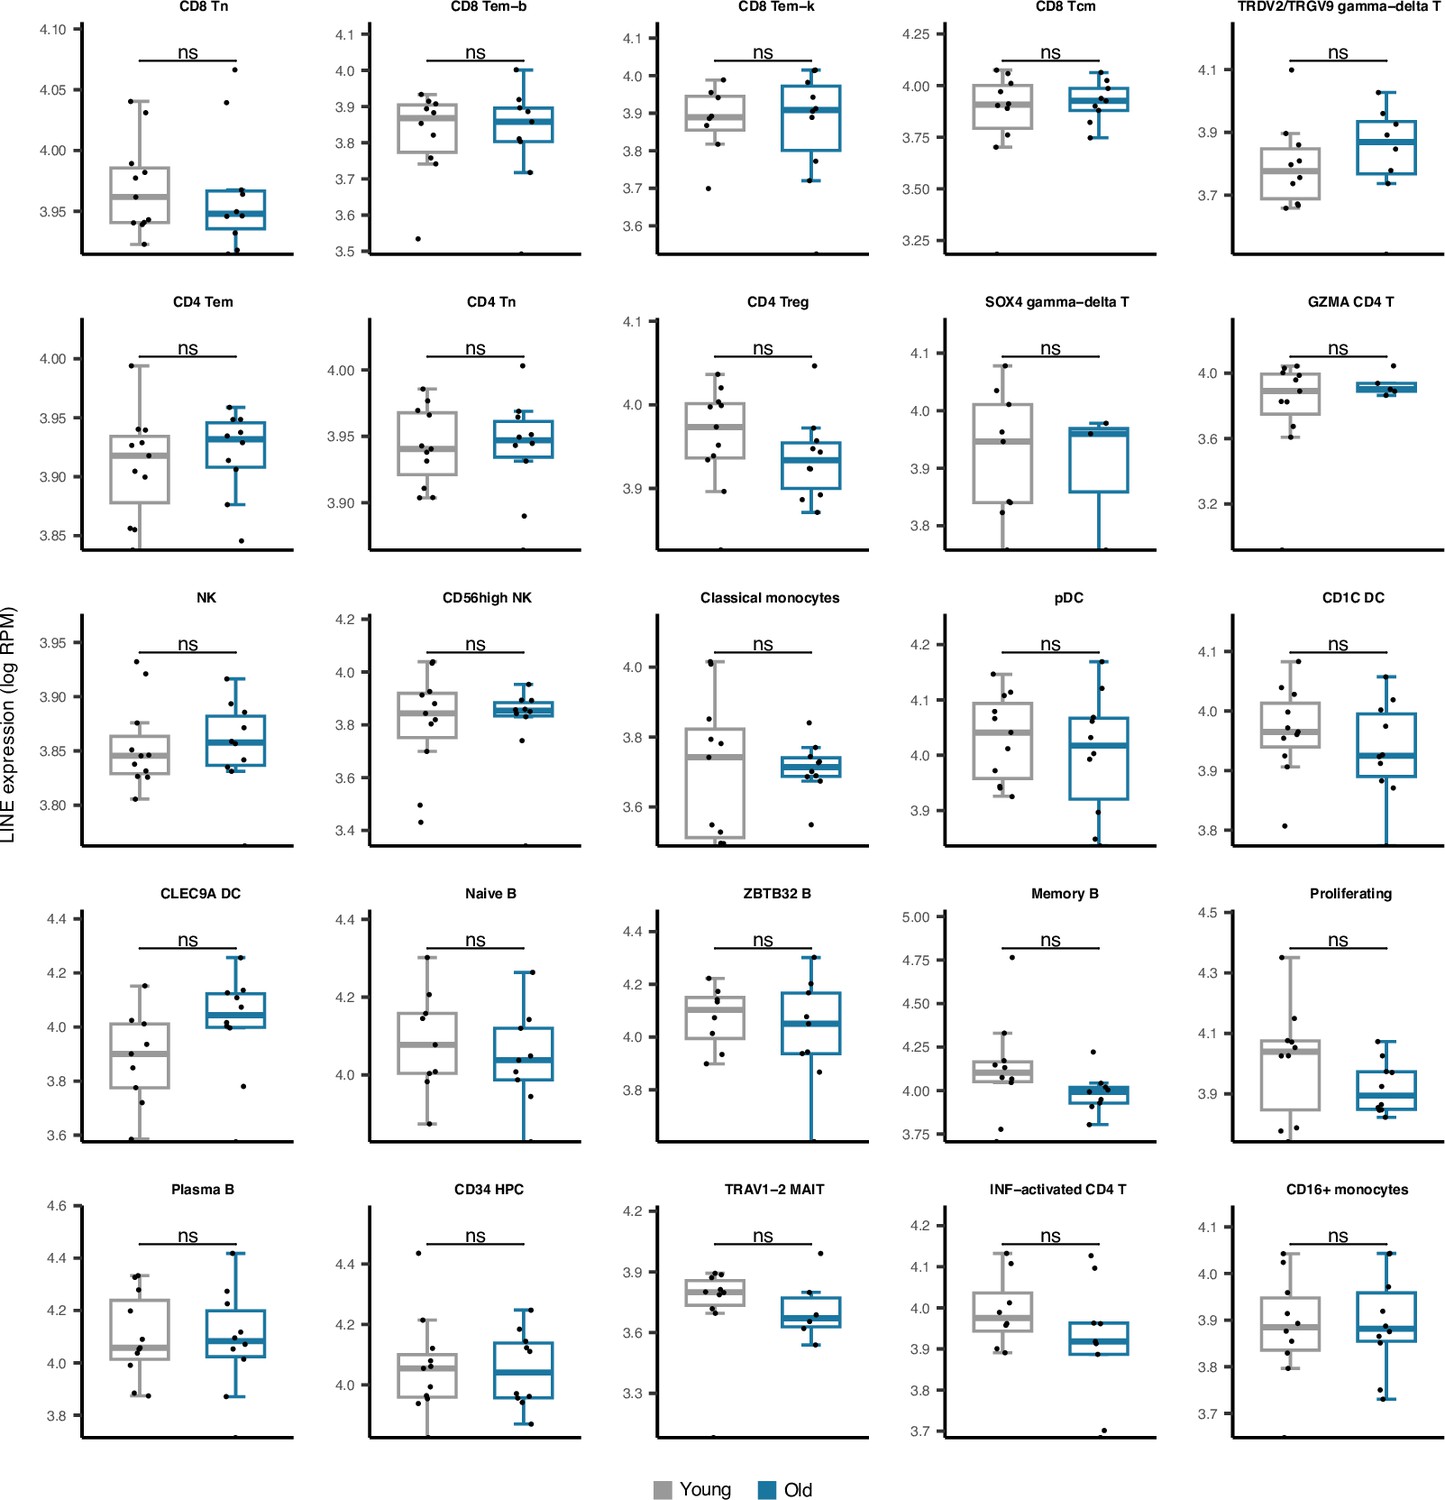
Comparing LINE expression in 25 cell types obtained from young versus old peripheral blood mononuclear cell (PBMC) human samples.
No significant difference was observed in any cell type. The young group comprises healthy male donors aged 25–29, n=11; the old groups are healthy male donors aged 62–70, n=10—Wilcoxon test; ns: not significant.
Figure 2—figure supplement 4
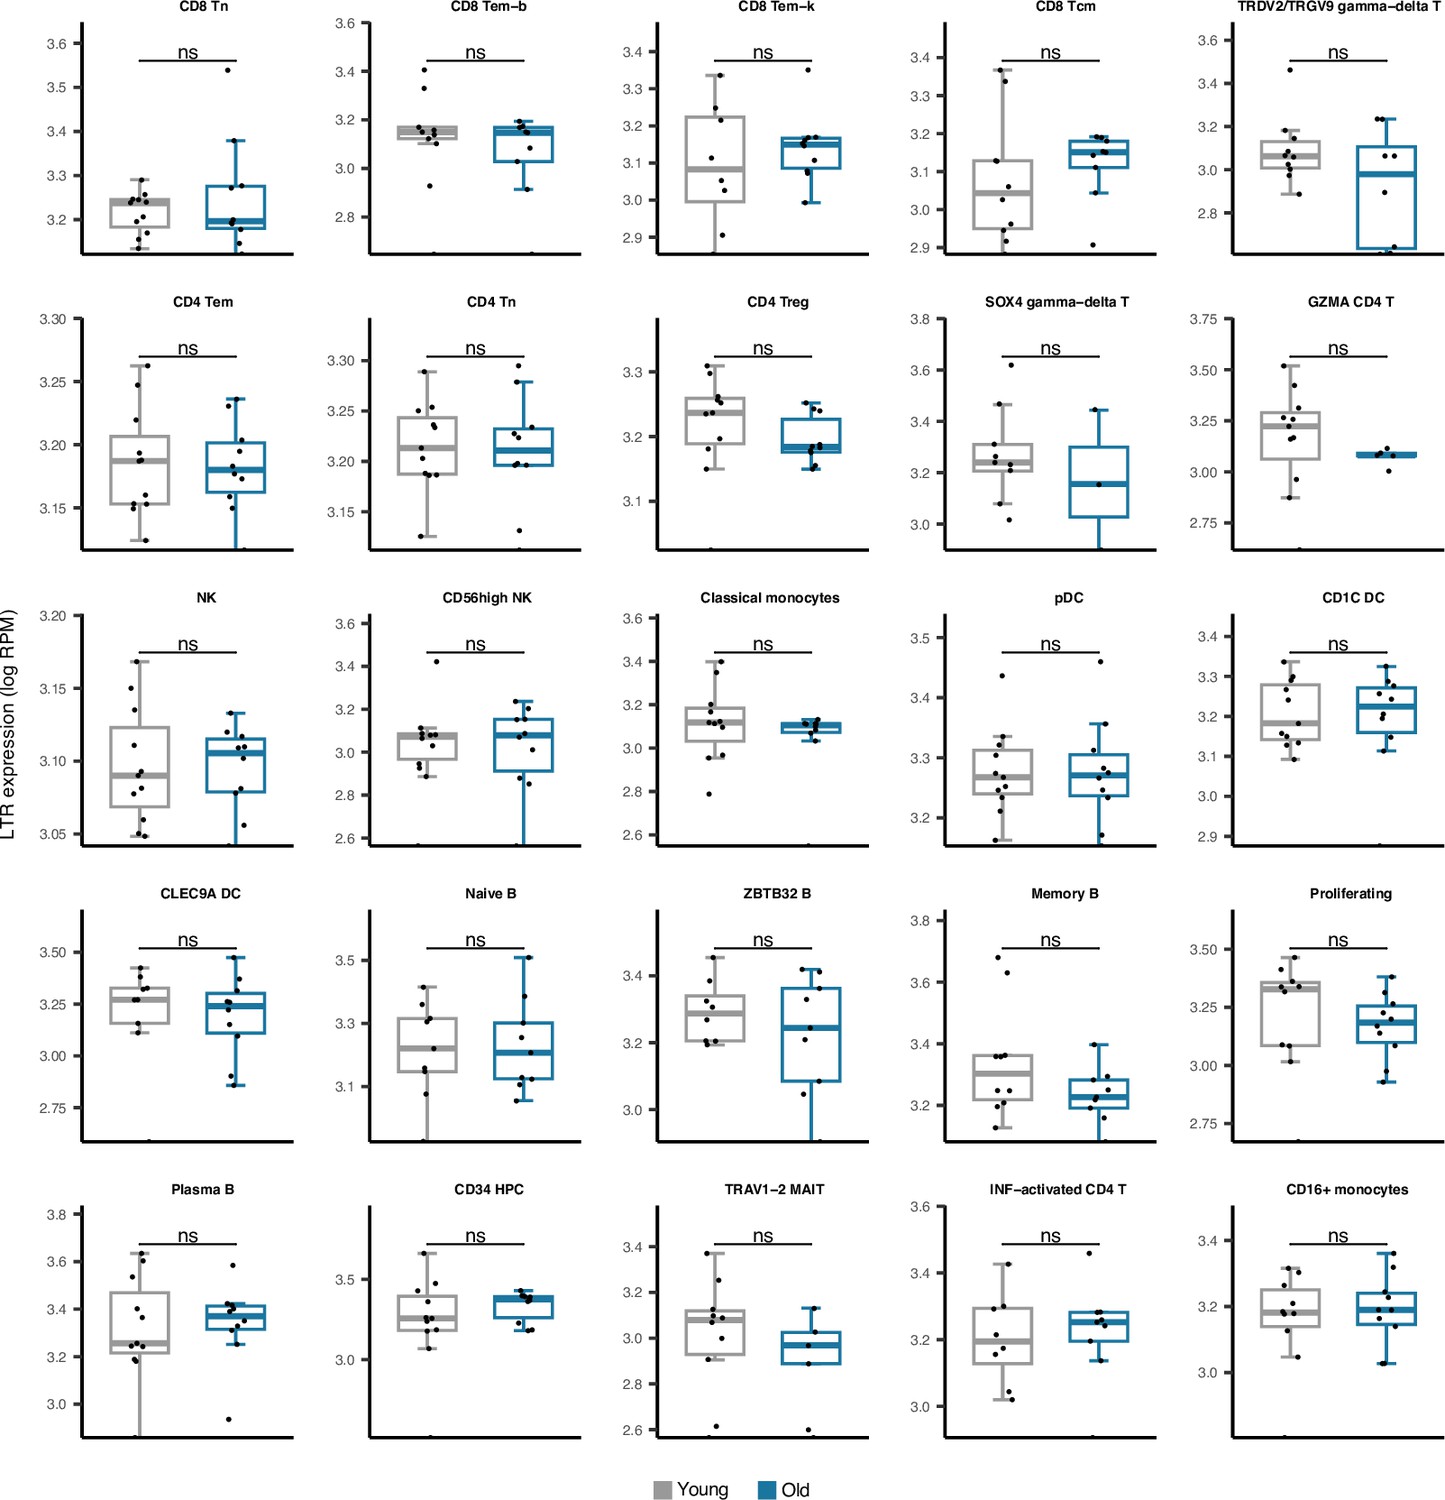
Comparing long terminal repeats (LTR) expressions in 25 cell types obtained from young versus old peripheral blood mononuclear cell (PBMC) human samples.
No significant difference was observed in any cell type. The young group comprises healthy male donors aged 25–29, n=11; the old groups are healthy male donors aged 62–70, n=10—Wilcoxon test; ns: not significant.
Figure 2—figure supplement 5
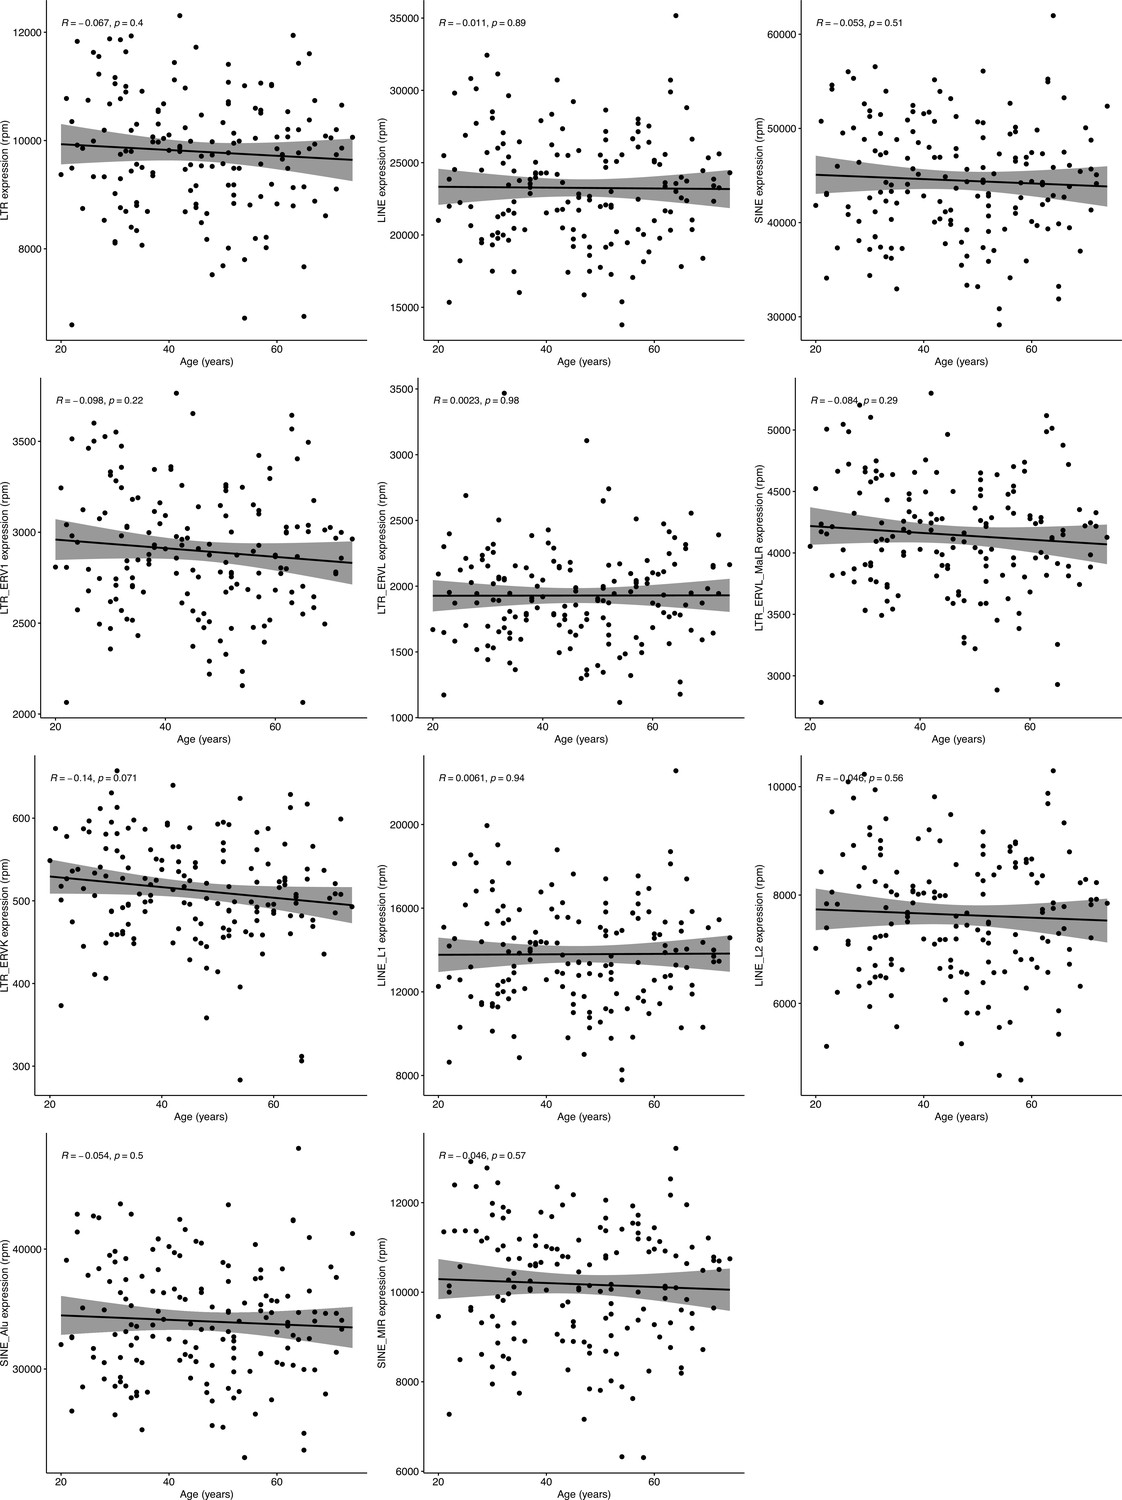
Correlation analysis of retrotransposon (RTE) expression and chronological age in RNA-seq data of healthy human peripheral blood mononuclear cell (PBMC) samples.
No correlation was observed between chronological age and expression of RTE classes or families. Blood samples were acquired from healthy donors of 117 males and 42 females aged 20–74 years. n=159—Pearson’s correlation.
Figure 2—figure supplement 6
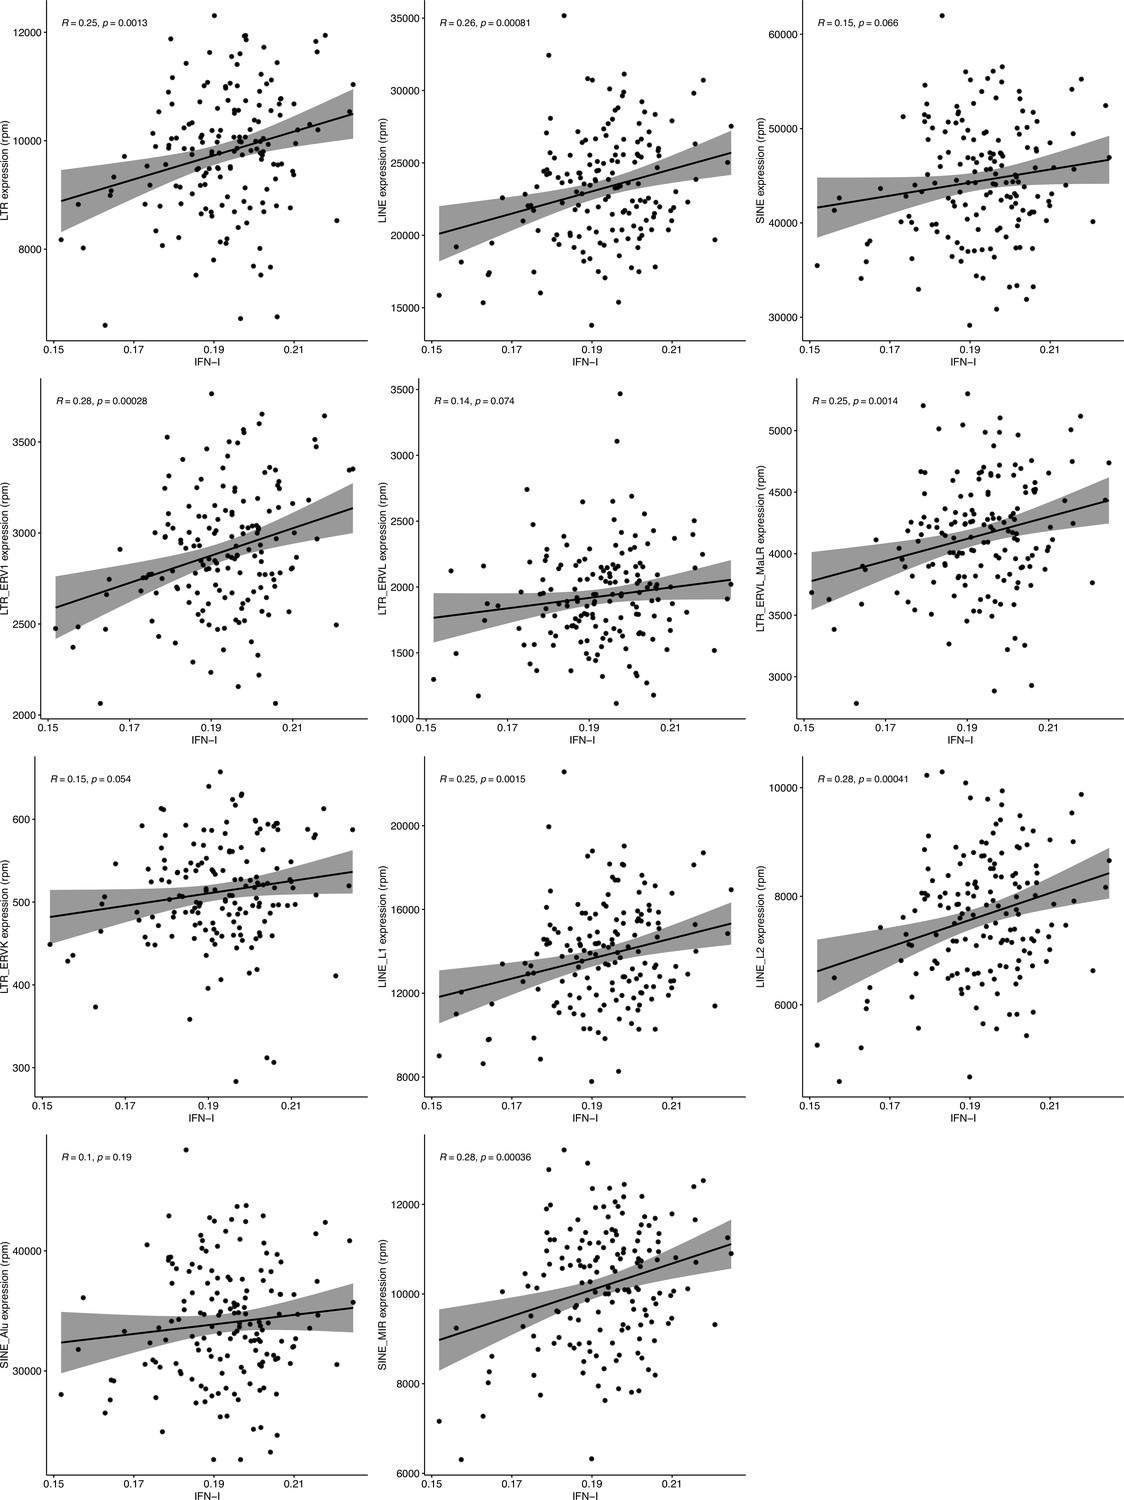
Correlation analysis of retrotransposon (RTE) expression and type I interferon (IFN-I) score in RNA-seq data of healthy human peripheral blood mononuclear cell (PBMC) samples.
Despite having a significant correlation between the IFN-I signature score and expression of LINE and long terminal repeats (LTR) classes and most of their families (p-value <0.01), such correlation did not exist between the IFN-I score and SINE class and Alu family. Blood samples were acquired from healthy donors of 117 males and 42 females aged 20–74 years. n=159—Pearson’s correlation.
Figure 2—figure supplement 7
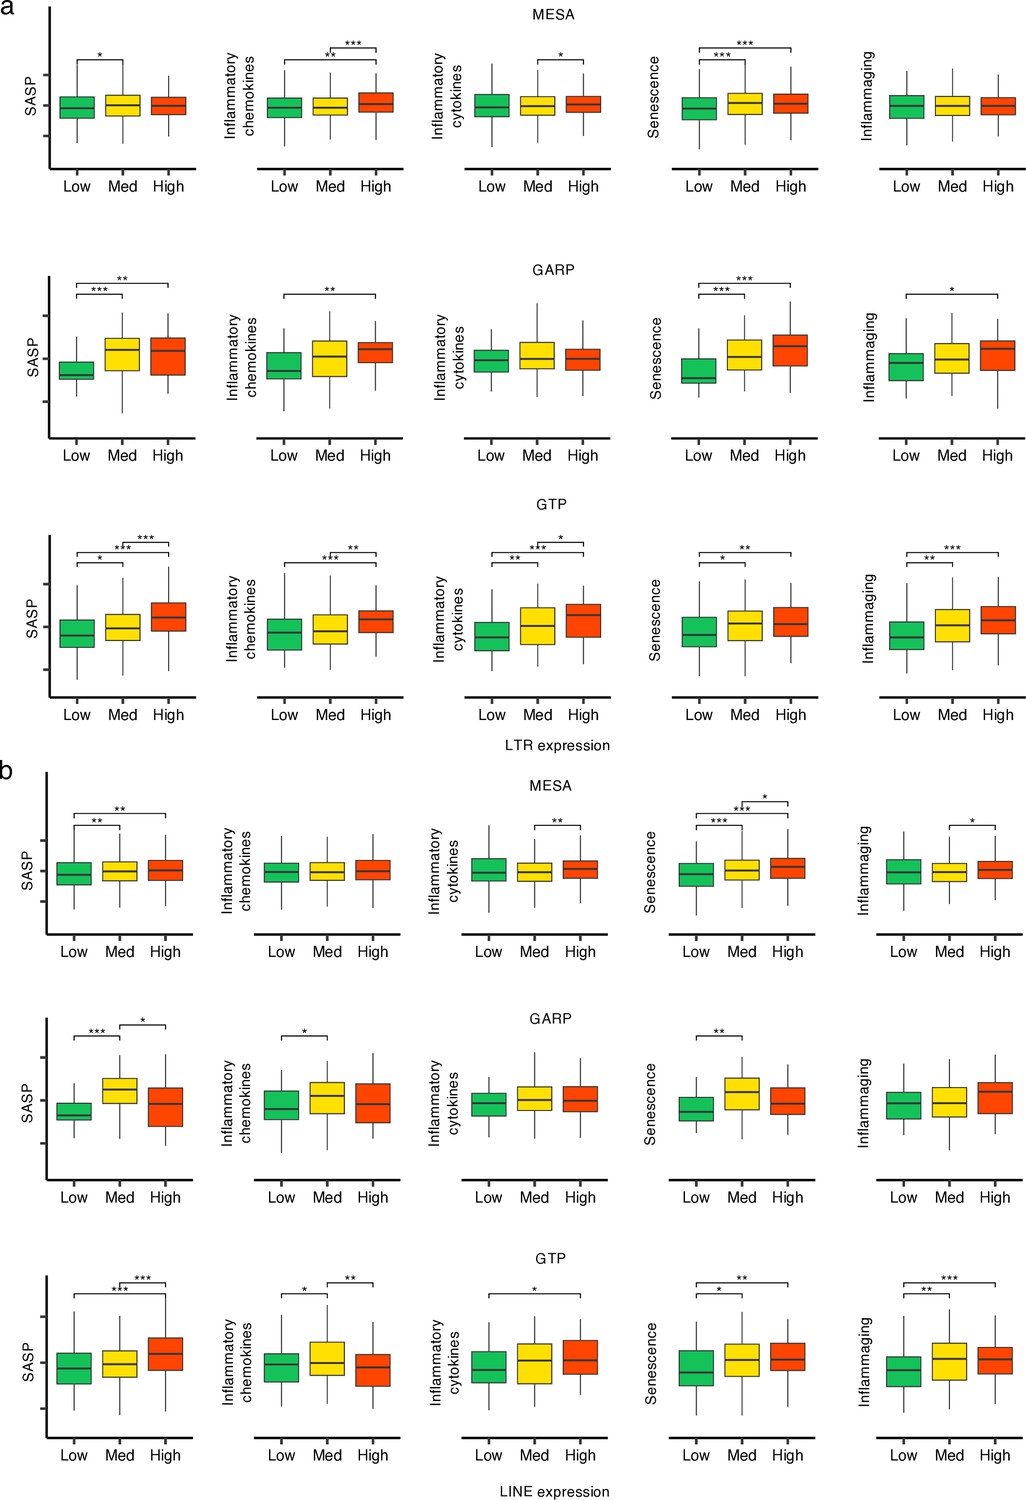
Increasing trend of biological age-related (BAR) gene signature scores in high vs low long terminal repeats (LTR) and LINE expression groups in the three human cohorts.
(a, b) The samples in each cohort were divided into low (first quartile), medium (second and third quartile), and high (fourth quartile) LTR and LINE expression groups, respectively. *p≤0.05, **p≤0.01, ***p≤0.001, ****p≤0.0001, Wilcoxon test.
Figure 2—figure supplement 8
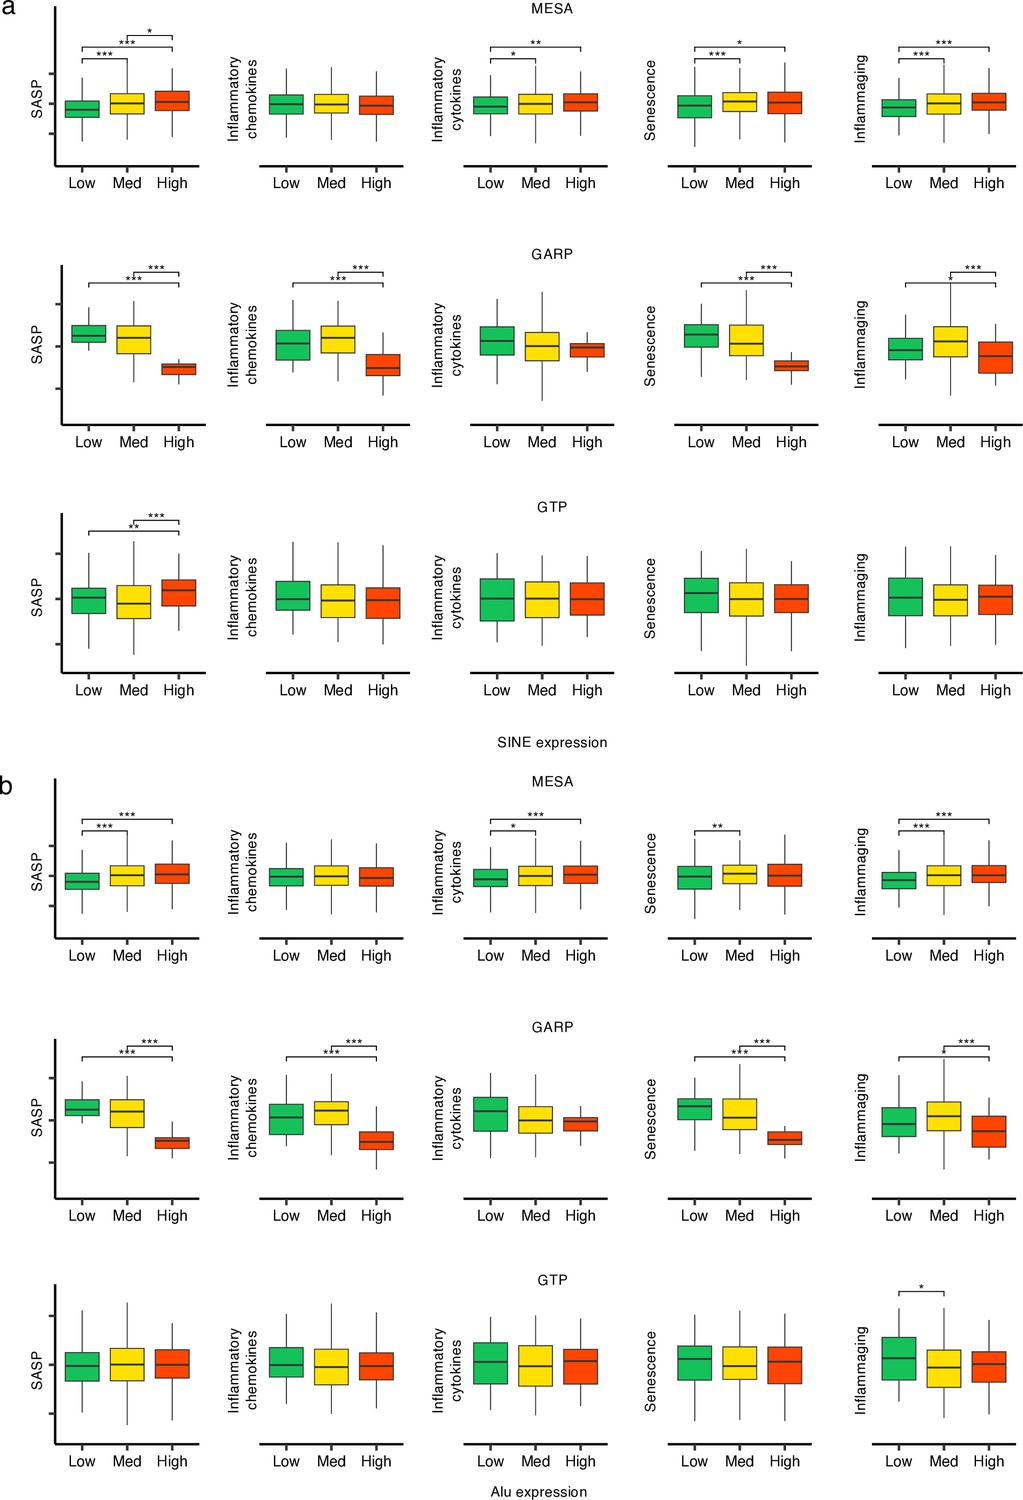
Different patterns of biological age-related (BAR) signature scores in Multi-Ethnic Study of Atherosclerosis (MESA) vs GARP vs Grady Trauma Project (GTP) for high vs low SINE and Alu expression groups in the three human cohorts.
(a, b), The samples in each cohort were divided into low (first quartile), medium (second and third quartile), and high (fourth quartile) SINE and Alu expression groups, respectively. *p≤0.05, **p≤0.01, ***p≤0.001, ****p≤0.0001, Wilcoxon test.
Figure 3
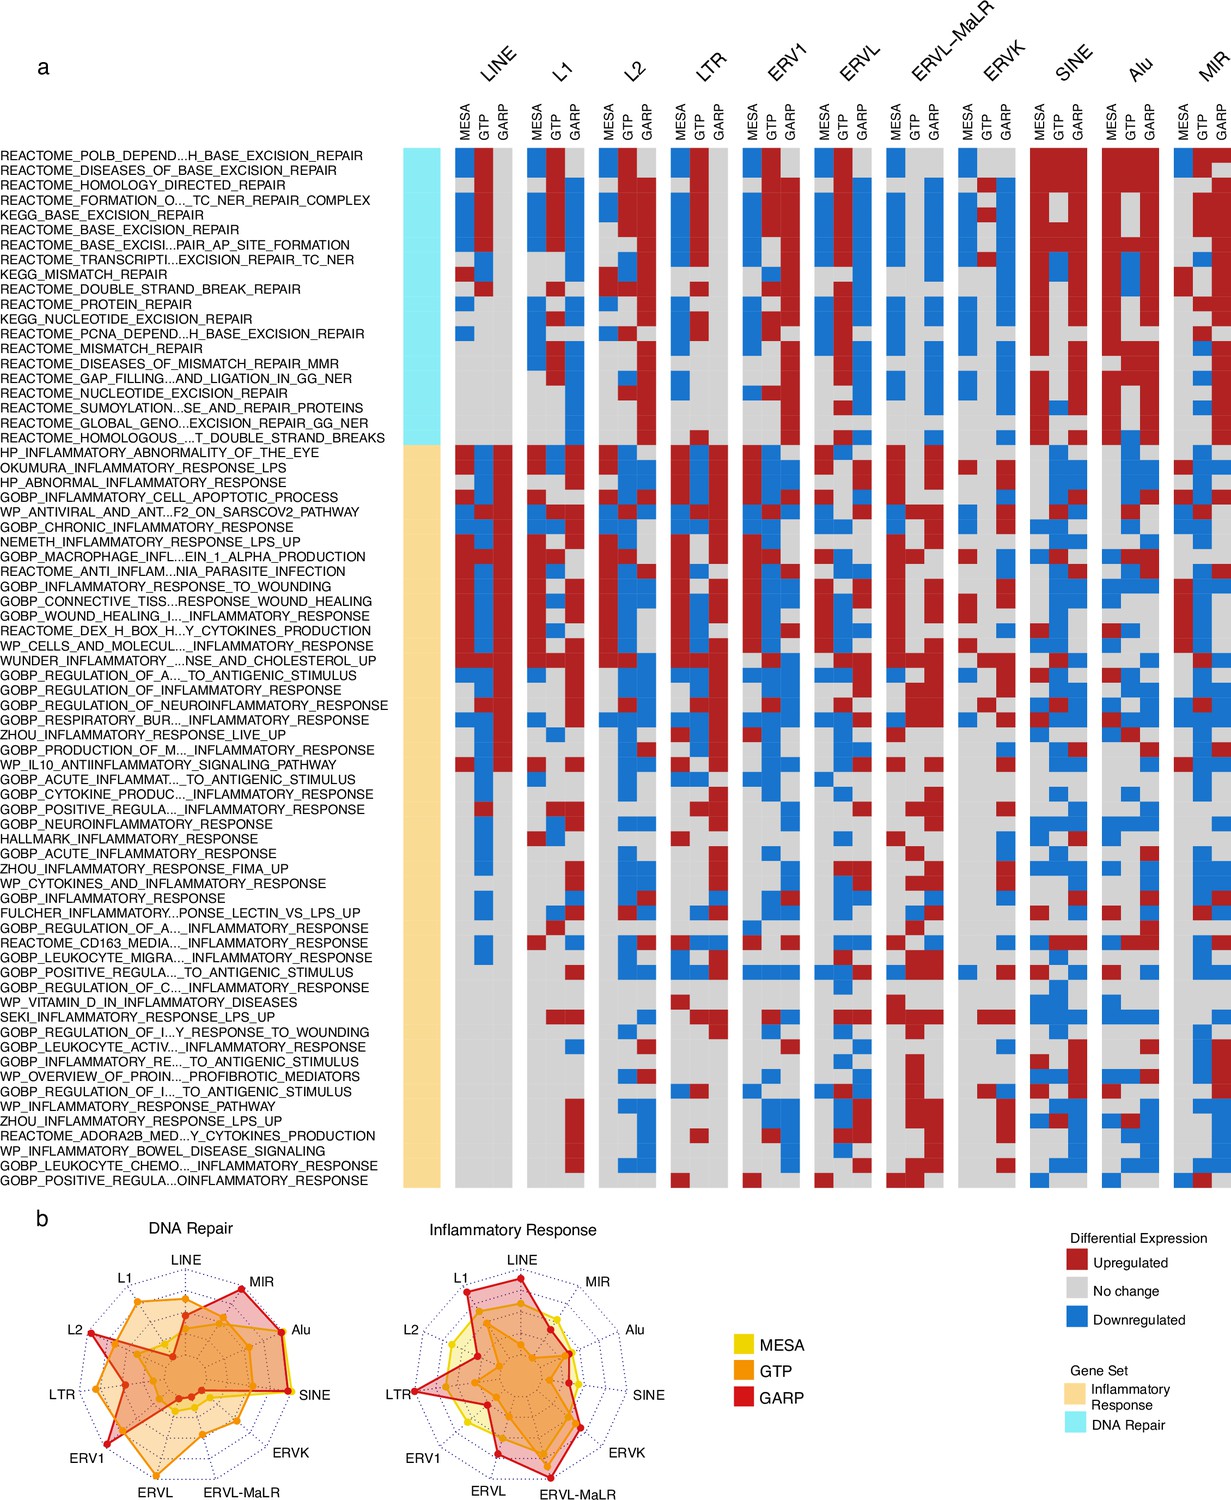
Upregulation of DNA repair vs inflammatory responses for samples with high expression of SINE vs long terminal repeats (LTR) and LINE in the Multi-Ethnic Study of Atherosclerosis (MESA) and GARP cohorts.
(a) Gene set variation analysis (GSVA) demonstrates the increased activity of DNA repair pathways in the group of samples with high vs low SINE expression in the MESA and GARP cohorts. In contrast, the inflammatory response is upregulated in the sample groups highly expressing LINE and LTR classes and families in the MESA and GARP cohorts. The samples in each cohort were divided into low (first quartile), medium (second and third quartile), and high (fourth quartile) expression groups based on the expression of retrotransposon (RTE) classes or families. GSVA was applied on high vs low groups for each class and family of RTEs. The threshold for differential expression is set at |logFC|>0.1 and p<0.05. (b), The Radar plot shows the difference between the number of upregulated versus downregulated gene sets related to DNA repair and inflammatory response in each cohort. While high expression of SINE and Alu is significantly associated with a high number of up-regulated DNA-repair gene sets, LINE and L1 expressions are highly related to the high number of activated gene sets related to inflammatory response in the MESA and GARP cohorts. This result is not highly supported by the GTP cohort, more likely due to the low number of probes in this cohort.
Figure 4 with 2 supplements
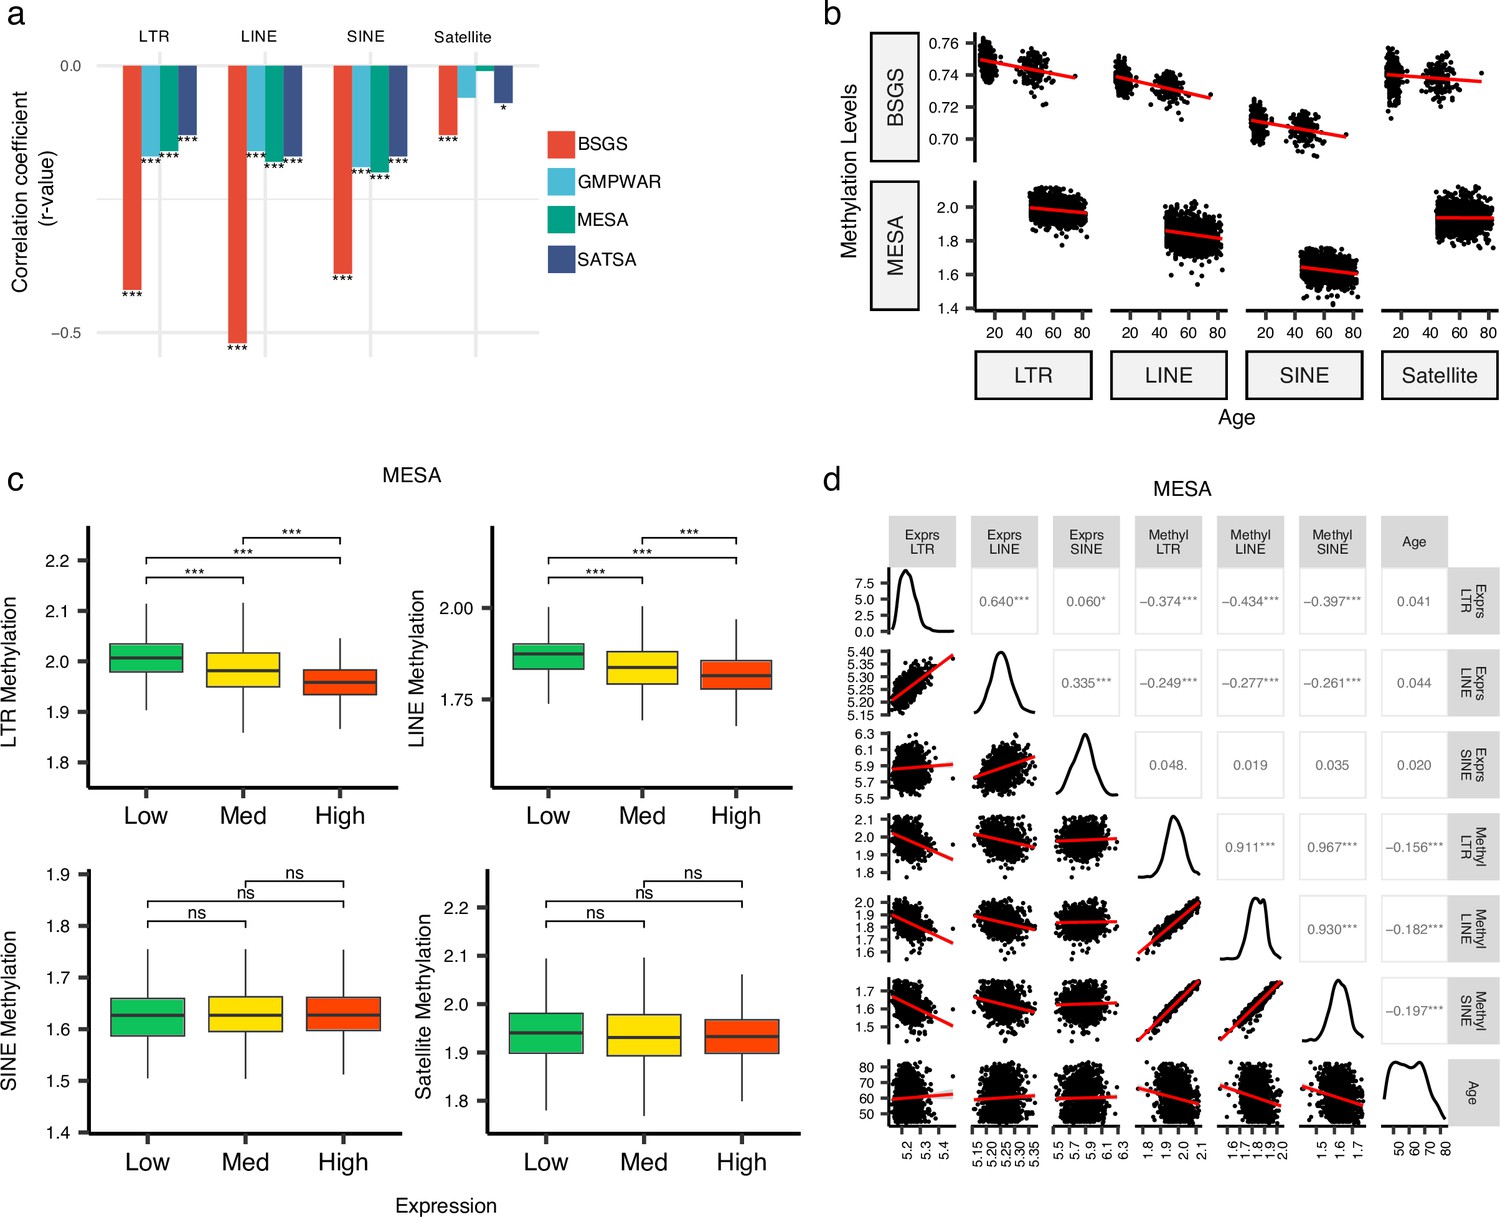
Inverse correlation of DNA methylation levels of retrotransposons (RTEs) with the chronological age and the RTE expression except for SINE expression.
(a, b), Methylation levels of RTE classes inversely correlated with chronological age in monocyte (Multi-Ethnic Study of Atherosclerosis, MESA) and whole blood (WB) (BSGS, SATSA, and GMPWAR) samples. Satellite DNA was included as a control group. (c), Methylation levels versus low (first quartile), medium (second and third quartile), and high (fourth quartile) expressions of RTE classes in monocytes (MESA). Wilcoxon test; ns: not significant. (d), Correlation matrix for RTE expressions and methylation levels, and chronological age. *p≤0.05, **p≤0.01, ***p≤0.001, ****p≤0.0001, Pearson’s correlation. MESA, n=1202; BSGS, n=614; GMPWAR, n=656; SATSA, n=1072.
Figure 4—figure supplement 1
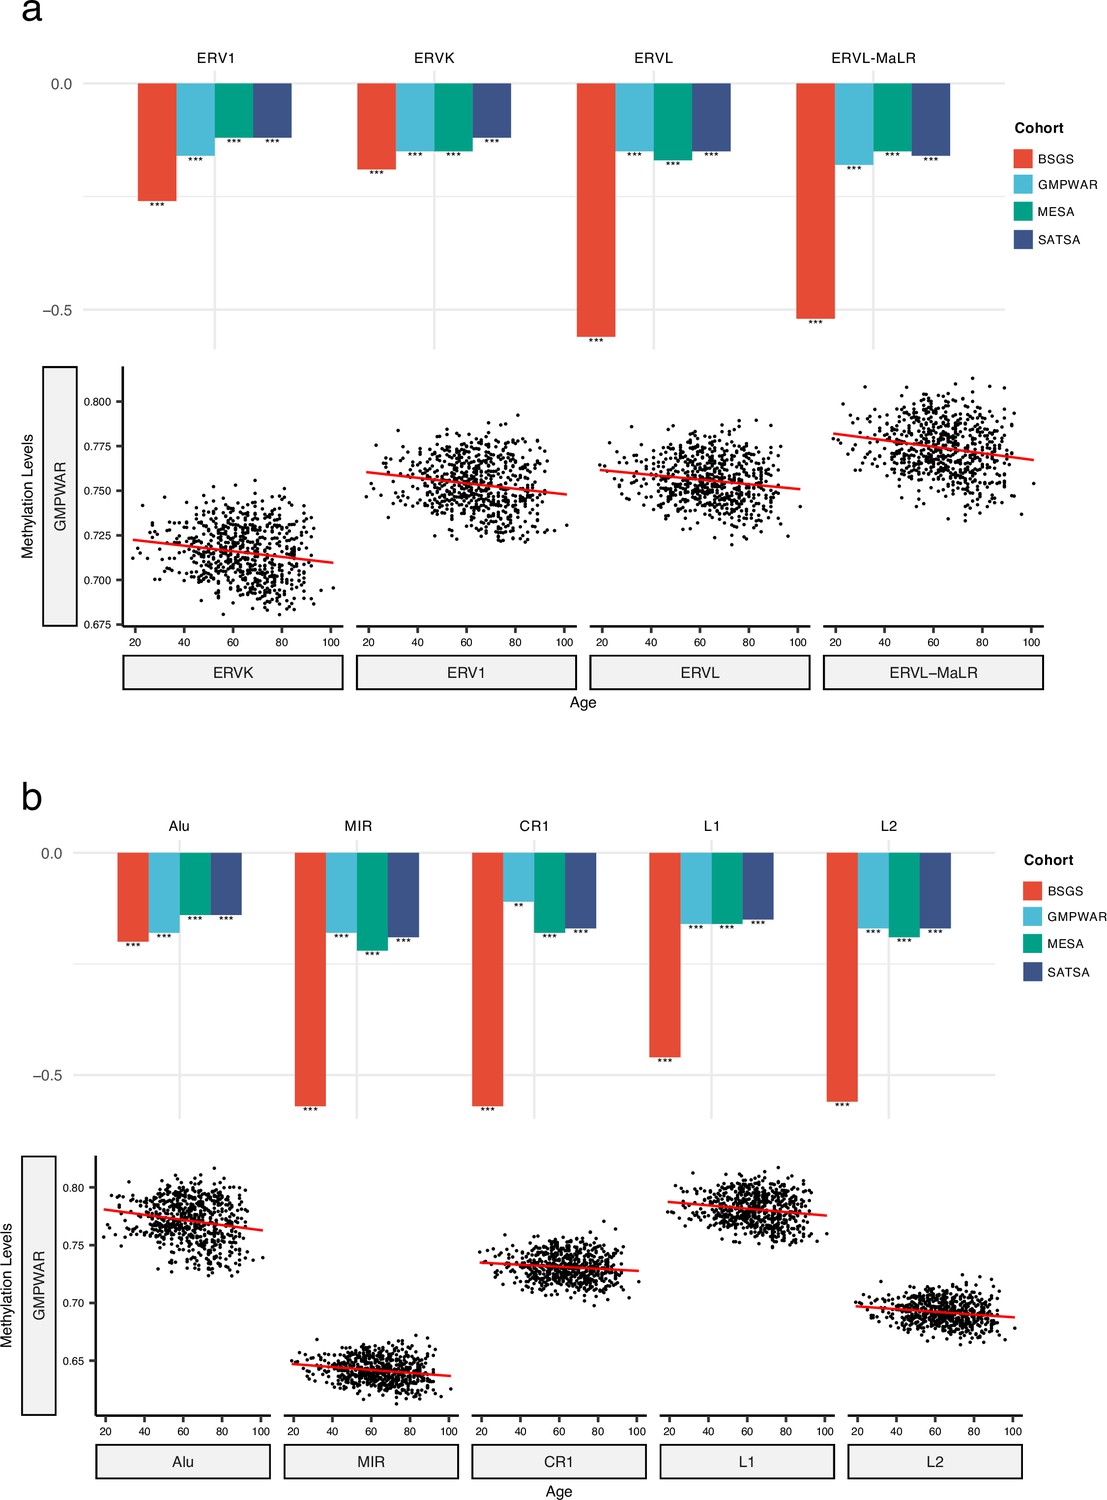
Correlation of methylation levels of retrotransposon (RTE) families with chronological age in monocyte (Multi-Ethnic Study of Atherosclerosis, MESA) and whole blood (WB) (BSGS, SATSA, and GMPWAR) samples.
(a, b), Methylation levels of long terminal repeats (LTR) and LINE/SINE families negatively correlate with chronological age in monocytes (MESA) and the WB (BSGS, SATSA, and GMPWAR). **p≤0.01, ***p≤0.001, Wilcoxon test.
Figure 4—figure supplement 2
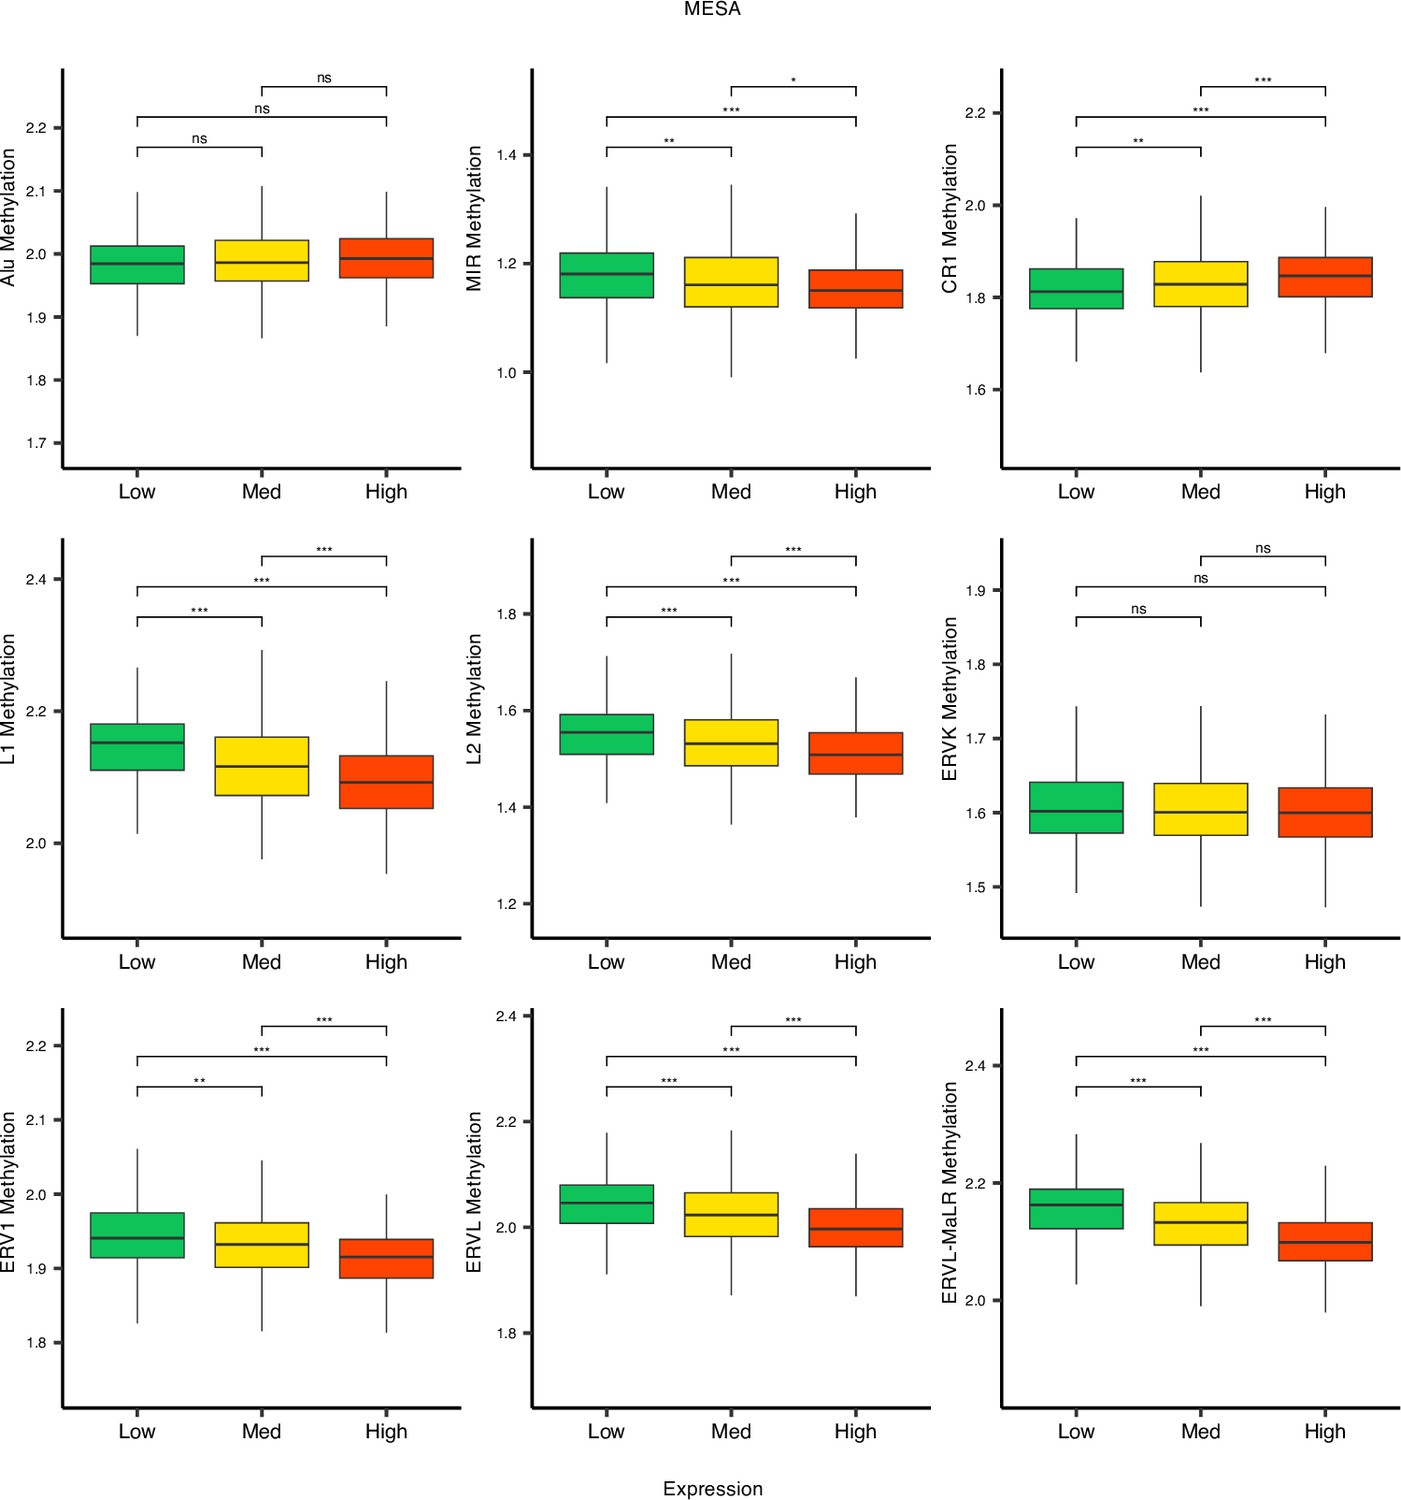
Methylation levels versus low (first quartile), medium (second and third quartile), and high (fourth quartile) expressions of retrotransposon (RTE) families in monocytes.
While LINE families, MIR, and long terminal repeats (LTR) families except ERVK show lower levels of methylation in higher expression groups, this pattern is not seen in Alu, CR1, and ERVl. *p≤0.05, **p≤0.01, ***p≤0.001, ****p≤0.0001, ns: not significant, Wilcoxon test.
Figure 5 with 6 supplements
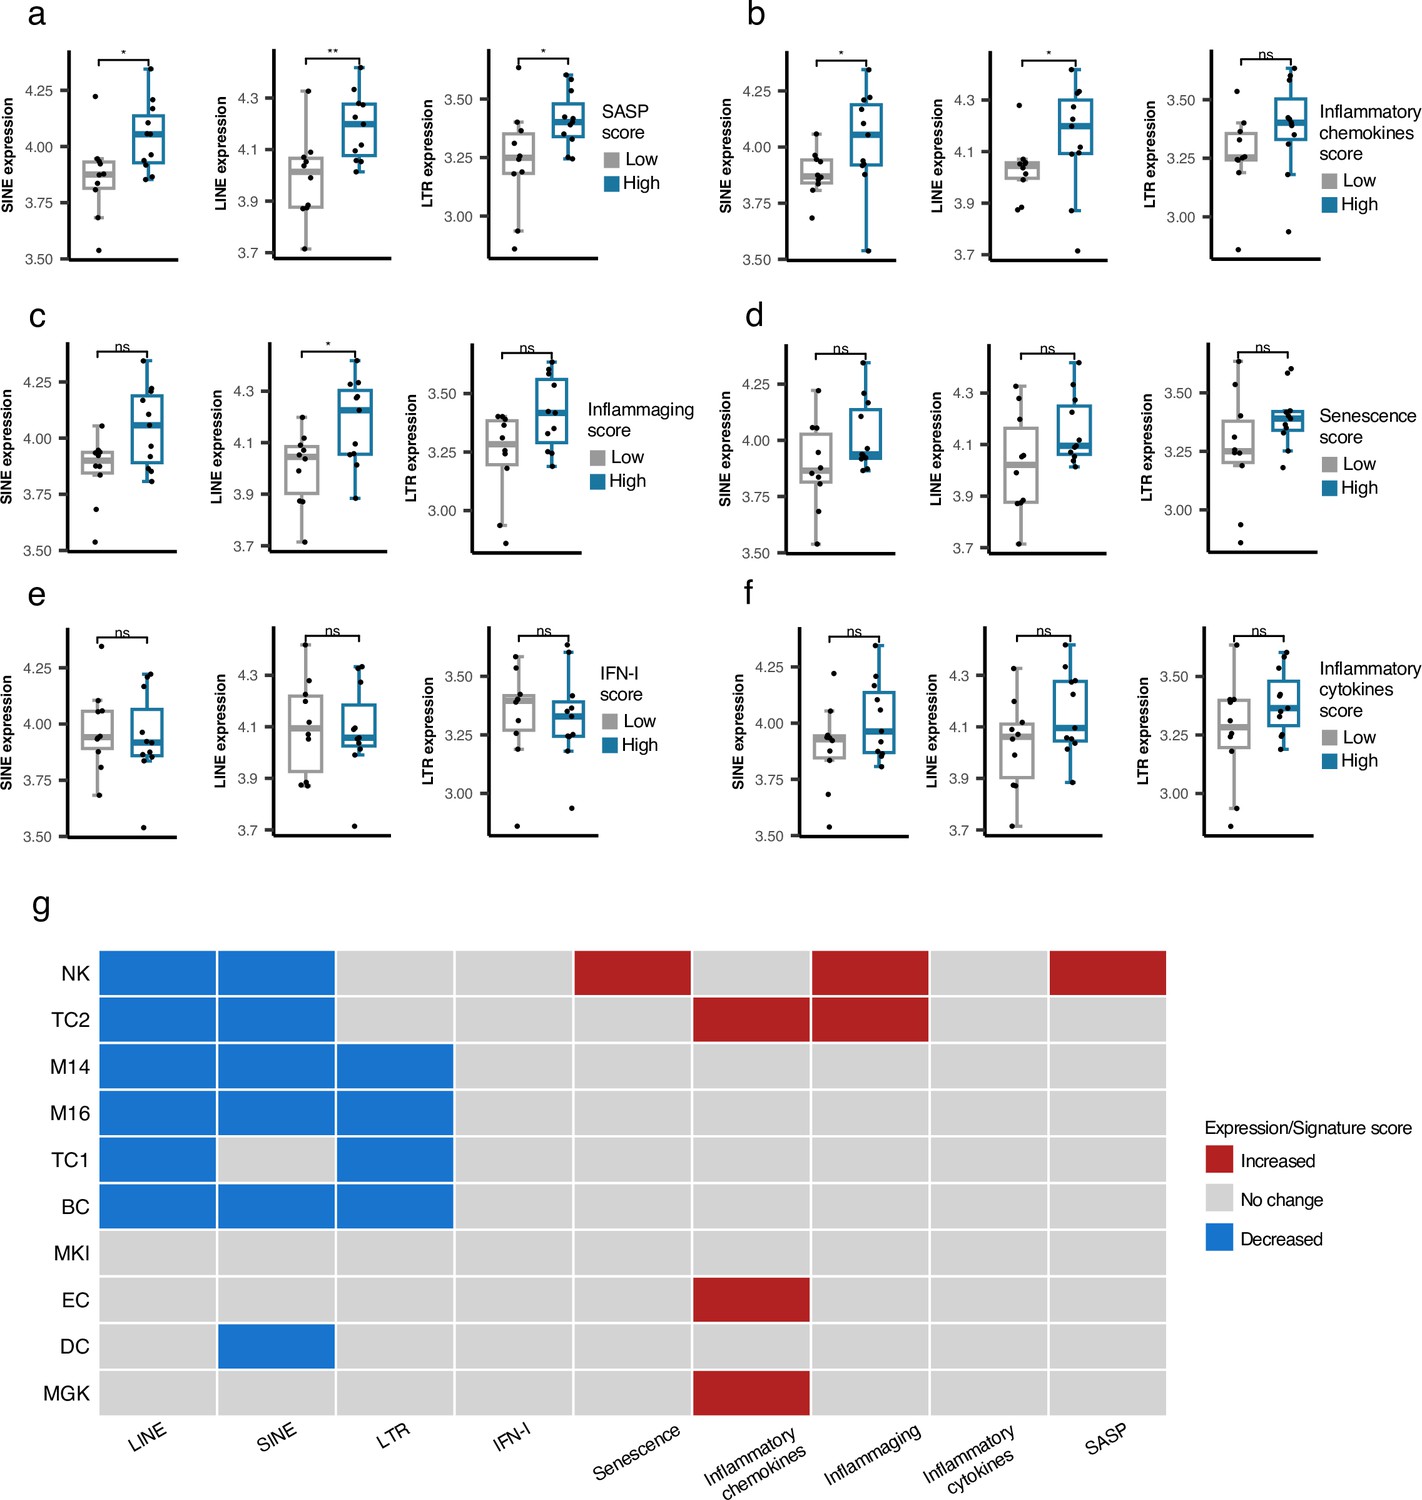
Cell type-specific analysis of retrotransposon (RTE) expression vs biological age-related (BAR) gene signature scores in two peripheral blood mononuclear cell (PBMC) scRNA-seq cohorts.
(a-f), Unique increased expression of RTEs in the Plasma B cells of the samples with high biological age-related (BAR) gene signature scores indicates the potential role of plasma B cells in aging. *p≤0.05, **p≤0.01, ns: not significant, Wilcoxon test. n=21. (g) Decreased expressions of RTE classes and increased BAR gene signature scores in multiple annotated cell types obtained from the PBMCs of supercentenarians compared to ordinary elderlies as control. Supercentenarians, n=7; control, n=5, age 50–80. Wilcoxon test was applied to identify the significant changes. NK, Natural killer cell; BC, B-cell; TC1, T-cell 1; TC2, T-cell 2; M14, CD14 + monocyte; M16, CD16 + monocyte; EC, Erythrocytes; MKI, MKI67 + proliferating cell; DC, Dendritic cell; MGK, Megakaryocyte.
Figure 5—figure supplement 1
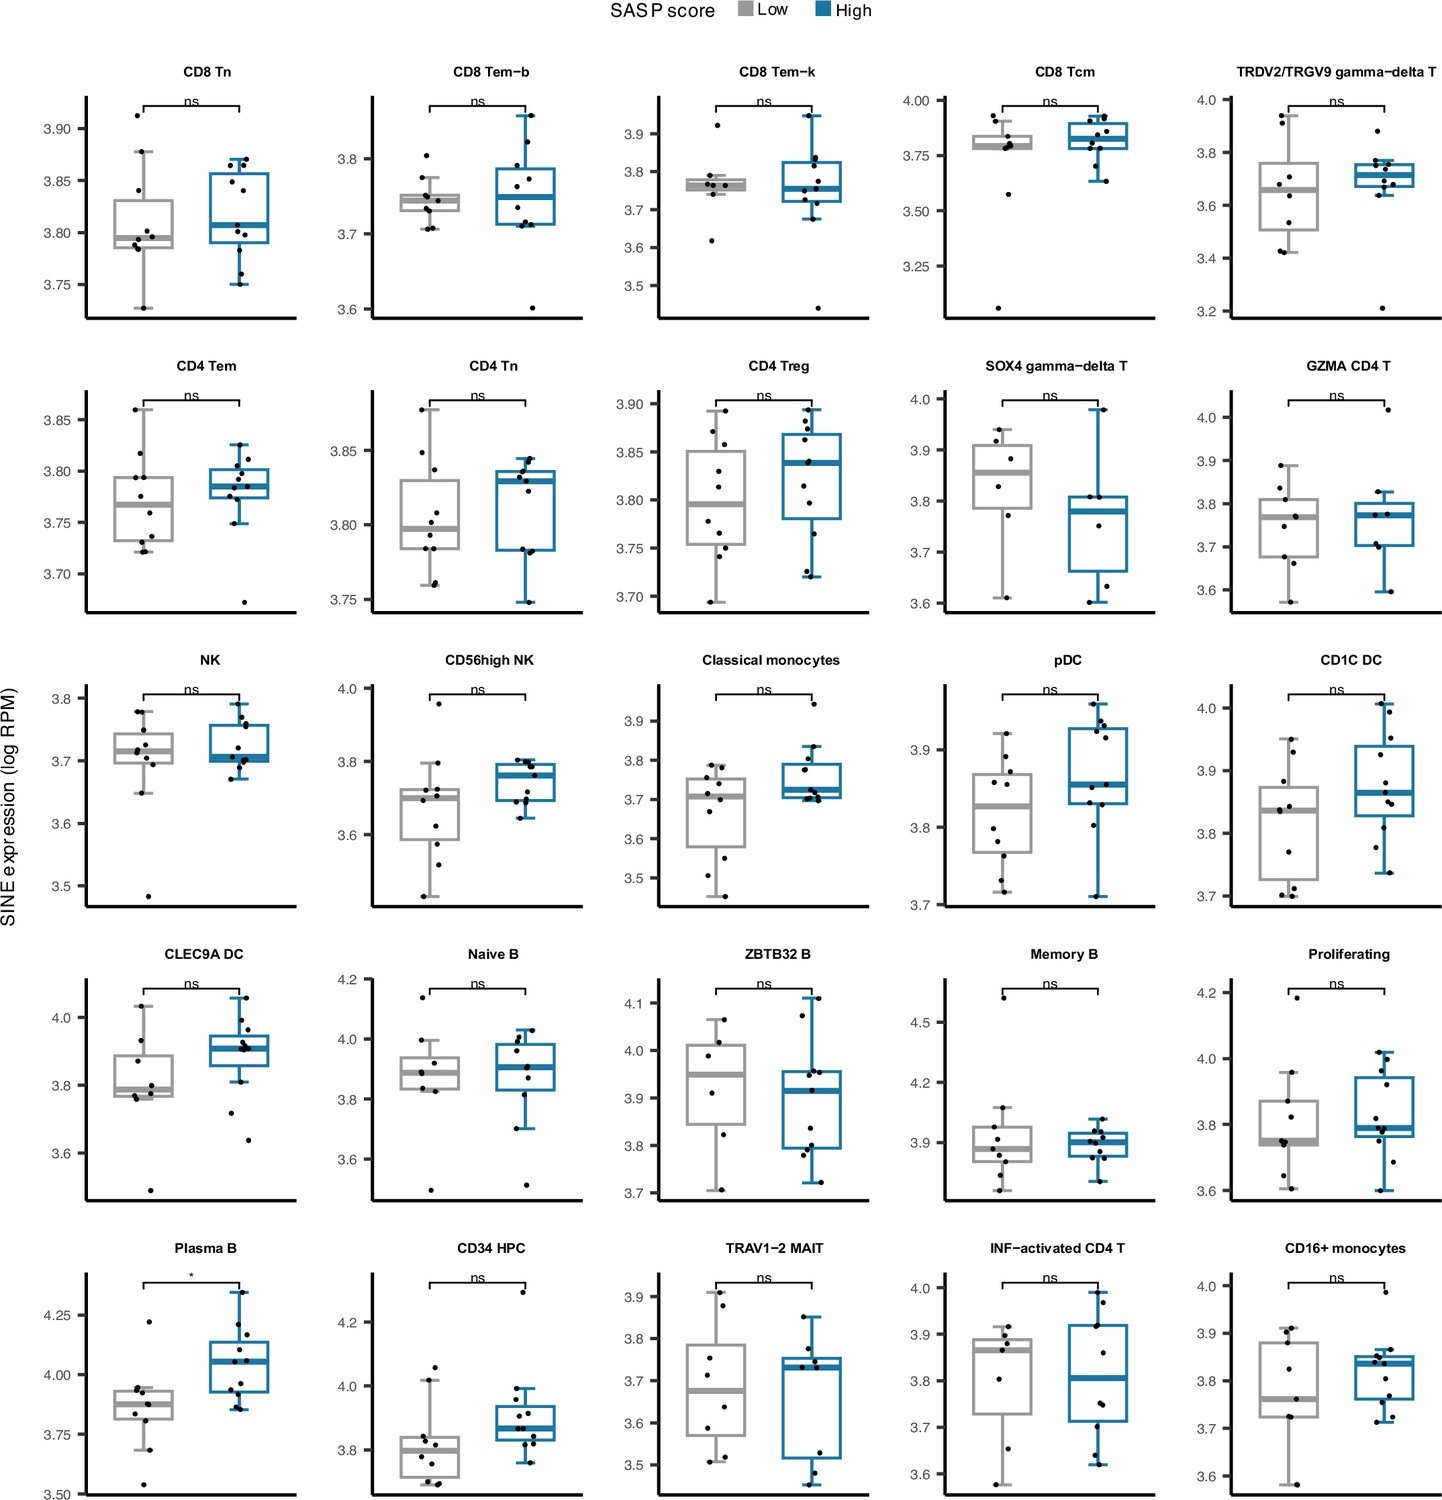
Cell type-specific SINE expression versus low and high senescence associated secretory phenotype (SASP) score groups among 25 cell types in peripheral blood mononuclear cell (PBMC).
Plasma B cells demonstrate significantly elevated SINE expression in samples with high SASP scores. *p≤0.05, ns: not significant, Pearson’s correlation.
Figure 5—figure supplement 2
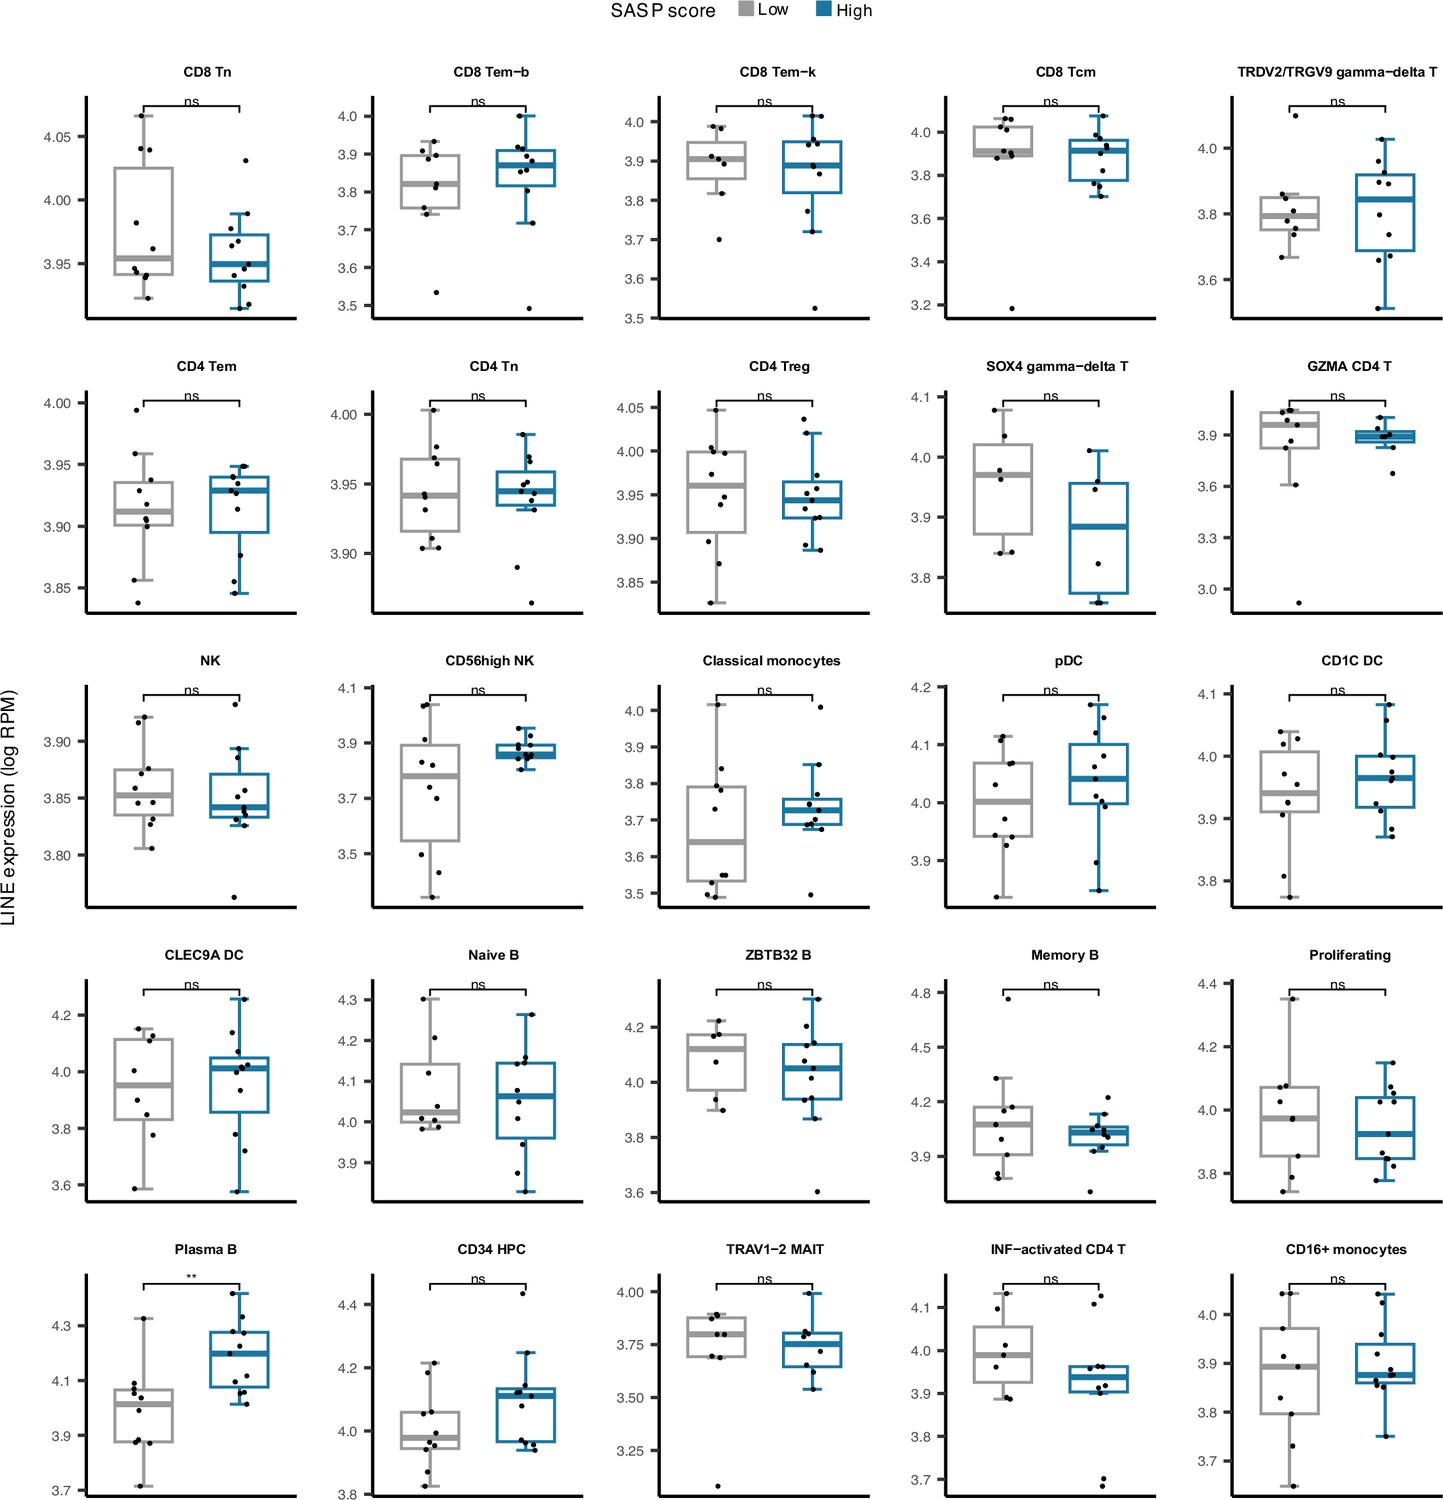
Cell type-specific LINE expression versus low and high senescence associated secretory phenotype (SASP) score groups among 25 cell types in peripheral blood mononuclear cell (PBMC).
Plasma B cells demonstrate significantly elevated LINE expression in samples with high SASP scores. *p≤0.05, ns: not significant, Pearson’s correlation.
Figure 5—figure supplement 3
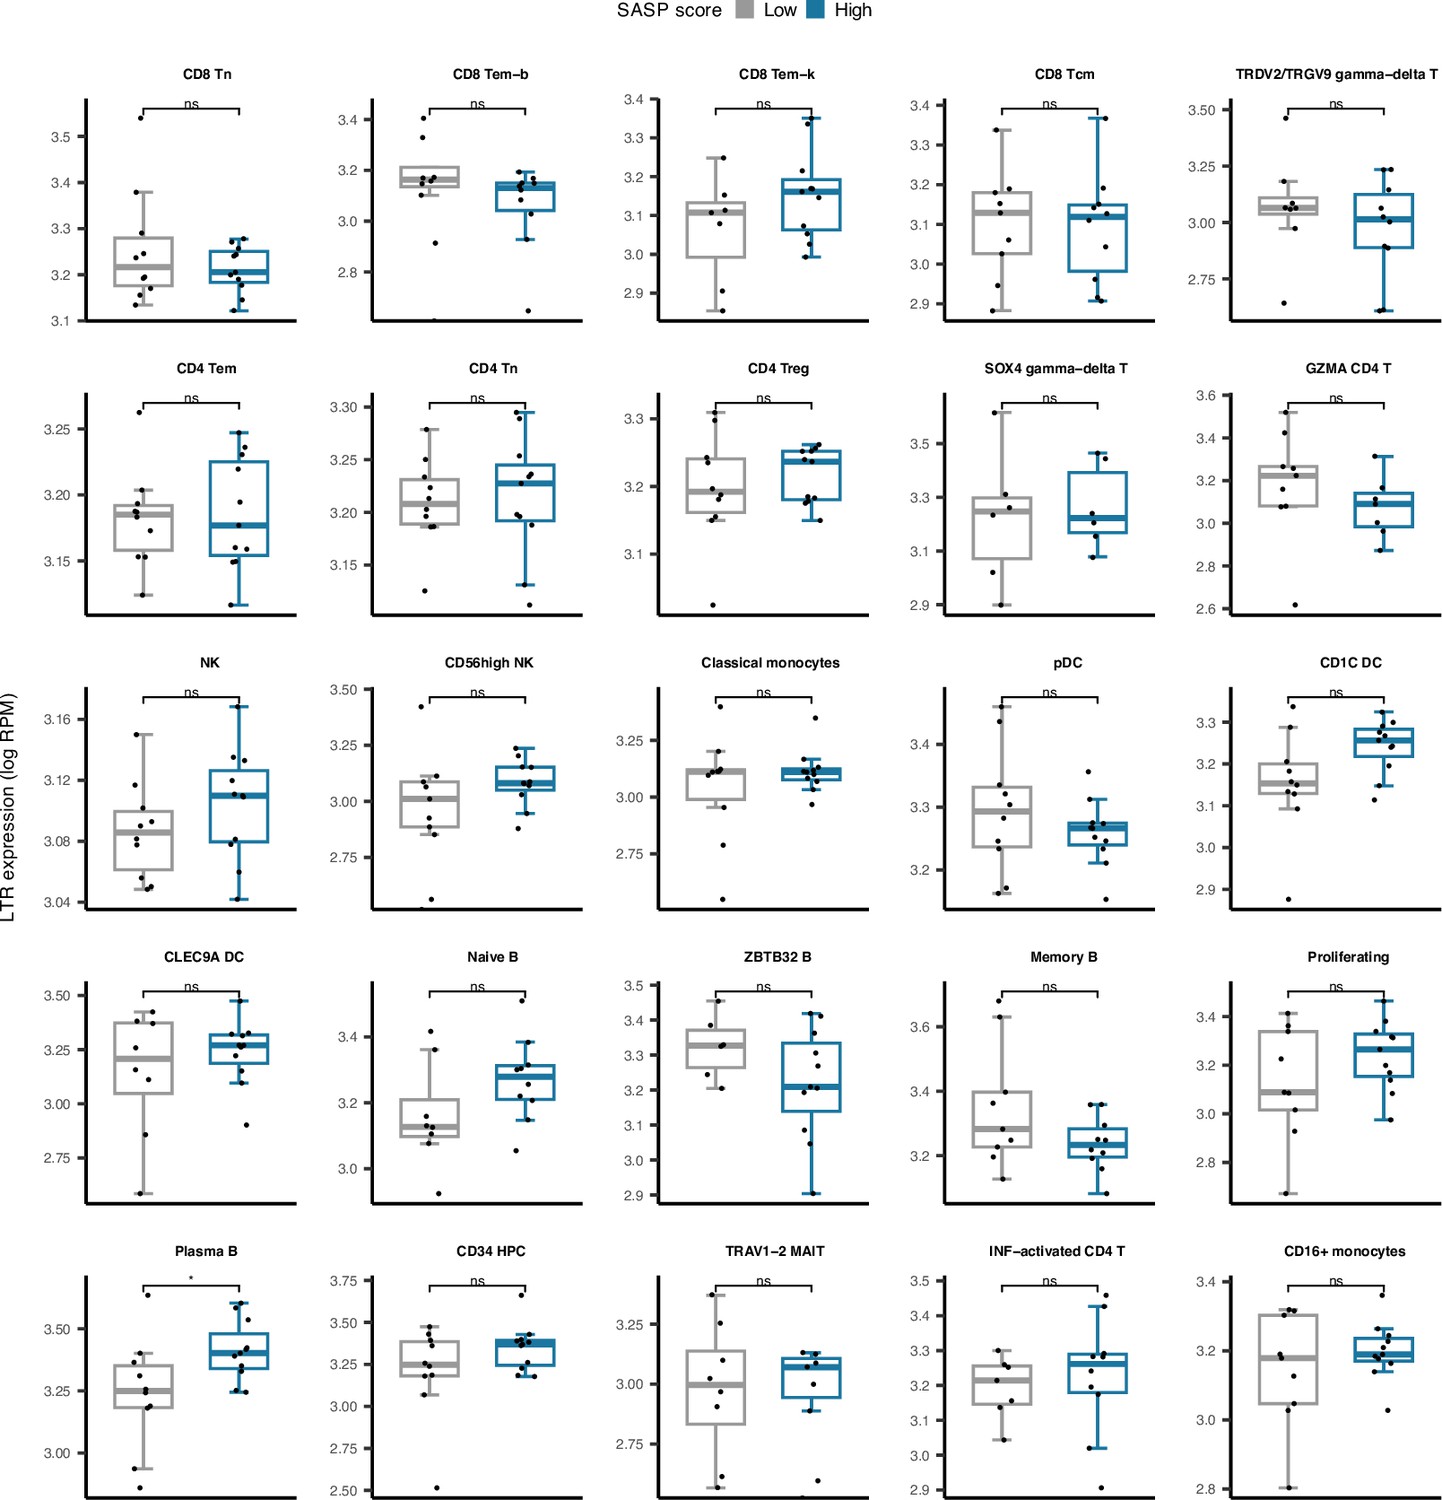
Cell type-specific long terminal repeats (LTR) expression versus low and high senescence associated secretory phenotype (SASP) score groups among 25 cell types in peripheral blood mononuclear cell (PBMC).
Plasma B cells demonstrate significantly elevated LTR expression in samples with high SASP scores. *p≤0.05, ns: not significant, Pearson’s correlation.
Figure 5—figure supplement 4
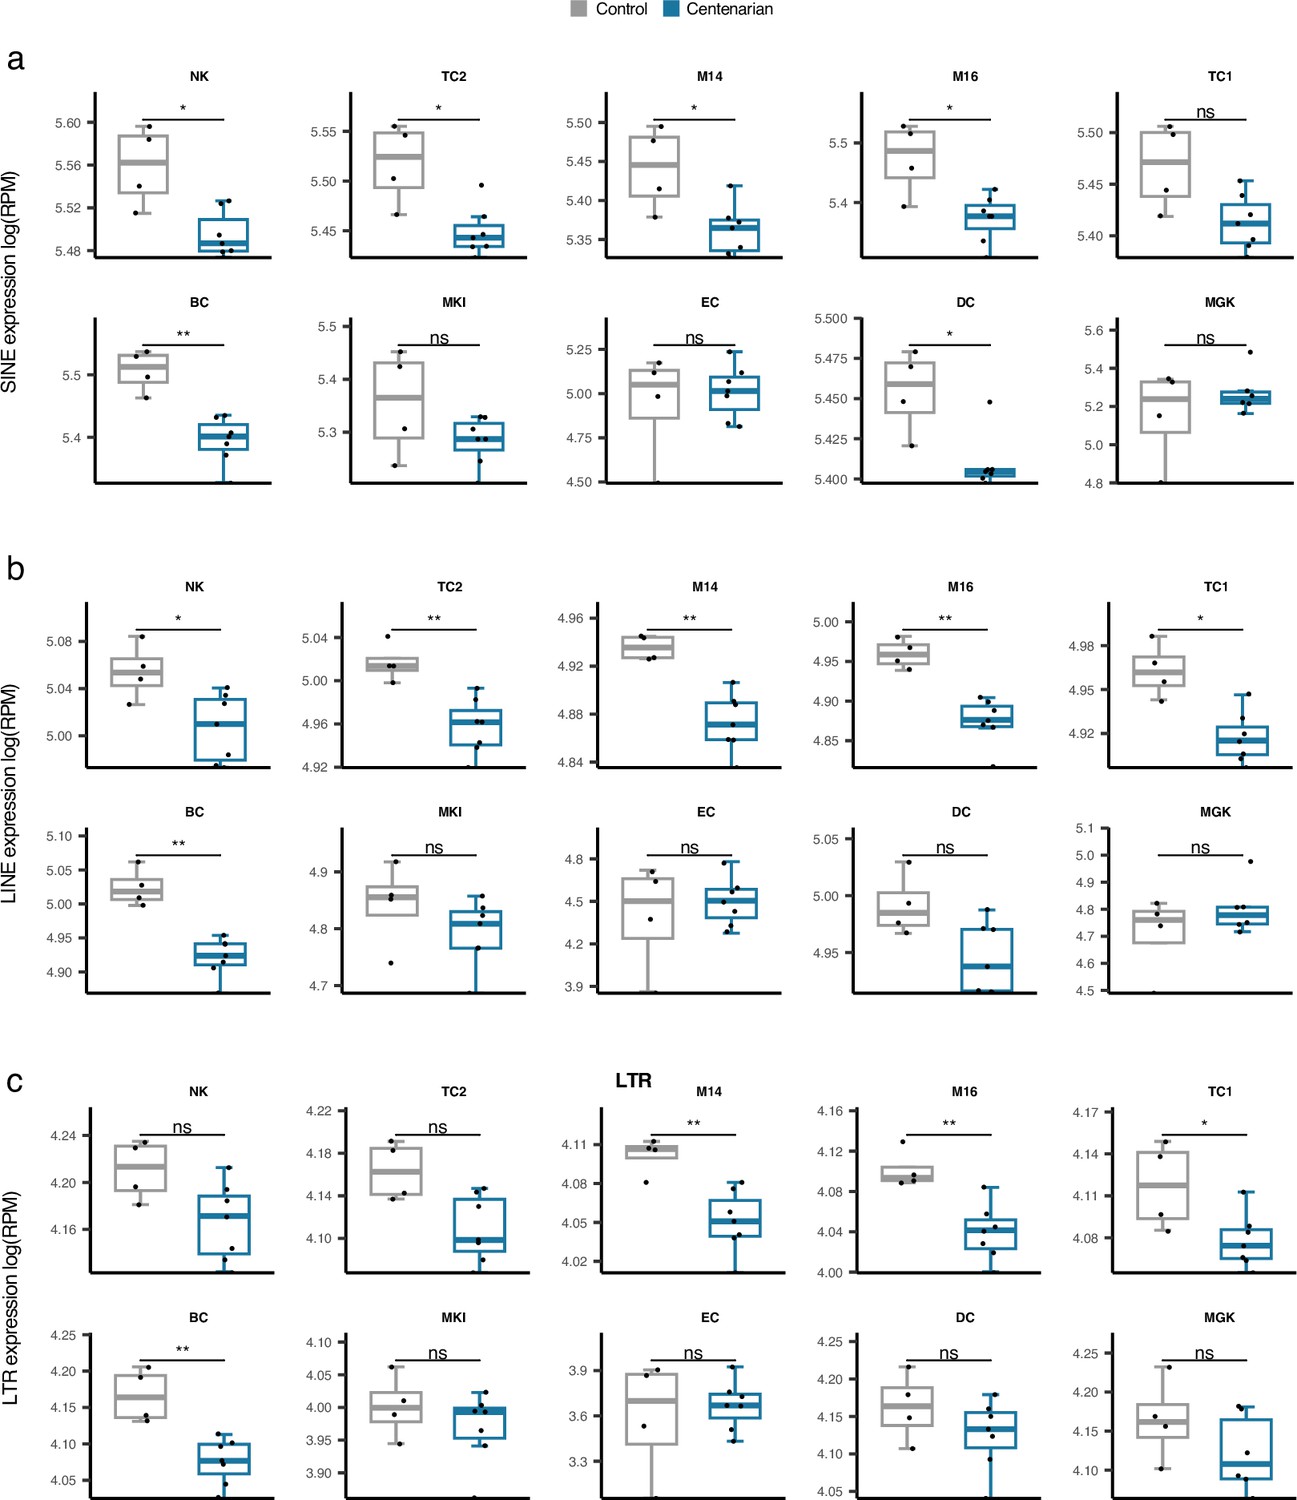
Comparison of cell type-specific retrotransposon (RTE) expression in supercentenarians versus normal aged cases.
*p≤0.05, **p≤0.01, ***p≤0.001, ****p≤0.0001, ns: not significant, Wilcoxon test.
Figure 5—figure supplement 5
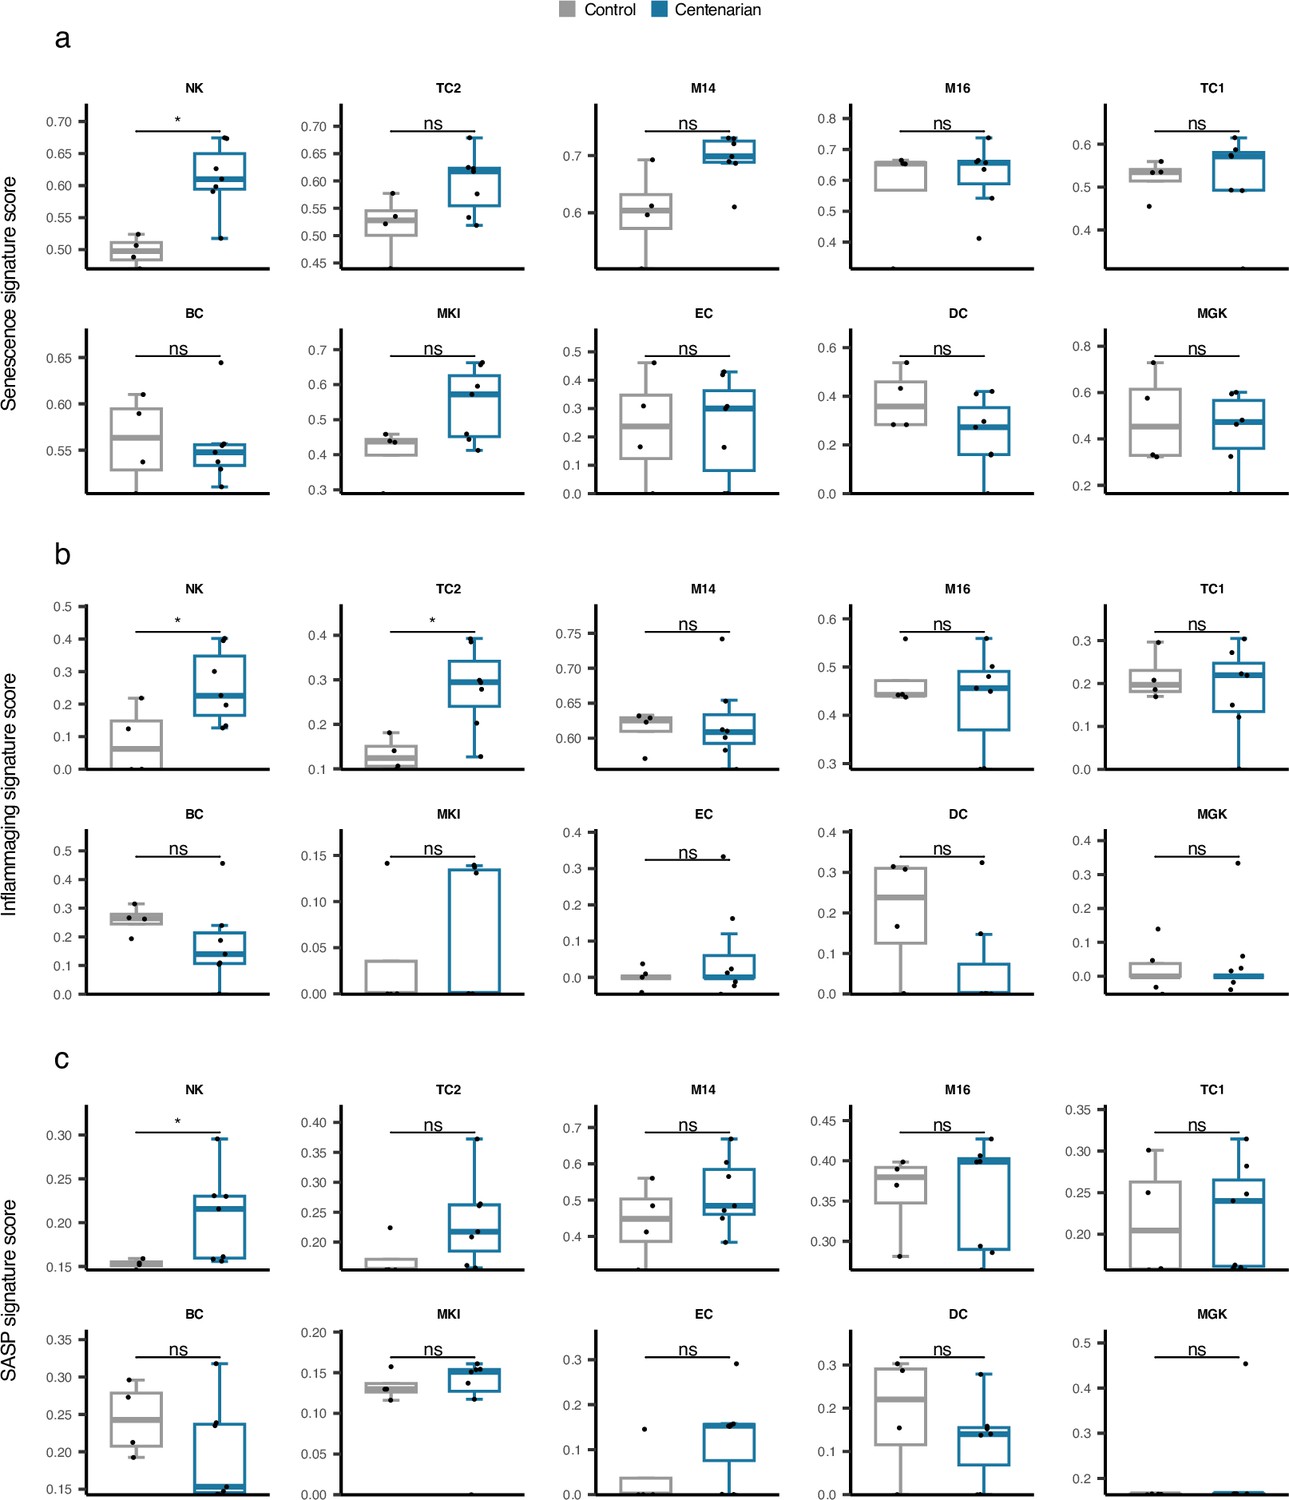
Comparison of cell type-specific Senescence, inflammaging, and senescence associated secretory phenotype (SASP) gene signature scores in supercentenarians versus normal aged cases.
*p≤0.05, **p≤0.01, ***p≤0.001, ****p≤0.0001, ns: not significant, Wilcoxon test.
Figure 5—figure supplement 6
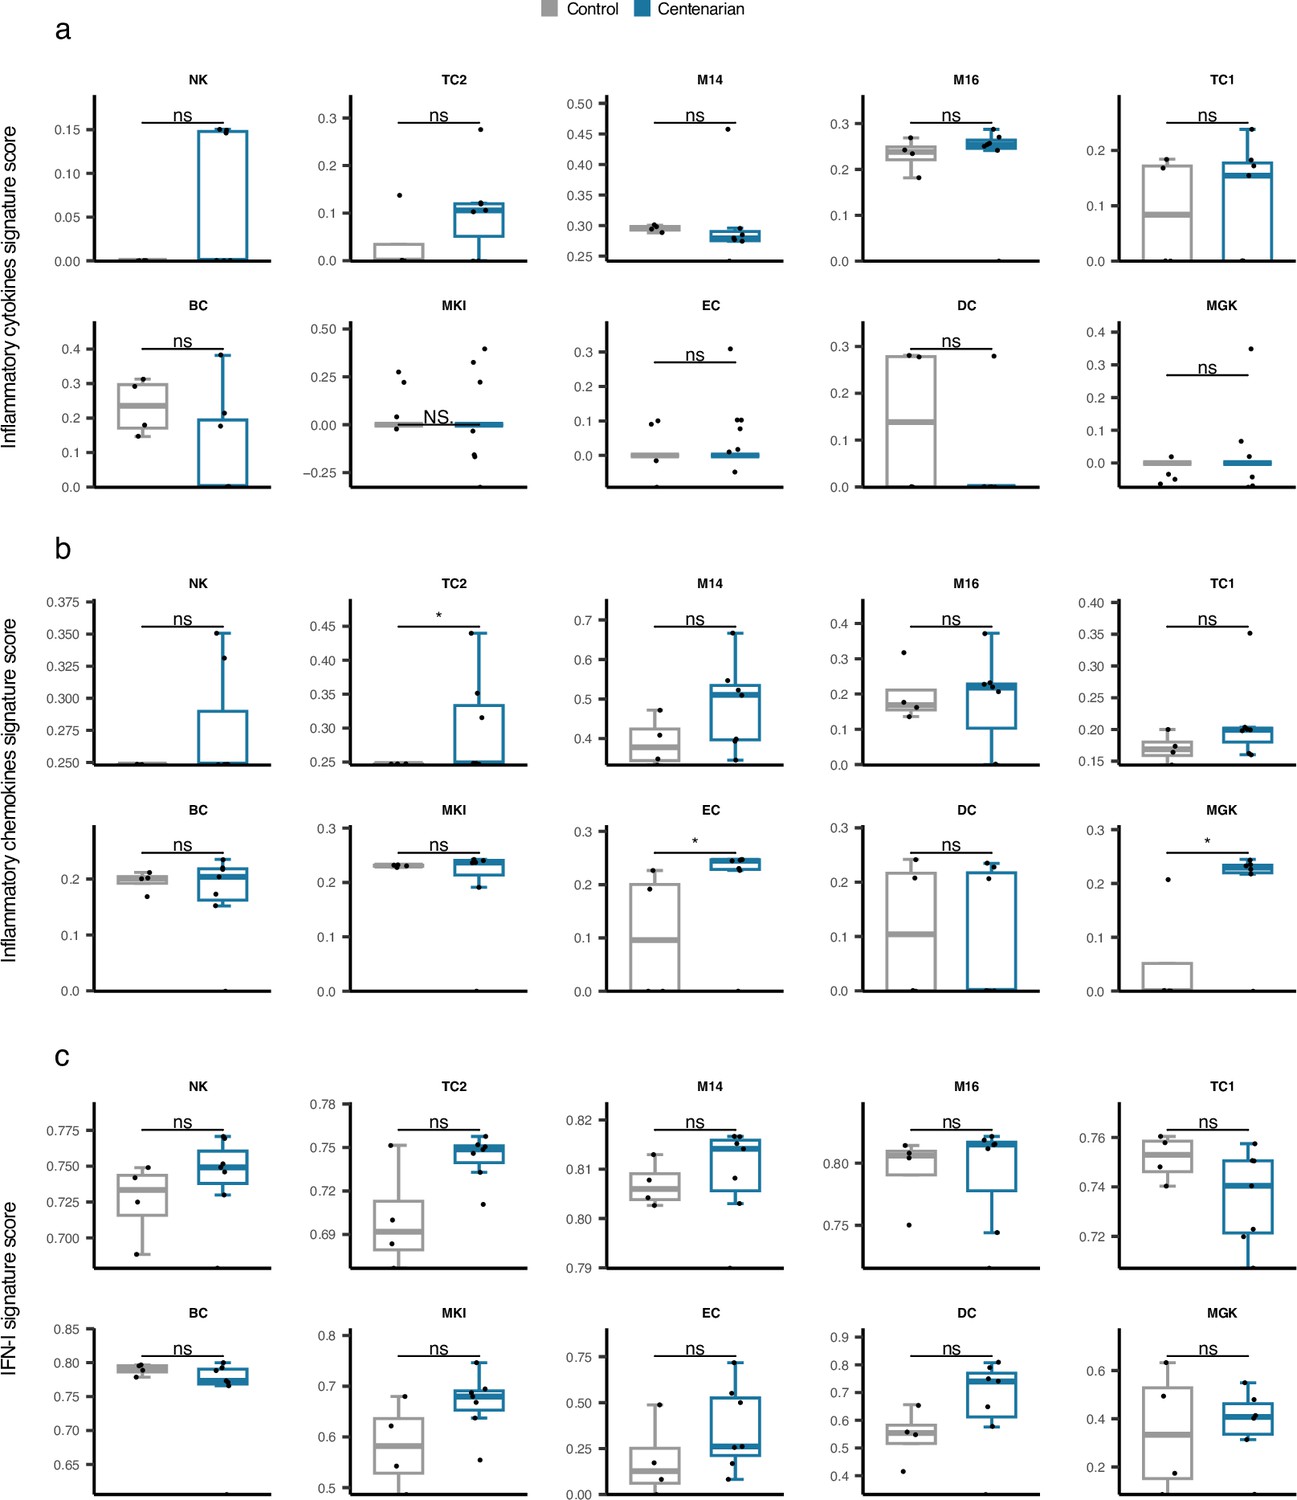
Comparison of cell type-specific Inflammatory cytokines, Inflammatory chemokines, and type I interferon (IFN-I) gene signature scores in supercentenarians versus normal aged cases.
*p≤0.05, **p≤0.01, ***p≤0.001, ****p≤0.0001, ns: not significant, Wilcoxon test.
Author response image 1

Generalized linear models (GLM) analysis (BAR gene signature scores ~ RTE expression +chronological age).
For each RTE family, we separately performed GLM. Age (RTE family) indicates the chronological age when used in the design formula for that specific RTE family.
Additional files
-
Supplementary file 1
Microarray datasets.
- https://cdn.elifesciences.org/articles/96575/elife-96575-supp1-v1.xlsx
-
Supplementary file 2
Number of expression probes mapping RTE classes across cohorts.
- https://cdn.elifesciences.org/articles/96575/elife-96575-supp2-v1.xlsx
-
Supplementary file 3
Number of expression probes mapping RTE families across cohorts.
- https://cdn.elifesciences.org/articles/96575/elife-96575-supp3-v1.xlsx
-
Supplementary file 4
List of RTE-covering probes from Illumina HumanHT-12-v4 Expression assay.
- https://cdn.elifesciences.org/articles/96575/elife-96575-supp4-v1.xlsx
-
Supplementary file 5
List of TE-covering probes from the Illumina Infinium 450 k array.
- https://cdn.elifesciences.org/articles/96575/elife-96575-supp5-v1.xlsx
-
Supplementary file 6
scRNA-seq data.
- https://cdn.elifesciences.org/articles/96575/elife-96575-supp6-v1.xlsx
-
Supplementary file 7
Adopted gene lists to describe age-related events.
- https://cdn.elifesciences.org/articles/96575/elife-96575-supp7-v1.xlsx
-
Supplementary file 8
Genes missing from the biological age-related (BAR) gene lists in the GTP dataset.
- https://cdn.elifesciences.org/articles/96575/elife-96575-supp8-v1.xlsx
-
MDAR checklist
- https://cdn.elifesciences.org/articles/96575/elife-96575-mdarchecklist1-v1.docx
Download links
A two-part list of links to download the article, or parts of the article, in various formats.
Downloads (link to download the article as PDF)
Open citations (links to open the citations from this article in various online reference manager services)
Cite this article (links to download the citations from this article in formats compatible with various reference manager tools)
Expression of most retrotransposons in human blood correlates with biological aging
eLife 13:RP96575.
https://doi.org/10.7554/eLife.96575.4


