Regional response to light illuminance across the human hypothalamus
- GIGA-CRC Human Imaging, University of Liège, Belgium
- Faculty of Health, Medicine and Life Sciences, School for Mental Health and Neuroscience, Alzheimer Centre Limburg, Maastricht University, Netherlands
- Synergia Medical SA, Belgium
- Institute of Neuroscience (IoNS), Department of Clinical Neuroscience, Université Catholique de Louvain (UCLouvain), Belgium
Figures
Figure 1
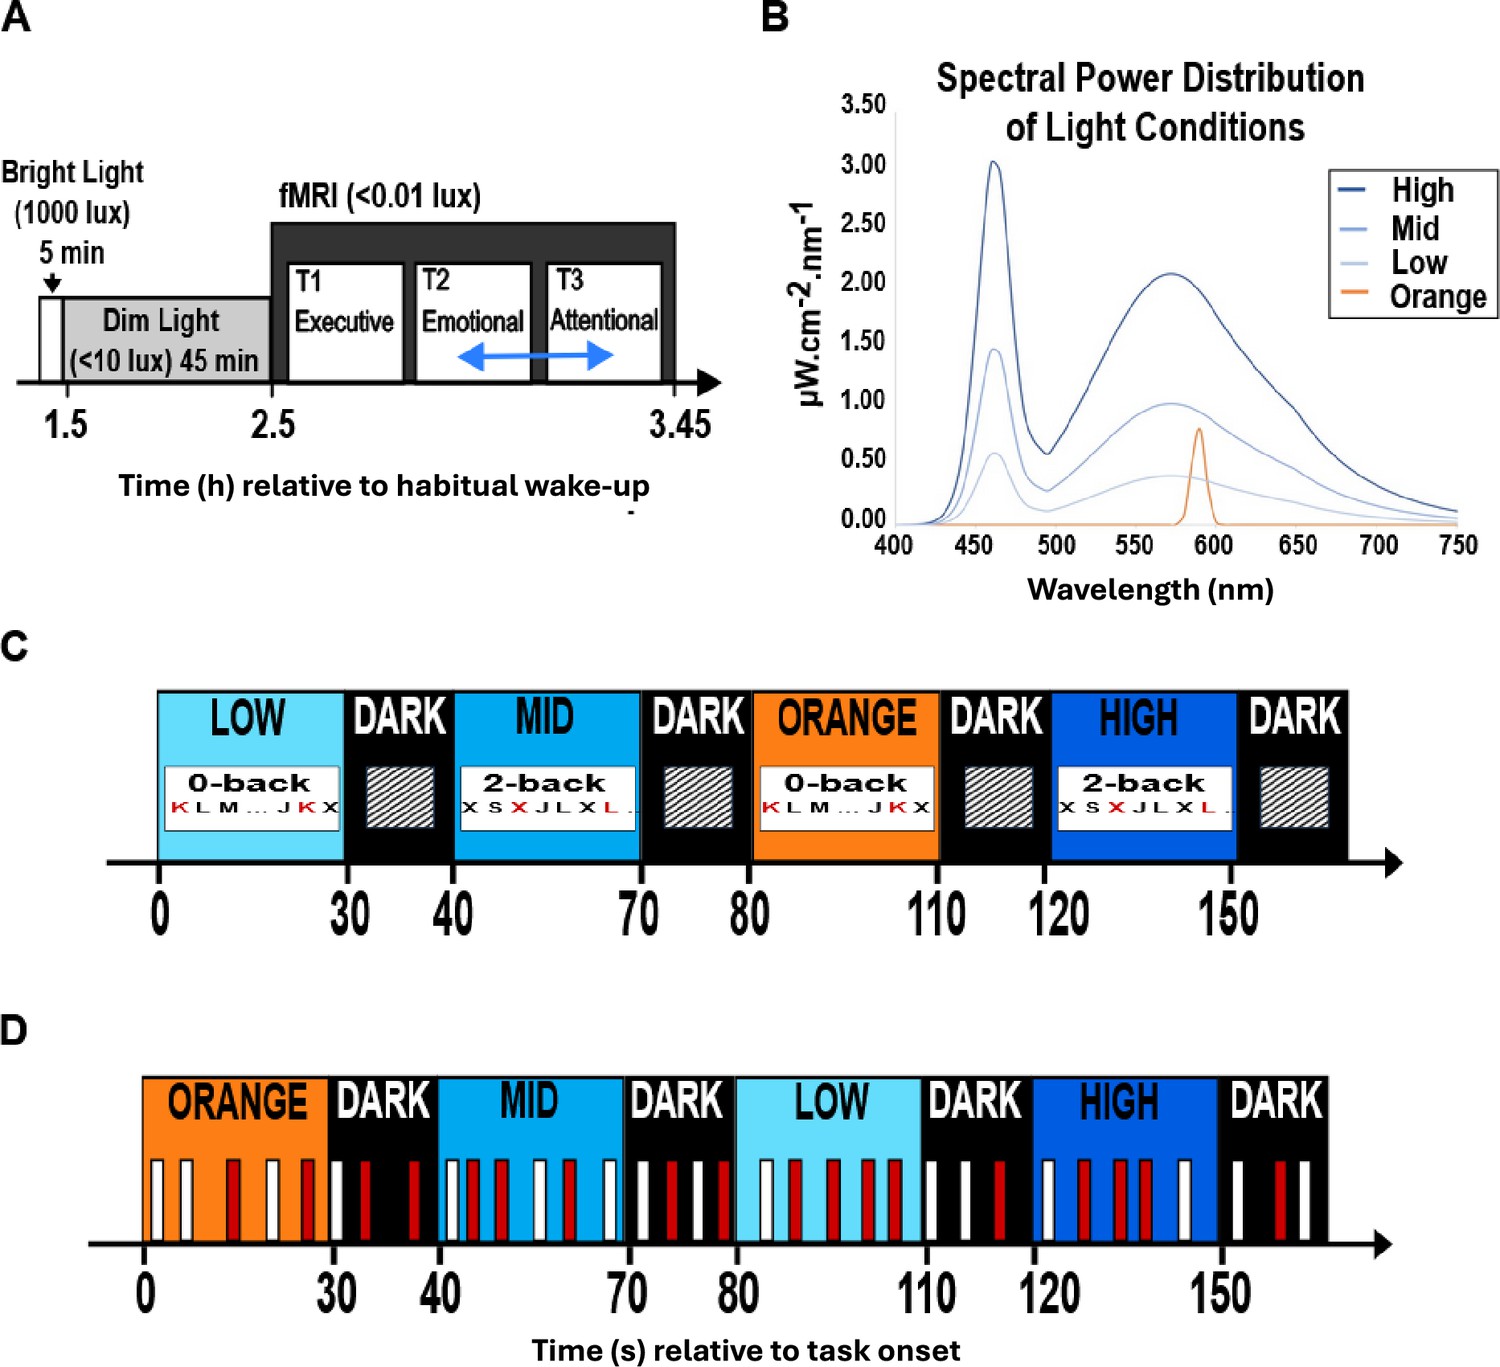
Experimental protocol.
(A) Overall timeline. After prior light history standardisation, participants performed executive (always first), emotional and attentional tasks (pseudo-randomly 2nd or 3rd, blue arrow). As the attentional task included fewer light conditions, it is not considered in the present manuscript (see Materials and methods for more details). (B) Spectral power distribution of light exposures. Monochromatic orange: 0.16 mel EDI lux; Polychromatic, blue-enriched light (6500 K); LOW, MID, HIGH: 37, 92, 190 mel EDI lux. For the present analyses, we discarded colour differences between the light conditions and only considered illuminance as indexed by mel EDI lux, constituting a limitation of our study. See Supplementary file 1b for full details). (C, D) Tasks procedures. Time is reported in seconds relative to session onset; participants were pseudo-randomly exposed to the 4 light conditions. (C) Executive task: alternation of letter detection blocks (0-back) and working memory blocks (2-back). (D) Emotional task: lure gender discrimination of vocalisations (50% angry (red), 50% neutral (white).
Figure 2
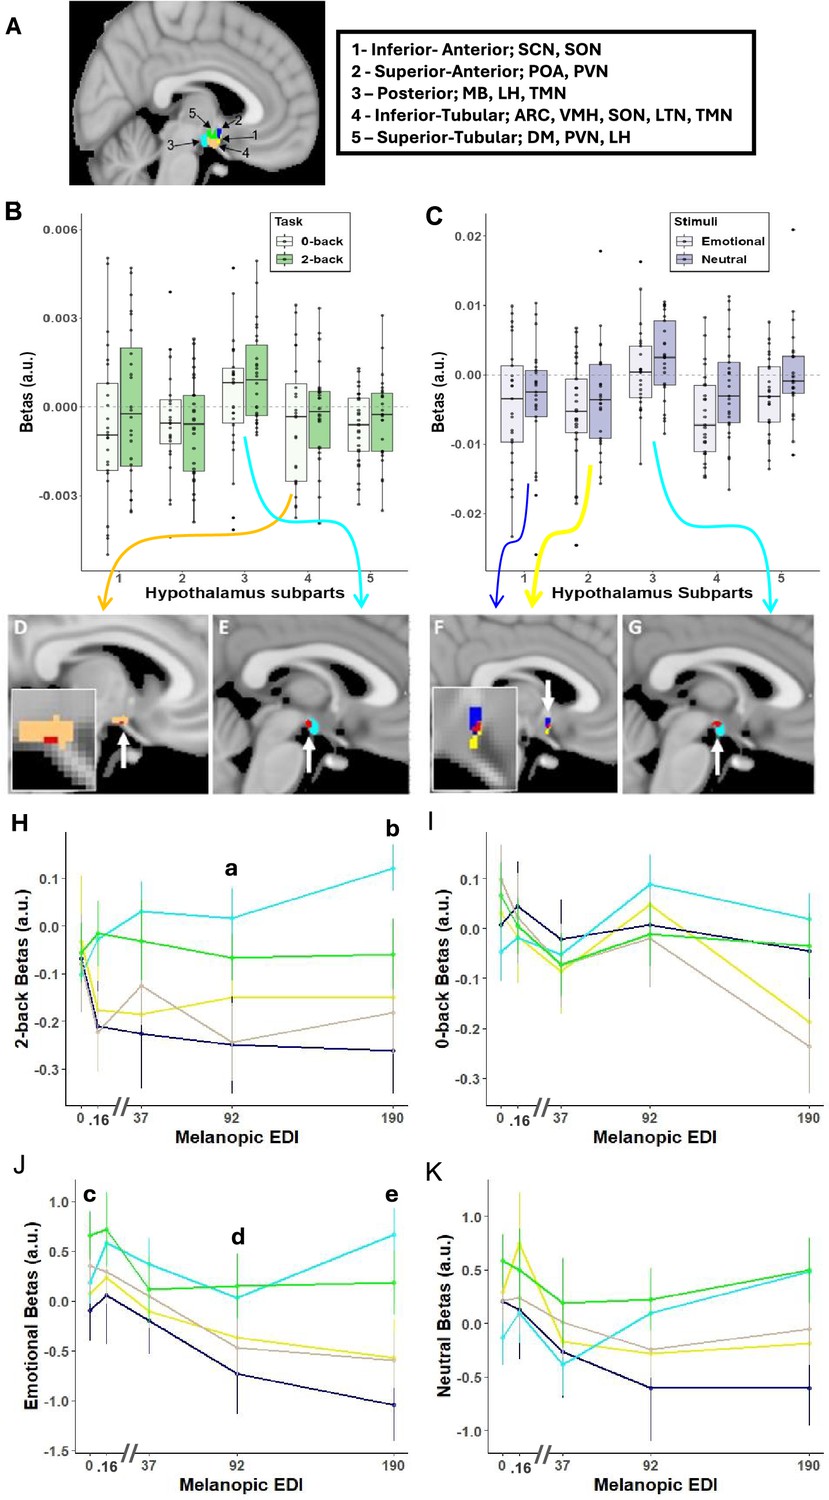
Illuminance impact on the hypothalamus subparts.
(A) Segmentation of the hypothalamus in five subparts in a representative participant. The nuclei encompassed by the different subparts are indicated in the right inset – according to Billot et al., 2020. ARC: arcuate nucleus; DMH; dorsomedial nucleus; LH lateral hypothalamus; LTN: lateral tubular nucleus; MB: mamillary body; POA: preoptic area; PVN: paraventricular nucleus; PNH: posterior nucleus of the hypothalamus; SCN: suprachiasmatic nucleus; SON: supraoptic nucleus; TMN: tuberomammillary nucleus; VMN: ventromedial nucleus. (B, C) Estimates (beta; arbitrary unit – a.u.) of the collective impact of illuminance variation on the activity of each hypothalamus subpart (Refer to Table 1 full statistics). (B) Executive task: significant main effect of hypothalamus subparts (p=0.002), no significant main of task type (p=0.4) or subpart-by-task-type interaction (p=0.61). (C) Emotional task: significant main effect of hypothalamus subparts (p<0.0001), and of stimulus type (p=0.048) or subpart-by-stimulus-type interaction (p=0.74). (D–G) Whole brain analyses of the collective impact of the variations in illuminance over the hypothalamus area - for illustration. A local positive peak (red; puncorrected <0.001) was detected over the posterior hypothalamus subpart (light blue) in executive (E) and emotional (G). A local negative peak (red; puncorrected <0.001) was detected over the inferior-tubular hypothalamus subparts (light orange) during the executive task (D), while local negative peak (red; puncorrected <0.001) was detected over the inferior-anterior (yellow) and superior-anterior (blue) hypothalamus subparts during the emotional task (F) – insets correspond to enlargements over the hypothalamus area. Arrows from panels B and C arise from and are colour coded according to the hypothalamus subpart that is displayed in panels D to G. These results indicate that our finding does not arise from a nearby ‘leaking’ activation/deactivation. (H–K) Estimates of the impact of each illuminance on the activity of the hypothalamus subparts. (Refer for Table 2 and Supplementary file 1c–f for full statistics) Activity dynamics across illuminance for each subpart (colour code as in A). Results are displayed per task or stimulus type although no interactions with task or stimulus type were detected. Significant illuminance-by-hypothalamus-subpart interactions were detected for (H, I) the executive task (p=0.041) and (J, K) the emotional task (p=0.041). Small letter indicate significant difference (p<0.05) between the following subparts at illuminance: a. 92 mel EDI lux: posterior vs. superior-anterior & inferior-tubular; b. 190 mel EDI lux: posterior vs. inferior-anterior, superior-anterior and inferior-tubular; c. 0 mel EDI lux: posterior vs. superior-tubular; d. 92 mel EDI lux: posterior vs. superior-anterior; superior-anterior vs. superior-tubular; e. 190 mel EDI lux: posterior vs. inferior-anterior, superior-anterior and inferior-tubular; superior-tubular vs. superior-anterior, inferior-tubular and inferior-anterior. Means +- standard deviations are plotted.
Figure 3
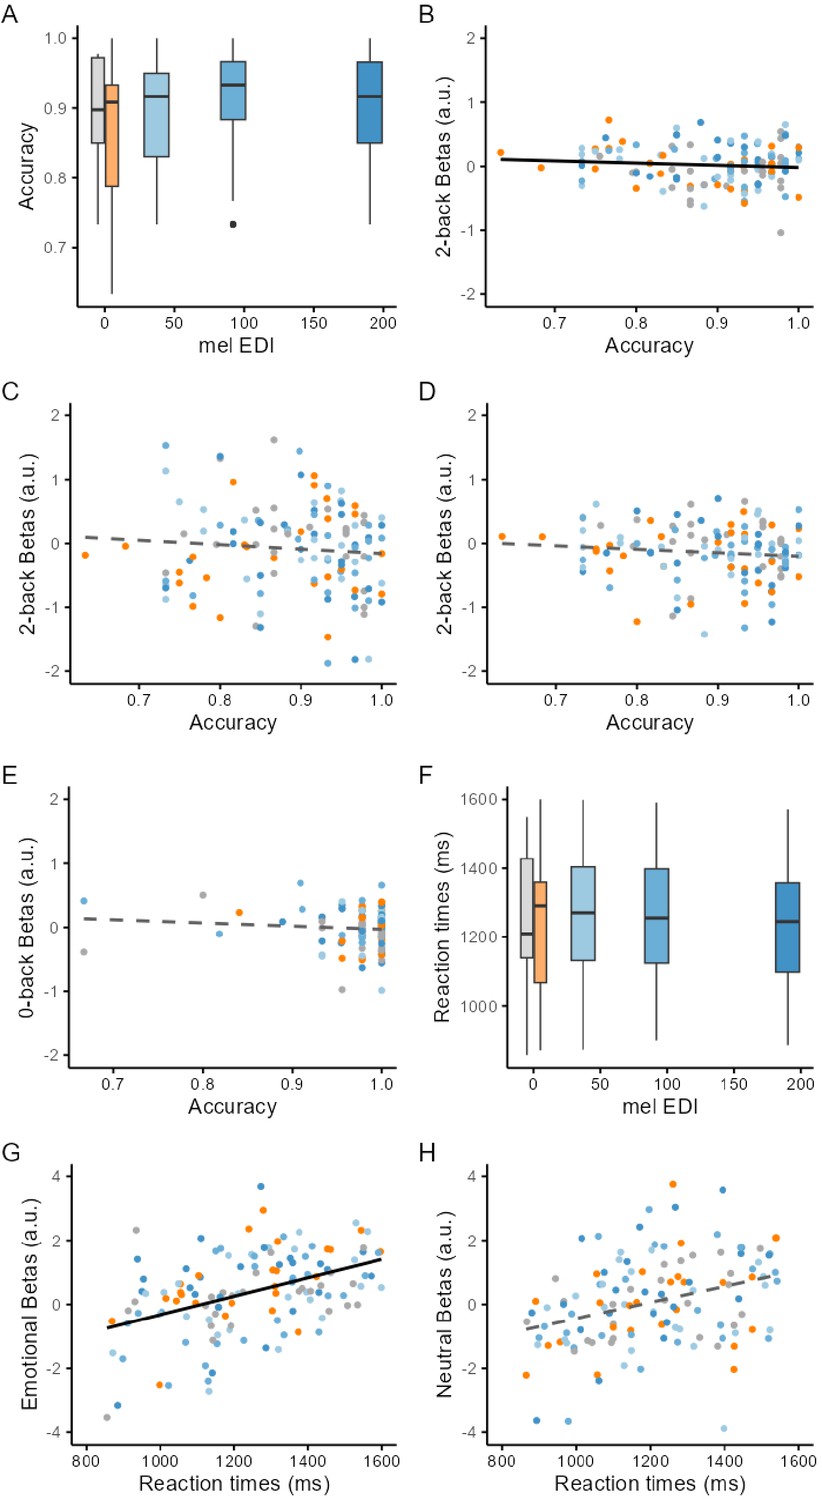
Impact of illuminance on performance and relationships with the activity of the posterior hypothalamus subpart.
(A) Accuracy (percentage of correct responses) to the 2-back increased with increasing illuminance (p=0.034). (B) Accuracy to the 2-back task is negatively correlated to the activity of the posterior hypothalamus subpart (p=0.0027). (C, D) Accuracy to the 2-back task is not correlated to the activity of the inferior-anterior (C) and inferior-tubular (D) hypothalamus subparts (p>0.4). Association between superior-anterior and superior-tubular subparts are not displayed but were not significant (p>0.6). See Supplementary file 1g for full details. (E) Accuracy to the 0-back task is not correlated to the activity of the posterior hypothalamus subpart (p=0.45). (F) Reaction times to the emotional stimuli did not significantly change with increasing illuminance (p=0.41). (G) Reaction times to the emotional stimuli are correlated to the activity of the posterior hypothalamus subpart (p=0.04) with higher activity associated to slower reaction times. (H) Reaction times to the neutral stimuli are not correlated to the activity of the posterior hypothalamus subpart (p=0.6). Box plots: horizontal line = median; box = higher/lower quartiles: vertical line = maximum/minimum. Regression plots: solid and dashed lines correspond to the significant and not significant linear regression lines, respectively.
Author response image 1

Activity estimate variability per hypothalamus subpart and subpart size.
Tables
Table 1
Differences between hypothalamus subparts in the collective impact of the variation in illuminance on their activity.
| Executive task | |||||||
|---|---|---|---|---|---|---|---|
| Main GLMM | Pairwise comparisons | ||||||
| Effect | F value (df) | p value* | Partial R2 | Contrast† | t-value | Puncorrected | Pcorrected |
| Hypothalamus subparts | 4.36 (4,225) | 0.002 | 0.08 | 1 vs 2 | –0.30 | 0.76 | 0.99 |
| 1 vs 3 | –3.48 | 0.0006 | 0.0056 | ||||
| 1 vs 4 | <0.01 | 0.99 | 1 | ||||
| Task | 0.74 (1,25) | 0.4 | 1 vs 5 | –0.57 | 0.57 | 0.98 | |
| Hypothalamus subparts x task type | 0.68 (4,225) | 0.61 | 2 vs 3 | –3.17 | 0.0017 | 0.015 | |
| 2 vs 4 | 0.31 | 0.76 | 0.99 | ||||
| 2 vs 5 | –0.27 | 0.79 | 0.99 | ||||
| Age | 0.33 (1,22) | 0.57 | 3 vs 4 | 3.48 | 0.0006 | 0.0055 | |
| BMI | 0.59 (1,22) | 0.45 | 3 vs 5 | 2.54 | 0.0041 | 0.033 | |
| Sex | 0.01 (1,22) | 0.91 | 4 vs 5 | –0.5 | 0.57 | 0.98 | |
| Emotional task | |||||||
| Main GLMM | Pairwise comparisons | ||||||
| Effect | F Value | p value* | Partial R2 | Contrast† | t-value | Puncorrected | Pcorrected |
| Hypothalamus subparts | 9.38 (4,194) | <.0001 | 0.22 | 1 vs 2 | 0.67 | 0.67 | 0.99 |
| 1 vs 3 | –4.76 | <0.0001 | <0.0001 | ||||
| 1 vs 4 | 0.00 | 0.99 | 1 | ||||
| Task | 4.33 (1,25) | 0.048 | 0.15 | 1 vs 5 | –1.88 | 0.06 | 0.33 |
| Hypothalamus subparts x stimulus type | 0.5 (4,194) | 0.74 | 2 vs 3 | –5.43 | <0.0001 | 0.0001 | |
| 2 vs 4 | –0.66 | 0.51 | 0.96 | ||||
| 2 vs 5 | –2.54 | 0.012 | 0.086 | ||||
| Age | 0.43 (1,22) | 0.52 | 3 vs 4 | 4.76 | <0.0001 | <0.0001 | |
| BMI | 0.05 (1,22) | 0.83 | 3 vs 5 | 2.85 | 0.0048 | 0.038 | |
| Sex | 1.47 (1,22) | 0.24 | 4 vs 5 | –1.88 | 0.061 | 0.32 | |
-
Outputs of the generalized linear mixed model (GLMM) with subject as the random factor (intercept and slope), and task and subpart as repeated measures (ar(1) autocorrelation).
-
*
The corrected p-value for multiple comparisons over 2 tests is p < 0.025.
-
†
Refer to Figure 2A for correspondence of subpart number.
Table 2
Statistical outputs of GLMM testing for differences between the activity of each subpart of the hypothalamus under each illuminance.
| Executive task | |||||||
|---|---|---|---|---|---|---|---|
| Main GLMM | Comparisons between subparts per illuminance† | ||||||
| Effect | F-value (df) | P value | Partial R² | Illuminance* | contrast | t-value | p-value |
| Subpart | 1.4 (4,228) | 0.23 | 92 | 2 vs 3 | –2.25 | 0.025 | |
| Illuminance | 2.15 (4,1017) | 0.073 | 92 | 3 vs 4 | 2.58 | 0.01 | |
| 190 | 1 vs 3 | –2.80 | 0.0053 | ||||
| Task | 3.24 (1,228) | 0.073 | 190 | 2 vs 3 | –2.24 | 0.025 | |
| Subpart x Illuminance | 1.7 (16,1017) | 0.041 | 0.09 | 190 | 3 vs 4 | 3.15 | 0.0017 |
| Age | 1.19 (1,22) | 0.29 | |||||
| BMI | 0.01 (1,22) | 0.9 | |||||
| Sex | 0.38 (1,22) | 0.54 | |||||
| Emotional task | |||||||
| Main GLMM | Comparisons between subparts per illuminance† | ||||||
| Effect | F-value (df) | p value | Partial R² | Illuminance* | contrast | t-value | p-value |
| Subpart | 4.29 (4,229) | 0.0023 | 0.07 | 0 | 3 vs 5 | –2.05 | 0.04 |
| 92 | 2 vs 3 | –2.53 | 0.012 | ||||
| Illuminance | 9.41 (4,1020) | <0.0001 | 0.035 | 92 | 2 vs 5 | –2.96 | 0.0032 |
| 190 | 1 vs 3 | –3.31 | 0.001 | ||||
| 190 | 2 vs 3 | –4.75 | <0.0001 | ||||
| Task | 0.13 (1,229) | 0.72 | 190 | 1 vs 5 | –2.5 | 0.013 | |
| 190 | 2 vs 5 | –4.04 | <0.0001 | ||||
| 190 | 3 vs 4 | 3.13 | 0.0018 | ||||
| Subpart x Illuminance | 1.7 (16,1020) | 0.041 | 0.026 | 190 | 4 vs 5 | –2.32 | 0.021 |
| Age | 0.59 (1,22) | 0.45 | |||||
| BMI | 1.54 (1,22) | 0.23 | |||||
| Sex | 0.05 (1,22) | 0.83 | |||||
-
*
illuminance in mel EDI lux.
-
†
Only significant comparisons are reported in the main text. For the full table, including post hocs comparing light levels within a subpart, refer to Supplementary file 1c–g.
Author response table 1
Recomputations of the main GLMMs using subpart sizes rather than subpart numbers as covariate of interest.
| Executive task | |||
|---|---|---|---|
| Main GLMM | |||
| Effect | F value (df) | P value* | Partial R ^(2) |
| Subpart size | 4.36,(4,200) | 0.0021 | 0.08 |
| Task | 0.74,(1,25) | 0.4 | |
| Subpart size x task type | 0.68,(4,200) | 0.61 | |
| Age | 0.33,(1,22) | 0.57 | |
| BMI | 0.59,(1,22) | 0.45 | |
| Sex | 0.01,(1,22) | 0.91 | |
| Emotional task | |||
| Main GLMM | |||
| Effect | F Value | P value* | Partial R ^(2) |
| Subpart size | 9.64,(4,193) | < .0001 | 0.17 |
| Task | 4.55,(1,25) | 0.043 | 0.15 |
| Subpart size x stimulus type | 0.41,(4,193) | 0.8 | |
| Age | 0.4(1,22) | 0.53 | |
| BMI | 0.02,(1,22) | 0.89 | |
| Sex | 1.37,(1,22) | 0.25 |
Author response table 2
Difference in activity estimate standard deviation between hypothalamus subparts during the n-back task.
| Subpart number (GLMM) | |||
|---|---|---|---|
| Effect | F value (df) | P value ^(**) | Partial R ^(2) |
| Hypothalamus subparts | 32.3 (4,260) | < 0.0001 | 0.33 |
| Task | < 0.001 (1,23) | 0.97 | |
| Hypothalamus subparts x task type | 0.03 (4,260) | 0.99 | |
| Post hocs | |||
| subpart | T value | p | P |
| 1 vs. 2 | 5.24 | < .0001 | < .0001 |
| 1 vs. 3 | 0.30 | 0.77 | 0.99 |
| 1 vs. 4 | 1.47 | 0.14 | 0.58 |
| 1 vs. 5 | -5.92 | < .0001 | < .0001 |
| 2 vs. 3 | -4.95 | < .0001 | < .0001 |
| 2 vs. 4 | -3.77 | 0.0002 | 0.0019 |
| 2 vs. 5 | -11.17 | < .0001 | < .0001 |
| 3 vs. 4 | 1.18 | 0.24 | 0.77 |
| 3 vs. 5 | -6.22 | < .0001 | < .0001 |
| 4 vs. 5 | -7.39 | < .0001 | < .0001 |
Additional files
-
Supplementary file 1
Online supplementary information.
(a) Demographics of study sample. (b) Light characteristics. (c) Post hoc contrasts between illuminances within each hypothalamus subpart during the executive task. (d) Post hoc contrasts between illuminances within each hypothalamus subpart during the emotional task. (e) Post hoc contrasts between hypothalamus subpart for each illuminance during the executive task. (f) Post hoc contrasts between hypothalamus subpart for each illuminance during the emotional task. (g) Association between performance to the 2-back task and the activity of each hypothalamus subpart during each illuminance.
- https://cdn.elifesciences.org/articles/96576/elife-96576-supp1-v1.docx
-
MDAR checklist
- https://cdn.elifesciences.org/articles/96576/elife-96576-mdarchecklist1-v1.pdf
Download links
A two-part list of links to download the article, or parts of the article, in various formats.
Downloads (link to download the article as PDF)
Open citations (links to open the citations from this article in various online reference manager services)
Cite this article (links to download the citations from this article in formats compatible with various reference manager tools)
Regional response to light illuminance across the human hypothalamus
eLife 13:RP96576.
https://doi.org/10.7554/eLife.96576.3


