The protective roles of eugenol on type 1 diabetes mellitus through NRF2-mediated oxidative stress pathway
- Department of Pediatrics, the Second Affiliated Hospital and Yuying Children’s Hospital of Wenzhou Medical University, China
- Basic Medical Research Center, the Second Affiliated Hospital and Yuying Children’s Hospital of Wenzhou Medical University, China
- Department of General Surgery, the Second Affiliated Hospital and Yuying Children’s Hospital of Wenzhou Medical University, China
- Department of Genaral Surgery, the Quzhou Affiliated Hospital of Wenzhou Medical University, Quzhou People’s Hospital, China
- Key Laboratory of Children Genitourinary Diseases of Wenzhou, the Second Affiliated Hospital and Yuying Children’s Hospital of Wenzhou Medical University, China
- Key Laboratory of Structural Malformations in Children of Zhejiang Province, the Second Affiliated Hospital and Yuying Children’s Hospital of Wenzhou Medical University, China
Figures
Figure 1 with 1 supplement
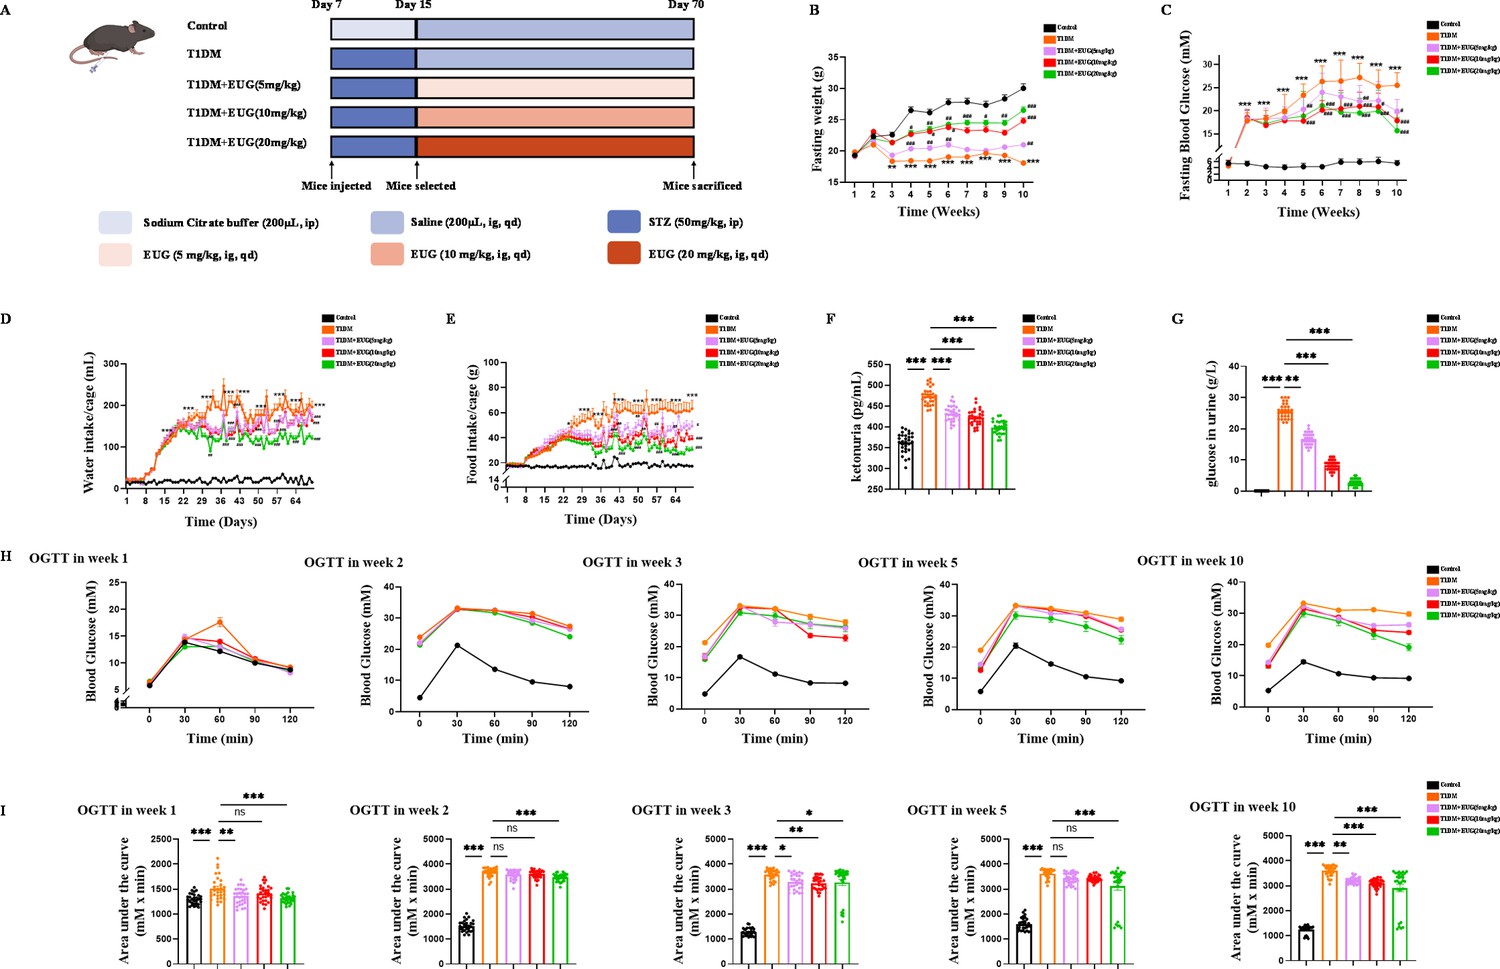
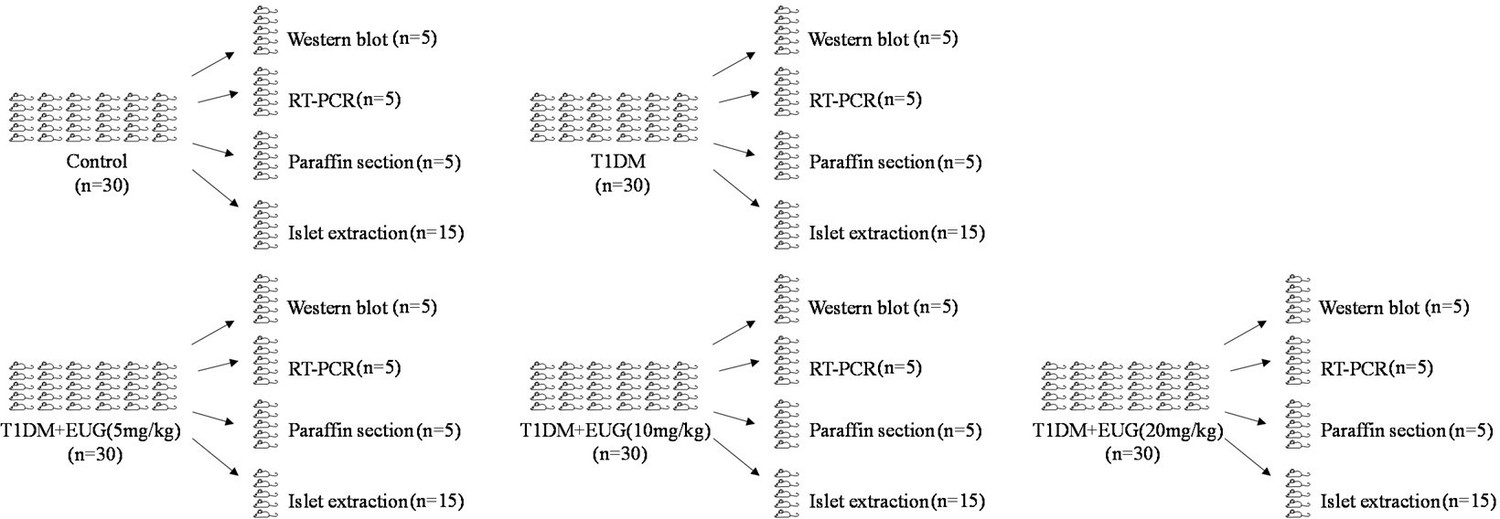
The eugenol (EUG) treatment effectively alleviated symptoms associated with type 1 diabetes mellitus (T1DM) mice.
(A) The schematic diagram depicts the progress of animal experiments in each group of mice. Different colors indicate different treatments for mice. (B) The fasting weight levels of mice were measured weekly in each group (n=30 mice). (C) The fasting blood glucose levels of mice were measured weekly in each group (n=30 mice). (D) The water intake/cage in each group of mice (n=6 cages, 5 mice/cage). (E) The food intake/cage in each group of mice (n=6 cages, 5 mice/cage). (F) Urine ketones in each group were detected by enzyme-linked immunosorbent assay (ELISA) (n=30 mice). (G) The urine glucose levels of mice were measured by biochemical test in each group of mice (n=30 mice). (H) The curve graph of oral glucose tolerance test (OGTT) from 0 min to 120 min at week 1, week 2, week 3, week 5, and week 10 (n=30 mice). (I) The quantitative results of OGTT at week 1, week 2, week 3, week 5, and week 10 (n=30 mice). Mean ± SEM. All experiments were repeated at least three times independently. Compare with the Control group *p<0.05, compare with the Control group **p<0.01 compare with the Control group ***p<0.001, compare with the T1DM group #p<0.05, compare with the T1DM group ##p<0.01, compare with the T1DM group ##p<0.001 indicate significant differences, and ns>0.05 means no significance difference. One-way ANOVA.
Figure 1—figure supplement 1
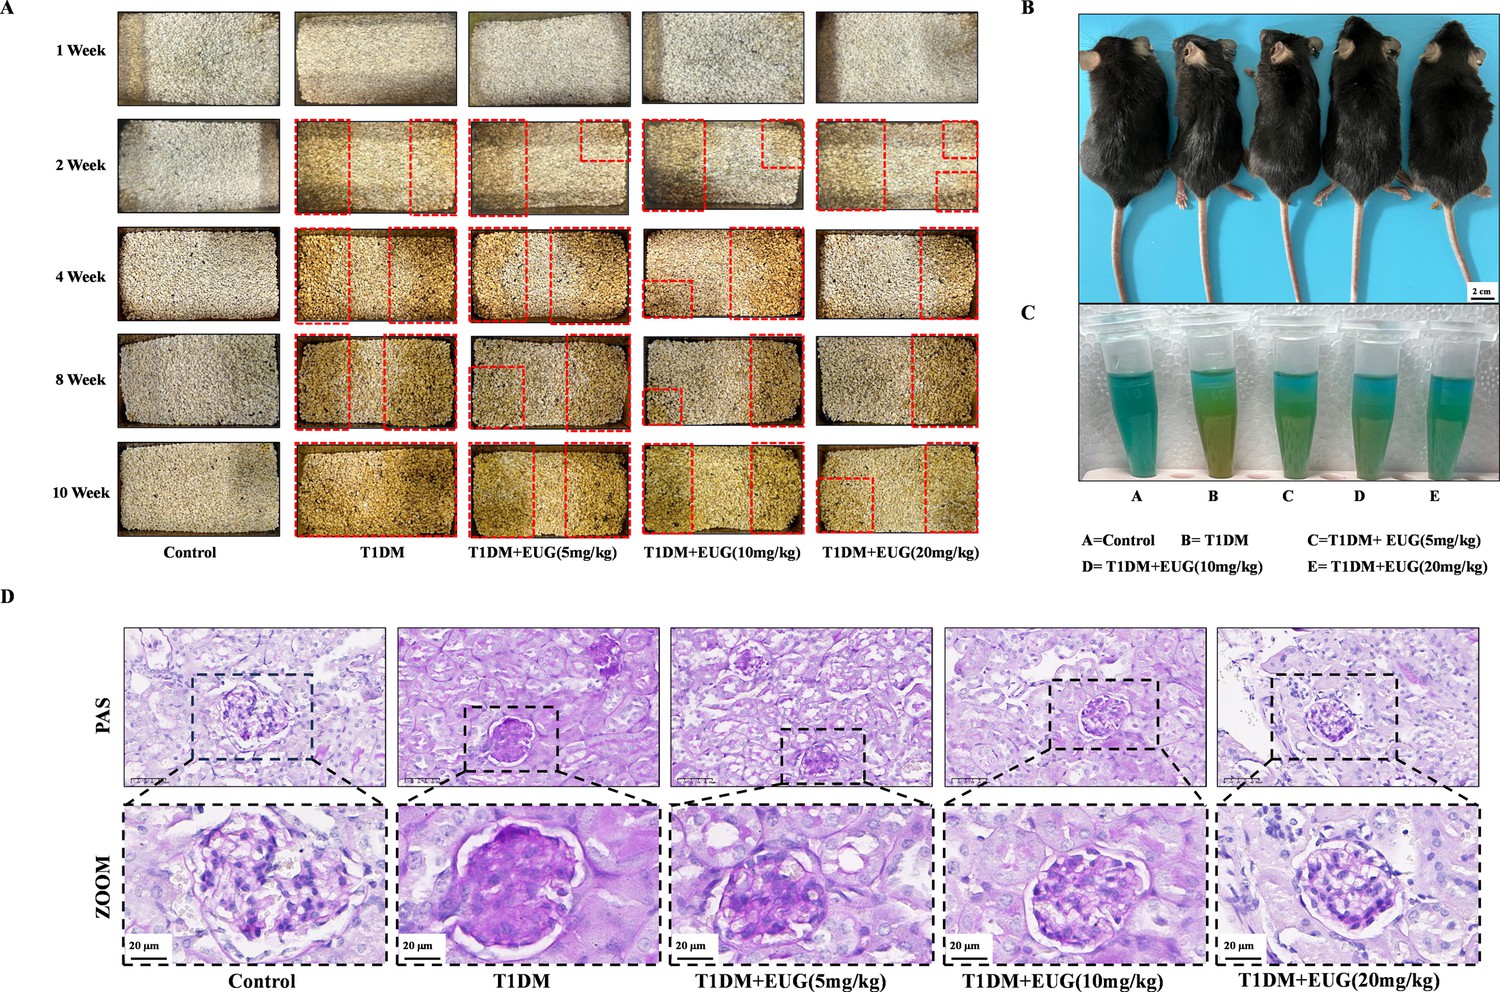
Eugenol (EUG) alleviated the related complications in type 1 diabetes mellitus (T1DM) mice.
(A) The changes of urine wetting area of bedding material of mice in each group at different time points were recorded. (B) External appearance and body transformation in each group of mice (n=5 independently repeated experiments). Scale bar 2 cm. (C) The qualitative determination of urine glucose in each group of mice (n=5 independently repeated experiments). The shade of orange represents the concentration of glucose in the urine. (D) The periodic acid-Schiff (PAS) staining images of glomerulus paraffin sections in each group of mice. Mean ± SEM. *p<0.05, **p<0.01, ***p<0.001 indicate significant differences, and ns>0.05 means no significance difference. One-way ANOVA. Scale bars 50 µm, 20 µm.
Figure 2
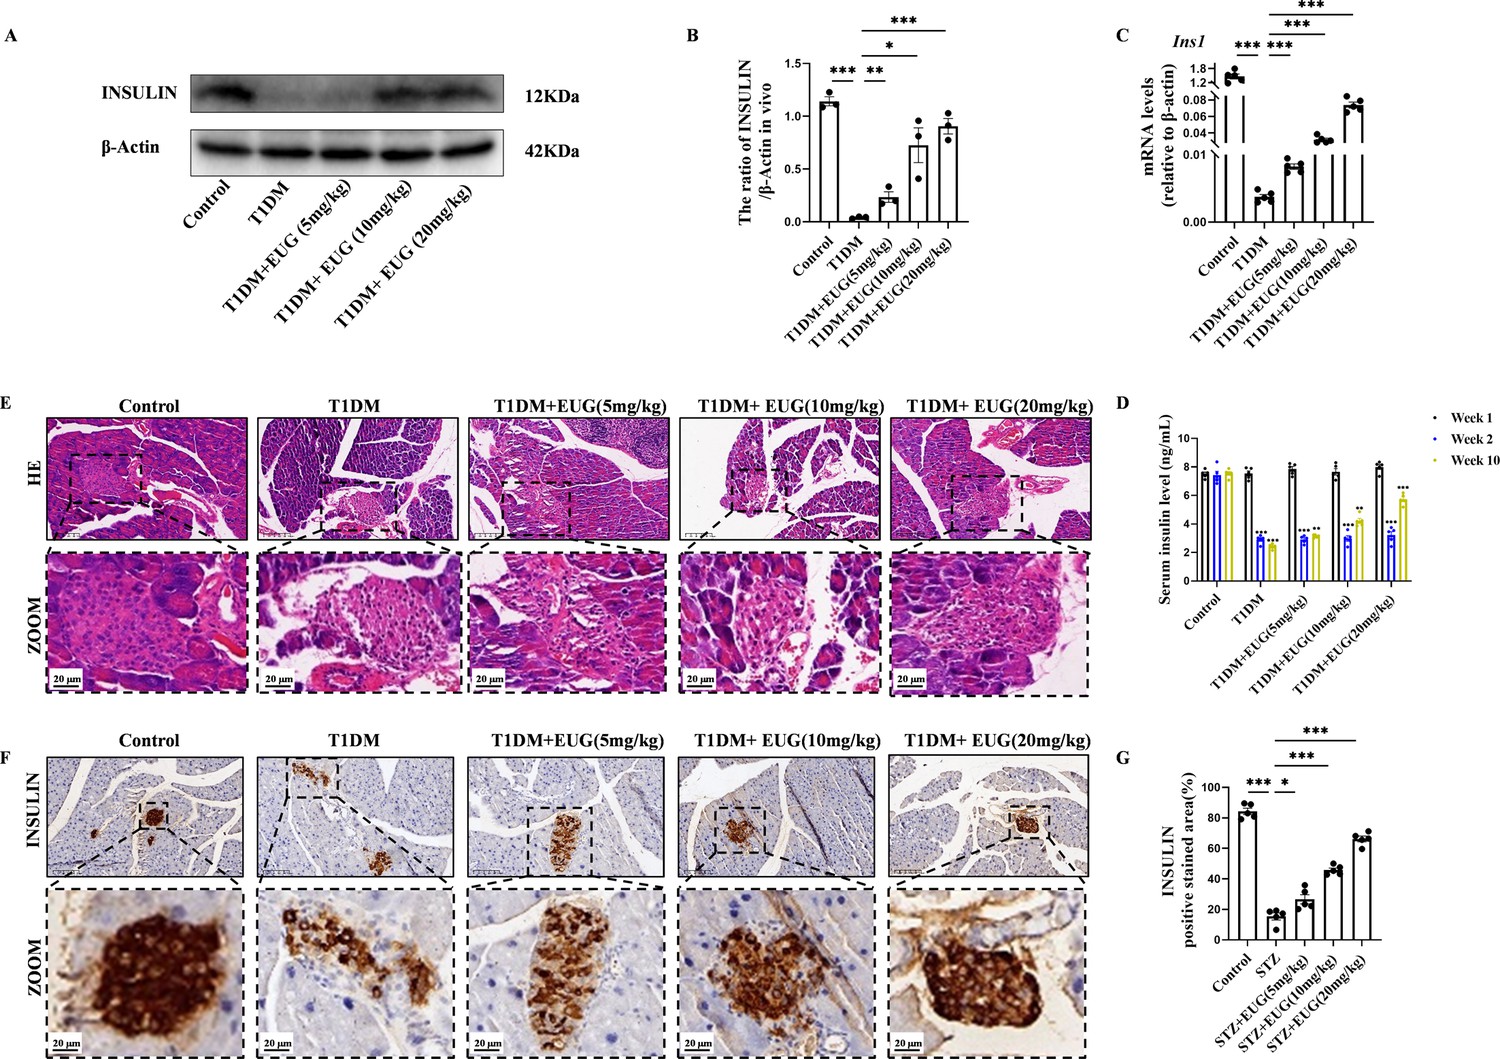
Eugenol (EUG) improved the pancreas islet structure and function in type 1 diabetes mellitus (T1DM) mice.
(A) The detection of insulin expression in different groups using western blot. (B) The quantification of western blot gel bands in different groups (n=3 independently repeated experiments). (C) The gene levels of Ins1 in different groups (n=5 independently repeated experiments). (D) Enzyme-linked immunosorbent assay (ELISA) analysis of serum fasting insulin levels at different time points (n=5 independently repeated experiments). (E) The representative hematoxylin and eosin (H&E) staining images of pancreatic paraffin sections in each group of mice. Scale bars 50 µm, 20 µm. (F) The representative immumohistochemical staining of insulin in pancreas islet in each group of mice. Scale bars 50 µm, 20 µm. (G) The quantitative analysis of immumohistochemical staining (n=5 independently repeated experiments). Mean ± SEM. *p<0.05, **p<0.01, ***p<0.001 indicate significant differences, and ns>0.05 means no significance difference. One-way ANOVA.
-
Figure 2—source data 1
Raw unedited gels for Figure 2.
- https://cdn.elifesciences.org/articles/96600/elife-96600-fig2-data1-v1.pdf
-
Figure 2—source data 2
Uncropped and labeled gels for Figure 2.
- https://cdn.elifesciences.org/articles/96600/elife-96600-fig2-data2-v1.zip
Figure 3 with 1 supplement
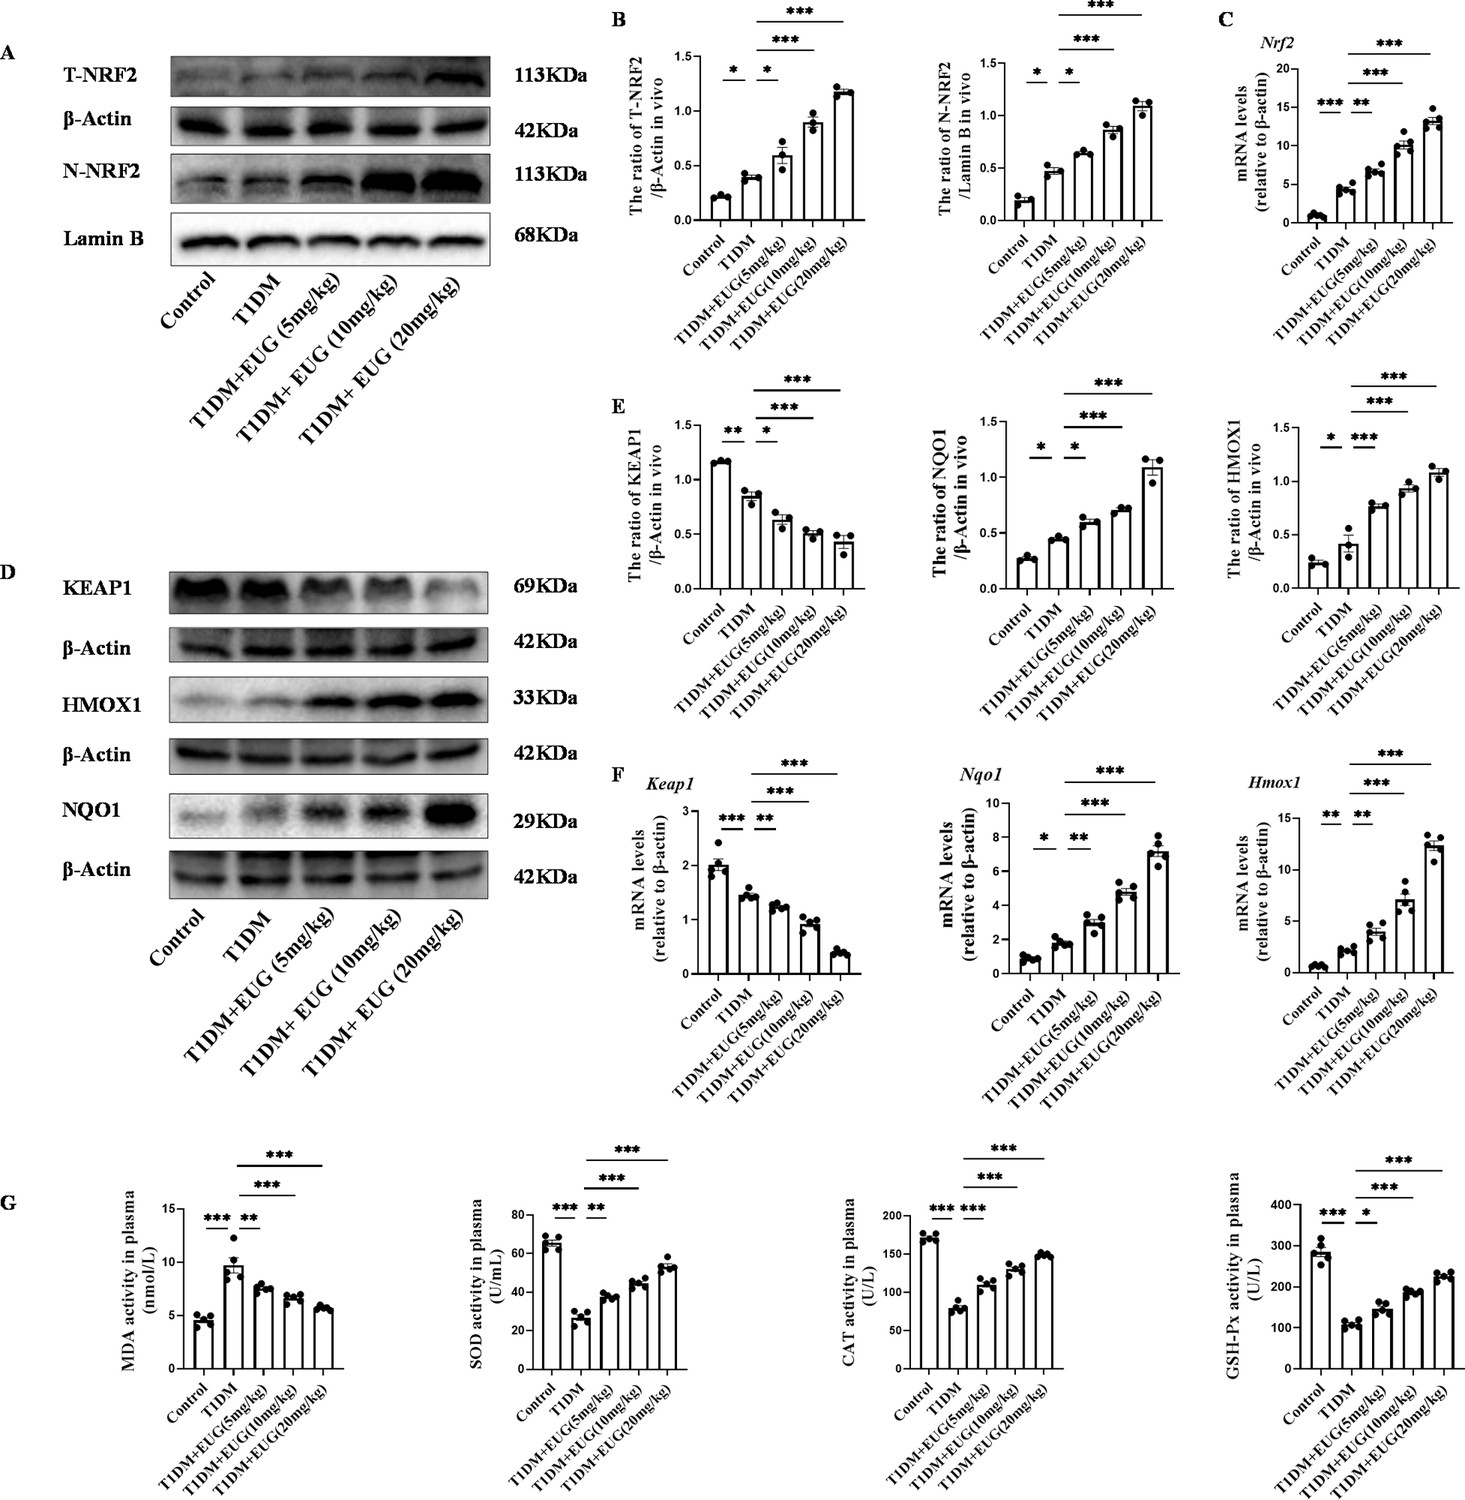
Eugenol (EUG) attenuated excessive oxidative stress through activating nuclear factor E2-related factor 2 (NRF2) signaling pathway in type 1 diabetes mellitus (T1DM) mice.
(A) The detection of T-NRF2, N-NRF2 expression in different groups using western blot. (B) The quantification of western blot gel bands in different groups (n=3 independently repeated experiments). (C) The gene levels of Nrf2 in different groups (n=5 independently repeated experiments). (D) The detection of KEAP1, HMOX1, and NQO1 expression in different groups using western blot. (E) The quantification of western blot gel bands in different groups (n=3 independently repeated experiments). (F) The gene levels of Keap1, Nqo1, and Hmox1 in different groups (n=5 independently repeated experiments). (G) The levels of serum biochemical indexes (malondialdehyde [MDA], superoxide dismutase [SOD], catalase [CAT], and glutathione peroxidase [GSH-Px]) in each group of mice (n=5 independently repeated experiments). Mean ± SEM. *p<0.05, **p<0.01, ***p<0.001 indicate significant differences, and ns>0.05 means no significance difference. One-way ANOVA.
-
Figure 3—source data 1
Raw unedited gels for Figure 3.
- https://cdn.elifesciences.org/articles/96600/elife-96600-fig3-data1-v1.pdf
-
Figure 3—source data 2
Uncropped and labeled gels for Figure 3.
- https://cdn.elifesciences.org/articles/96600/elife-96600-fig3-data2-v1.zip
Figure 3—figure supplement 1
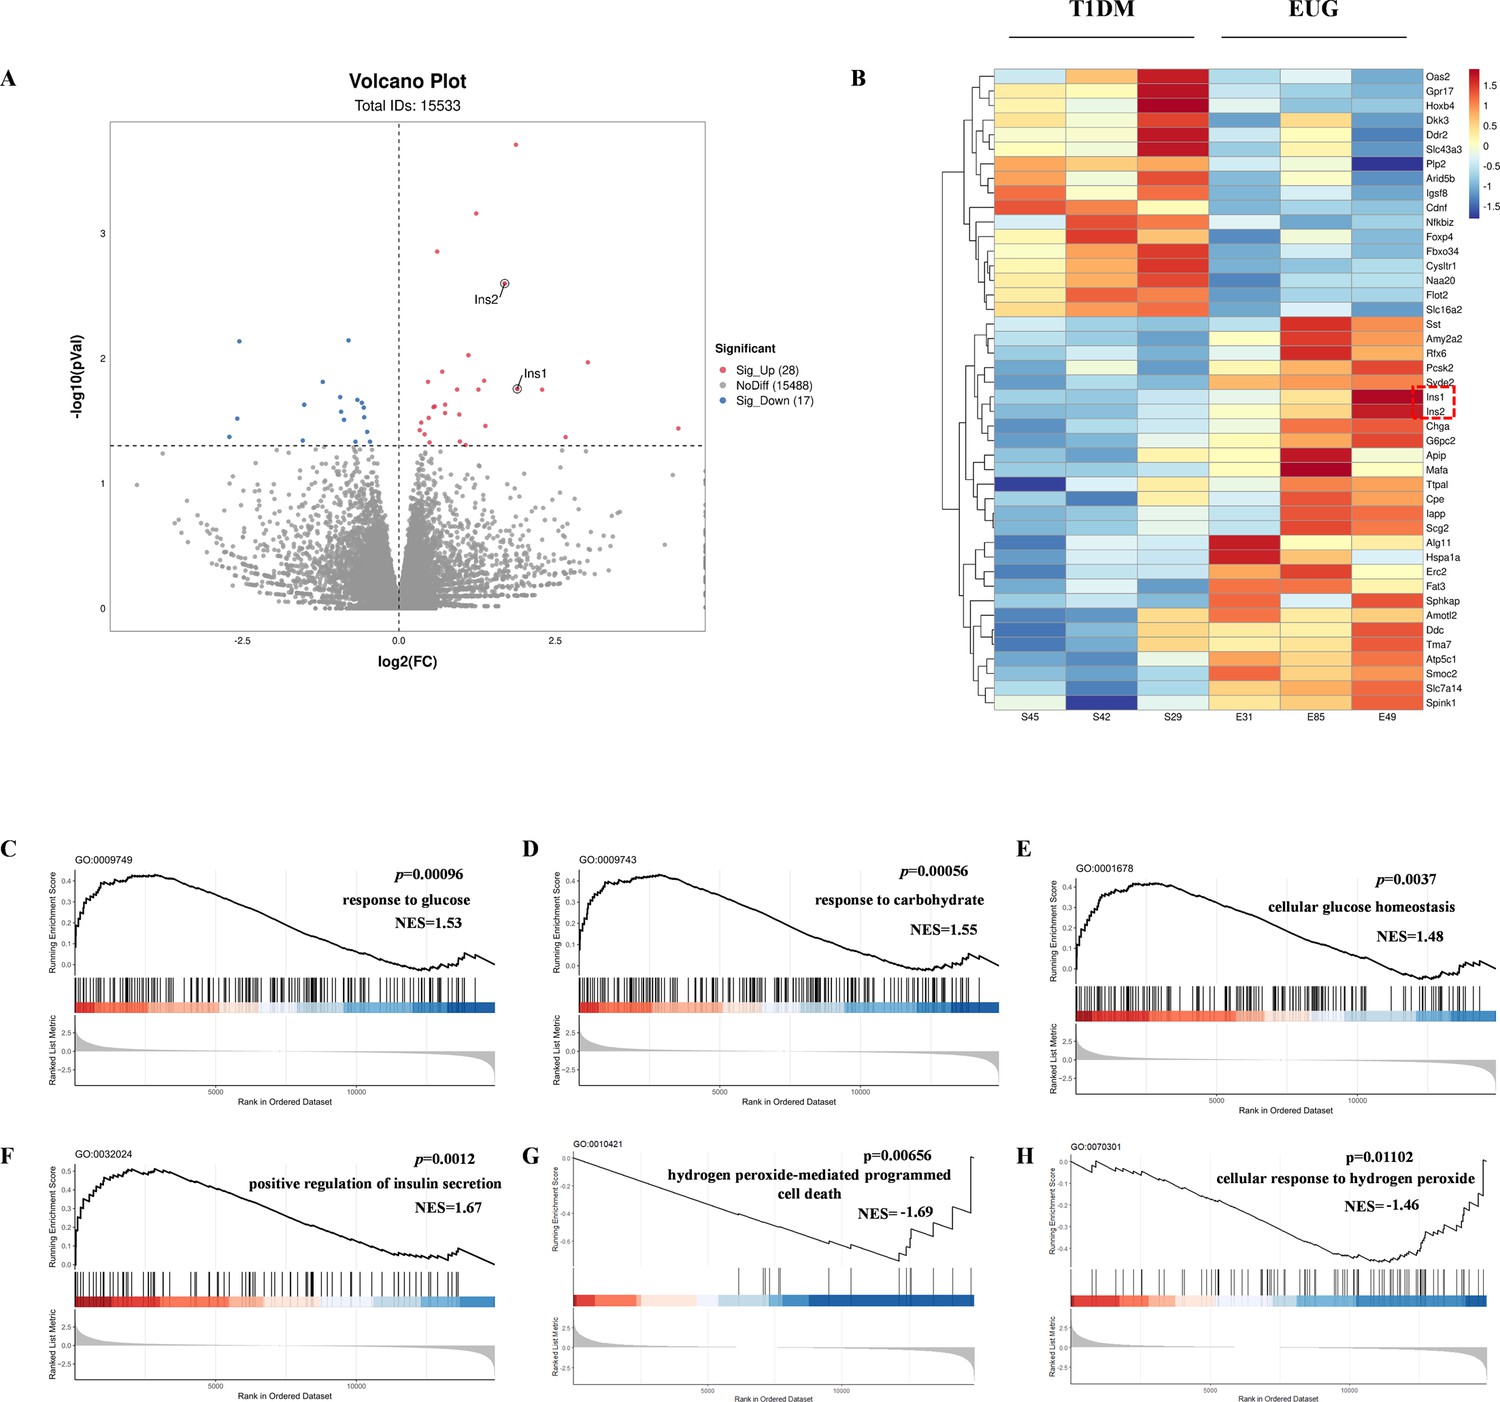
Statistical map of mRNA differential expression between type 1 diabetes mellitus (T1DM) group and eugenol (EUG) intervention group.
(A) The volcanic map shows the distribution of differential factors. (B) Differential expression cluster heat map, with red indicating up-regulated gene expression and blue indicating down-regulated gene expression. (C–H) Gene set enrichment analysis (GSEA) enrichment curve of C: ‘response to glucose’ pathway; D: response to carbohydrate pathway; E: ‘cellular glucose homeostasis’ pathway; F: ‘positive regulation of insulin secretion’ pathway; G: ‘hydrogen peroxide-mediated programmed cell death’ pathway; H: ‘cellular response to hydrogen peroxide’ pathway. The curve represents the cumulative enrichment score (ES), the vertical axis represents the enrichment score, each bar code on the horizontal axis represents a gene, and the color change represents the contribution of that gene to the enrichment score.
Figure 4
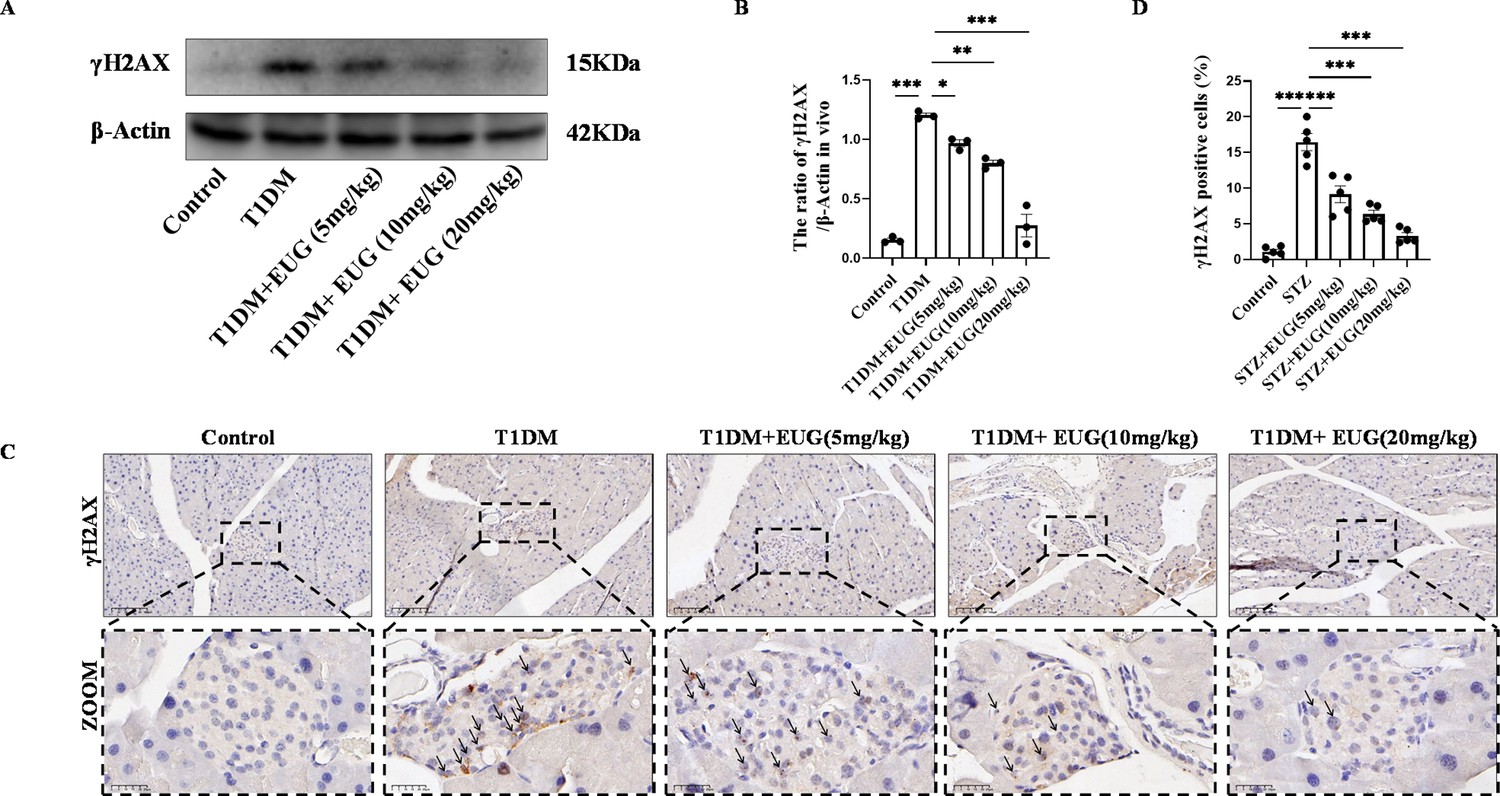
Eugenol (EUG) decreased the expression level of γH2AX in type 1 diabetes mellitus (T1DM) mice.
(A) The detection of γH2AX expression in different groups using western blot. (B) The quantification of western blot gel bands in different groups (n=3 independently repeated experiments). (C) The representative immumohistochemical staining of γH2AX in pancreas islet in each group of mice. Black arrows were employed to highlight the presence of brown-stained islet β cells. Scale bars 100 µm, 25 µm. (D) The quantitative analysis of immumohistochemical staining (n=5 independently repeated experiments). Mean ± SEM. *p<0.05, **p<0.01, ***p<0.001 indicate significant differences, and ns>0.05 means no significance difference. One-way ANOVA.
-
Figure 4—source data 1
Raw unedited gels for Figure 4.
- https://cdn.elifesciences.org/articles/96600/elife-96600-fig4-data1-v1.pdf
-
Figure 4—source data 2
Uncropped and labeled gels for Figure 4.
- https://cdn.elifesciences.org/articles/96600/elife-96600-fig4-data2-v1.zip
Figure 5
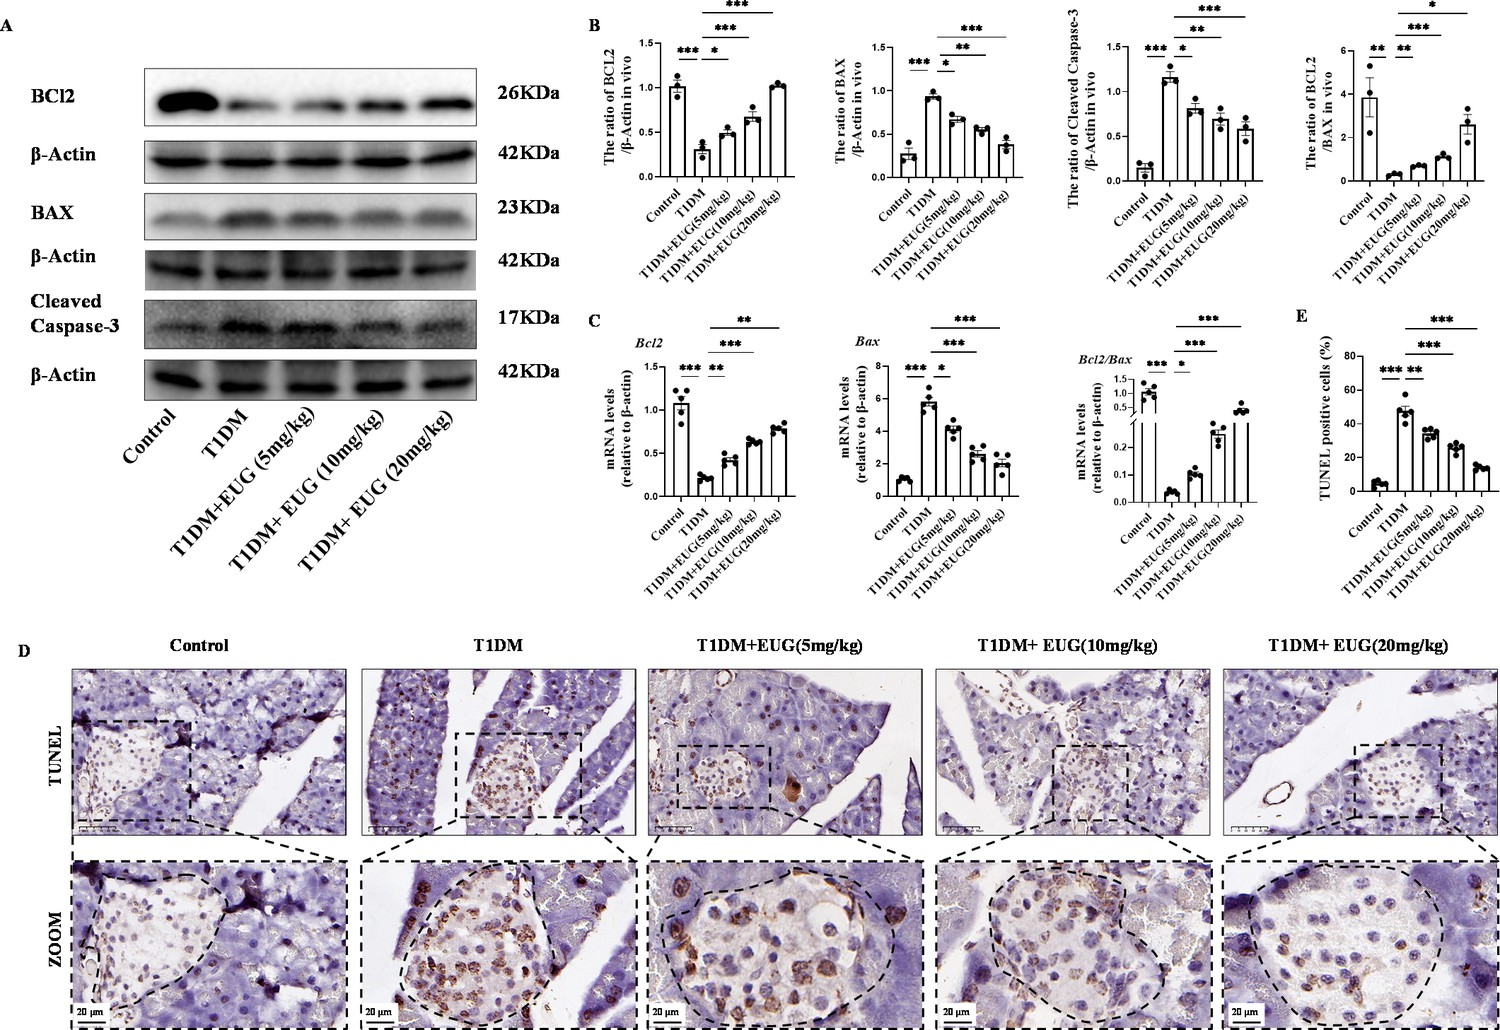
Eugenol (EUG) reduced apoptosis of pancreatic β cells in type 1 diabetes mellitus (T1DM) mice.
(A) The detection of BCL2, BAX, Cleaved Caspase-3 expression in different groups using western blot. (B) The quantification of western blot gel bands in different groups (n=3 independently repeated experiments). (C) The gene levels of Bax, Bcl2, and Bcl2/Bax in different groups (n=5 independently repeated experiments). (D) The immumohistochemical staining of TUNEL in pancreas islet in each group of mice. Scale bars 50 µm, 20 µm. (E) The quantification results of TUNEL staining in different groups (n=5 independently repeated experiments). Mean ± SEM. *p<0.05, **p<0.01, ***p<0.001 indicate significant differences, and ns>0.05 means no significance difference. One-way ANOVA.
-
Figure 5—source data 1
Raw unedited gels for Figure 5.
- https://cdn.elifesciences.org/articles/96600/elife-96600-fig5-data1-v1.pdf
-
Figure 5—source data 2
Uncropped and labeled gels for Figure 5.
- https://cdn.elifesciences.org/articles/96600/elife-96600-fig5-data2-v1.zip
Figure 6 with 1 supplement
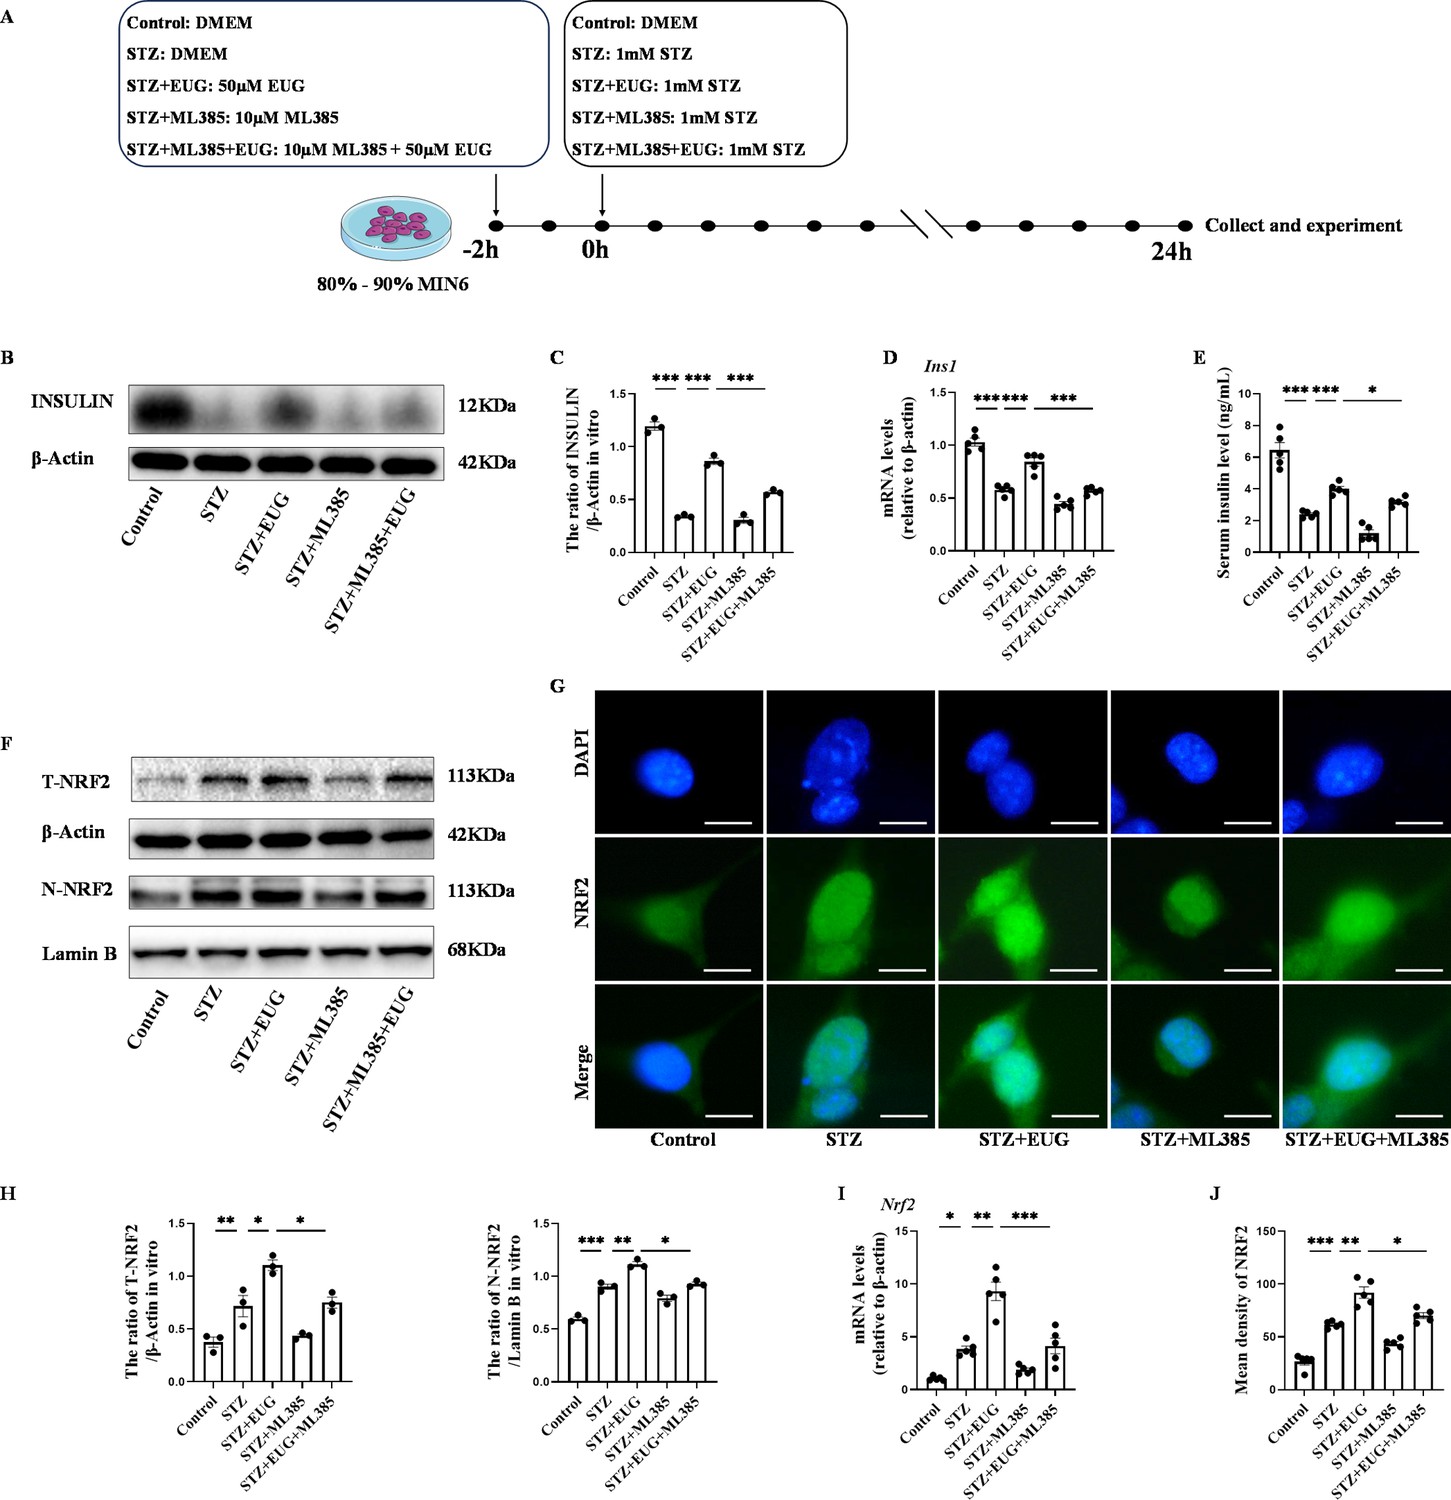
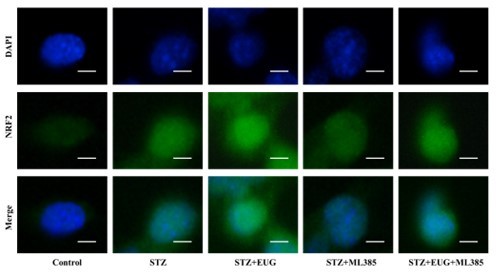
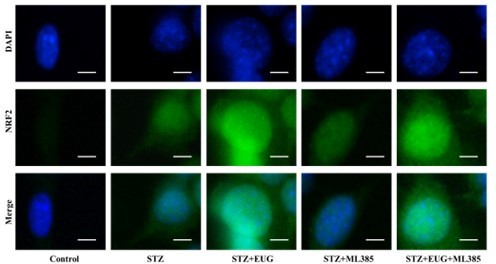
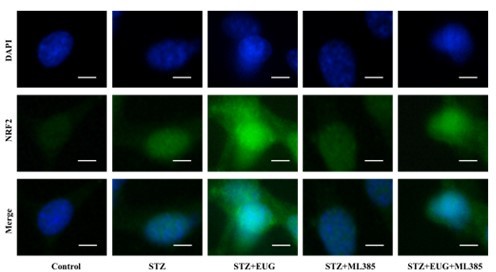
Eugenol (EUG) improved streptozotocin (STZ)-induced MIN6 cells insulin secretion by facilitating nuclear factor E2-related factor 2 (NRF2) nuclear translocation in vitro.
(A) The schematic diagram depicts the different interventions in cell experiments in MIN6 cells. (B) The detection of insulin expression in different groups using western blot. (C) The quantification of western blot gel bands in different groups (n=3 independently repeated experiments). (D) The gene levels of Ins1 in different groups (n=5 independently repeated experiments). (E) Enzyme-linked immunosorbent assay (ELISA) analysis of serum insulin levels of MIN6 cell in different groups (n=5 independently repeated experiments). (F) The detection of T-NRF2, N-NRF2 expression in different groups using western blot. (G) The representative immunofluorescence staining images of NRF2 (green) in each group of MIN6 cells. Nuclei were stained with DAPI (blue). Scale bar 10 μm. (H) The quantification of western blot gel bands in different groups (n=3 independently repeated experiments). (I) The gene levels of Nrf2 in different groups (n=5 independently repeated experiments). (J) The quantification of immunofluorescence staining in different groups (n=5 independently repeated experiments). Mean ± SEM. *p<0.05, **p<0.01, ***p<0.001 indicate significant differences, and ns>0.05 means no significance difference. One-way ANOVA.
-
Figure 6—source data 1
Raw unedited gels for Figure 6.
- https://cdn.elifesciences.org/articles/96600/elife-96600-fig6-data1-v1.pdf
-
Figure 6—source data 2
Uncropped and labeled gels for Figure 6.
- https://cdn.elifesciences.org/articles/96600/elife-96600-fig6-data2-v1.zip
Figure 6—figure supplement 1
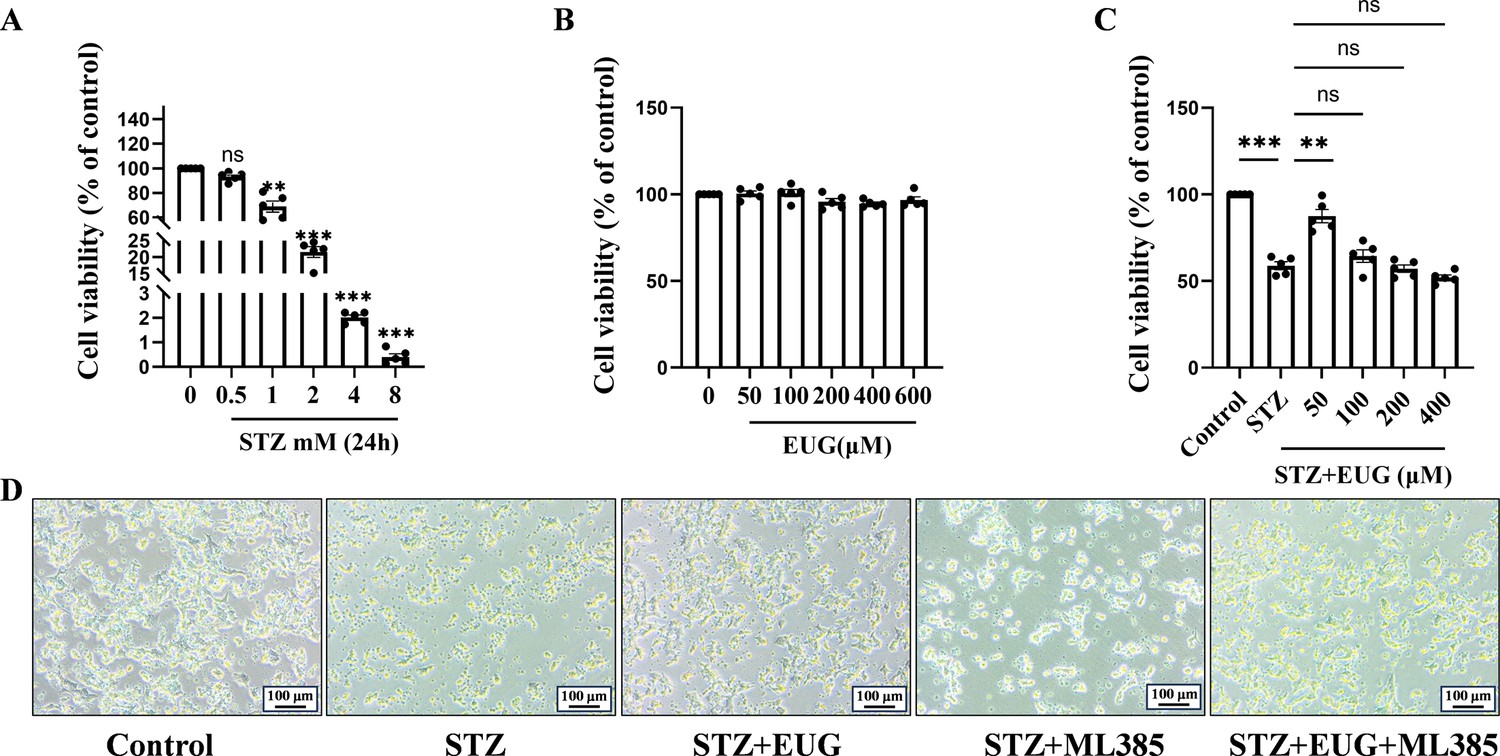
Explored the optimal concentration of drugs for MIN6 cells in vitro.
(A) The cell viability of MIN6 treated with different dose streptozotocin (STZ) for 24 hr using CCK-8 assay (n=5 independently repeated experiments). (B) The safe dose ranges of eugenol (EUG) to maintain cell viability were determined by CCK-8 assay (n=5 independently repeated experiments). (C) The dose-dependent effect of EUG on MIN6 cell viability after STZ-induced (n=5 independently repeated experiments). (D) The imaging results of MIN6 cells under an inverted microscope in bright field with different treatments. Scale bars 100 µm. Mean ± SEM. *p<0.05, **p<0.01, ***p<0.001 indicate significant differences, and ns>0.05 means no significance difference. One-way ANOVA.
Figure 7
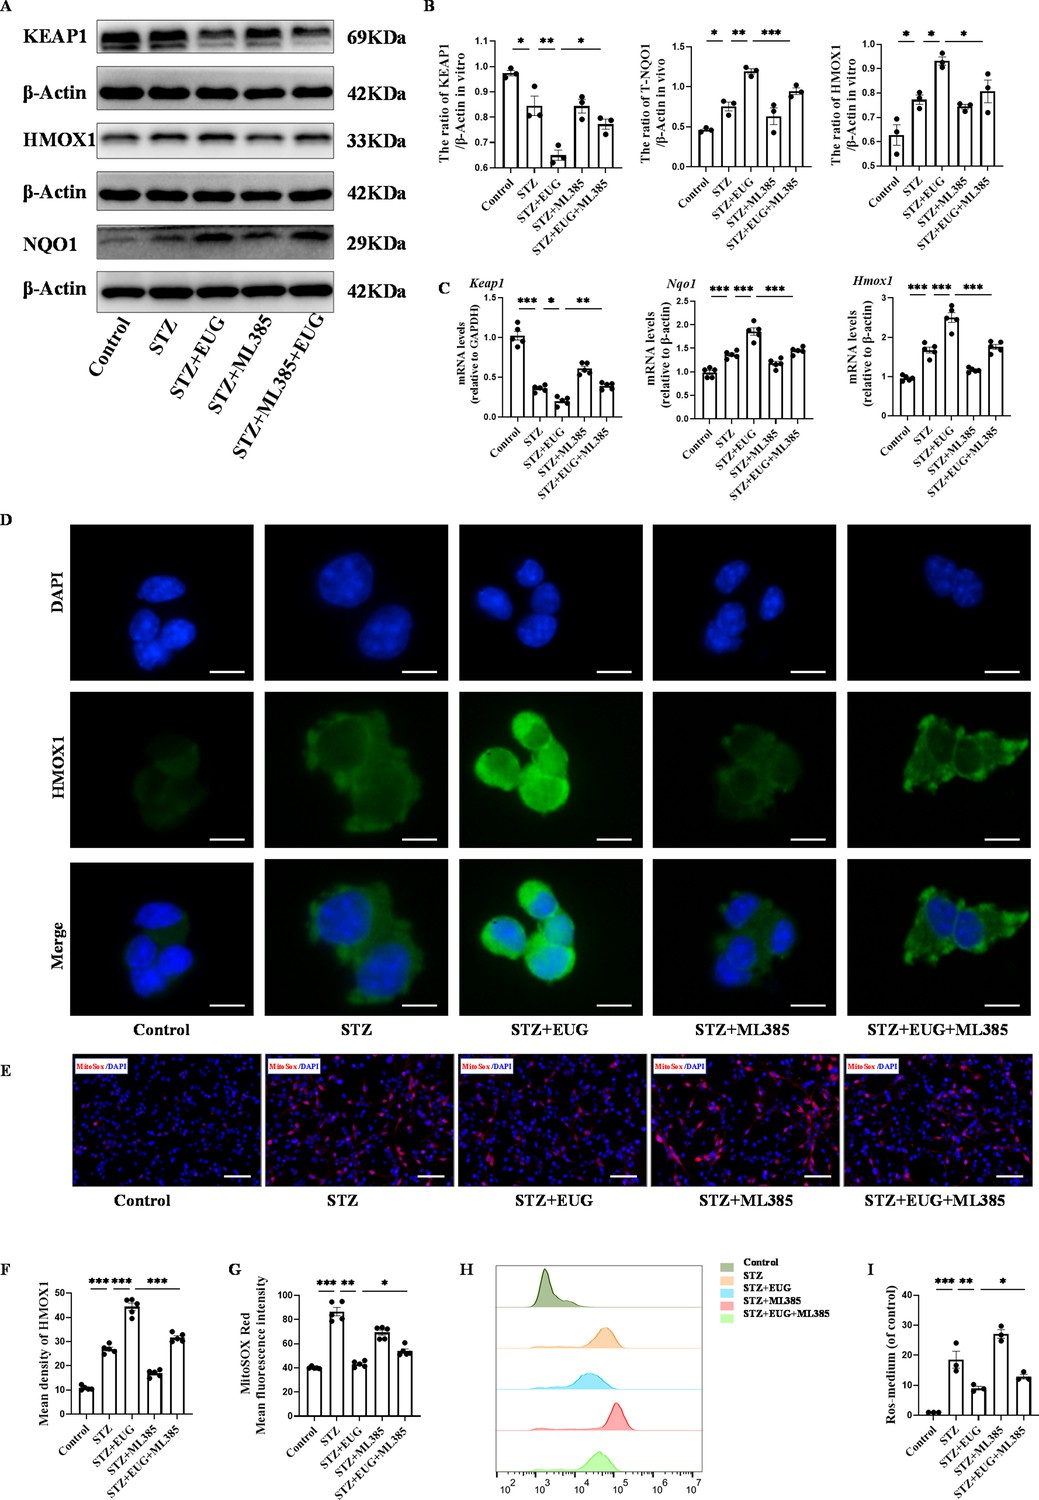
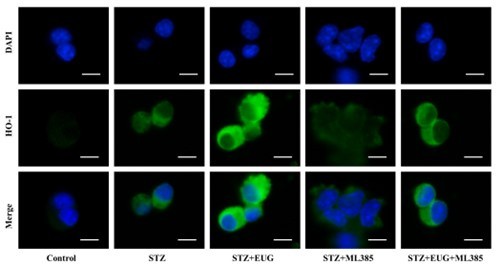
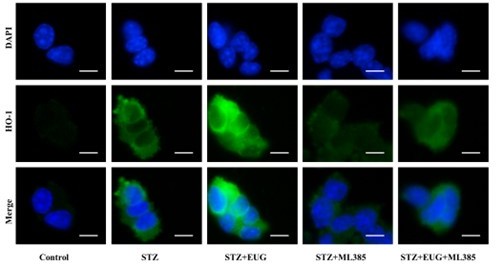
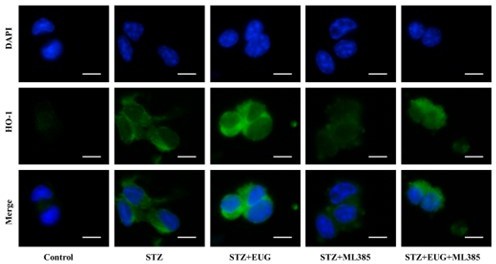
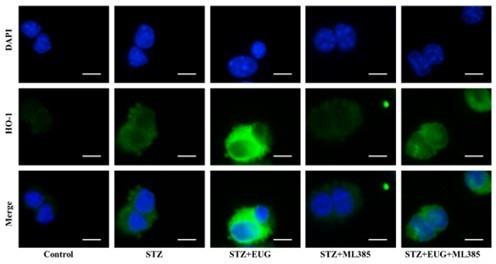
Eugenol (EUG) promoted the expression of nuclear factor E2-related factor 2 (NRF2) signaling pathway-related proteins to reduce intracellular reactive oxygen species (ROS) level.
(A) The detection of KEAP1, HMOX1, and NQO1 expression in different groups using western blot. (B) The quantification of western blot gel bands in different groups (n=3 independently repeated experiments). (C) The gene levels of Keap1, Nqo1, and Hmox1 in different groups (n=5 independently repeated experiments). (D) The representative immunofluorescence staining images of HMOX1 (green) in each group of MIN6 cells. Nuclei were stained with DAPI (blue). Scale bar 10 μm. (E) The generation of mitochondrial ROS in each group was detected by MitoSOX (red) and DAPI (blue) staining. Scale bar 100 μm. (F) The quantification of immunofluorescence staining in different groups (n=5 independently repeated experiments). (G) The quantitative analysis of immunofluorescence staining in different groups (n=5 independently repeated experiments). (H) The cell ROS in each group was analyzed using flow cytometry after DCFH-DA staining. (I) The quantitative analysis of flow cytometry after DCFH-DA staining (n=3 independently repeated experiments). Mean ± SEM. *p<0.05, **p<0.01, ***p<0.001 indicate significant differences, and ns>0.05 means no significance difference. One-way ANOVA.
-
Figure 7—source data 1
Raw unedited gels for Figure 7.
- https://cdn.elifesciences.org/articles/96600/elife-96600-fig7-data1-v1.pdf
-
Figure 7—source data 2
Uncropped and labeled gels for Figure 7.
- https://cdn.elifesciences.org/articles/96600/elife-96600-fig7-data2-v1.zip
Figure 8
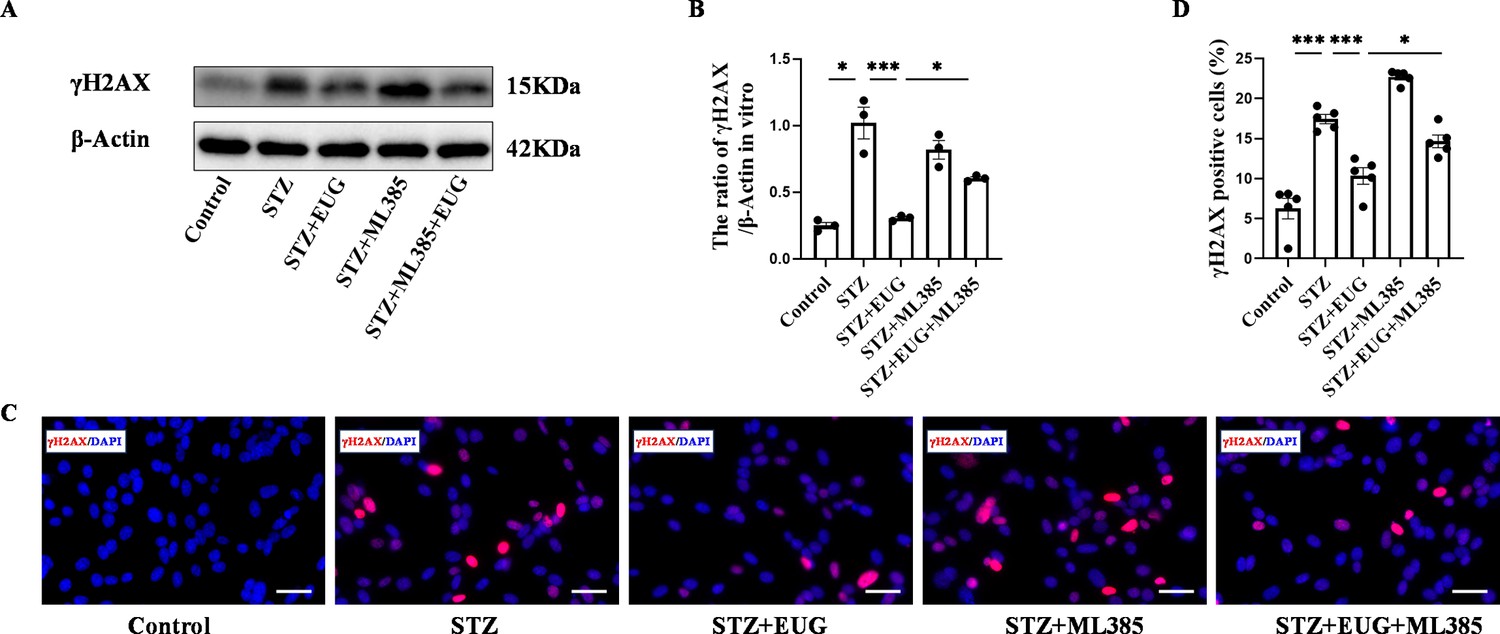
Eugenol (EUG) attenuated γH2AX expression in streptozotocin (STZ)-induced MIN6 cells in vitro.
(A) The detection of γH2AX expression in different groups using western blot. (B) The quantification of western blot gel bands in different groups (n=3 independently repeated experiments). (C) The representative immunofluorescence staining images of γH2AX (red) in each group of MIN6 cells. Nuclei were stained with DAPI (blue). Scale bar 50 μm. (D) The quantitative analysis of γH2AX positive cells in different groups (n=5 independently repeated experiments). Mean ± SEM. *p<0.05, **p<0.01, ***p<0.001 indicate significant differences, and ns>0.05 means no significance difference. One-way ANOVA.
-
Figure 8—source data 1
Raw unedited gels for Figure 8.
- https://cdn.elifesciences.org/articles/96600/elife-96600-fig8-data1-v1.pdf
-
Figure 8—source data 2
Uncropped and labeled gels for Figure 8.
- https://cdn.elifesciences.org/articles/96600/elife-96600-fig8-data2-v1.zip
Figure 9
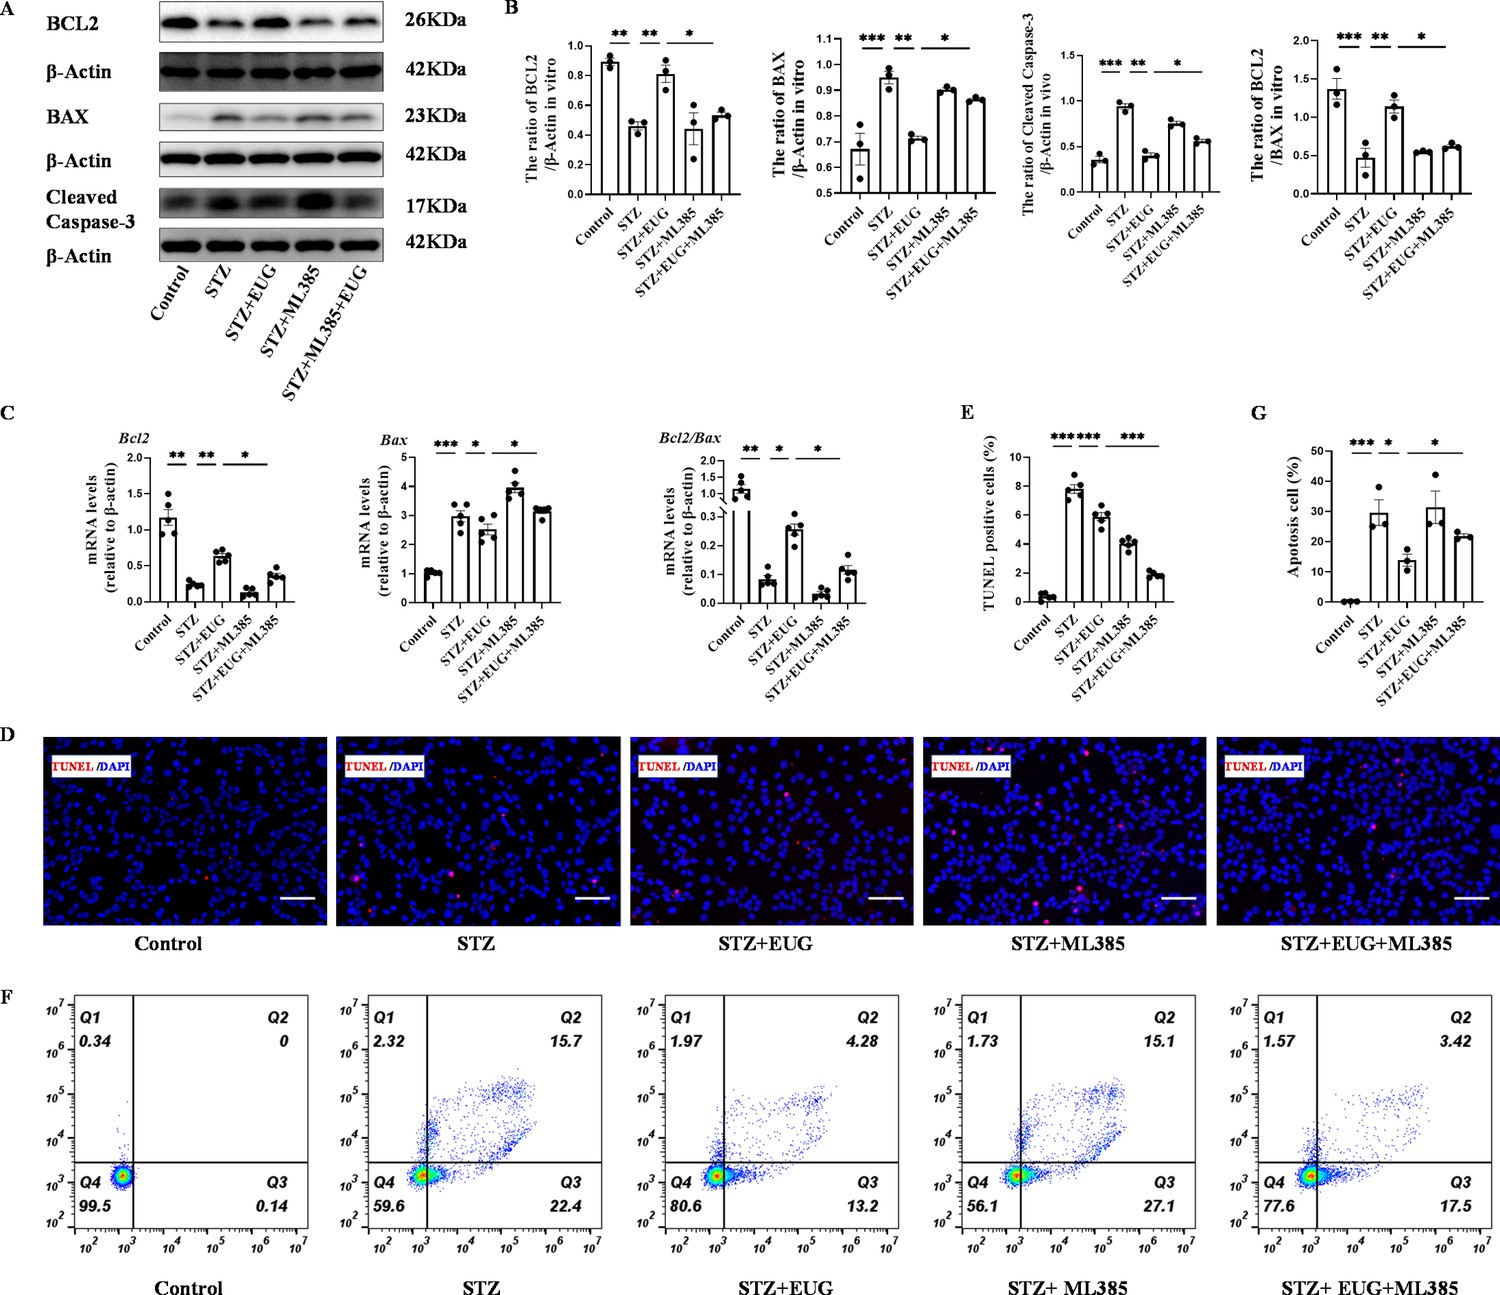
Eugenol (EUG) exerted protection of streptozotocin (STZ)-induced MIN6 cells through inhibition of the apoptosis in vitro.
(A) The detection of BCL2, BAX, Cleaved Caspase-3 expression in different groups using western blot. (B) The quantification of western blot gel bands in different groups (n=3 independently repeated experiments). (C) The gene levels of Bcl2, Bax, and Bcl2/Bax in different groups (n=5 independently repeated experiments). (D) The detection of MIN6 cells apoptosis in each group using TUNEL staining. The cells with red fluorescence represent apoptosis. Scale bar 100 μm. (E) The quantitative analysis of TUNEL positive cells in different groups (n=5 independently repeated experiments). (F) The apoptosis in each group was analyzed using flow cytometry after Annexin V FITC and PI co-staining. (G) The quantitative analysis of flow cytometry after Annexin V FITC and PI co-staining in different groups (n=5 independently repeated experiments). Mean ± SEM. *p<0.05, **p<0.01, ***p<0.001 indicate significant differences, and ns>0.05 means no significance difference. One-way ANOVA.
-
Figure 9—source data 1
Raw unedited gels for Figure 9.
- https://cdn.elifesciences.org/articles/96600/elife-96600-fig9-data1-v1.pdf
-
Figure 9—source data 2
Uncropped and labeled gels for Figure 9.
- https://cdn.elifesciences.org/articles/96600/elife-96600-fig9-data2-v1.zip
Figure 10
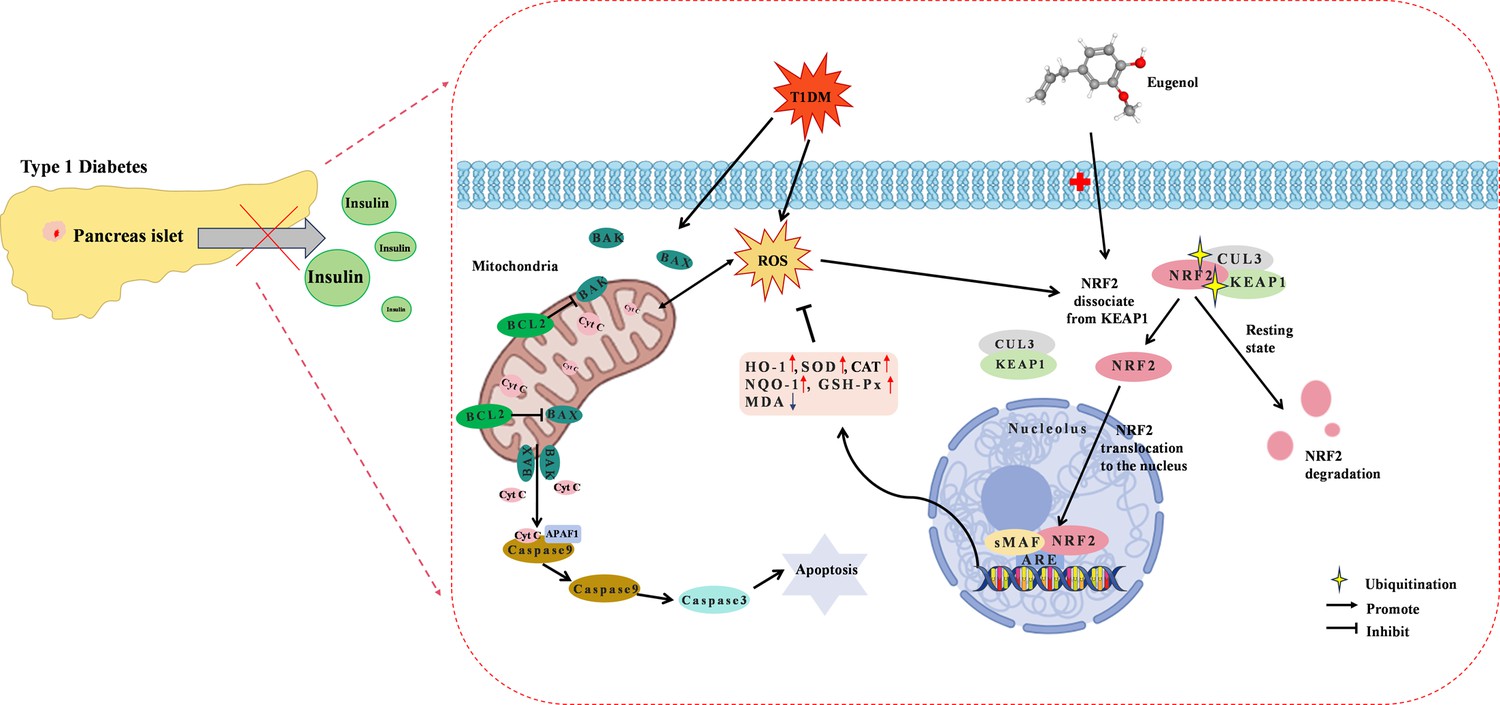
Diagram of the underlying mechanisms involved in the protective effects of eugenol (EUG) on type 1 diabetes mellitus (T1DM).
Author response image 1
Author response image 2

Group 1.
Author response image 3
Group 2.
Author response image 4
Group 3.
Author response image 5
Group 4.
Author response image 6
Group 5.
Author response image 7
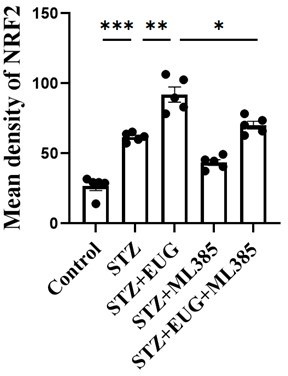
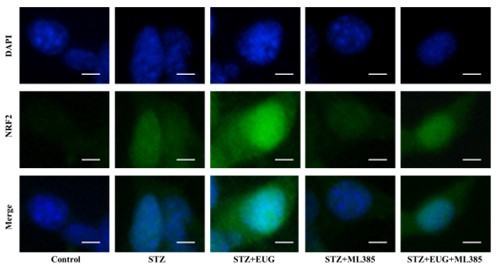
NRF2 immunofluorescence staining statistics.
Author response image 8
Group 1.
Author response image 9
Group 2.
Author response image 10
Group 3.
Author response image 11
Group 4.
Author response image 12
Group 5.
Author response image 13
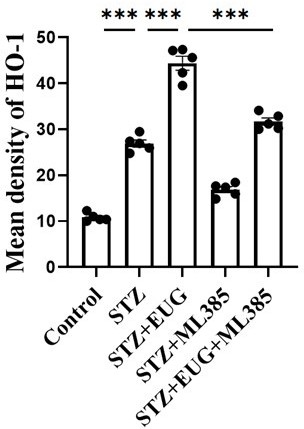
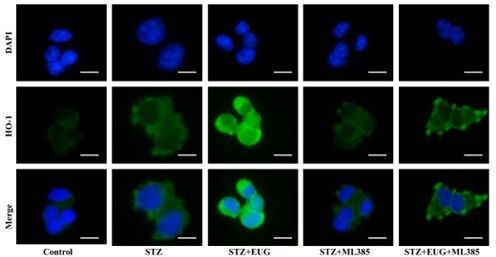
HO-1 immunofluorescence staining statistics.
Tables
Key resources table
| Reagent type (species) or resource | Designation | Source or reference | Identifiers | Additional information |
|---|---|---|---|---|
| Cell line (Mus musculus, mouse) | Min6 | GuangZhou Jennio Biotech Co., Ltd | Cat# JNO-M0060 RRID:CVCL_0431 | |
| Antibody | Anti-Insulin (Rabbit monoclonal) | Abcam | Cat# ab181547, RRID:AB_2716761 | IF/IHC (1:200), WB (1:1000) |
| Antibody | Anti-Phospho-Histone H2A.X (Ser139) (Rabbit polyclonal) | Abmart | Cat# T56572, RRID:AB_2936396 | IF/IHC (1:100), WB (1:5000) |
| Antibody | Anti-BAX (Mouse monoclonal) | Santa Cruz Biotechnology | Cat# sc-7480, RRID:AB_626729 | WB (1:500) |
| Antibody | Anti-Cleaved Caspase-3 (Rabbit monoclonal) | Cell Signaling Technology | Cat# 9664, RRID:AB_2070042 | WB (1:1000) |
| Antibody | Anti-NRF2 (Mouse monoclonal) | Proteintech | Cat# 16396-1-AP; RRID:AB_2782956 | IF (1:200), WB (1:1000) |
| Antibody | Anti-KEAP1 (Mouse monoclonal) | Proteintech | Cat# 60027-1-Ig, RRID:AB_2132623 | WB (1:1000) |
| Antibody | Anti-HO-1/HMOX1 (Rabbit polyclonal) | Proteintech | Cat# 10701-1-AP, RRID:AB_2118685 | IF (1:200), WB (1:1000) |
| Antibody | Anti-NQO1 (Mouse monoclonal) | Proteintech | Cat# 67240-1-Ig, RRID:AB_2882519 | WB (1:1000) |
| Antibody | Anti-β-actin (Rabbit polyclonal) | Proteintech | Cat# 20536-1-AP, RRID:AB_10700003 | WB (1:5000) |
| Antibody | Anti-Lamin B1 (Rabbit polyclonal) | Proteintech | Cat# 12987-1-AP, RRID:AB_2136290 | WB (1:1000) |
| Antibody | Anti-Bcl-2 (Mouse monoclonal) | Affinity Biosciences | Cat# BF9103, RRID:AB_2837570 | WB (1:1000) |
| Antibody | Anti-GAPDH (Rabbit polyclonal) | Affinity Biosciences | Cat# AF7021, RRID:AB_2839421 | WB (1:5000) |
| Sequence-based reagent | Ins1_F (Mouse) | This paper | PCR primers | CAAACCCACCCAGGCTTTTG |
| Sequence-based reagent | Ins1_R (Mouse) | This paper | PCR primers | AACGCCAAGGTCTGAAGGTC |
| Sequence-based reagent | Bax_F (Mouse) | This paper | PCR primers | ACACTGGACTTCCTCCGTGA |
| Sequence-based reagent | Bax_R (Mouse) | This paper | PCR primers | AGAGGAGGCCTTCCCAGC |
| Sequence-based reagent | Bcl2_F (Mouse) | This paper | PCR primers | TGAACTGGGGGAGGATTGTG |
| Sequence-based reagent | Bcl2_R (Mouse) | This paper | PCR primers | CAGAGACAGCCAGGAGAAATCA |
| Sequence-based reagent | Nrf2_F (Mouse) | This paper | PCR primers | CAGCCATGACTGATTTAAGCAG |
| Sequence-based reagent | Nrf2_R (Mouse) | This paper | PCR primers | CAGCTGCTTGTTTTCGGTATTA |
| Sequence-based reagent | HMOX1_F (Mouse) | This paper | PCR primers | TCCTTGTACCATATCTACACGG |
| Sequence-based reagent | HMOX1_R (Mouse) | This paper | PCR primers | GAGACGCTTTACATAGTGCTGT |
| Sequence-based reagent | Keap1_F (Mouse) | This paper | PCR primers | GACTGGGTCAAATACGACTGC |
| Sequence-based reagent | Keap1_R (Mouse) | This paper | PCR primers | GAATATCTGCACCAGGTAGTCC |
| Sequence-based reagent | NQO1_F (Mouse) | This paper | PCR primers | GAAGACATCATTCAACTACGCC |
| Sequence-based reagent | NQO1_R (Mouse) | This paper | PCR primers | GAGATGACTCGGAAGGATACTG |
| Sequence-based reagent | β-actin_F (Mouse) | This paper | PCR primers | CTACCTCATGAAGATCCTGACC |
| Sequence-based reagent | β-actin_R (Mouse) | This paper | PCR primers | CACAGCTTCTCTTTGATGTCAC |
| Commercial assay or kit | Mouse insulin (INS) ELISA Kit | ShangHai Boyun Biotech Co., Ltd | Cat# BP-E20353 | Mouse insulin (INS) ELISA Kit |
| Commercial assay or kit | Mouse ketonuria levels ELISA Kit | MEIMIAN | Cat# MM-0967M1 | Mouse ketonuria levels ELISA Kit |
| Commercial assay or kit | Urine Glucose Assay Kit | Nanjing Jiancheng Bioengineering Institute | Cat# C041-1-1 | Urine Glucose Assay Kit |
| Commercial assay or kit | Nuclear protein extraction kit | Beyotime Biotechnology | Cat# P0027 | Nuclear protein extraction kit |
| Commercial assay or kit | In Situ Cell Death Detection Kit, POD | Roche Life Science | Cat# 11684817910 | In Situ Cell Death Detection Kit, POD |
| Commercial assay or kit | In Situ Cell Death Detection Kit, Fluorescein | Roche Life Science | Cat# 11684795910 | In Situ Cell Death Detection Kit, Fluorescein |
| Commercial assay or kit | FITC Annexin V Apoptosis Detection Kit I | Becton Dickinson | Cat# 556547 | Annexin V FITC/PI apoptosis detection kit |
| Chemical compound, drug | Streptozotocin | Sigma-Aldrich | Cat# S0130-1G | |
| Chemical compound, drug | Eugenol | MedChemExpress | Cat# HY-N0337 | |
| Chemical compound, drug | Collagenase V solution | Sigma-Aldrich | Cat# C9263 | |
| Chemical compound, drug | Penicillin/streptomycin | Gibco | Cat# 15140122 | |
| Chemical compound, drug | Fetal bovine serum | Gibco | Cat# A3160801 | |
| Chemical compound, drug | MEM NON-ESSENTIAL AMINO ACIDS SOLUTION | Gibco | Cat# 11140050 | |
| Chemical compound, drug | ML385 | MedChemExpress | Cat# HY-100523 | |
| Chemical compound, drug | MitoSOX Red mitochondrial superoxide indicator | Yeasen | Cat# 50102ES02 | |
| Software, algorithm | ImageJ | ImageJ, https://imagej.nih.gov/ij/ | RRID:SCR_003070 | |
| Software, algorithm | GraphPad Prism | GraphPad Software, https://www.graphpad.com/ | RRID:SCR_002798 | |
| Software, algorithm | FlowJo | FlowJo Software, https://www.flowjo.com/solutions/flowjo | RRID:SCR_008520 |
Additional files
-
Supplementary file 1
Antibodies.
ND = not detected; WB = western blot; IHC: immunohistochemistry; IF: immunofluorescence.
- https://cdn.elifesciences.org/articles/96600/elife-96600-supp1-v1.docx
-
Supplementary file 2
Primer information for mouse.
- https://cdn.elifesciences.org/articles/96600/elife-96600-supp2-v1.docx
-
MDAR checklist
- https://cdn.elifesciences.org/articles/96600/elife-96600-mdarchecklist1-v1.docx
Download links
A two-part list of links to download the article, or parts of the article, in various formats.
Downloads (link to download the article as PDF)
Open citations (links to open the citations from this article in various online reference manager services)
Cite this article (links to download the citations from this article in formats compatible with various reference manager tools)
The protective roles of eugenol on type 1 diabetes mellitus through NRF2-mediated oxidative stress pathway
eLife 13:RP96600.
https://doi.org/10.7554/eLife.96600.3


