Additional feedforward mechanism of Parkin activation via binding of phospho-UBL and RING0 in trans
- Department of Biological Sciences, Indian Institute of Science Education and Research (IISER) Bhopal, India
- MRC Protein Phosphorylation and Ubiquitylation Unit, School of Life Sciences, University of Dundee, United Kingdom
- Division of Cell Signalling and Immunology, Dundee Imaging Facility, School of Life Sciences, University of Dundee, United Kingdom
Figures
Figure 1 with 2 supplements
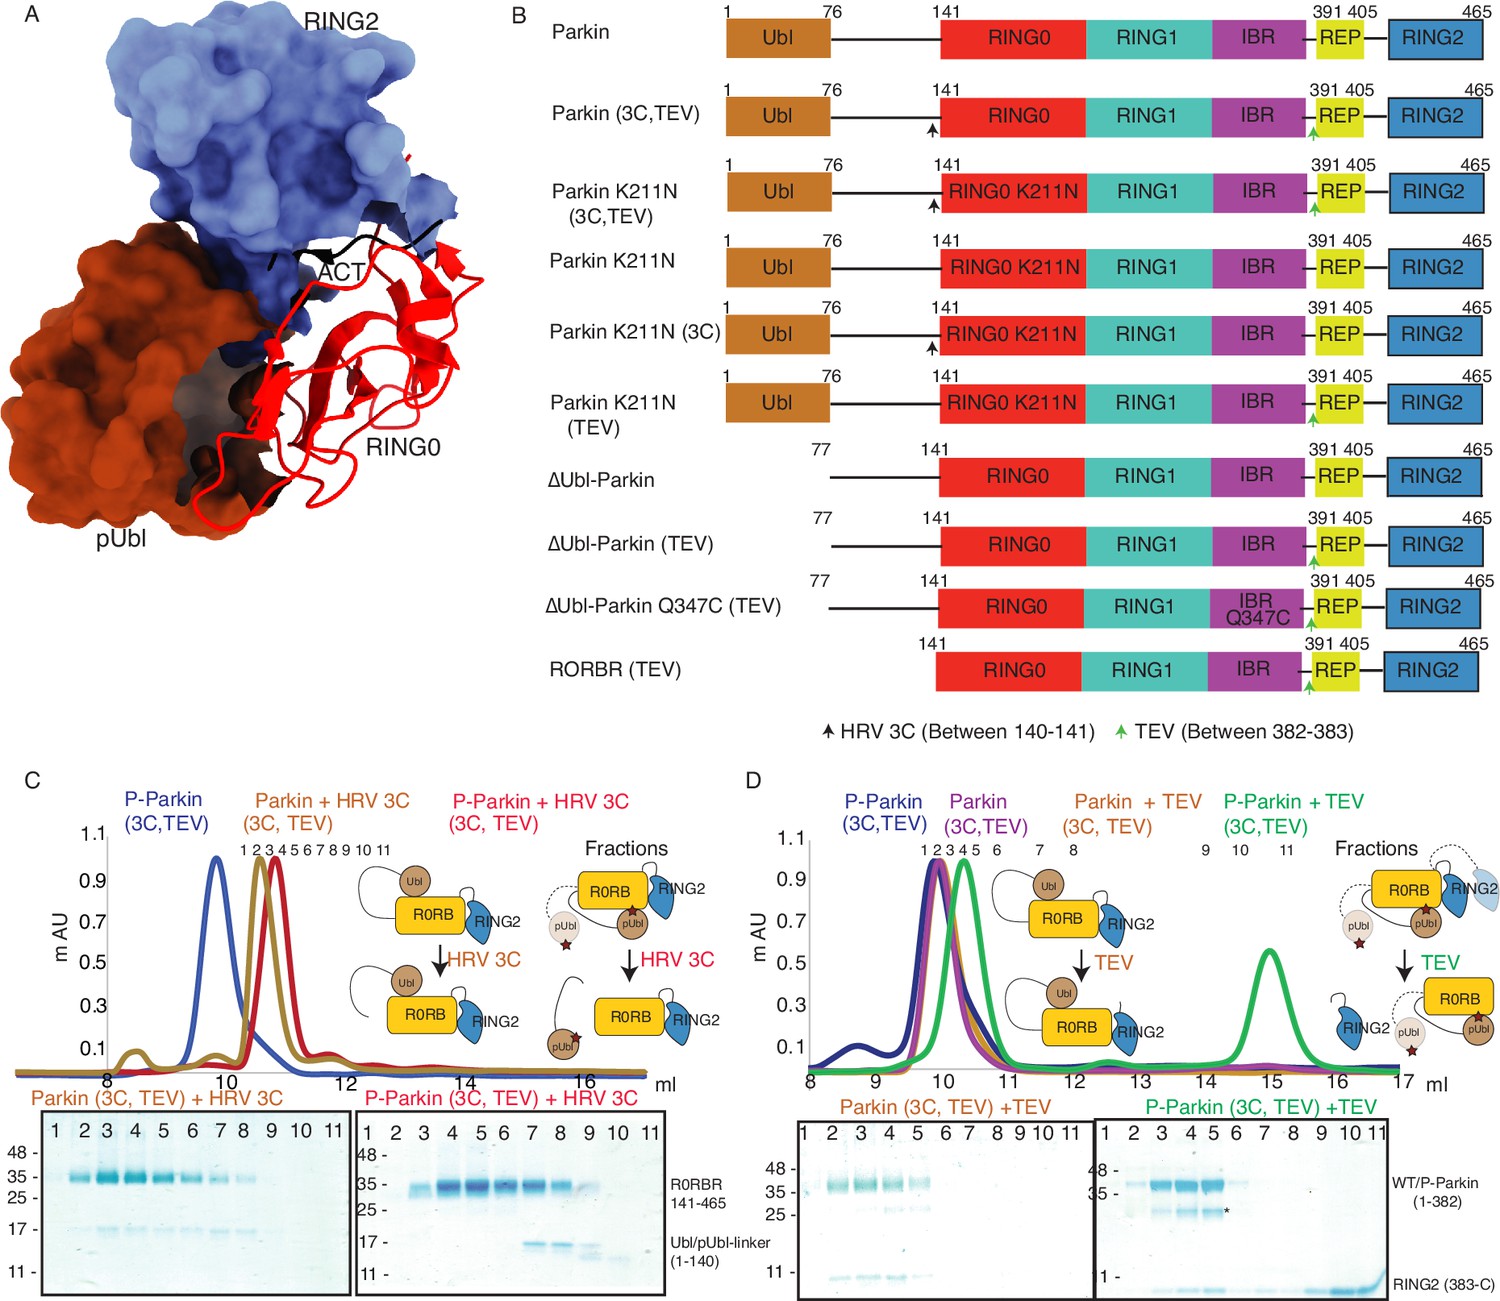
Incorporation of molecular scissors to study dynamic conformation upon Parkin phosphorylation.
(A) Superimposition of WT-Parkin (PDBID: 5C1Z) and phospho-Parkin (PDBID: 6GLC) structures. RING2 (blue), pUbl (brown), RING0 (red), and ACT (black) are shown. For clarity, other Parkin domains are not included. (B) Schematic representation of Parkin domains and various constructs used in this study. HRV 3C and TEV sites incorporated in the Parkin construct are marked with black and green arrows, respectively. (C) Size-exclusion chromatography (SEC) assay shows the binding/displacement of Ubl-linker (1-140) under native or phosphorylated conditions. A colored key for each trace is provided. Coomassie-stained gels of indicated peaks are shown in the lower panel. A schematic representation is used to explain SEC data. (D) Size-exclusion chromatography (SEC) assay shows binding/displacement of RING2 (383-465) under native or phosphorylated conditions. Coomassie-stained gels of indicated peaks are shown in the lower panel. TEV as contamination is indicated (*).
-
Figure 1—source data 1
Raw data files used in Figure 1.
- https://cdn.elifesciences.org/articles/96699/elife-96699-fig1-data1-v1.docx
Figure 1—figure supplement 1
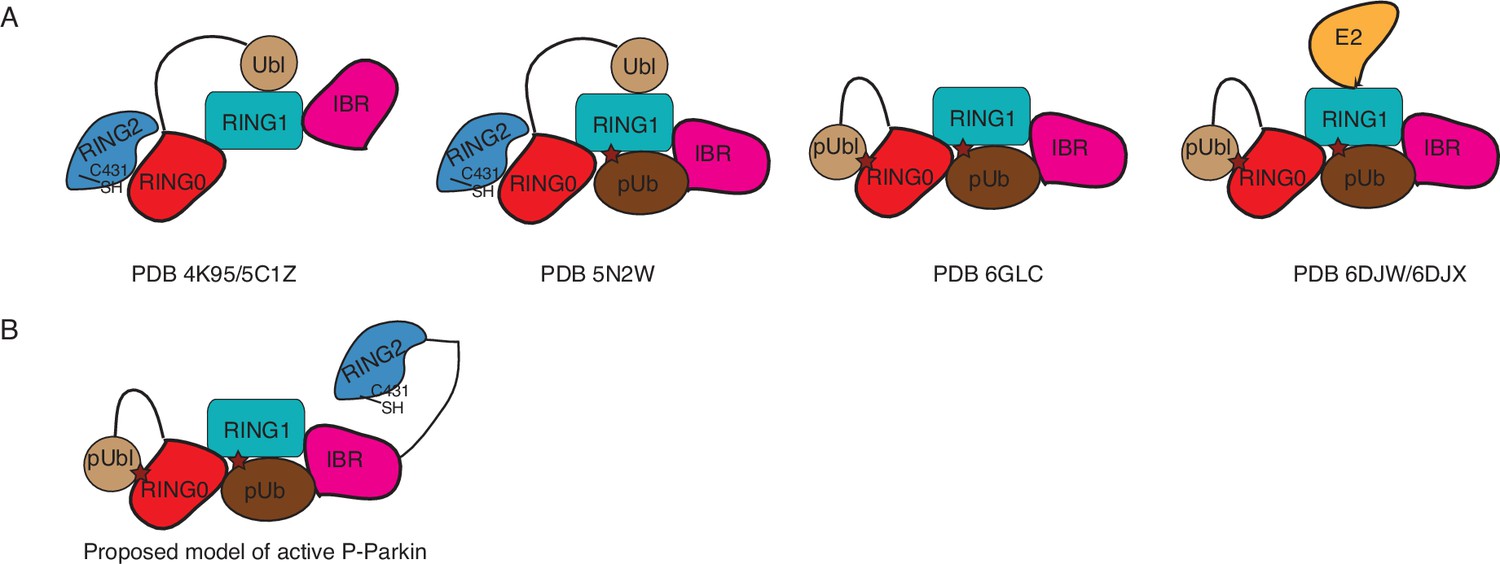
Summary of Parkin conformations/model.
(A) Conformation of Parkin observed in various crystal structures solved so far. (B) Proposed conformation of phospho-Parkin (Gladkova et al., 2018; Sauvé et al., 2018).
Figure 1—figure supplement 2
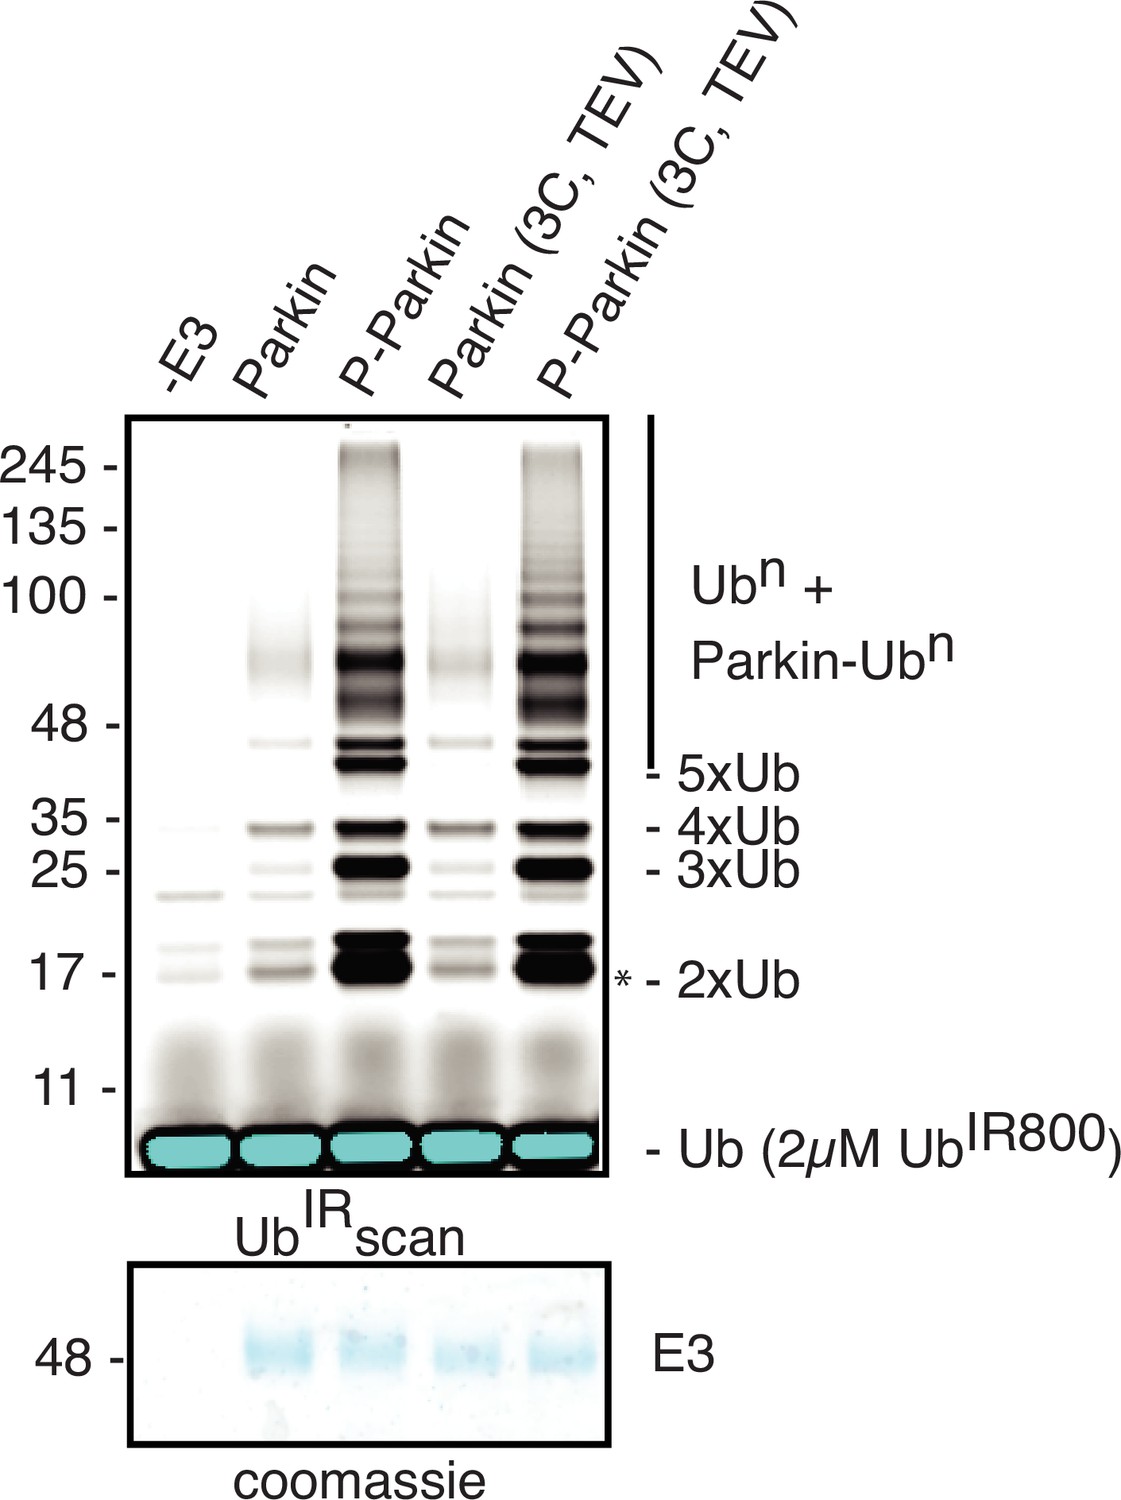
Ubiquitination assay to compare Parkin (3C, TEV) or Parkin activity.
A non-specific, ATP-independent band is indicated (*). The lower panel shows a Coomassie-stained loading control.
-
Figure 1—figure supplement 2—source data 1
Raw image files.
- https://cdn.elifesciences.org/articles/96699/elife-96699-fig1-figsupp2-data1-v1.docx
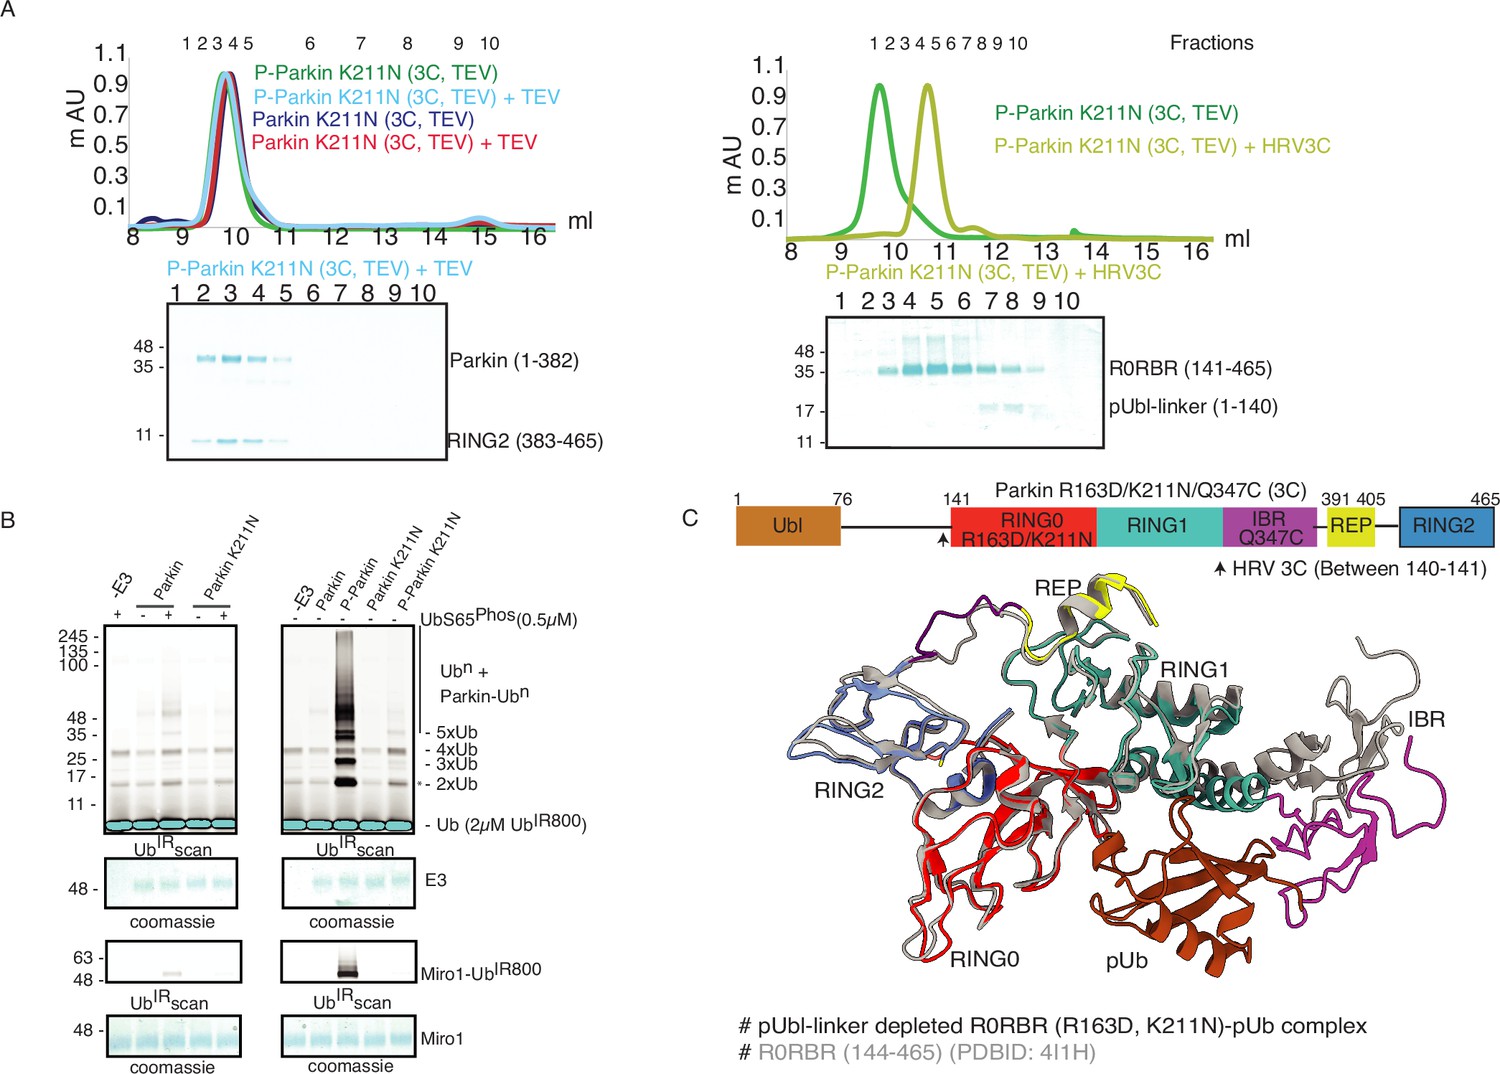
Figure 2 with 1 supplement
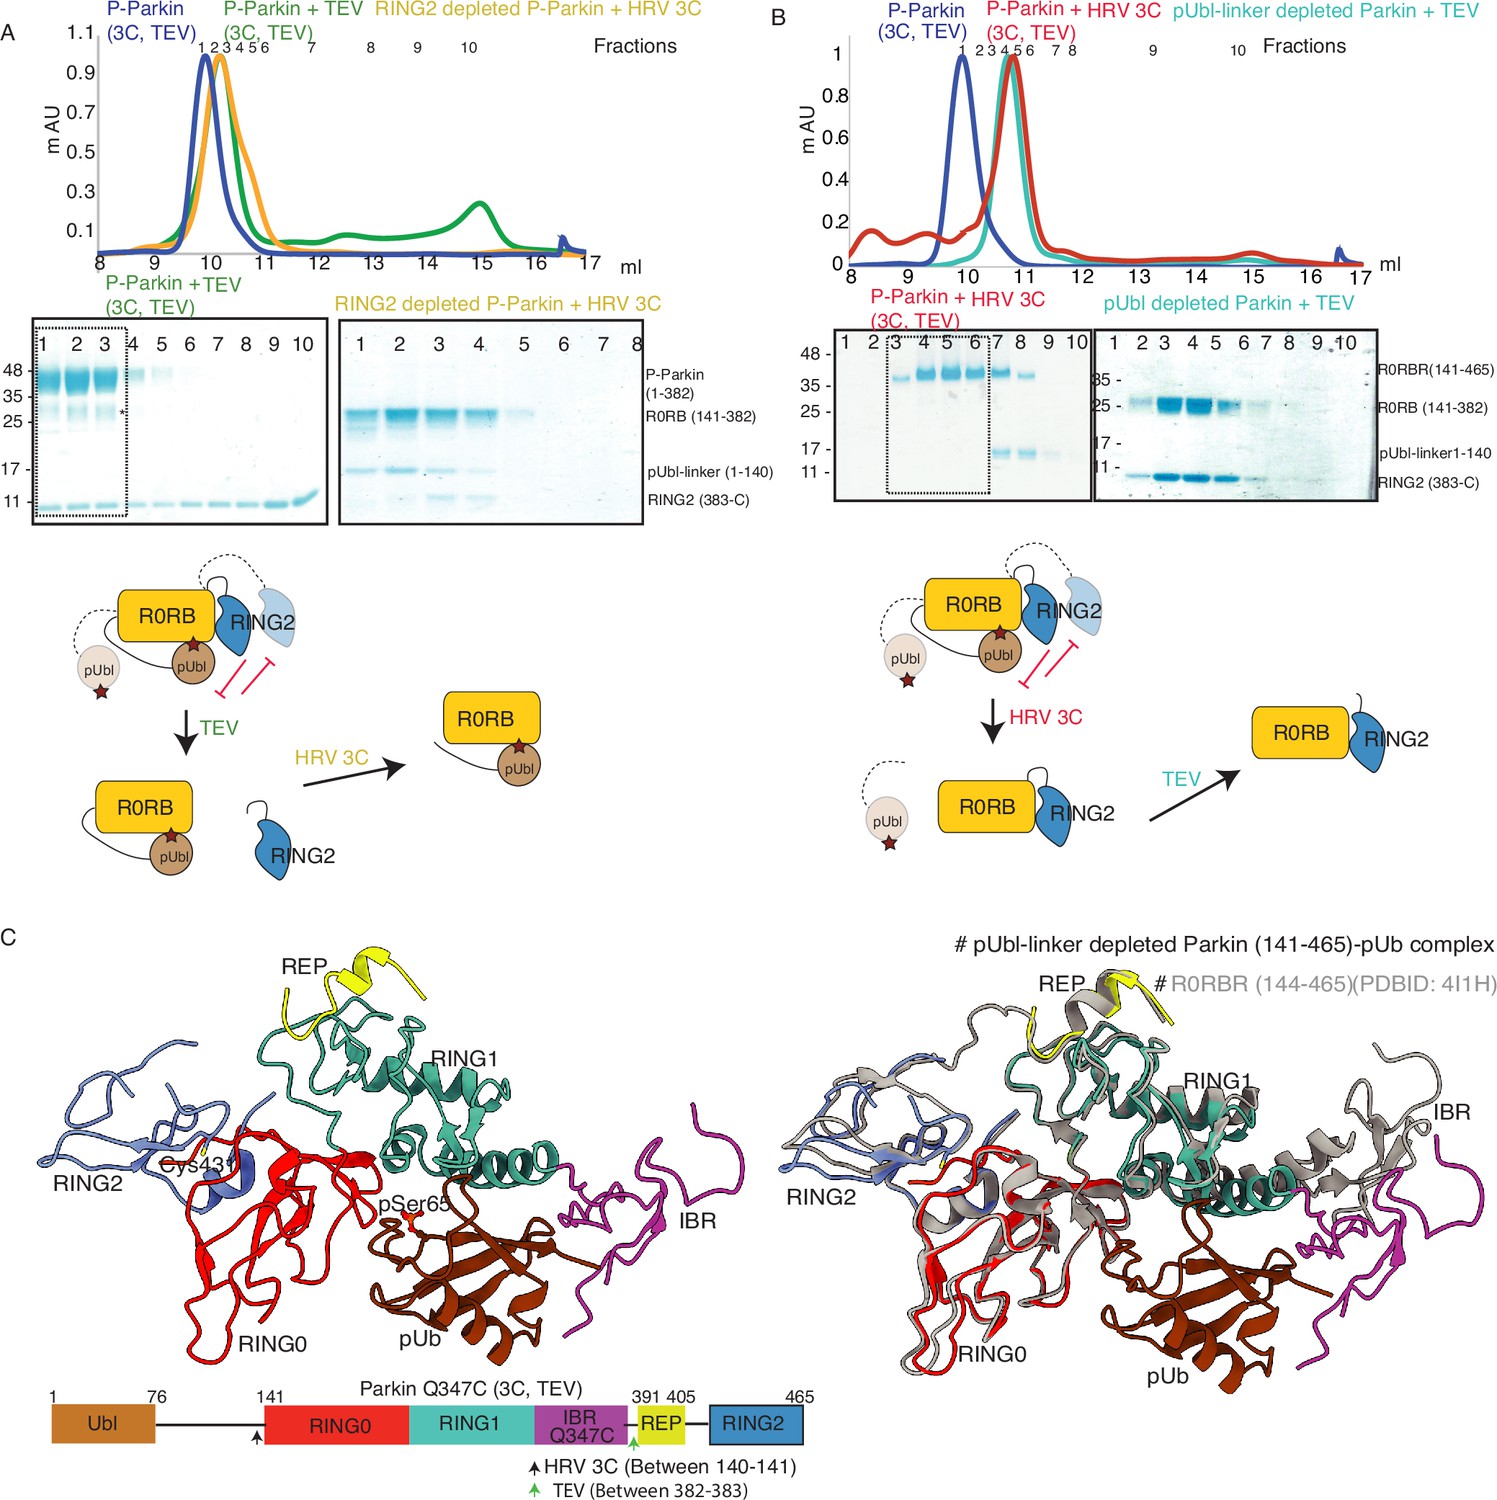
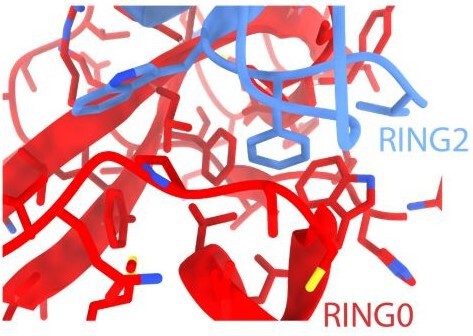
Characterization of a competing mode of binding between pUbl and RING2.
(A) SEC assay shows depletion of RING2 (383-465) from phospho-Parkin stabilize pUbl-linker (1-140) binding with Parkin (141-382) after treatment with 3C protease. Fractions that were pooled for subsequent proteolysis are highlighted in the box. (B) SEC assay shows depletion of pUbl-linker (1-140) from phospho-Parkin stabilize RING2 (383-465) binding with Parkin (R0RB, 141–382) after treatment with TEV protease. Fractions that were pooled for subsequent proteolysis are highlighted in the box. (C) Crystal structure of pUbl-linker (1-140) depleted Parkin (141-465) complex with pUb (brown). Different domains of Parkin are colored, as shown in the left panel. Catalytic C431 is highlighted. Structure of pUbl-linker (1-140) depleted Parkin (141-465)-pUb complex (colored as in the left panel) is superimposed with R0RBR structure (PDBID: 4I1H, grey) in the right panel. A schematic representation of the Parkin Q347C (3C, TEV) construct used for crystallization is shown at the bottom.
-
Figure 2—source data 1
Raw image files.
- https://cdn.elifesciences.org/articles/96699/elife-96699-fig2-data1-v1.docx
Figure 2—figure supplement 1
Density map of pUbl-linker (1-140) depleted Parkin (141-465)-pUb complex.
The 2Fo-Fc map (blue) of Parkin molecules (shown in different colors) in the crystal structure of the pUbl-linker (1-140) depleted Parkin (141-465)-pUb (grey) complex. The 2Fo-Fc map is contoured at 1.5 σ.
Figure 3
K211N mutation affects RING2 displacement, not pUbl.
(A) Size-exclusion chromatography (SEC) assay to test the displacement of RING2 (left panel) or pUbl-linker (right panel) after phosphorylation of Parkin K211N (3C, TEV). (B) Ubiquitination assay to test the activity of Parkin K211N in the presence of pUb or using phospho-Parkin K211N. The middle panel shows a Coomassie-stained loading control. A non-specific, ATP-independent band is indicated (*). The lower panel shows Miro1 ubiquitination for the respective proteins in the upper lane. Coomassie-stained gel showing Miro1 is used as the loading control of substrate ubiquitination assay. (C) Crystal structure of pUbl-linker (1-140) depleted R0RBR (R163D/K211N)-pUb complex. The superimposed apo R0RBR structure (PDBID: 4I1H) is shown in grey. A schematic representation of the Parkin R163D/K211N/Q347C (3C) construct used for crystallization is shown at the top.
-
Figure 3—source data 1
Raw image files.
- https://cdn.elifesciences.org/articles/96699/elife-96699-fig3-data1-v1.docx
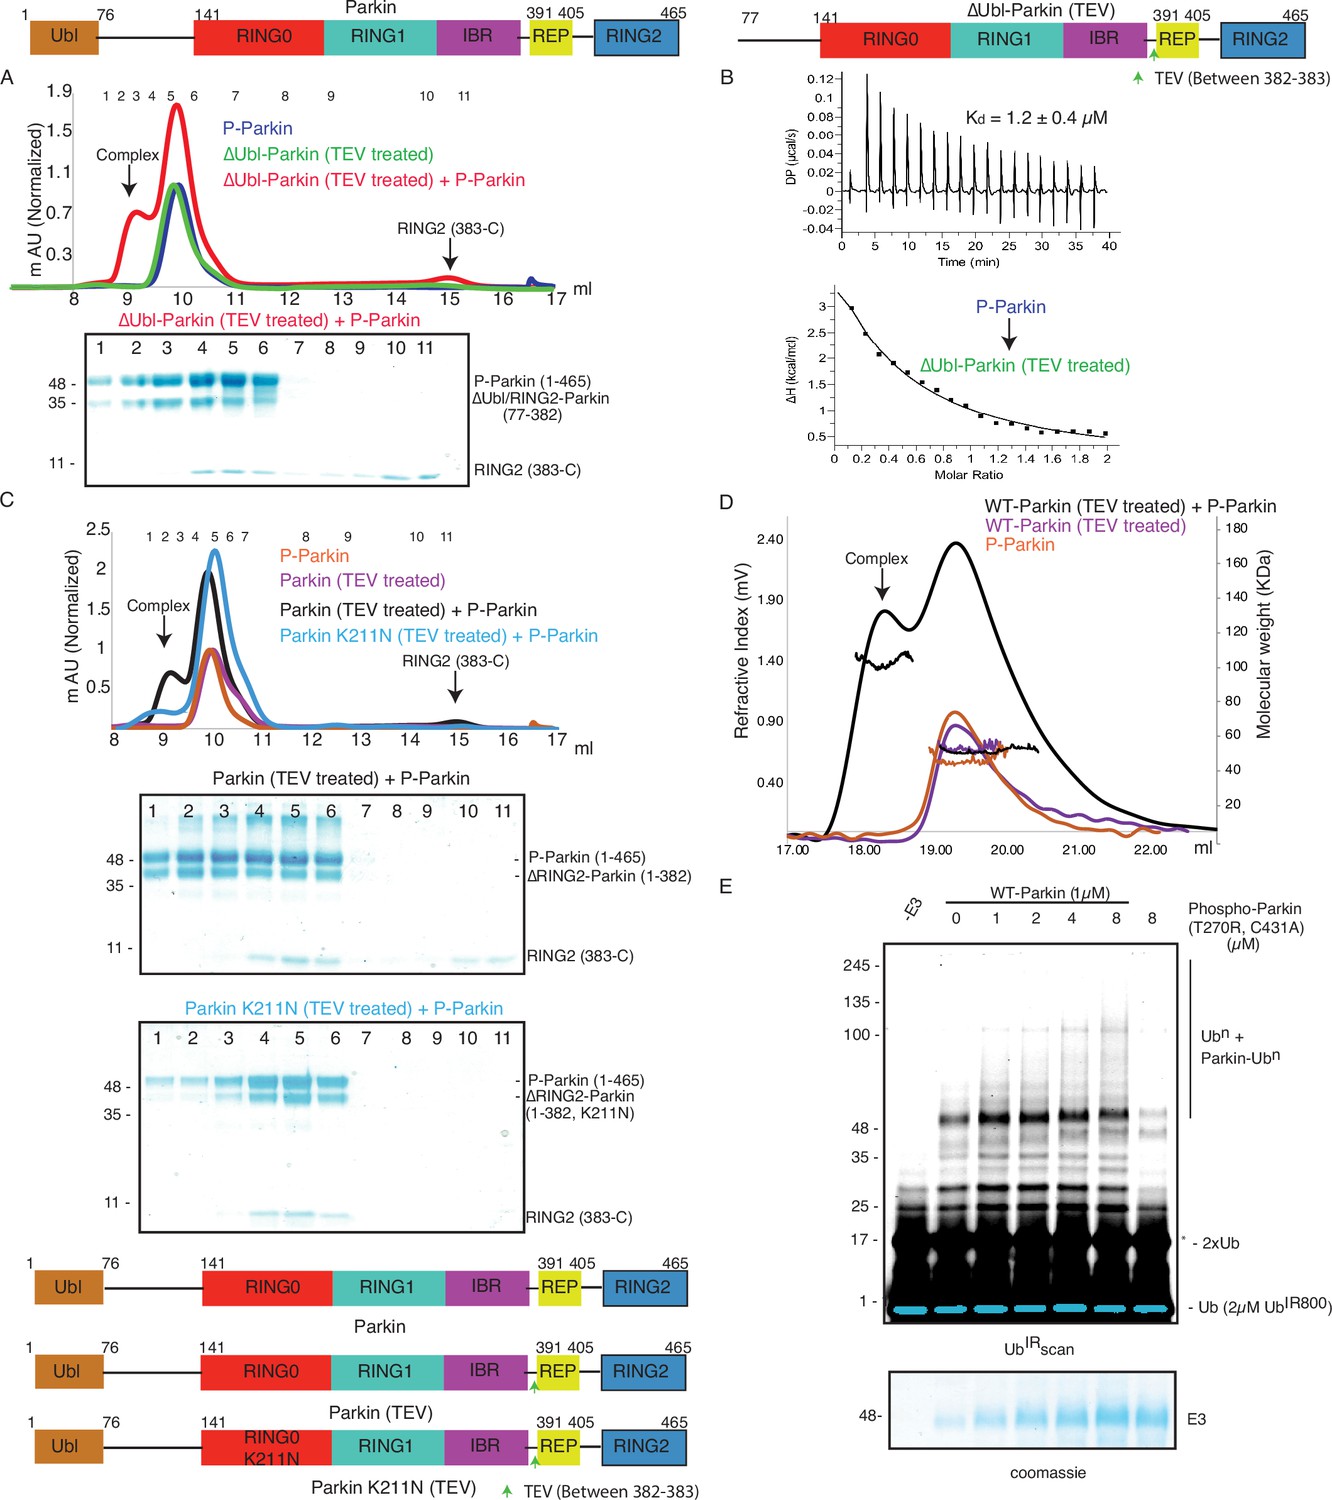
Figure 4 with 2 supplements
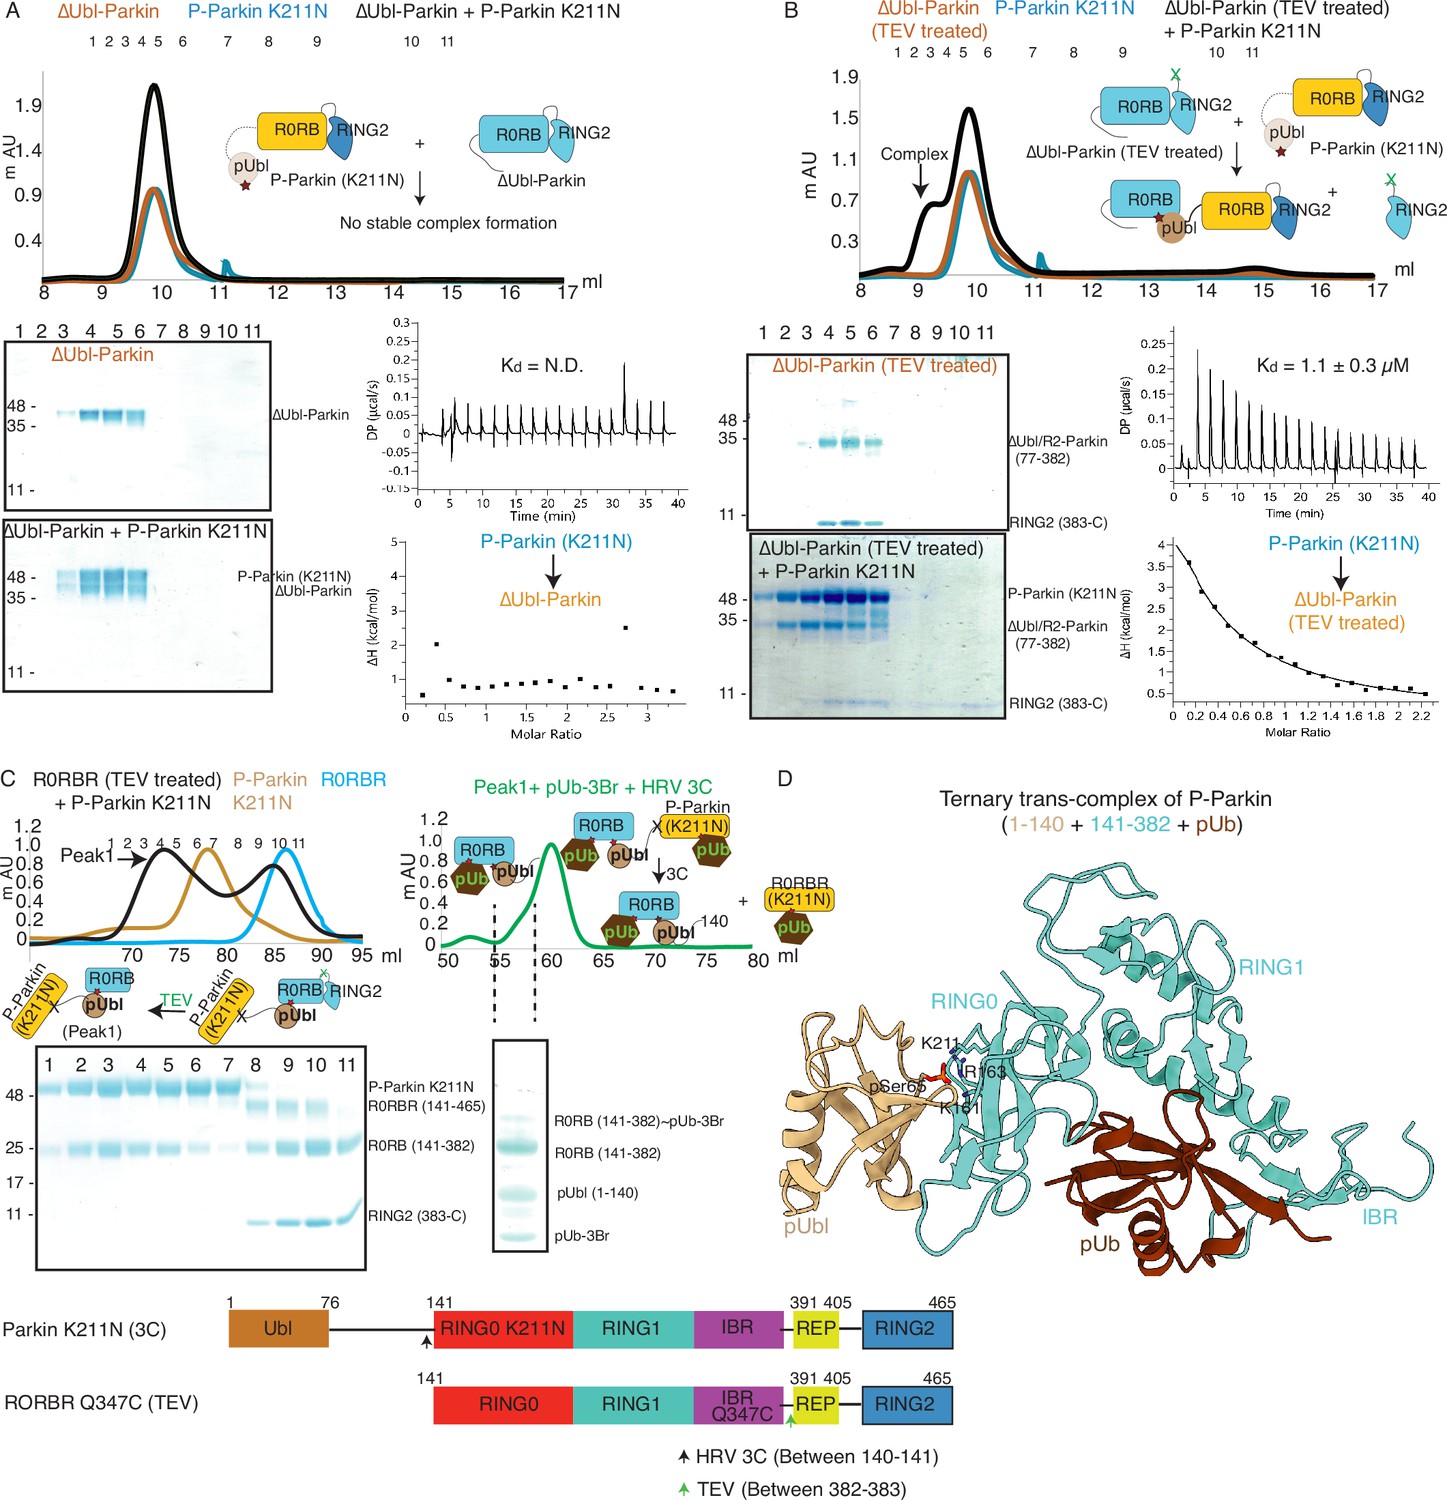
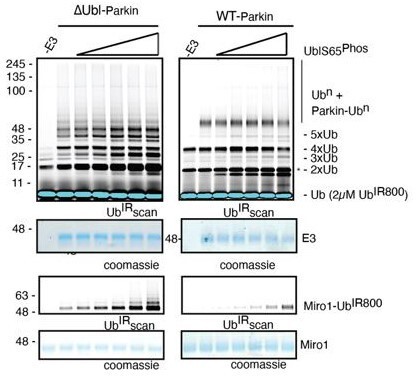
Untethering of the linker between IBR-RING2 allows Parkin and phospho-Ubl interaction in trans.
(A) Binding assay between phospho-Parkin K211N and ∆Ubl-Parkin. A colored key for each trace is provided. Coomassie-stained gels of indicated peaks are shown in the lower panel. A schematic representation is used to explain SEC data. Isothermal Titration Calorimetry assay between phospho-Parkin K211N and ∆Ubl-Parkin is shown in the lower panel. N.D. stands for not determined. (B) Binding assay between phospho-Parkin K211N and untethered ∆Ubl-Parkin (TEV). A colored key for each trace is provided. Coomassie-stained gels of indicated peaks are shown in the lower panel. A schematic representation is used to explain SEC data. Isothermal Titration Calorimetry assay between phospho-Parkin K211N and untethered ∆Ubl-Parkin (TEV) is shown in the lower panel. The dissociation constant (Kd) is shown. (C) SEC assay to test binding between untethered R0RBR Q347C (TEV) and phospho-Parkin K211N (3C), and displacement of RING2 (383-465) from R0RBR, the left panel. The peak1 (black) containing R0RB (141-382) and phospho-Parkin K211N complex was incubated with pUb-3Br, followed by HRV 3C protease, to purify ternary trans-complex of phospho-Parkin (1–140+141-382 + pUb) on SEC, the right panel. The concentrated fractions from the shoulder (highlighted with a dashed line) of the peak in the right panel were loaded on SDS PAGE to confirm complex formation. A schematic representation of the Parkin constructs used for crystallization is shown at the bottom. (D) Crystal structure of the trans-complex of phospho-Parkin with pUb (brown) shows phospho-Ubl domain (wheat) bound to RING0 (cyan) domain of Parkin (cyan).
-
Figure 4—source data 1
Raw image files.
- https://cdn.elifesciences.org/articles/96699/elife-96699-fig4-data1-v1.docx
Figure 4—figure supplement 1
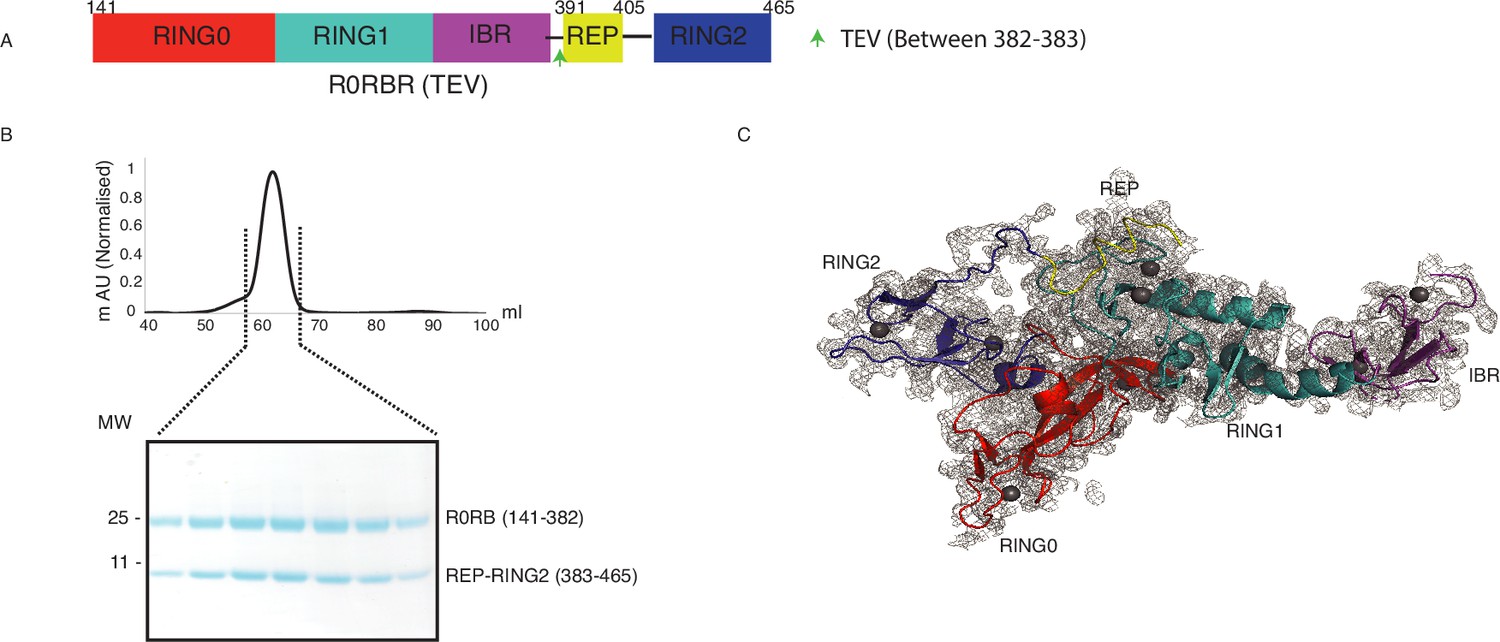
Parkin treatment with TEV does not affect native interactions.
(A) Schematic representation of the R0RBR (TEV) construct. TEV site incorporated in the Parkin construct is marked with a green arrow. (B) Purification of untethered R0RBR (TEV) over Hiload 16/600 Superdex 75 pg column. Fractions from the highlighted region of the peak were loaded on SDS-PAGE (lower panel). (C) Crystal structure of untethered R0RBR (TEV). The 2Fo-Fc map is shown in grey. Parkin domains are shown in different colors.
-
Figure 4—figure supplement 1—source data 1
Raw image files.
- https://cdn.elifesciences.org/articles/96699/elife-96699-fig4-figsupp1-data1-v1.docx
Figure 4—figure supplement 2
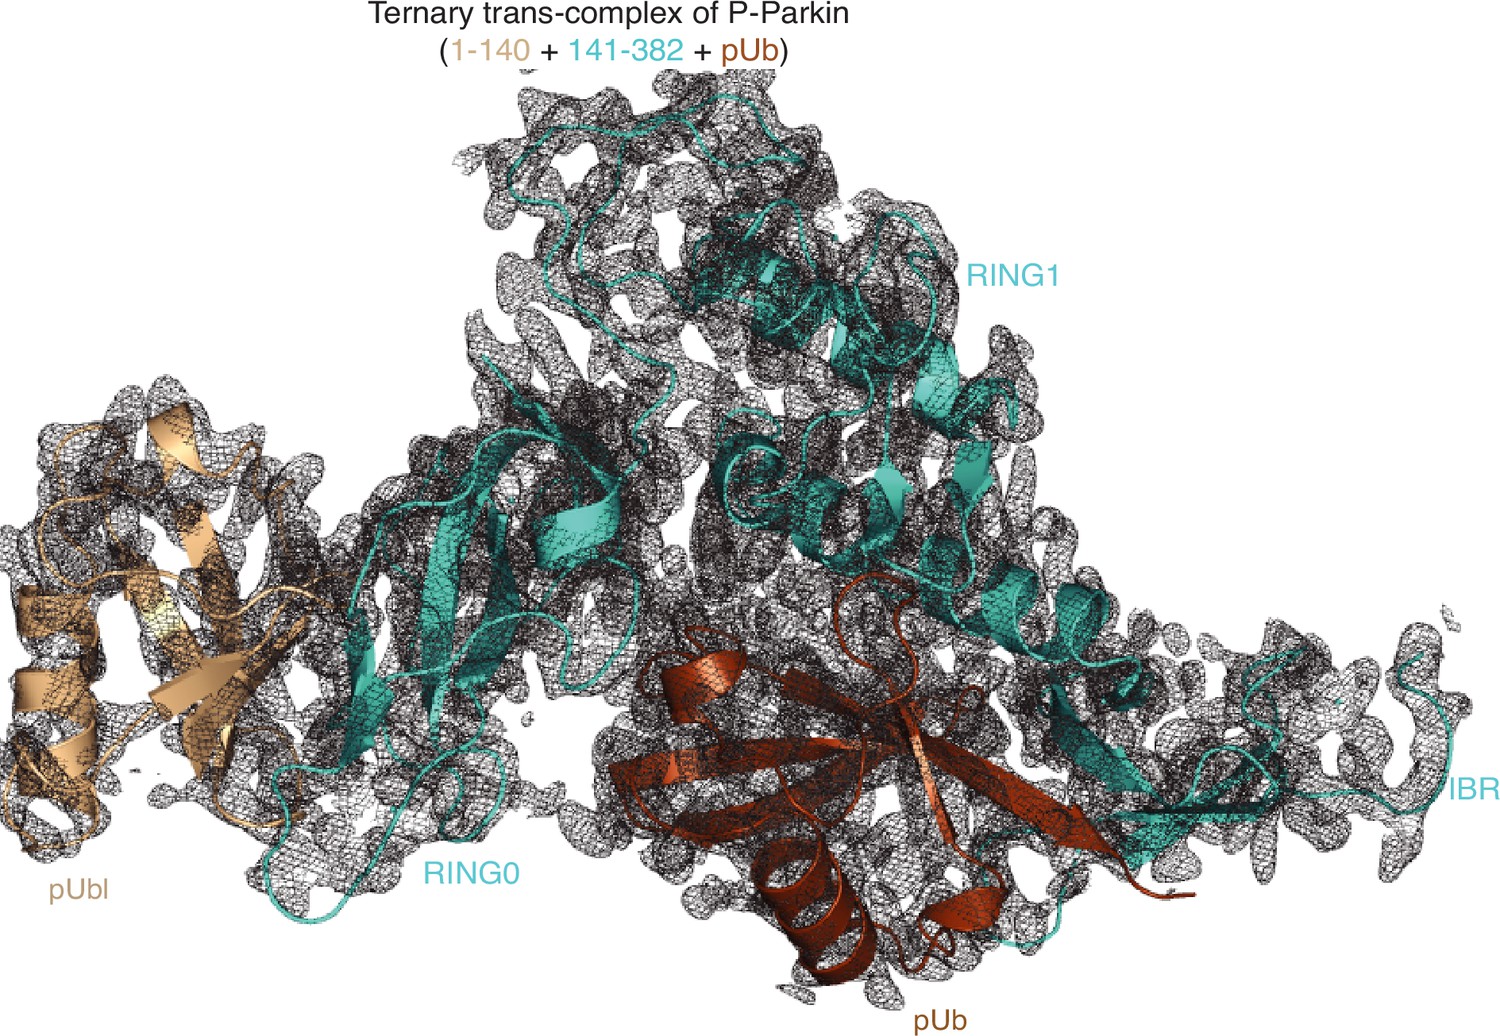
Electron density map of the ternary trans-complex of phospho-Parkin.
The 2Fo-Fc map (grey) of the ternary trans-complex of phospho-Parkin (1–140 (wheat) +141–382 (cyan) +pUb (brown)). The 2Fo-Fc map is contoured at 1.5 σ.
Figure 5 with 2 supplements
Parkin dimerization and trans-activation of native Parkin are mediated by phosphorylation of the Ubl domain of Parkin.
(A) SEC assay between phospho-Parkin and untethered ∆Ubl-Parkin. A colored key for each trace is provided. Coomassie-stained gels of indicated peaks are shown in the lower panel. TEV protein contamination is indicated (*). A schematic representation of the Parkin constructs used for experiments in panels A and B is shown at the top. (B) Isothermal Titration Calorimetry assay between phospho-Parkin and untethered ∆Ubl-Parkin (TEV). The dissociation constant (Kd) is shown (C) SEC assay between phospho-Parkin and untethered WT-Parkin (TEV) (upper panel) or untethered Parkin K211N (TEV) (lower panel). A schematic representation of the Parkin constructs used for experiments in panels C and D is shown at the bottom. (D) SEC-MALS assay to confirm the complex formation between untethered WT-Parkin (TEV) and phospho-Parkin. (E) Ubiquitination assays to check the WT-Parkin activation (right panel) with increasing concentrations of phospho-Parkin T270R/C431A. A non-specific, ATP-independent band is indicated (*). The lower panel shows a Coomassie-stained loading control.
-
Figure 5—source data 1
Raw image files.
- https://cdn.elifesciences.org/articles/96699/elife-96699-fig5-data1-v1.docx
Figure 5—figure supplement 1
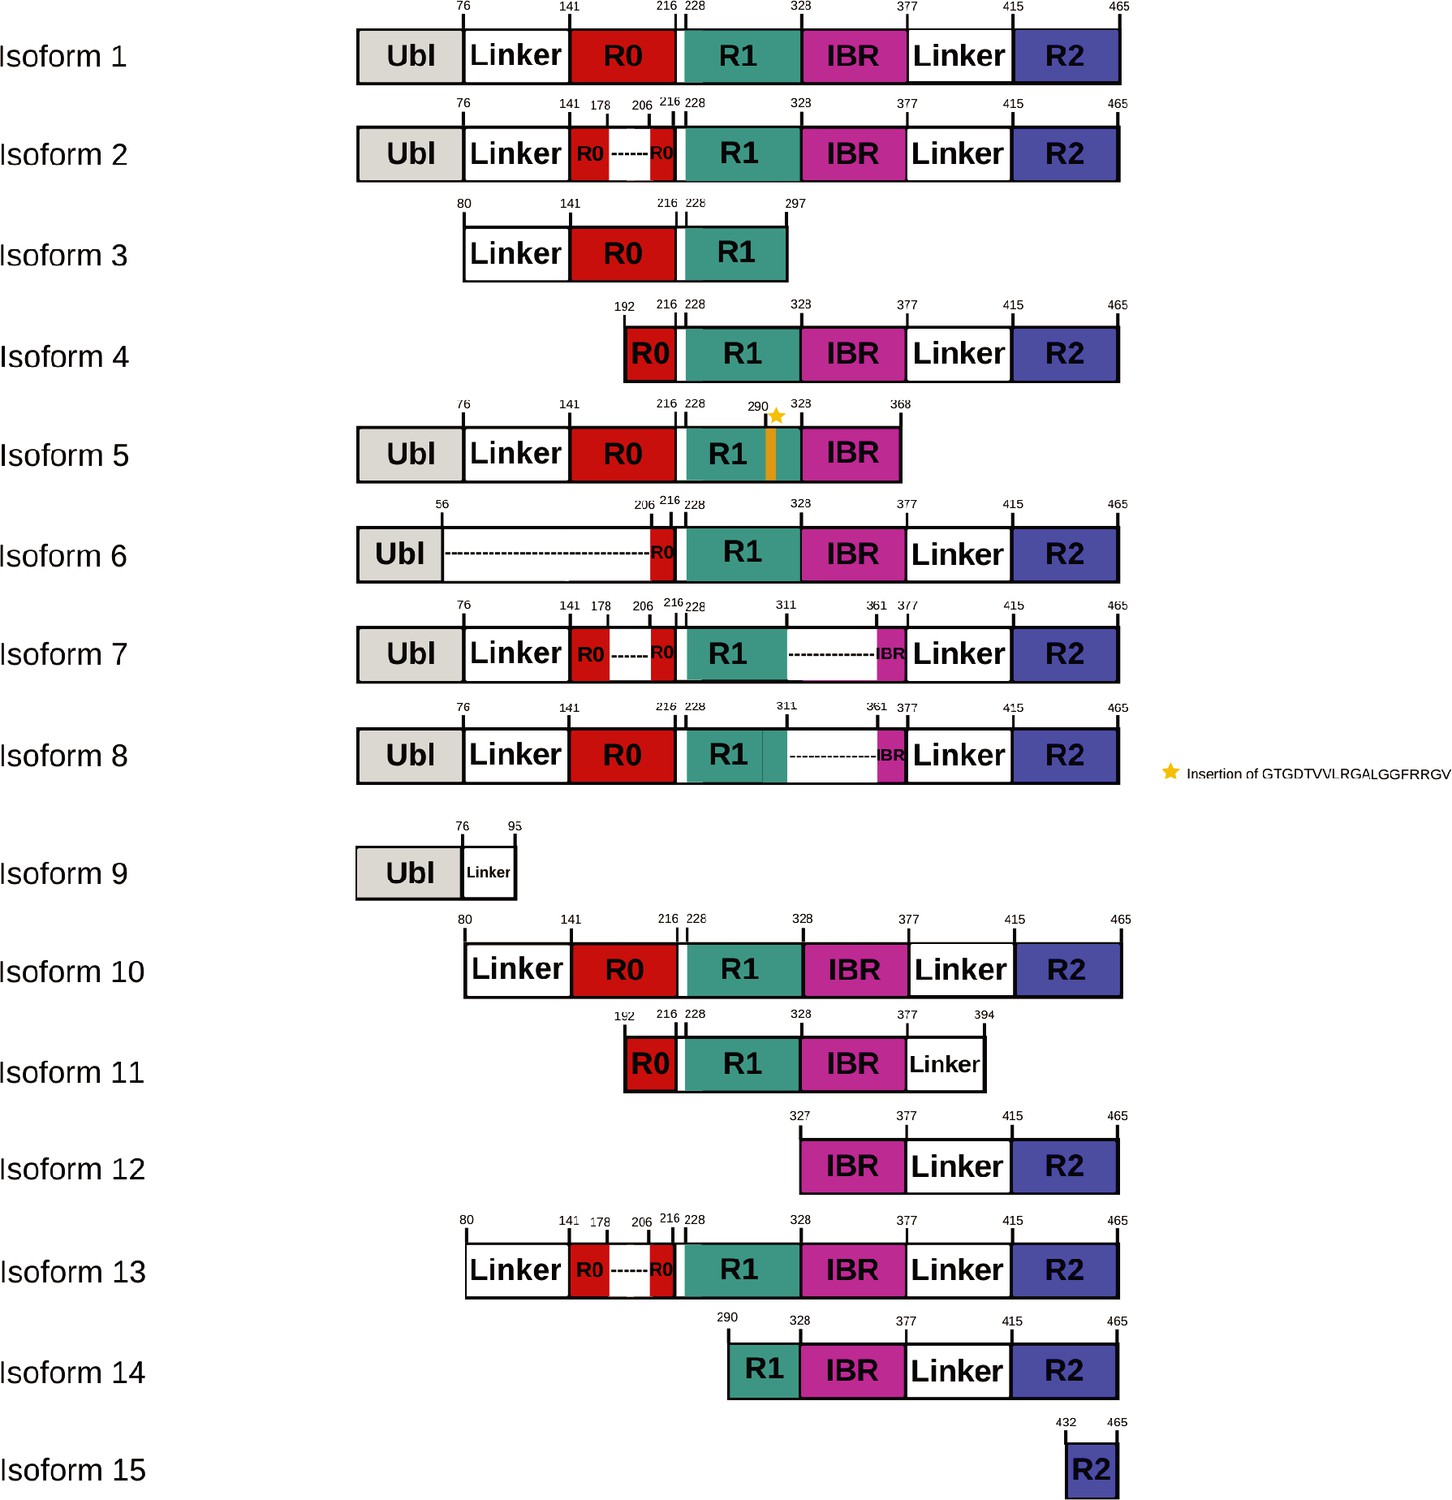
Schematic representation of domain organization in various isoforms (La Cognata et al., 2018; Scuderi et al., 2014) of Parkin.
Figure 5—figure supplement 2
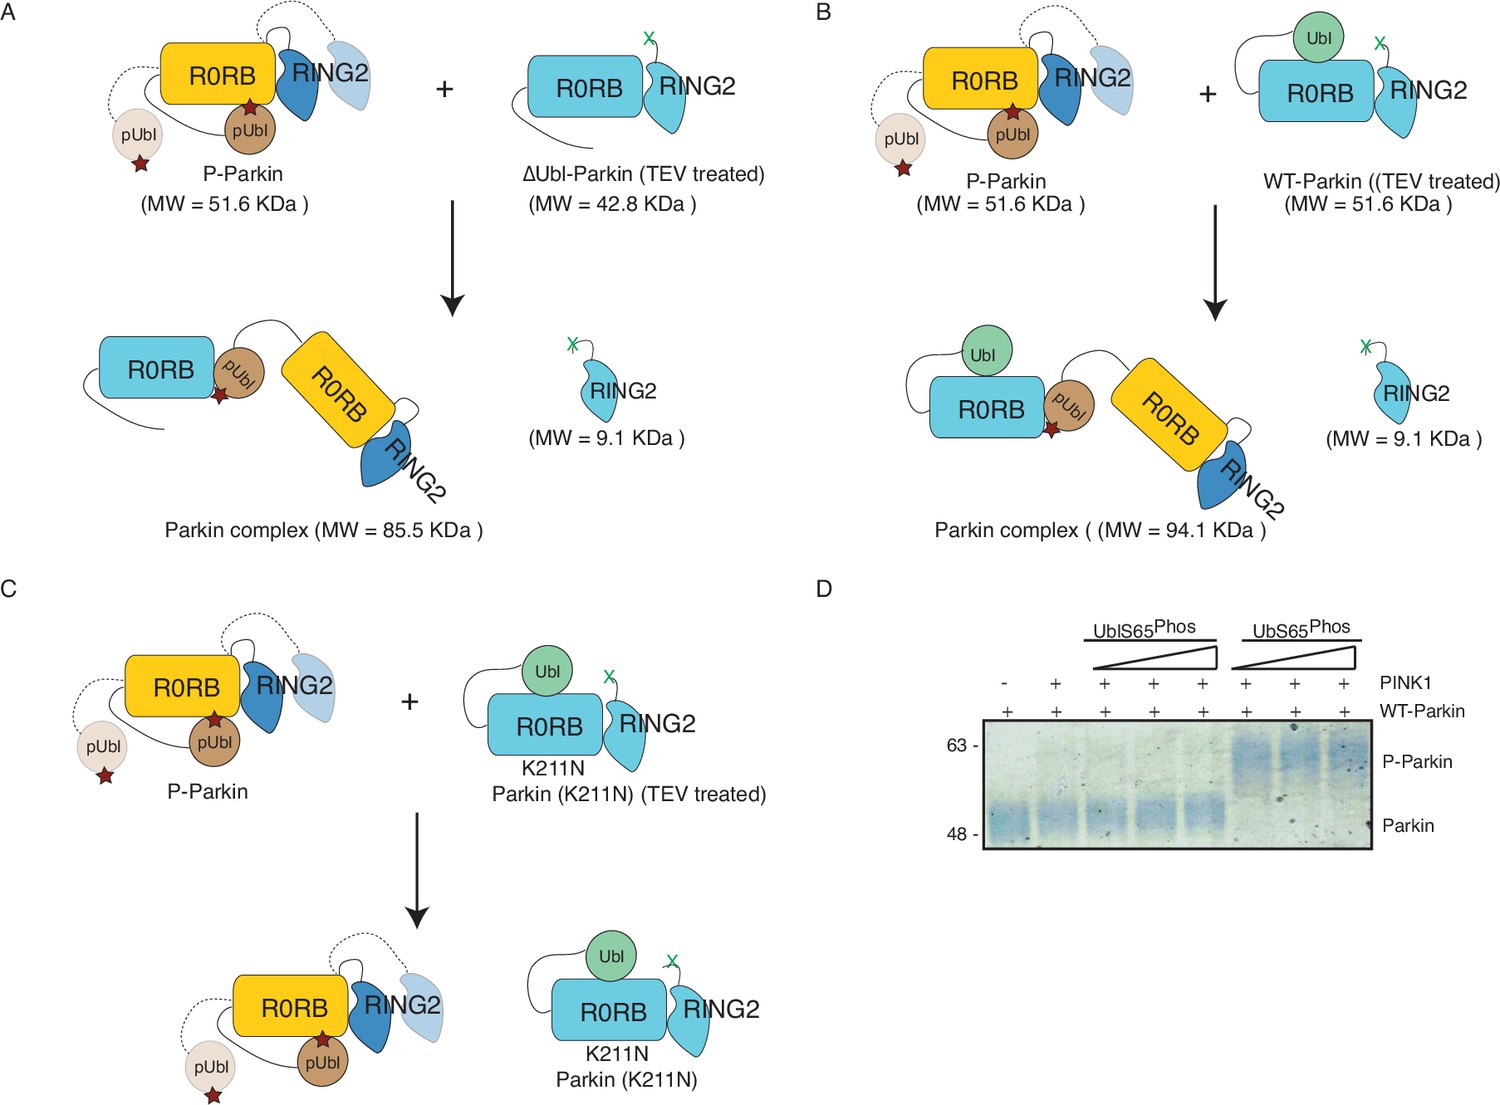
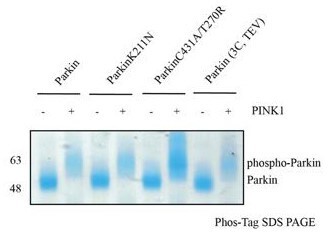
Phosphorylation of Parkin leads to the association of Parkin molecules in trans.
A, B, C, Schematic representation of SEC assay from Figure 5A, C and D, respectively. (D) Phos-Tag analysis shows the effect of pUbl (1-76) or pUb (1-76) on the phosphorylation of Parkin by PINK1.
-
Figure 5—figure supplement 2—source data 1
Raw image files.
- https://cdn.elifesciences.org/articles/96699/elife-96699-fig5-figsupp2-data1-v1.docx
Figure 6 with 1 supplement
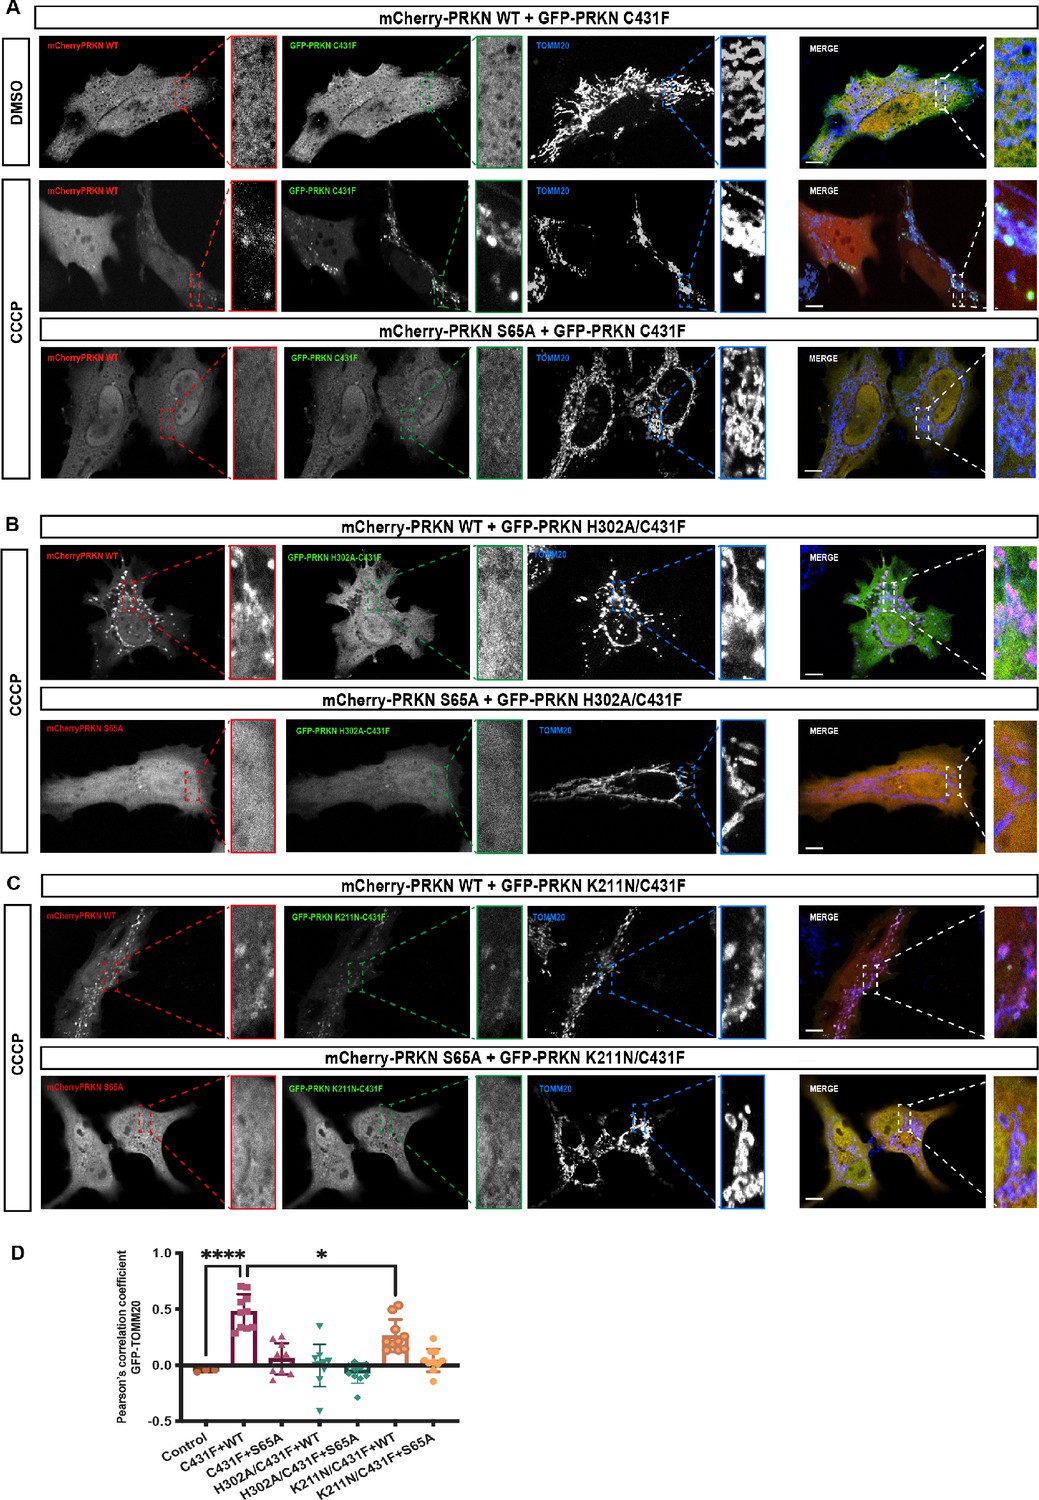
Analysis of Parkin mutant recruitment to mitochondria in HeLa cells.
(A) Immunofluorescence of HeLa cells co-transfected with either mCherry-Parkin wild-type (WT) or mCherry-Parkin S65A and GFP-Parkin C431F or, (B) GFP-Parkin H302A/C431F and, (C) GFP-Parkin K211N/C431F. Cells were treated for 1 hr with 10 μM CCCP, and DMSO was used as a control. Mitochondria were labeled with anti-TOMM20 antibody (blue). Scale bar = 10 μm. (D) Quantification of GFP- Parkin (WT and mutants) on mitochondria. The co-localization of GFP-Parkin (WT and mutants) with TOMM20 (mitochondria) was evaluated using Pearson’s correlation coefficient. Errors are represented as S.D. Statistical differences in Pearson’s correlation coefficient were evaluated using one-way ANOVA and Tukey’s multiple comparisons post-test. Statistical significance is as follows: *, p < 0.05; ****, p < 0.0001.
Figure 6—figure supplement 1
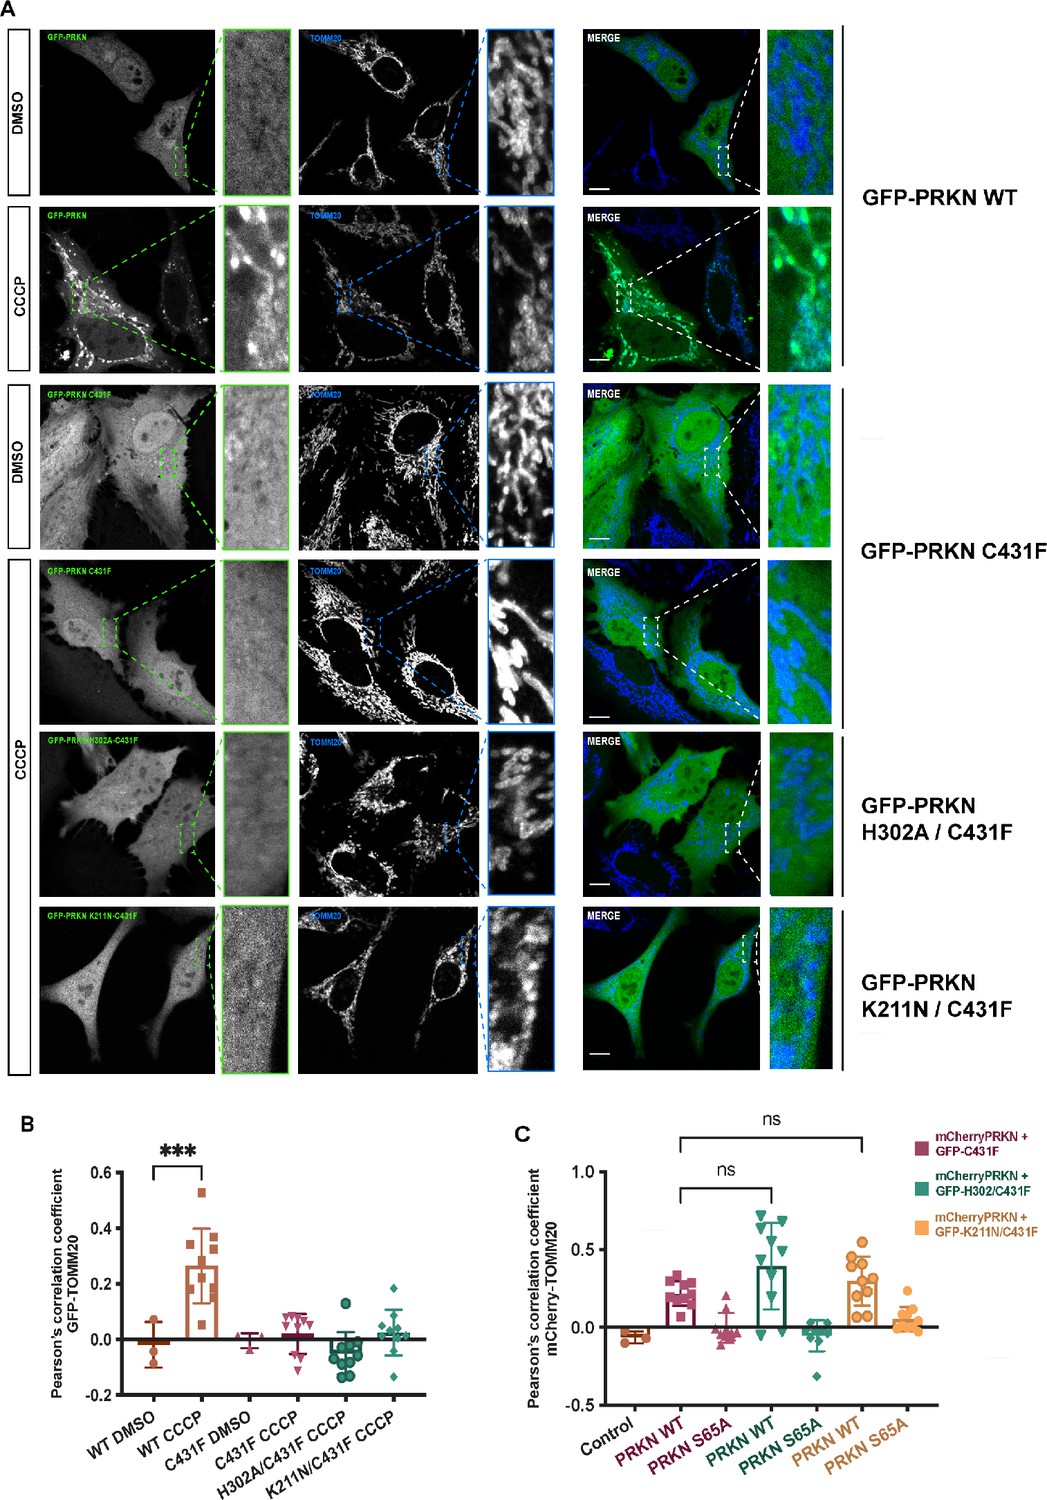
Parkin localization on mitochondria.
(A) HeLa cells were transfected with plasmid for GFP-Parkin wild-type (WT), GFP-Parkin C431F, GFP-Parkin H302A/C431F and GFP-Parkin K211N/C431F. Cells were treated for 1 hr with 10 μM CCCP or DMSO. Mitochondria were labeled with anti-TOMM20 antibody (blue). Scale bar = 10 μm. (B) Quantification of GFP-Parkin (WT and mutants) on mitochondria ***, p < 0.001. (C) Quantification of mCherry-Parkin (WT and S65A) on mitochondria in Figure 4, ns = not significant.
Figure 7
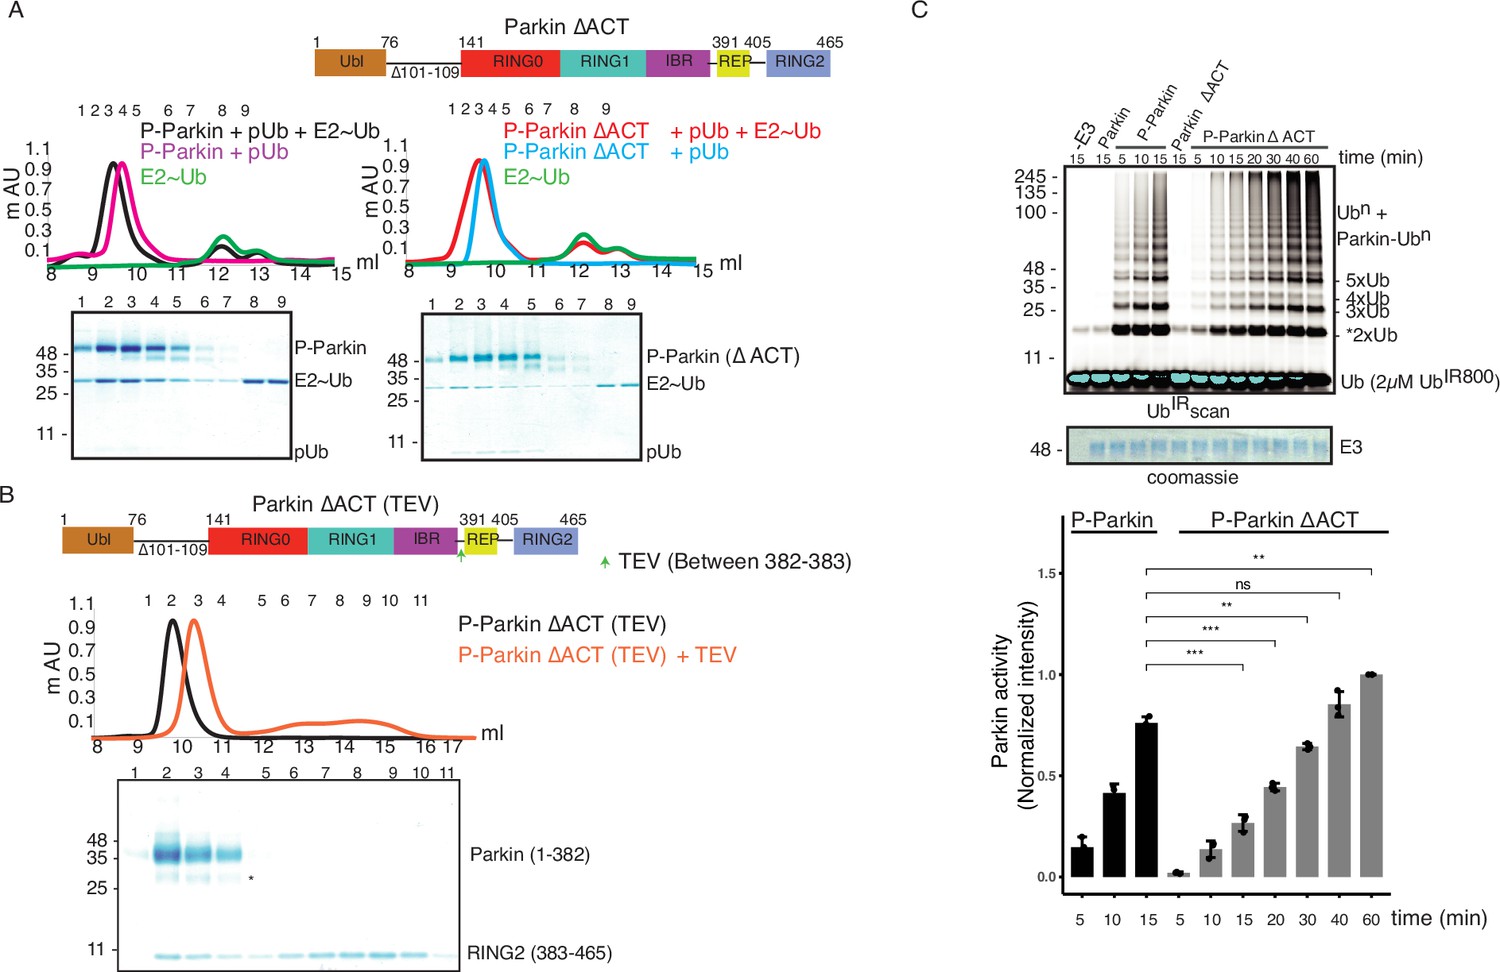
ACT plays a crucial role in enzyme kinetics.
(A) Size-exclusion chromatography (SEC) assay to test the binding of E2~Ubdon with phospho-Parkin (left panel) or phospho-Parkin ∆ACT (right panel). Assays were done using Parkin in a complex with pUb. A colored key for each trace is provided. Coomassie-stained gels of indicated peaks are shown in the lower panel. The upper panel shows a schematic representation of the Parkin ∆ACT construct used. (B) Size-exclusion chromatography (SEC) assay to check displacement of the RING2 domain after phosphorylation of Parkin ∆ACT. The upper panel shows a schematic representation of the Parkin ∆ACT construct used for the RING2 displacement assay. Conformational changes in Parkin, as observed by the SEC experiment, are shown schematically. (C) Ubiquitination assay to check the effect of ACT deletion (∆ACT) on Parkin activity. A non-specific, ATP-independent band is indicated (*). The middle panel shows a Coomassie-stained loading control. In the lower panel, the bar graph shows the integrated intensities of ubiquitin levels from three independent experiments (mean ± s.e.m.). Statistical significance was determined using pair-wise student’s t-test (**p<0.01, ***p<0.001, ns-nonsignificant).
-
Figure 7—source data 1
Raw image files.
- https://cdn.elifesciences.org/articles/96699/elife-96699-fig7-data1-v1.docx
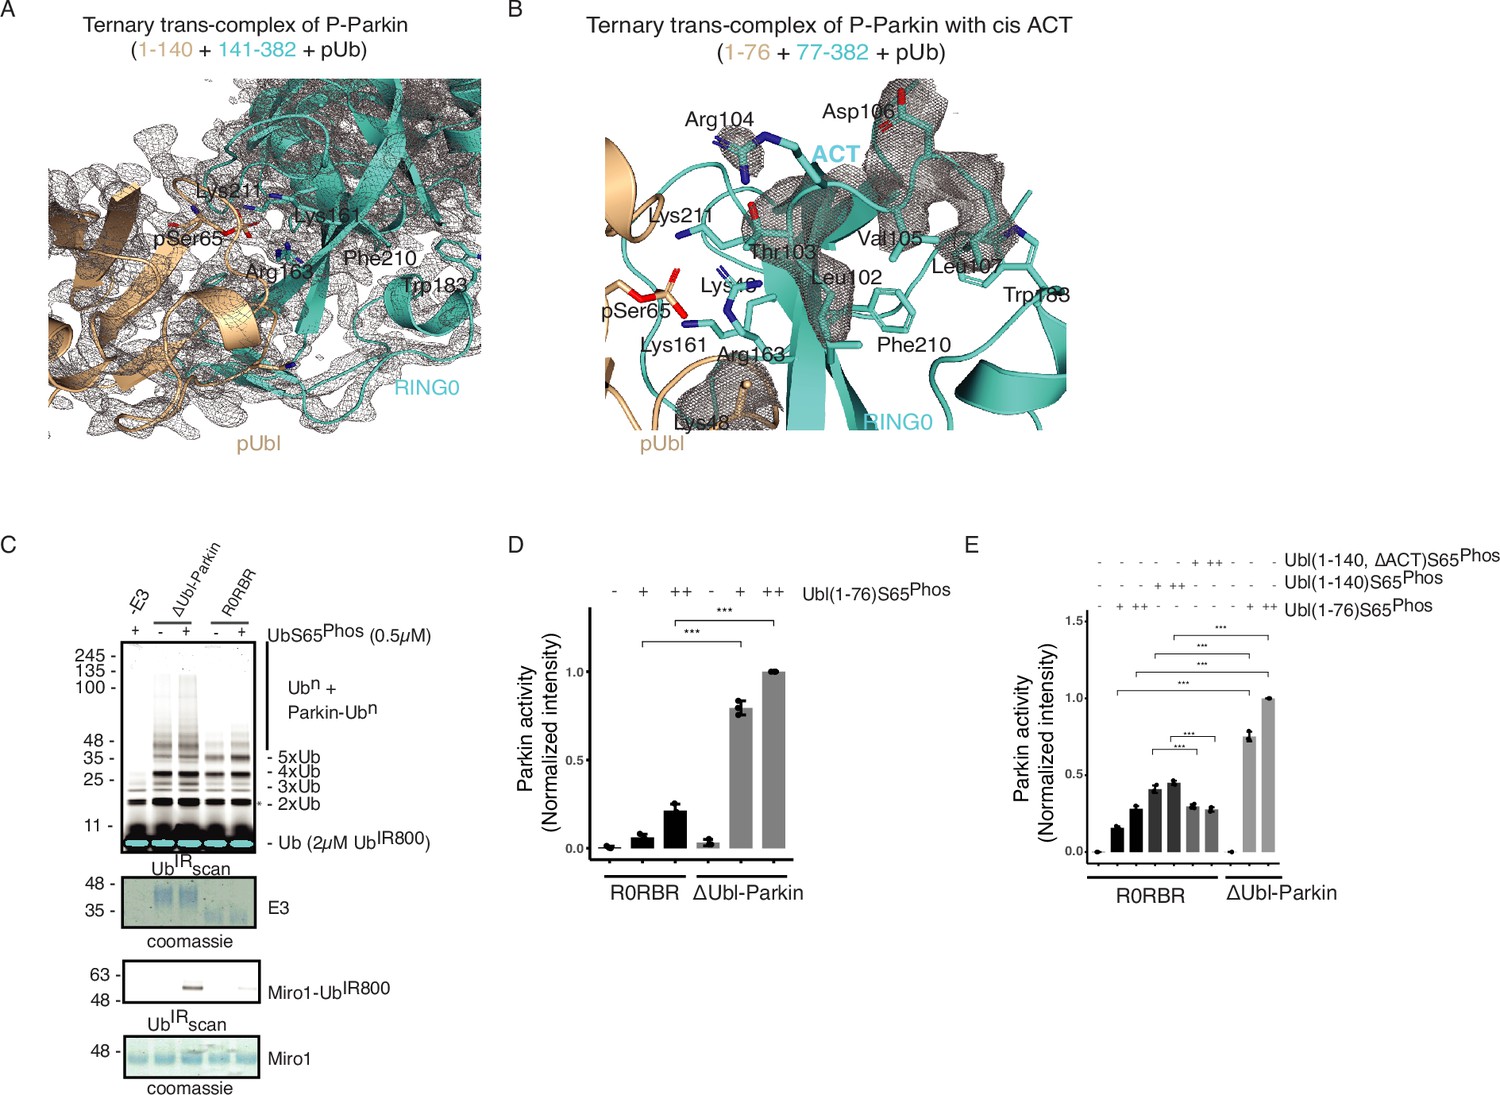
Figure 8 with 1 supplement
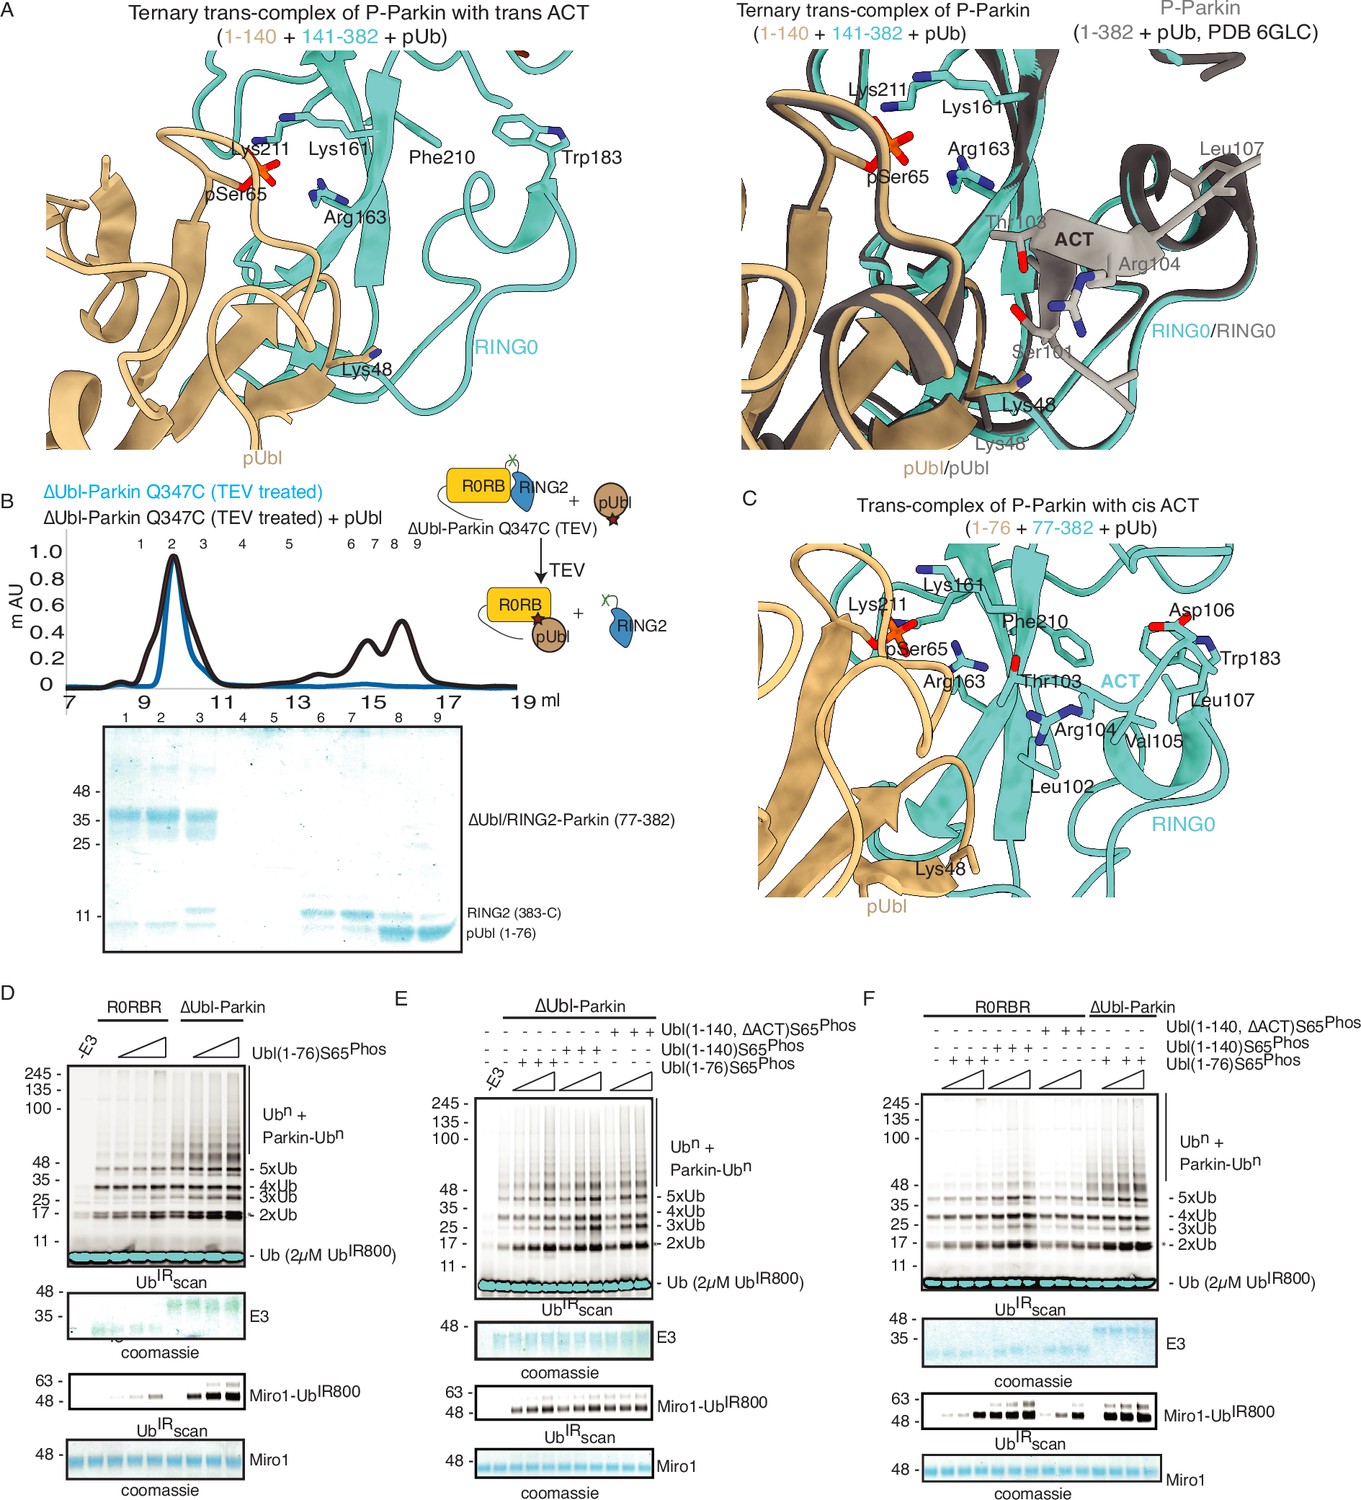
ACT is more efficient in cis.
(A) Crystal structure of ternary trans-complex of phospho-Parkin with pUb (1–140+141-382 + pUb), left panel. pUbl (wheat) and RING0 (cyan) of Parkin are shown. The right panel shows superimposed structures of ternary trans-complex of phospho-Parkin with pUb, colored as the left panel, and the phospho-Parkin complex with pUb (PDBID: 6GLC) is shown in grey. (B) SEC assay to check the binding between untethered ∆Ubl-Parkin (TEV) and phospho-Ubl (1-76). A colored key for each trace is provided. Coomassie-stained gels of indicated peaks are shown in the lower panel. (C) Crystal structure of ternary trans-complex of phospho-Parkin with cis ACT (1–76+77-382 + pUb) shows ACT (cyan) present in the pocket on RING0 (Cyan) and pUbl (wheat) in the vicinity. (D) Comparison of R0RBR and ∆Ubl-Parkin activation using the increasing concentrations of pUbl (1-76). A non-specific, ATP-independent band is indicated (*). The middle panel shows a Coomassie-stained loading control. The lower panel shows Miro1 ubiquitination for the respective proteins in the upper lane. Coomassie-stained gel showing Miro1 is used as the loading control of substrate ubiquitination assay. (E) Ubiquitination assay of ∆Ubl-Parkin with increasing concentrations of pUbl (1-76), pUbl-linker (1-140), pUbl-linker-∆ACT (1–140, ∆101–109). A non-specific, ATP-independent band is indicated (*). The middle panel shows a Coomassie-stained loading control. The lower panel shows Miro1 ubiquitination for the respective proteins in the upper lane. Coomassie-stained gel showing Miro1 is used as the loading control of substrate ubiquitination assay. (F) Comparison of R0RBR and ∆Ubl-Parkin activation using the increasing concentrations of pUbl (1-76)/pUbl-linker (1-140)/pUbl-linker-∆ACT (1–140, ∆101–109). A non-specific, ATP-independent band is indicated (*). The middle panel shows a Coomassie-stained loading control. The lower panel shows Miro1 ubiquitination for the respective proteins in the upper lane. Coomassie-stained gel showing Miro1 is used as the loading control of substrate ubiquitination assay.
-
Figure 8—source data 1
Raw image files.
- https://cdn.elifesciences.org/articles/96699/elife-96699-fig8-data1-v1.docx
Figure 8—figure supplement 1
Role of ACT in Parkin activation.
(A) The 2Fo-Fc map (grey) of the crystal structure of the ternary trans-complex of phospho-Parkin (1–140 (wheat) +141–382 (cyan)) with pUb. The 2Fo-Fc map is contoured at 1.0 σ. (B) The 2Fo-Fc map (grey) of the ACT region of the ternary trans-complex structure of phospho-Parkin with cis ACT (1–76 (wheat) +77–382 (cyan)). The 2Fo-Fc map is contoured at 1.0 σ. (C) Comparison of ubiquitination activity of ∆Ubl-Parkin and R0RBR. A non-specific, ATP-independent band is indicated (*). The middle panel shows a Coomassie-stained loading control. The lower panel shows Miro1 ubiquitination for the respective proteins in the upper lane. Coomassie-stained gel showing Miro1 is used as the loading control of substrate ubiquitination assay. (D) The bar graph shows the integrated intensities of Miro1 ubiquitination levels from three independent experiments (mean ± s.e.m.). pUbl was added in twofold (+) or fourfold (++) molar excess. Statistical significance was determined using pair-wise student’s t-test (***p<0.001). (E) The bar graph shows the integrated intensities of Miro1 ubiquitination levels from three independent experiments (mean ± s.e.m.). Various pUbl constructs were added in twofold (+) or fourfold (++) molar excess. Statistical significance was determined using pair-wise student’s t-test (***p<0.001).
-
Figure 8—figure supplement 1—source data 1
Raw image files.
- https://cdn.elifesciences.org/articles/96699/elife-96699-fig8-figsupp1-data1-v1.docx
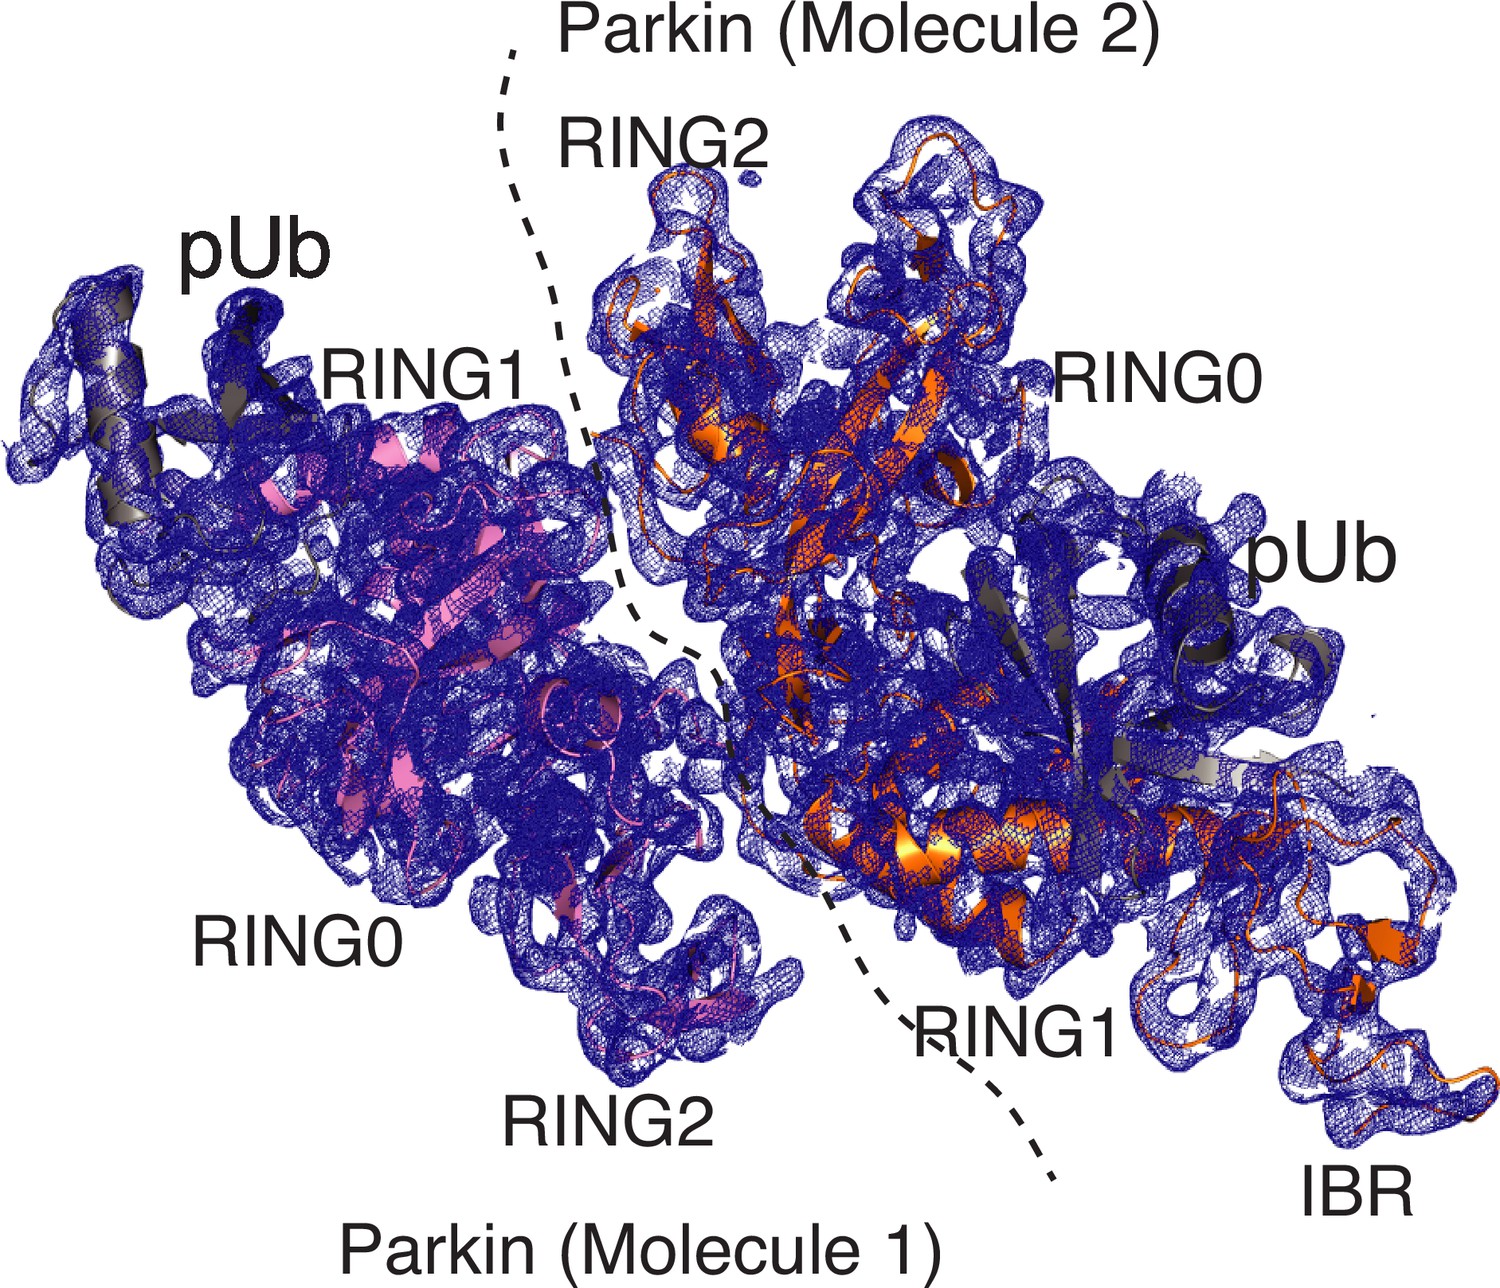
Figure 9 with 2 supplements
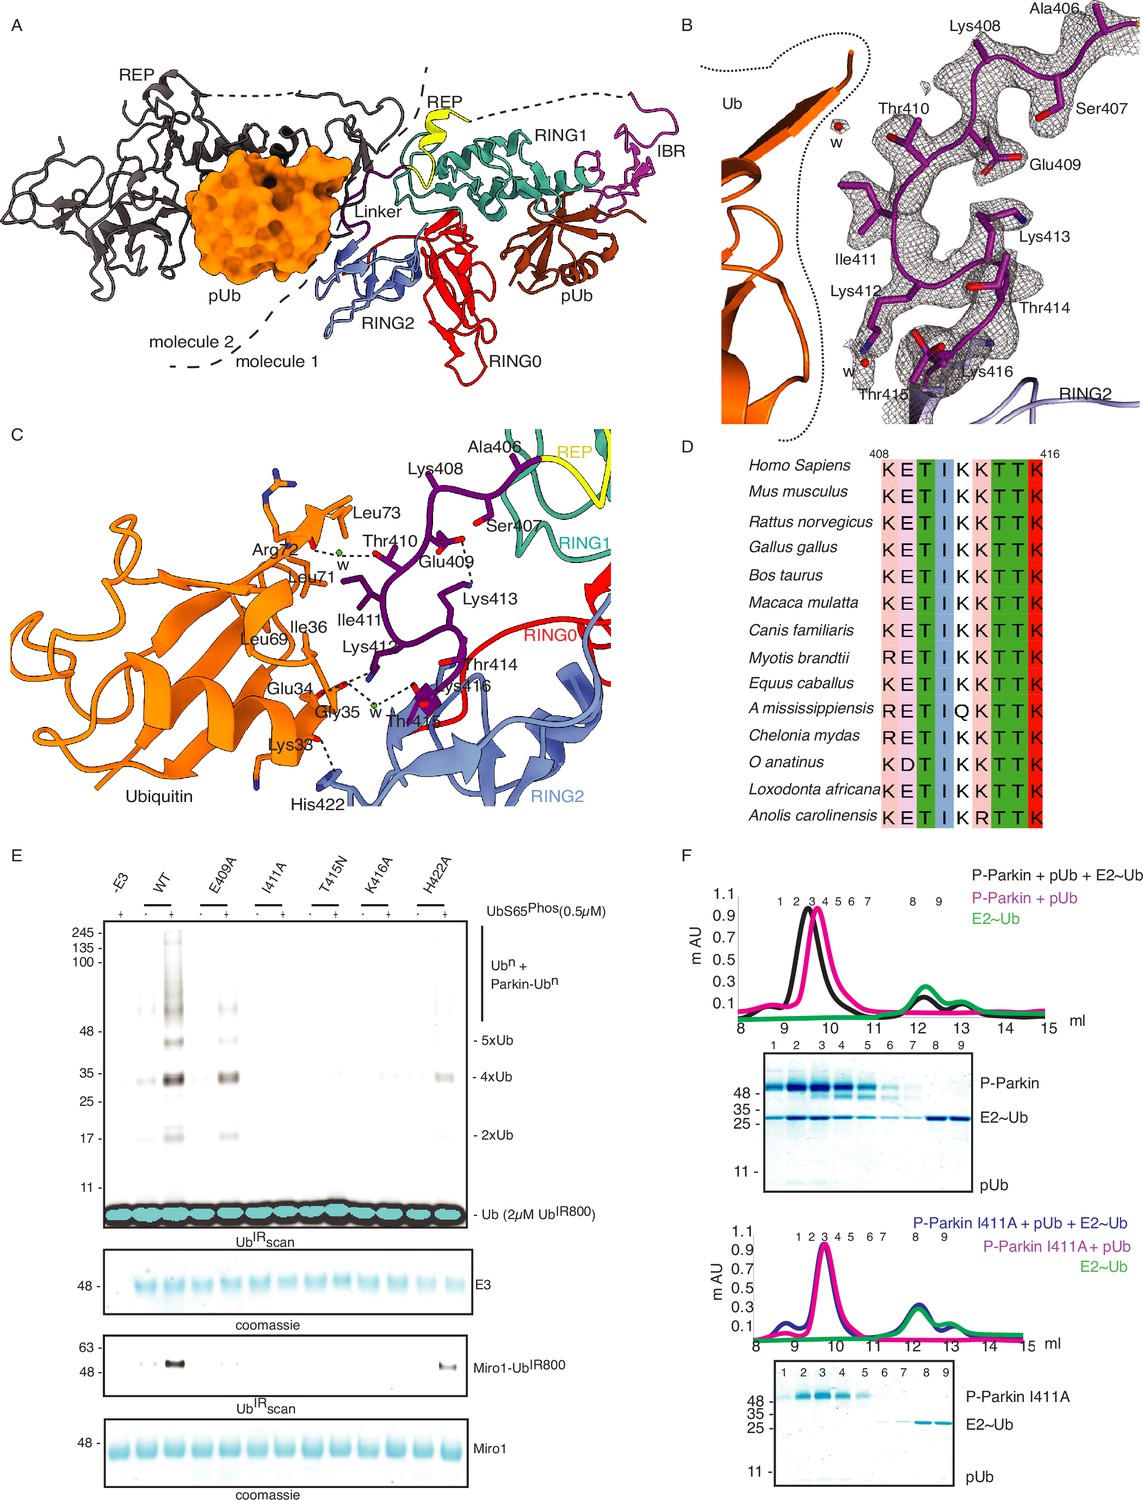
Linker (408-415) of Parkin binds with donor ubiquitin (Ubdon) of E2-Ubdon.
(A) The asymmetric unit of the crystal structure of pUbl-linker (1-140) depleted R0RBR (R163D/K211N)-pUb complex. Parkin molecule-1 (domains are shown in different colors) and pUb (brown) are shown. Parkin molecule-2 (grey) and pUb (orange) are shown. The interface of two Parkin molecules is highlighted (dashed line). (B) The 2Fo-Fc map (grey) of the linker region between REP and RING2. 2Fo-Fc map is contoured at 1.5 σ. Water molecules are represented as w. (C) Crystal structure shows interactions between the linker (408-415) and ubiquitin. Different regions are colored as in panel A. Hydrogen bonds are indicated as dashed lines. (D) Sequence alignment of Parkin from various species highlighting conservation in the linker (408-415) region. Residue numbers shown on top of sequence alignment are according to human Parkin. (E) Ubiquitination assay of Parkin mutants in the linker region. The middle panel shows a Coomassie-stained loading control. The lower panel shows Miro1 ubiquitination for the respective proteins in the upper lane. Coomassie-stained gel showing Miro1 is used as the loading control of substrate ubiquitination assay. (F) Size-exclusion chromatography (SEC) assay to compare the binding of E2~Ub with phospho-Parkin (upper panel) or phospho-Parkin I411A (lower panel). Assays were done using Parkin in a complex with pUb. A colored key for each trace is provided. Coomassie-stained gels of indicated peaks are shown.
-
Figure 9—source data 1
Raw image files.
- https://cdn.elifesciences.org/articles/96699/elife-96699-fig9-data1-v1.docx
Figure 9—figure supplement 1
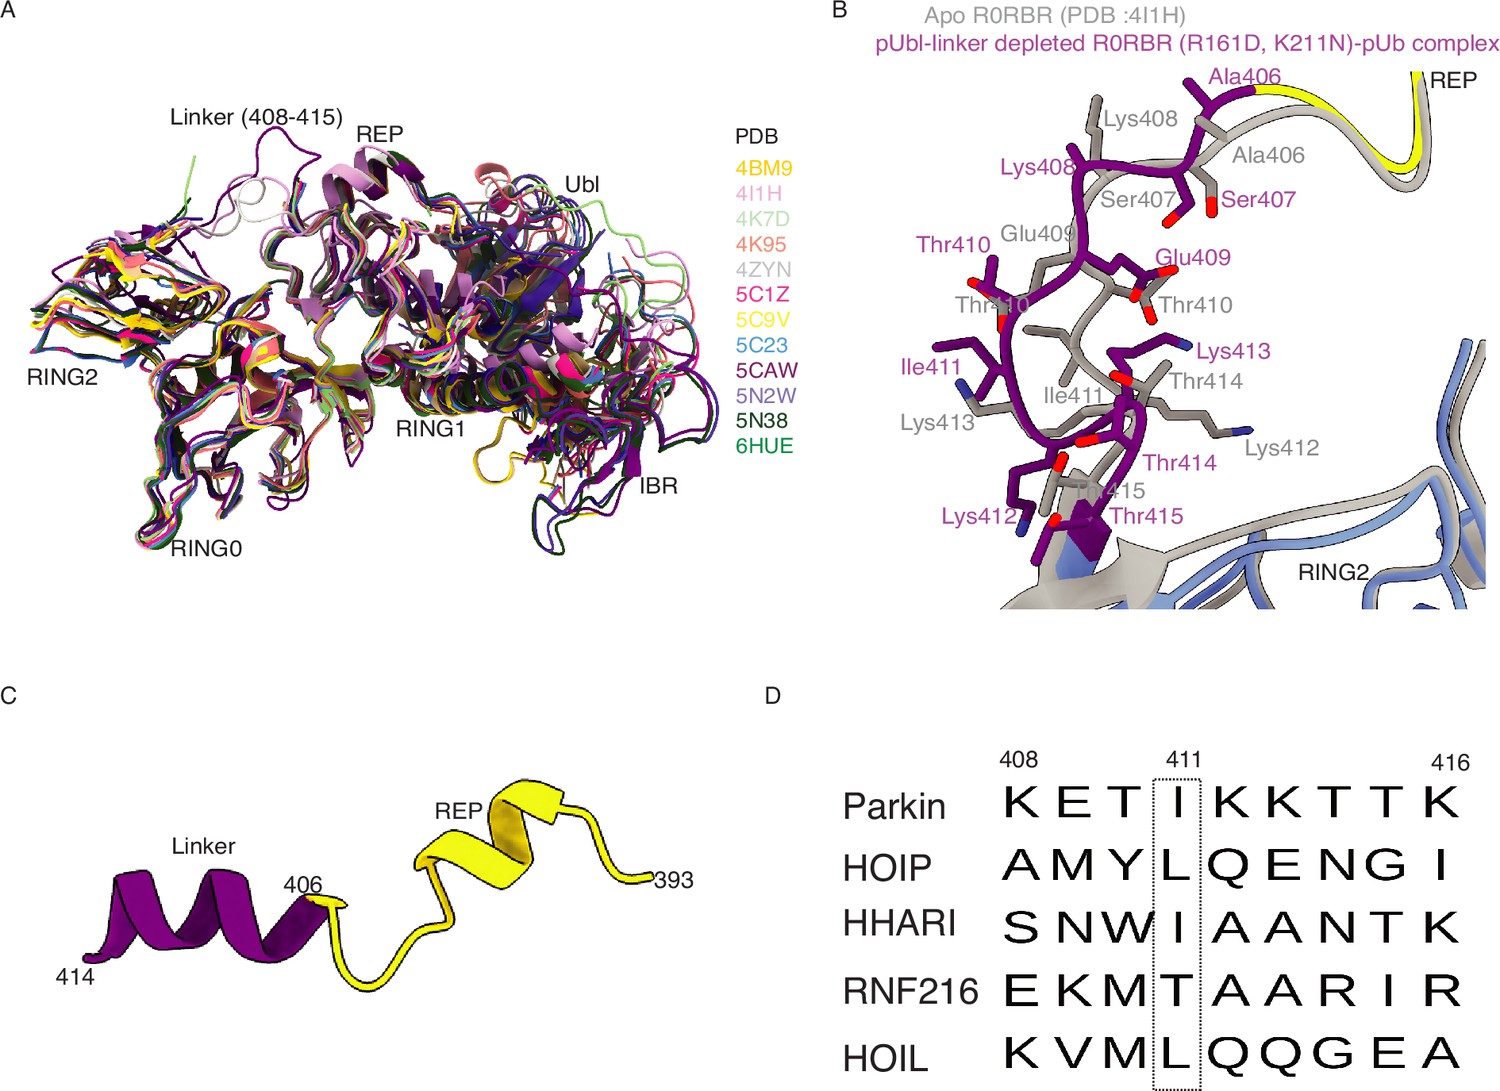
The linker connecting REP and RING2 shows conformational flexibility.
(A) Superimposition of Parkin structures shows the flexible nature of the linker between REP-RING2. Different Parkin structures are colored according to their PDB code. (B) Superimposition of pUbl-linker (1-140) depleted R0RBR (R163D/K211N)-pUb complex with apo R0RBR (144–465, PDBID: 4I1H) shows conformational changes in the linker region (408–415, purple) of Parkin. Apo R0RBR (PDBID: 4I1H) structure is shown in grey. (C) Conformation of REP-linker predicted from AlphaFold 2 (Mirdita et al., 2022). A Full-length Parkin sequence was used to model the Parkin structure using AlphaFold. (D) Sequence alignment of the linker connecting IBR-RING2 among various RBR family E3-ligases. The conserved hydrophobic patch among Parkin, HOIP, HHARI, and HOIL is highlighted (dashed box). The sequence numbering is according to human Parkin.
Figure 9—figure supplement 2
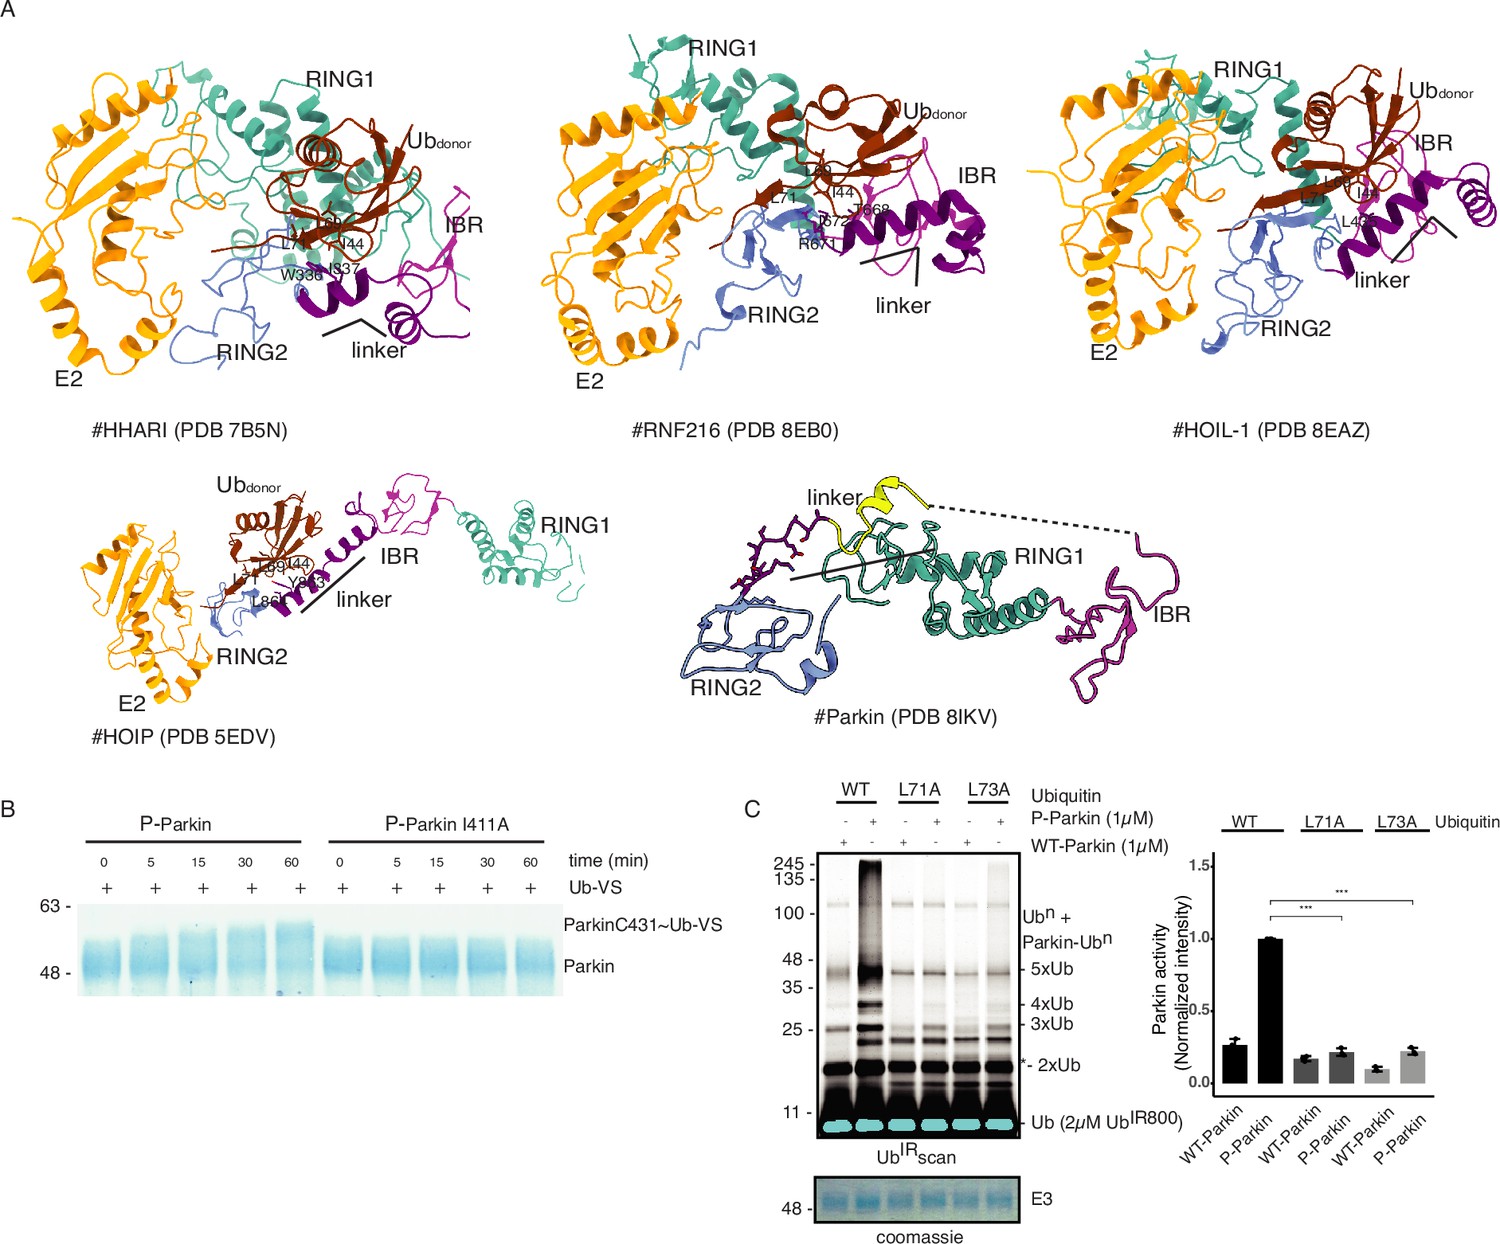
The linker connecting REP and RING2 domain binds with ubiquitin (Ubdon) of E2-Ub.
(A) Crystal structures of various RBR family E3-ligases in complex with E2-Ubdon complex reveal interactions between the linker (connecting IBR and RING2) and ubiquitin (Ubdon) of E2-Ubdon. Only RING1 (cyan), IBR (magenta), linker (purple), and RING2 (blue) are shown along with E2 (orange) and ubiquitin (Ubdon) (brown) of E2~Ub. (B) Ub-VS assay to probe reactivity with the catalytic C431 of RING2 of phospho-Parkin or phospho-Parkin I411A. (C) Ubiquitination assay to compare Parkin activity using WT/mutant ubiquitin. A non-specific, ATP-independent band is indicated (*). The lower panel shows a Coomassie-stained loading control. The bar graph shows the integrated intensities of ubiquitination levels from three independent experiments (mean ± s.e.m.). Statistical significance was determined using pair-wise student’s t-test (***p<0.001).
-
Figure 9—figure supplement 2—source data 1
Raw image files.
- https://cdn.elifesciences.org/articles/96699/elife-96699-fig9-figsupp2-data1-v1.docx
Figure 10
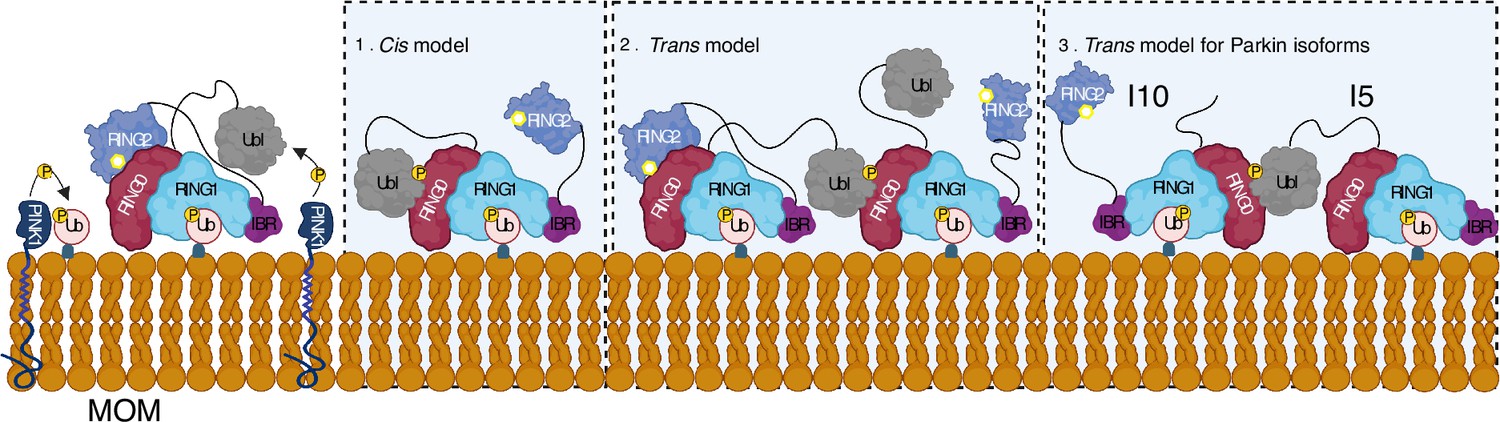
Model shows different modes of Parkin activation.
The cis activation model uses the binding of pUbl in the same molecule, thus resulting in the displacement of RING2 (1). The trans-activation model uses the binding of pUbl of fully activated Parkin (phospho-Parkin complex with pUb) with partially activated Parkin (WT-Parkin and pUb complex), thus resulting in the displacement of RING2 in trans (2). Recruitment and activation of Parkin isoforms lacking Ubl (Isoform 10) or RING2 domain (Isoform 5), thus complementing each other using the trans-activation model (3). Catalytic cysteine on RING2 is highlighted.
Author response image 1
Author response image 2

Author response image 3
Author response image 4
Tables
Table 1
Data collection and refinement statistics.
| Ternary trans-complex of phospho-Parkin (1–140 + 141-382 + pUb) | pUbl-linker depleted Parkin (141-465)-pUb complex | Untethered R0RBR | Ternary trans-complex of phospho-parkin with cis ACT (1–76 + 77-382 + pUb) | pUbl-linker depleted R0RBR (R163D/K211N)-pUb complex | |
|---|---|---|---|---|---|
| Data collection | |||||
| Resolution range | 34.30–1.92 (1.98–1.92) | 39.15–3.3 (3.41–3.3) | 48.28–2.9 (3.004–2.9) | 35.84–2.6 (2.69–2.6) | 37.47–2.35 (2.43–2.35) |
| Space group | P 32 2 1 | P 64 2 2 | C 2 2 21 | P 32 2 1 | P 1 21 1 |
| Cell dimensions | |||||
| a, b, c (Å) | 83.804, 83.804, 105.033 | 187.805, 187.805, 141.857 | 86.672, 132.579, 64.692 | 82.764, 82.764, 103.494 | 45.45, 76.426, 114.329 |
| α, β, γ (°) | 90, 90, 120 | 90, 90, 120 | 90, 90, 90 | 90, 90, 120 | 90, 100.485, 90 |
| Total reflections | 186235 (17323) | 373278 (38759) | 32244 (3362) | 170918 (17328) | 97886 (9139) |
| Unique reflections | 32991 (3234) | 22705 (2115) | 8492 (843) | 13023 (1273) | 31073 (3105) |
| Multiplicity | 5.6 (5.4) | 16.4 (17.4) | 3.8 (4.0) | 13.1 (13.6) | 3.2 (2.9) |
| Completeness (%) | 99.55 (99.35) | 91.65 (92.19) | 98.84 (99.29) | 99.17 (98.82) | 96.28 (96.61) |
| I/(I) | 14.09 (1.41) | 11.75 (0.72) | 11.83 (3.78) | 17.69 (1.94) | 12.45 (2.55) |
| Wilson B-factor | 43.26 | 132.82 | 49.22 | 46.5 | 40.73 |
| R-merge | 0.05746 (0.9399) | 0.1928 (3.632) | 0.09615 (0.3465) | 0.1416 (1.696) | 0.0735 (0.52) |
| CC1/2 | 0.993 (0.738) | 0.998 (0.48) | 0.993 (0.921) | 0.999 (0.763) | 0.996 (0.695) |
| Refinement | |||||
| Reflections used in refinement | 32964 (3229) | 20836 (2053) | 8492 (843) | 12933 (1258) | 31062 (3105) |
| R-work/R-free | 0.2031/0.2368 | 0.2360/0.2750 | 0.2180/0.2438 | 0.2141/0.2355 | 0.1952/0.2119 |
| No of Atoms | |||||
| macromolecules | 2937 | 5457 | 2396 | 3006 | 6033 |
| Ligands | 19 | 59 | 21 | 30 | 37 |
| Solvent | 96 | 2 | 19 | 52 | 258 |
| RMS deviations | |||||
| Bond length (Å) | 0.008 | 0.009 | 0.008 | 0.009 | 0.007 |
| Bond angles (°) | 1.20 | 1.24 | 1.64 | 1.20 | 1.17 |
| B-factors | |||||
| macromolecules | 61.01 | 150.78 | 44.37 | 64.69 | 44.87 |
| Ligands | 70.26 | 196.7 | 45.47 | 79.76 | 48.68 |
| Solvent | 60.53 | 118 | 38.72 | 65.63 | 47.36 |
| Accession code | 8IKM | 8IK6 | 8JWV | 8IKT | 8IKV |
-
Data collection and Refinement statistics.
-
Statistics for the highest-resolution shell are shown in parentheses.
Key resources table
| Reagent type (species) or resource | Designation | Source or reference | Identifiers | Additional information |
|---|---|---|---|---|
| Strain, strain background (E. coli) | DH5α | Invitrogen | Cat.#18265017 | |
| Strain, strain background (E. coli) | BL21(DE3) pLysS | Invitrogen | Cat.# C606010 | |
| Cell line | Hela | ATCC | CCL-2 | |
| Antibody | Anti-TOMM20 (Rabbit monoclonal) | Abcam | ab186735 RRID:AB_2889972 | IF 1:100 |
| Antibody | Alexa Fluor 405 secondary antibody (Donkey polyclonal) | Thermo Fisher | A-48258 RRID:AB_2890547 | IF 1:1000 |
| Recombinant DNA reagent | pET15b-Parkin (plasmid) | This paper | See Materials and methods, Molecular biology section | |
| Recombinant DNA reagent | pGEX-6P1-Miro1 (plasmid) | This paper | See Materials and methods, Molecular biology section | |
| Recombinant DNA reagent | pET28a-Ph-PINK1 (plasmid) | Addgene | Cat. # 110750 | |
| Recombinant DNA reagent | pET21d-Ube1 (plasmid) | Addgene | Cat. # 34965 | |
| Recombinant DNA reagent | GFP-Parkin plasmid | MRC PPU Reagents & Services | DU23318 | |
| Recombinant DNA reagent | mCherry-Parkin (plasmid) | MRC PPU Reagents & Services | DU77708 | |
| Recombinant DNA reagent | mCherry-Parkin-S65A (plasmid) | MRC PPU Reagents & Services | DU77709 | |
| Recombinant DNA reagent | GFP-Parkin-C431F (plasmid) | MRC PPU Reagents & Services | DU77645 | |
| Recombinant DNA reagent | GFP-Parkin-K211N-C431F (plasmid) | MRC PPU Reagents & Services | DU77659 | |
| Recombinant DNA reagent | GFP-Parkin-H302A-C431F (plasmid) | MRC PPU Reagents & Services | DU77713 | |
| Sequence-based reagent | Hsparkin-TEV-F | This paper | PCR primers | GAGTGCAGTGCCGTATTTGAGAACCTGTATTTTCAGTCACAGGCCTACAGAGTCGAT |
| Sequence-based reagent | Hsparkin-TEV-R | This paper | PCR primers | ATCGACTCTGTAGGCCTGTGACTGAAAATACAGGTTCTCAAATACGGCACTGCACTC |
| Sequence-based reagent | Ubl140_pre_F | This paper | PCR primers | AAGTGCTGTTTCAGGGCCCGTCAATCTACAACAGCTTTTATG |
| Sequence-based reagent | Ubl140_pre_R | This paper | PCR primers | CCCTGAAACAGCACTTCCAGTCTACCTGCTGGACTTCC |
| Sequence-based reagent | ParkinK211N_F | This paper | PCR primers | TGCAGAATTTTTCTTTAATTGTGGAGCACACCC |
| Sequence-based reagent | ParkinK211N_R | This paper | PCR primers | GGGTGTGCTCCACAATTAAAGAAAAATTCTGCA |
| Sequence-based reagent | HsParkinR163D-F | This paper | PCR primers | GTGCAGCCGGGAAAACTCGATGTACAGTGCAGCACCTGC |
| Sequence-based reagent | HsParkinR163D-R | This paper | PCR primers | GCAGGTGCTGCACTGTACATCGAGTTTTCCCGGCTGCAC |
| Sequence-based reagent | Parkin_delACT_F | This paper | PCR primers | GCCCCAGTCAGTCCTCCCAGGAGACTCTGTGGG |
| Sequence-based reagent | Parkin_delACT_R | This paper | PCR primers | GGACTGACTGGGGCTCCCGCTCACAGCCTCC |
| Sequence-based reagent | Parkin_I411A_F | This paper | PCR primers | AAACCGCGAAGAAAACCACCAAGCCCTG |
| Sequence-based reagent | Parkin_I411A_R | This paper | PCR primers | TTCTTCGCGGTTTCTTTGGAGGCTGCTT |
| Sequence-based reagent | Parkin_E409A_F | This paper | PCR primers | CCAAAGCGACCATCAAGAAAACCACCAA |
| Sequence-based reagent | Parkin_E409A_F | This paper | PCR primers | ATGGTCGCTTTGGAGGCTGCTTCCCA |
| Sequence-based reagent | Parkin_T415N_R | This paper | PCR primers | AAACCAACAAGCCCTGTCCCCGCT |
| Sequence-based reagent | Parkin_T415N_R | This paper | PCR primers | GGCTTGTTGGTTTTCTTGATGGTTTCTTTG |
| Sequence-based reagent | Parkin_K416A_F | This paper | PCR primers | ACCGCGCCCTGTCCCCGCTGCC |
| Sequence-based reagent | Parkin_K416A_R | This paper | PCR primers | AGGGCGCGGTGGTTTTCTTGATGGTTTCTT |
| Sequence-based reagent | Parkin_H422A_F | This paper | PCR primers | CTGCGCGGTACCAGTGGAAAAAAATGGAG |
| Sequence-based reagent | Parkin_H422A_R | This paper | PCR primers | GTACCGCGCAGCGGGGACAGGGC |
| Sequence-based reagent | Parkin_R | This paper | PCR primers | GGAATTCCTACACGTCGAACCAGTG |
| Sequence-based reagent | R0RBR_F | This paper | PCR primers | GCGGATCCATCTACAACAGCTTTTATG |
| Sequence-based reagent | ΔUbl_F | This paper | PCR primers | GCGGATCCGGTCAAGAAATGAATGCA |
| Sequence-based reagent | Miro1_F | This paper | PCR primers | GCGGATCCATGAAA CCAGCTTGTATAAA |
| Sequence-based reagent | Miro1_R | This paper | PCR primers | GCGAATTCTTAAAACGTGGAGCTCTTGAG |
| Commercial kit | Plasmid Extraction Mini Kit | FavorPrep | Cat.# FAPDE300 | |
| Chemical compound | 3-Bromopropylamine hydrobromide | Sigma-Aldrich | Cat.# B79803 | |
| Chemical compound | Vectashield mounting medium | Vector Laboratories | H-1000 | |
| Chemical compound | Carbonyl cyanide 3-chlorophenylhydrazone (CCCP) | Sigma-Aldhrich | C2759 | |
| Chemical compound | DyLight 800 Maleimide | Thermo Fisher Scientific | Cat.# 46621 | |
| Genetic reagent | PEI MAX | Polyscience | 24765–1 | |
| Other | Ni-NTA resin | QIAGEN | Cat.# 30230 | See Materials and methods, Protein purification section |
Additional files
Download links
A two-part list of links to download the article, or parts of the article, in various formats.
Downloads (link to download the article as PDF)
Open citations (links to open the citations from this article in various online reference manager services)
Cite this article (links to download the citations from this article in formats compatible with various reference manager tools)
Additional feedforward mechanism of Parkin activation via binding of phospho-UBL and RING0 in trans
eLife 13:RP96699.
https://doi.org/10.7554/eLife.96699.3


