Structure, function and assembly of soybean primary cell wall cellulose synthases
- Department of Molecular Physiology and Biological Physics, University of Virginia School of Medicine, United States
- Howard Hughes Medical Institute, United States
Figures
Figure 1 with 1 supplement
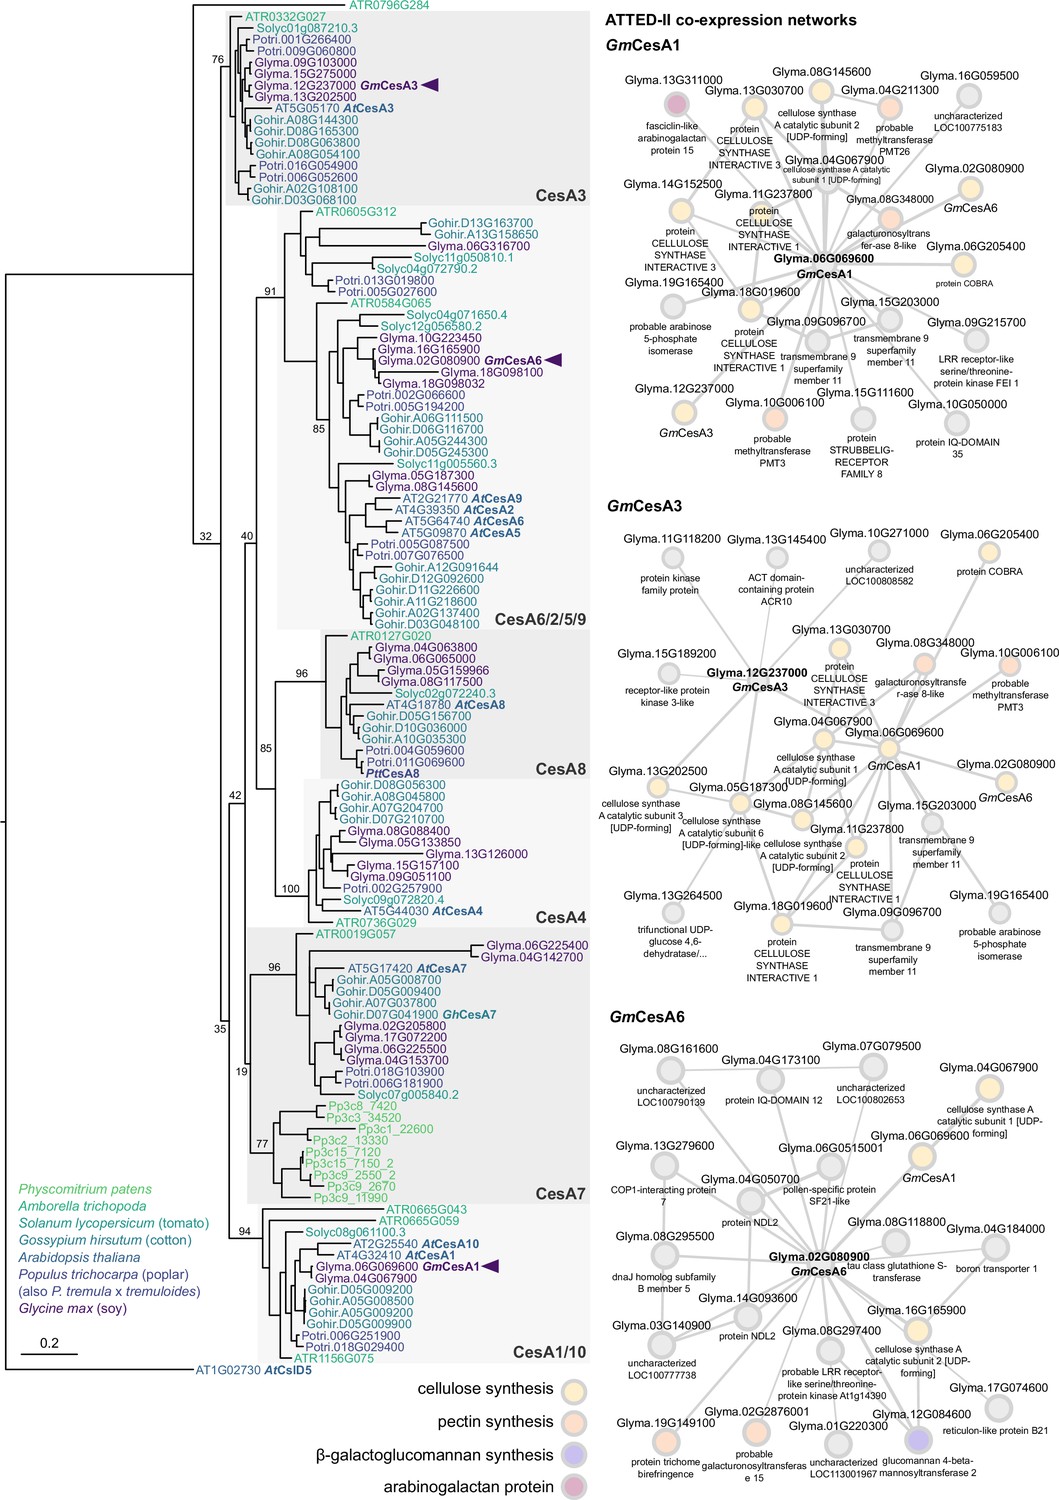
GmCesA phylogeny and co-expression analysis.
Left: Maximum-likelihood phylogeny of CesA protein sequences from soy, Arabidopsis, cotton, poplar, tomato, Physcomitrium and Amborella. For alignment, the Pfam-defined 'Cellulose synthase' domain was extracted from each sequence using HMMER. The final phylogeny was calculated using RAxML with 100 rapid bootstrap pseudo-replicates. Arrowheads mark the positions of GmCesA1, GmCesA3, and GmCesA6 within the tree; structurally characterized proteins (PttCesA8 and GhCesA7) and Arabidopsis sequences are also labelled. Branch lengths correspond to average number of substitutions per site (relative to scale bar); branch labels report bootstrap successes for each split. Right: Co-expressed gene networks for GmCesA1, GmCesA3, and GmCesA6 from ATTED-II v11 (https://atted.jp). Relevant functional annotations for co-expressed cell wall genes are labelled by color (cellulose synthesis: yellow; pectin synthesis: orange; β-galactoglucomannan synthesis: violet; arabinogalactan proteins: purple).
Figure 1—figure supplement 1

Sequence alignment of soybean CesA1, CesA3, and CesA6 and substrate turnover kinetics.
(A) Sequences were aligned in Clustal Omega (Larkin et al., 2007) and visualized in Jalview (Waterhouse et al., 2009) showing sequence identity from dark blue (high) to white (low). (B) Gene expression profiles of soybean GmCesA1: Glyma.06G069600, GmCesA3: Glyma.12G237000, and GmCesA6: Glyma.02G080900 from the soybean eFP Browser (https://bar.utoronto.ca/efpsoybean/cgi-bin/efpWeb.cgi). (C) In vitro Michaelis Menten kinetic analysis of GmCesA1 and GmCesA3 by titrating UDP-Glc and quantifying the generated UDP using an UDP-Glo assay kit. The data is normalized to the highest activity of GmCesA1. The activity of GmCesA6 was too weak to be analyzed by this method. Error bars represent the standard deviations from the means of three technical replicas.
Figure 2
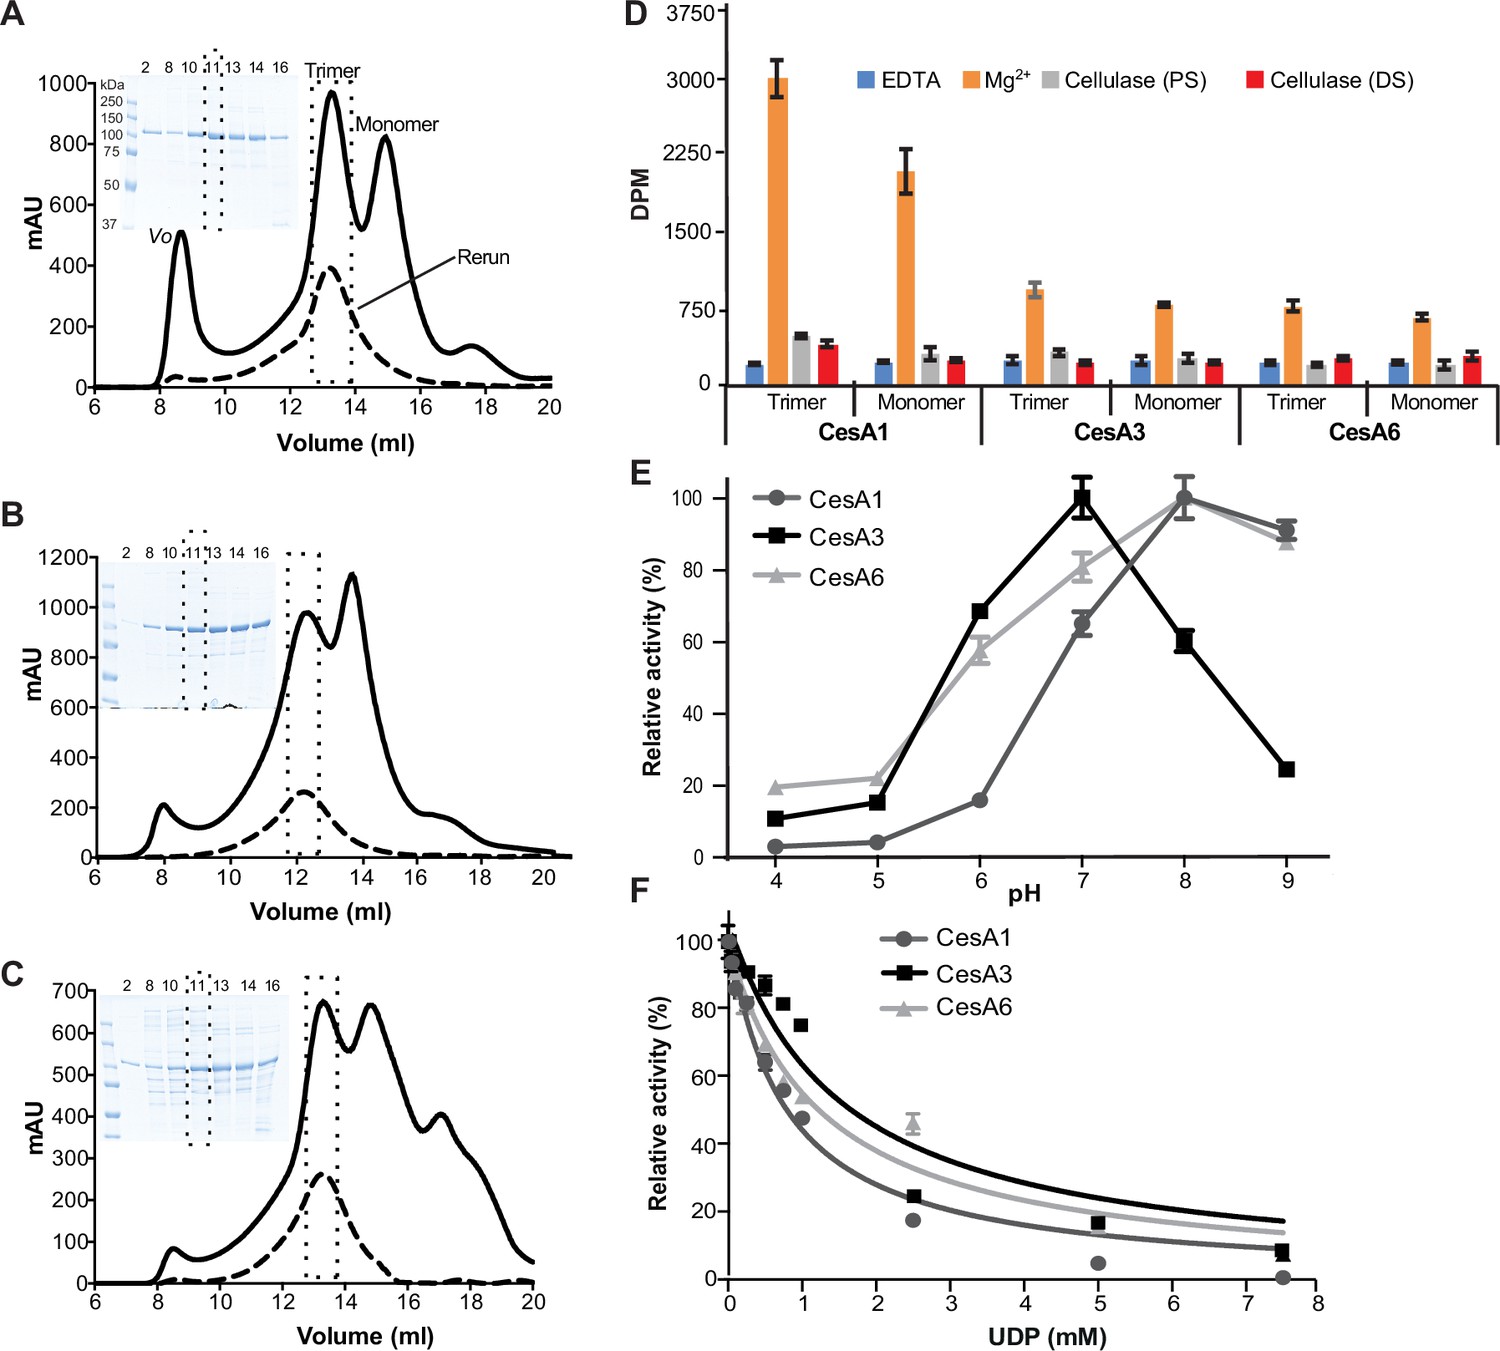
Functional characterization of Glycine max primary cell wall CesAs.
From (A–C) analytical size exclusion chromatography (Superose 6 Increase) of GmCesA1 (A), GmCesA3 (B), and GmCesA6 (C). Void volume (Vo) and trimer and monomer peaks are marked. A rerun of the trimer fraction for each species is shown as a dashed profile. Inset: Coomassie-stained SDS-polyacrylamide gel electrophoresis of the indicated elution volumes. The molecular weights of the protein marker bands are indicated in panel A and apply to all panels. (D) Catalytic activity of the purified GmCesAs. 3H-labeled cellulose synthesized by trimeric and monomeric species was degraded with cellulase, followed by quantification by scintillation counting. (DS) and (PS) indicate cellulase treatments during and after the synthesis reaction, respectively. DPM: disintegrations per minute. (E) pH optima for catalytic activity of GmCesA1, GmCesA3, and GmCesA6. Activities are normalized to the highest activity for each isoform. (F) UDP inhibits CesAs. Cellulose biosynthesis was performed in the presence of 1.4, 0.5, and 2.3 mM UDP-Glc for GmCesA1, GmCesA3, and GmCesA6, respectively, as well as the indicated increasing concentrations of UDP. Product yields in the absence of UDP were set as 100%. Error bars in panels D–F represent deviations from the means of at least three replicas.
Figure 3 with 2 supplements
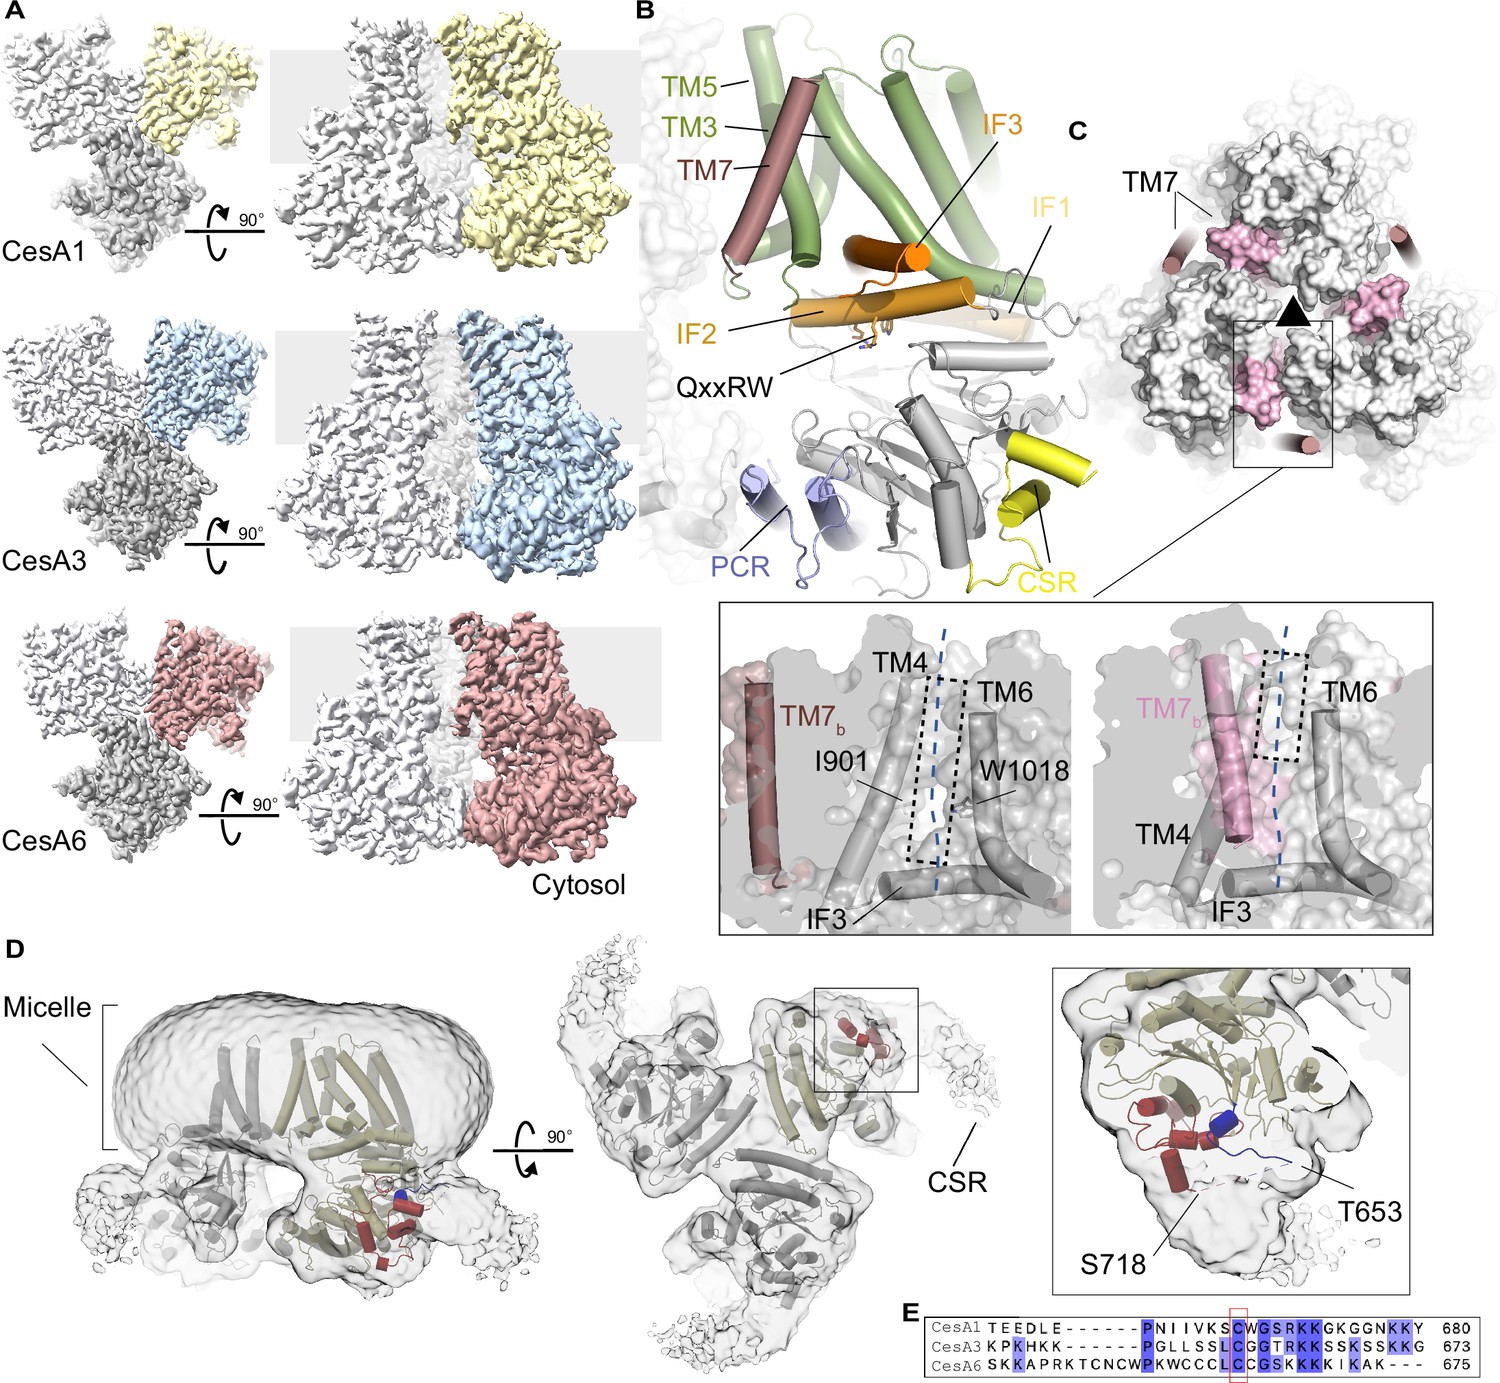
Soybean primary cell wall CesAs assemble into homotrimers.
(A) CryoEM maps of the GmCesA homotrimers contoured at 4.5–5.6 σ. One subunit is shown in color, the others are shown in light and dark gray. The gray background indicates the estimated membrane boundaries. (B) Cartoon representation of a GmCesA6 protomer. The transmembrane region is shown in green and dark pink, interface helices (IF) are shown in orange, and the catalytic domain is colored gray. The PCR and CSR regions are shown in blue and yellow, respectively. (C) Comparison of GmCesA6 and PttCesA8. GmCesA6 is shown as a cartoon that is overlaid with a semitransparent surface of PttCesA8 (surface, PDB: 6WLB). Transmembrane helix 7 is colored light and dark pink for PttCesA8 and GmCesA6, respectively. The black triangle indicates the threefold symmetry axis of the homotrimer. Zoom views: Surface representations of GmCesA6 (left) and PttCesA8 (right) highlighting the lateral window. TM7b refers to TM helix 7 of another protomer. The view is from the threefold symmetry axis towards a CesA protomer. The dashed blue line indicates the cellulose secretion channel. (D) CryoEM map of the GmCesA1 trimer shown at a low contour level (1.4 σ). The GmCesA1 structure is shown as a cartoon with one protomer colored yellow. The resolved CSR N- and C-terminal helical regions are colored blue and red, respectively. (E) Sequence alignment of the CSR regions of GmCesA1, GmCesA3, and GmCesA6 generated in Clustal Omega (Larkin et al., 2007).
Figure 3—figure supplement 1
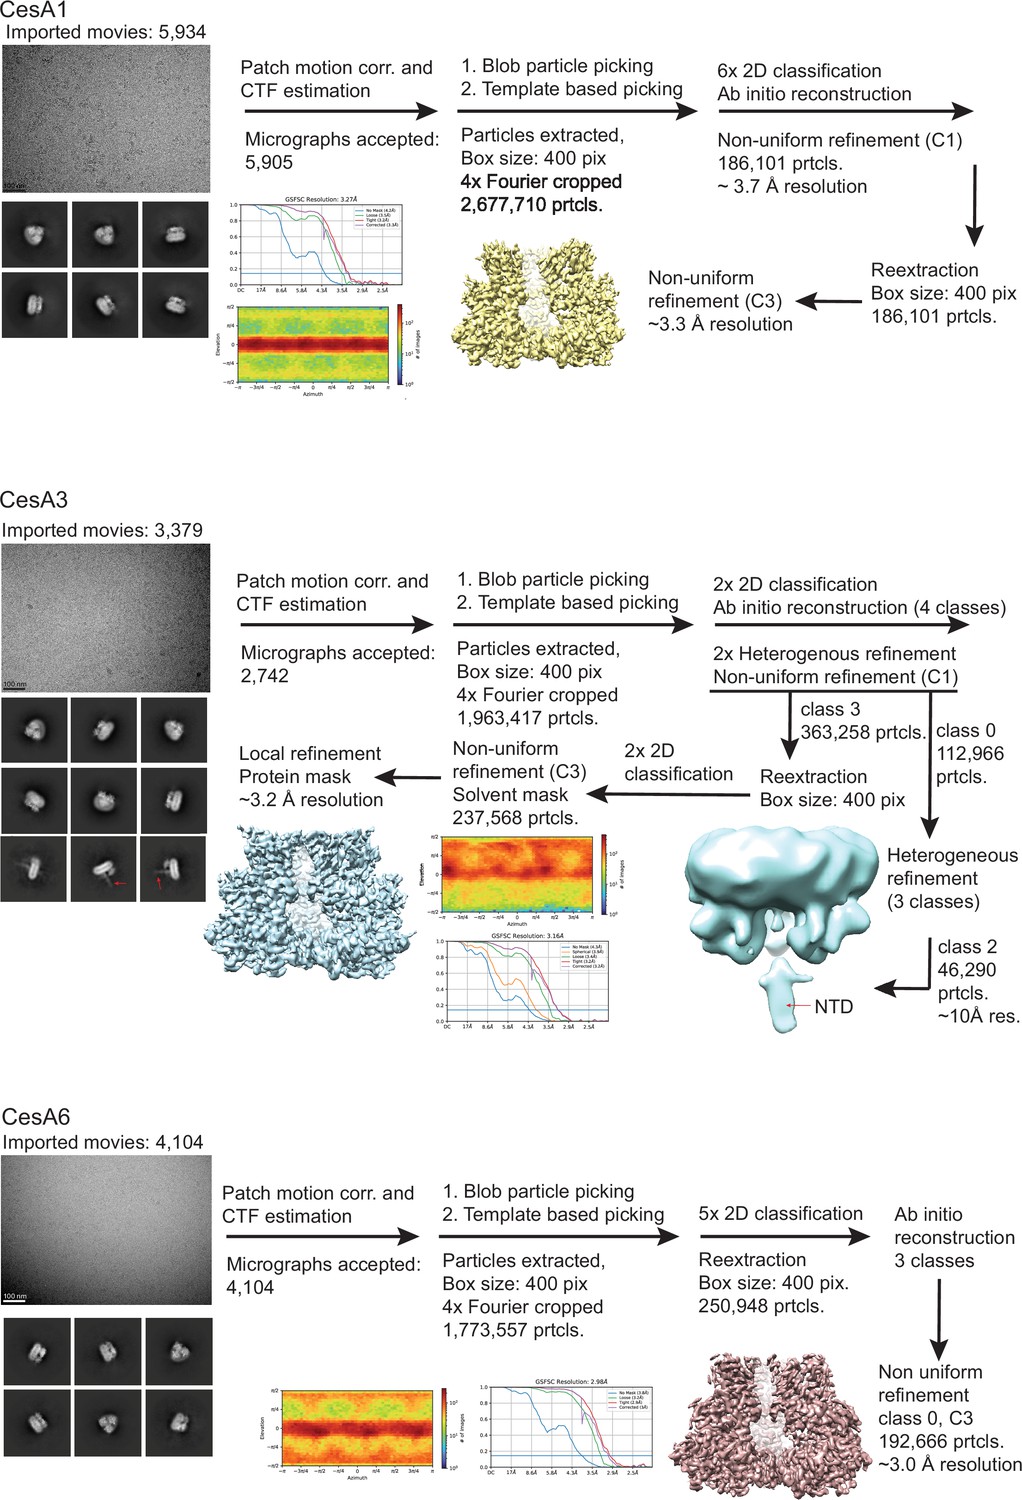
Cryo-EM data processing workflows.
All steps were performed in CryoSparc v4 (Punjani et al., 2017).
Figure 3—figure supplement 2

Cryo-EM map quality examples.
(A) Selected helical segments of GmCesA1, GmCesA3, and GmCesA6. TM helix 7 was excluded from the GmCesA3 model due to limiting map quality. (B) Close-up views of the unidentified ligands coordinated by the PCR domains of the homotrimers.
Figure 4 with 2 supplements
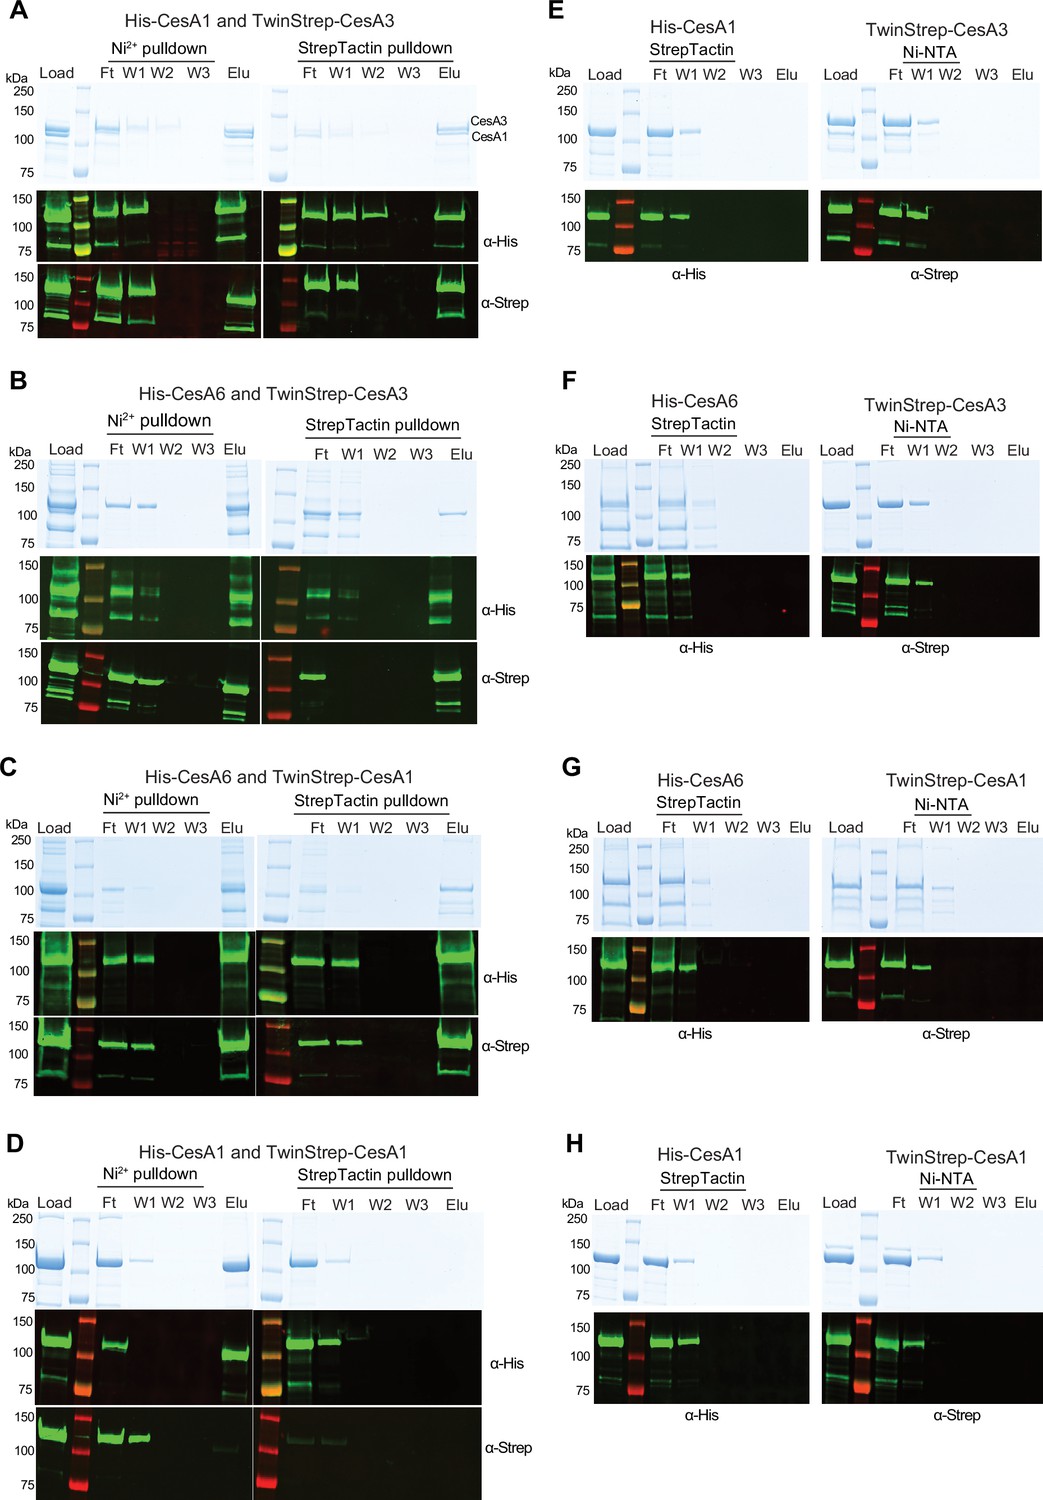
In vitro interactions between different CesA isoforms.
Tandem pull-down experiments using Ni-NTA and Strep-Tactin resin. Experiments were performed with homotrimers of the indicated GmCesA isoforms tagged N-terminally either with His- or TwinStrep-tags. Material eluted from the Ni-NTA resin was loaded onto the Strep-Tactin beads. Top panels: Coomassie stained SDS-PAGE, bottom panels: Western blots using anti penta-His or anti-Strep primary antibodies. (A–C) Trimer-trimer interaction between GmCesA1 and GmCesA3, GmCesA6 and GmCesA3, and GmCesA6 and GmCesA1, respectively. (D) Differently tagged homotrimers of the same isoform do not interact. Tandem purification of a mixture of His- and TwinStrep-tagged GmCesA1. (E–H) Control binding of His-tagged CesAs to StrepTactin beads and Strep-tagged GmCesAs to Ni-NTA resin. F, W, E: Flow through, wash, and eluted fractions.
-
Figure 4—source data 1
Raw uncropped data of western blots and Coomassie-stained PAGE gels shown in Figure 4A-H.
- https://cdn.elifesciences.org/articles/96704/elife-96704-fig4-data1-v3.zip
-
Figure 4—source data 2
Boxed source data of western blots and Coomassie-stained PAGE gels shown in Figure 4A-H.
- https://cdn.elifesciences.org/articles/96704/elife-96704-fig4-data2-v3.zip
Figure 4—figure supplement 1
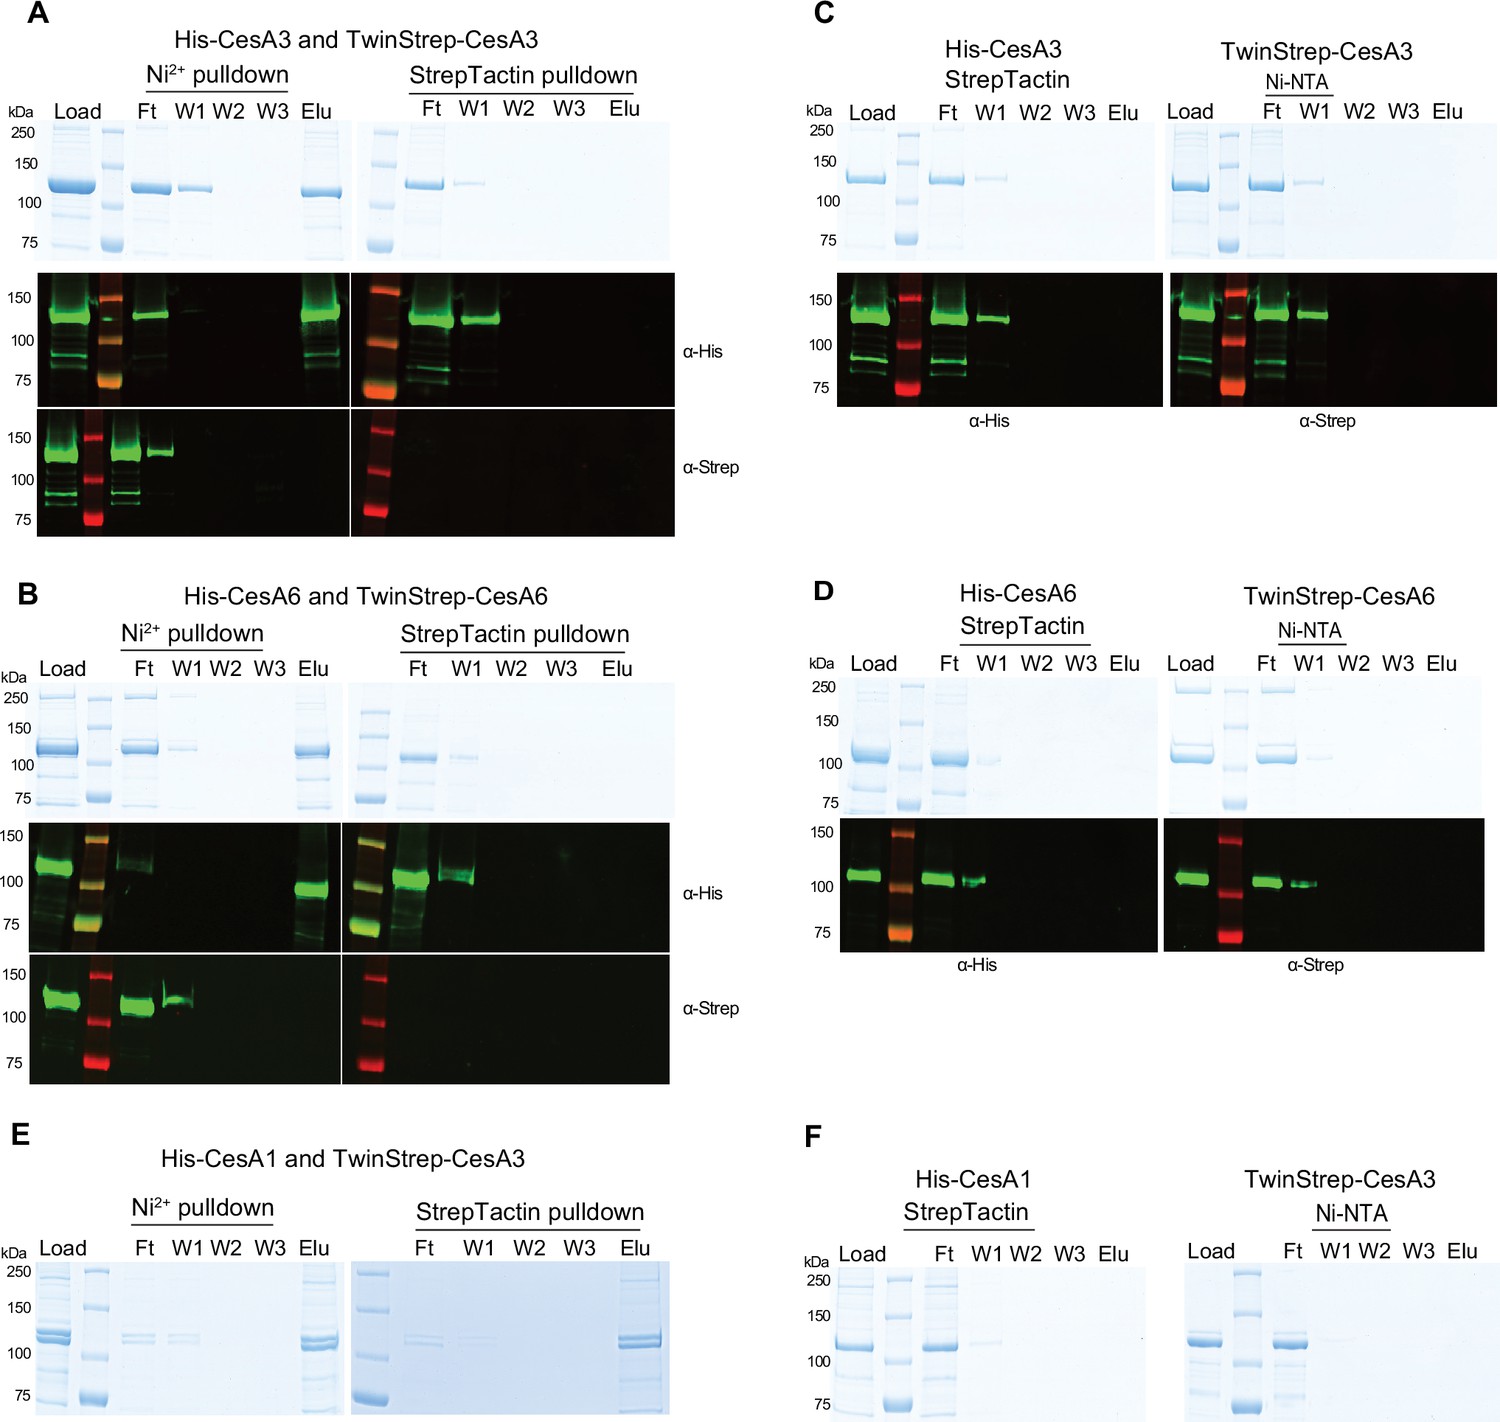
Interactions of CesA homotrimers of the same isoforms.
(A–D) Tandem purifications of combinations of His- and Strep-tagged CesA3 or CesA6 (A and B) together with the non-specific binding controls (C and D). (E and F) Interactions of monomers of different CesA isoforms. (E) Monomeric versions of His-tagged CesA1 and Strep-tagged CesA3 were subjected to tandem purification starting either with Ni-NTA resin or Strep-Tactin beads. (F) Controls to account for non-specific interactions.
-
Figure 4—figure supplement 1—source data 1
Raw uncropped data of western blots and Coomassie-stained PAGE gels shown in Figure 4—figure supplement 1A-F.
- https://cdn.elifesciences.org/articles/96704/elife-96704-fig4-figsupp1-data1-v3.zip
-
Figure 4—figure supplement 1—source data 2
Boxed source data of western blots and Coomassie-stained PAGE gels shown in Figure 4—figure supplement 1A-F.
- https://cdn.elifesciences.org/articles/96704/elife-96704-fig4-figsupp1-data2-v3.zip
Figure 4—figure supplement 2
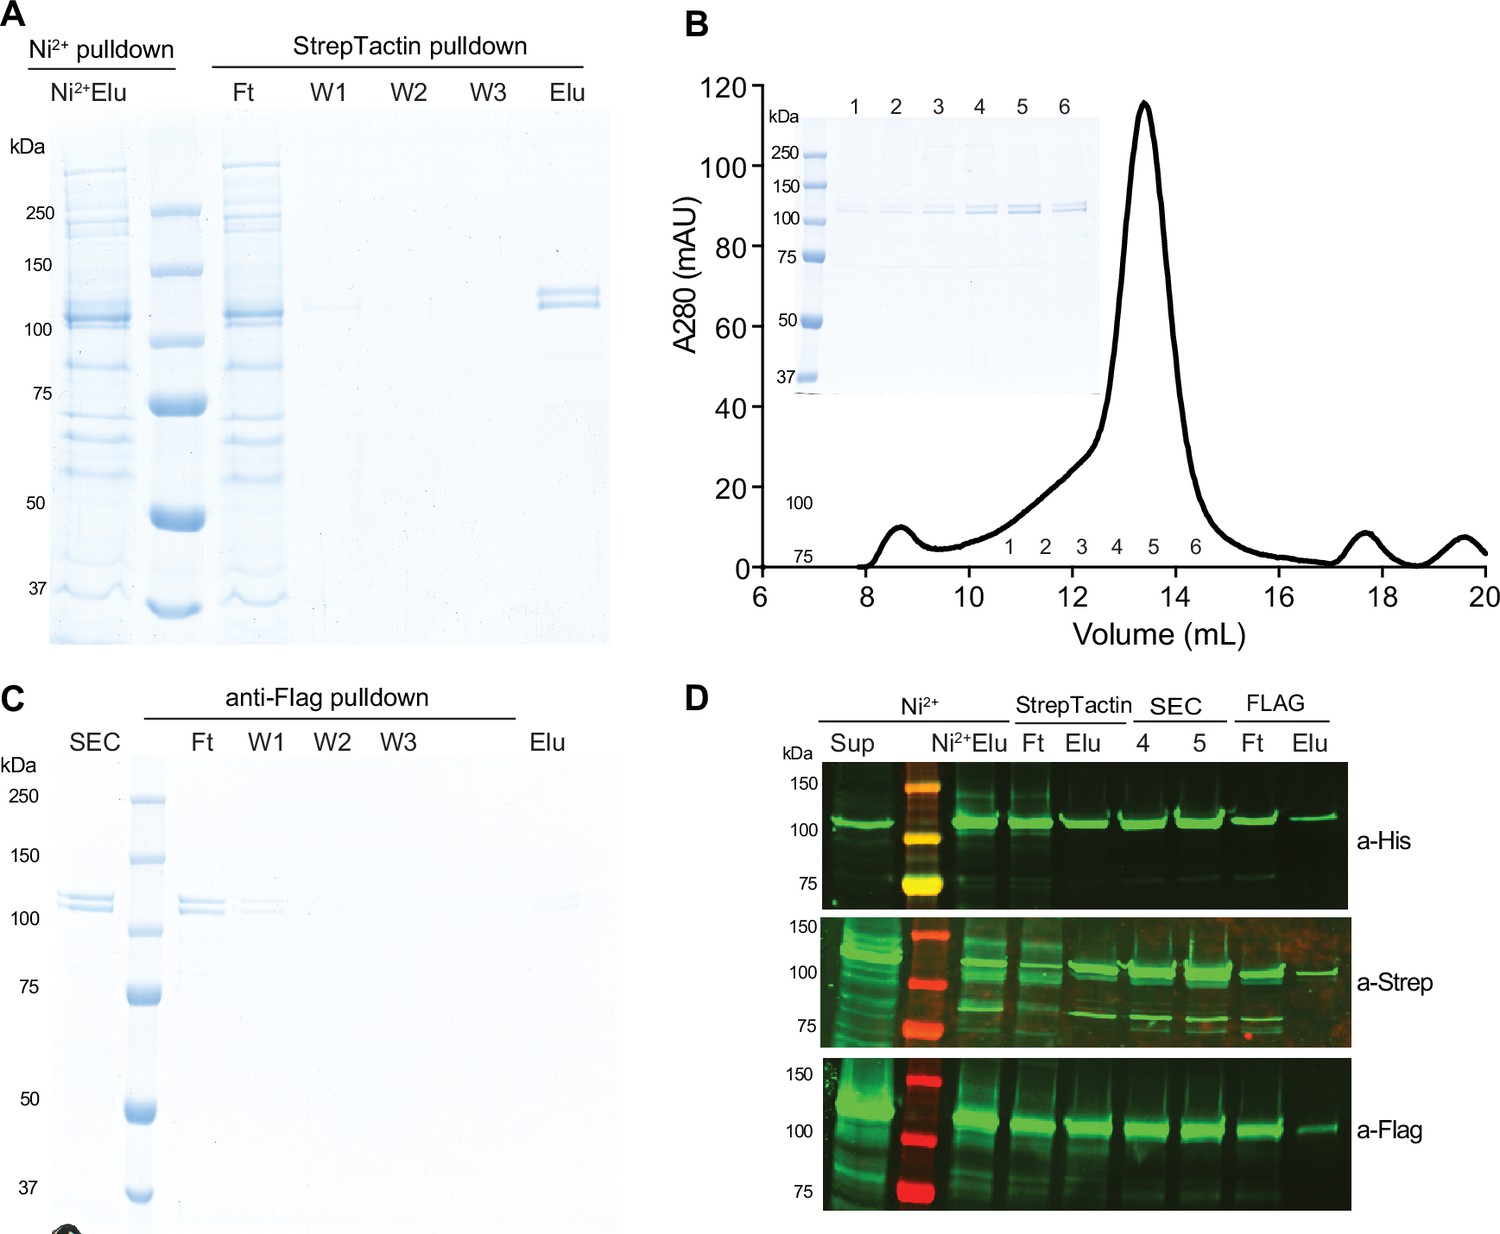
Attempt to purify hetero-oligomeric CesA oligomers.
GmCesA1, GmCesA3, and GmCesA6 were co-expressed in Sf9 cells and purified by sequential affinity chromatography. (A) Material eluted (Elu) from a Ni-NTA column was purified over Strep-Tactin affinity resin. (B) The Elu fraction from the Strep-Tactin resin was loaded onto a Superose-6 size exclusion chromatography column (SEC). The inset shows a Coomassie-stained SDS-PAGE of the indicated fractions. (C) The peak fraction from (B) was loaded onto an anti-Flag affinity matrix, washed (W), and eluted. (D) Western blot analysis of eluting (Elu), flow through (Ft), and SEC (4, 5) fractions from all steps shows the presence of all GmCesA species, alongside significant loss in all Ft fractions.
-
Figure 4—figure supplement 2—source data 1
Raw uncropped data of western blots and Coomassie-stained PAGE gels shown in Figure 4—figure supplement 2D.
- https://cdn.elifesciences.org/articles/96704/elife-96704-fig4-figsupp2-data1-v3.zip
-
Figure 4—figure supplement 2—source data 2
Boxed source data of western blots and Coomassie-stained PAGE gels shown in Figure 4—figure supplement 2D.
- https://cdn.elifesciences.org/articles/96704/elife-96704-fig4-figsupp2-data2-v3.zip
Figure 5
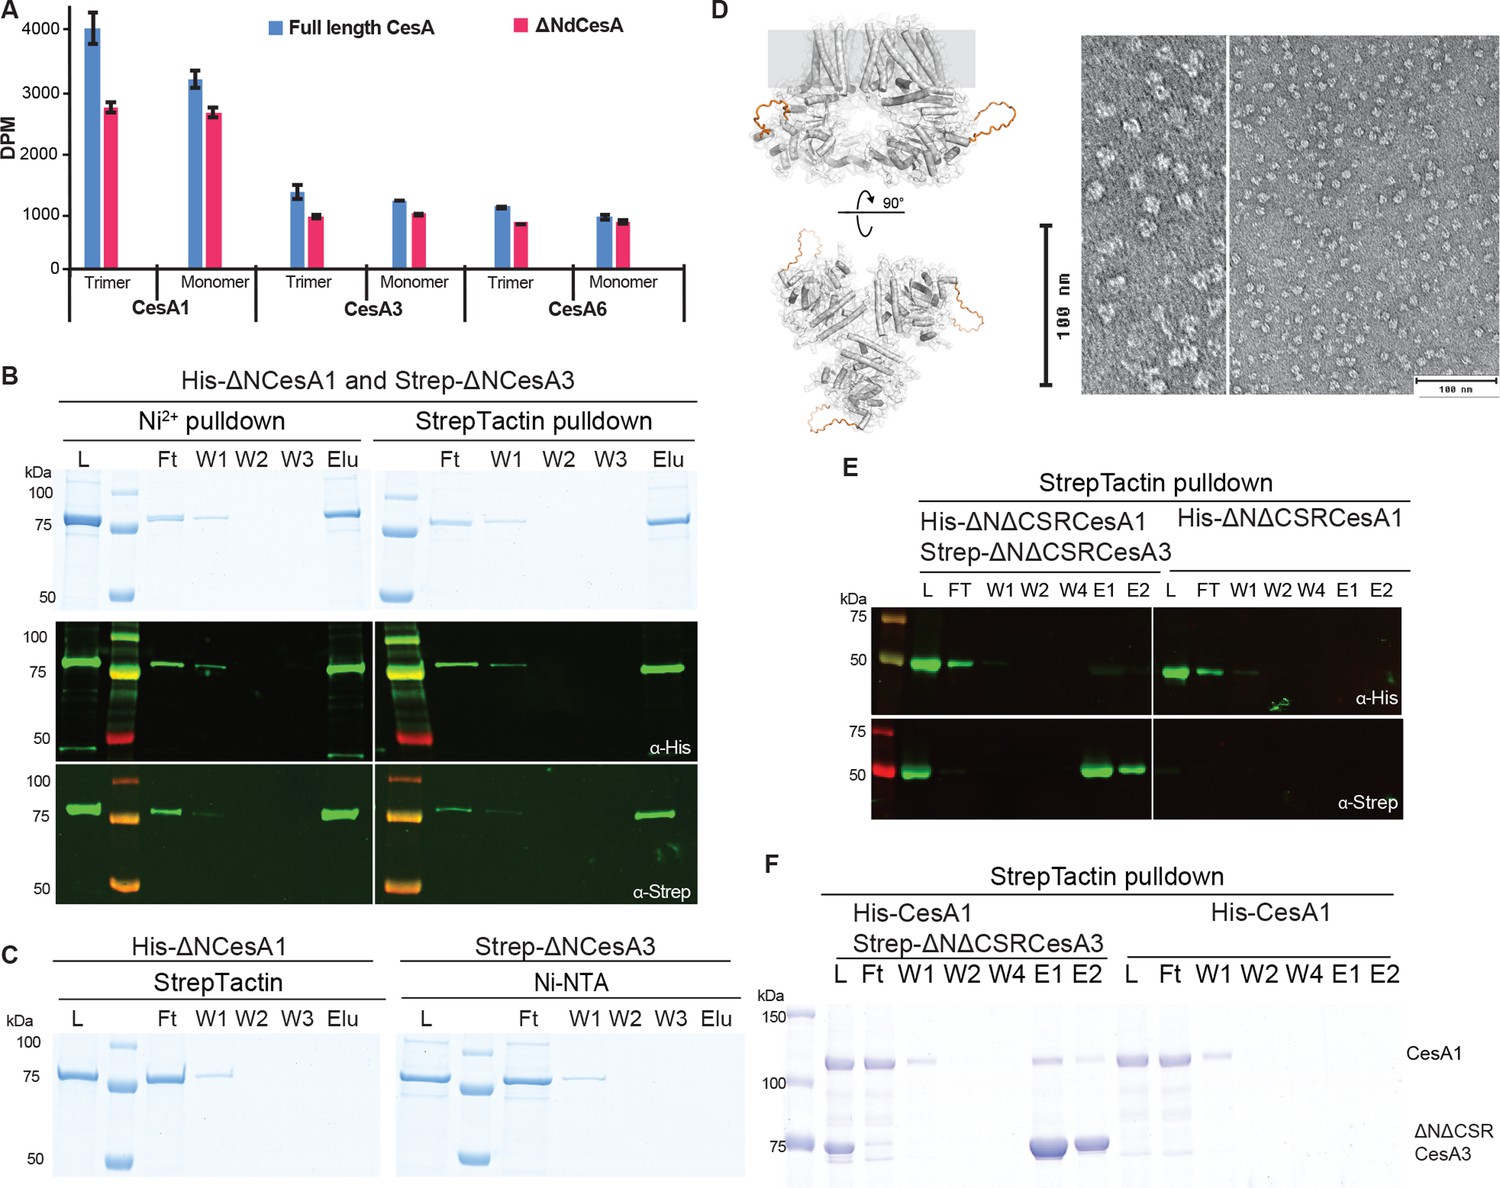
The CSR mediates trimer-trimer interactions.
Isoform interactions are independent of the NTD. (A) Activity comparison of full-length and N-terminally truncated GmCesA isoforms. DPM: disintegrations per minute. Error bars represent deviations from the means of at least three replicates. (B) Tandem pull-down experiments as in Figure 4 but with N-terminally truncated homotrimers of GmCesA1 and GmCesA3. Top panel: SDS-PAGE, bottom panel: Western blots using anti-His and anti-Strep primary antibodies. (C) Control binding of His-ΔNCesA1 to Strep-Tactin beads and Strep-ΔNCesA3 to Ni-NTA resin. L, Ft, W, E: Load, Flow through, Wash, and Eluted fractions. (D) AlphaFold predicted model of N-terminally truncated GmCesA1 with the CSR replaced by a loop shown as an orange backbone (left), and negative stain images of the NTD- and CSR-truncated GmCesA1 trimer. (E) Tandem purification of NTD and CSR truncated GmCesA1 and GmCesA3. (F) Affinity purification of His-tagged full-length GmCesA1 and Strep-tagged NTD- and CSR-truncated GmCesA3. Shown is an SDS-PAGE after Coomassie staining.
-
Figure 5—source data 1
Raw uncropped data of western blots and Coomassie-stained PAGE gels shown in Figure 5B, C, E and F.
- https://cdn.elifesciences.org/articles/96704/elife-96704-fig5-data1-v3.zip
-
Figure 5—source data 2
Boxed source data of western blots and Coomassie-stained PAGE gels shown in Figure 5B, C, E and F.
- https://cdn.elifesciences.org/articles/96704/elife-96704-fig5-data2-v3.zip
Figure 6

Clustering of GmCesA homotrimers and a dimer of trimer.
(A–C) Uranyl formate-stained EM images of homotrimers of purified GmCesA1 (A), GmCesA3 (B) and GmCesA6 (C). The proteins were incubated overnight on ice prior to grid preparation. (D) The same for an equimolar mixture of all three GmCesA isoforms, incubated overnight, separated from individual trimers by size exclusion chromatography, and imaged by negative stain EM. Selected clusters are encircled. Scale bar: 100 nm. (E) Purified trimers of GmCesA1 and GmCesA3 were combined and used for cryo-EM analysis. Shown are 2D class averages of dimers of trimers. (F and G) Manually assembled GmCesA1 trimer volumes (F) were used to calculate 2D class average templates (G) for comparison with the experimentally obtained dimers of trimers shown in panel (E).
Figure 7 with 3 supplements
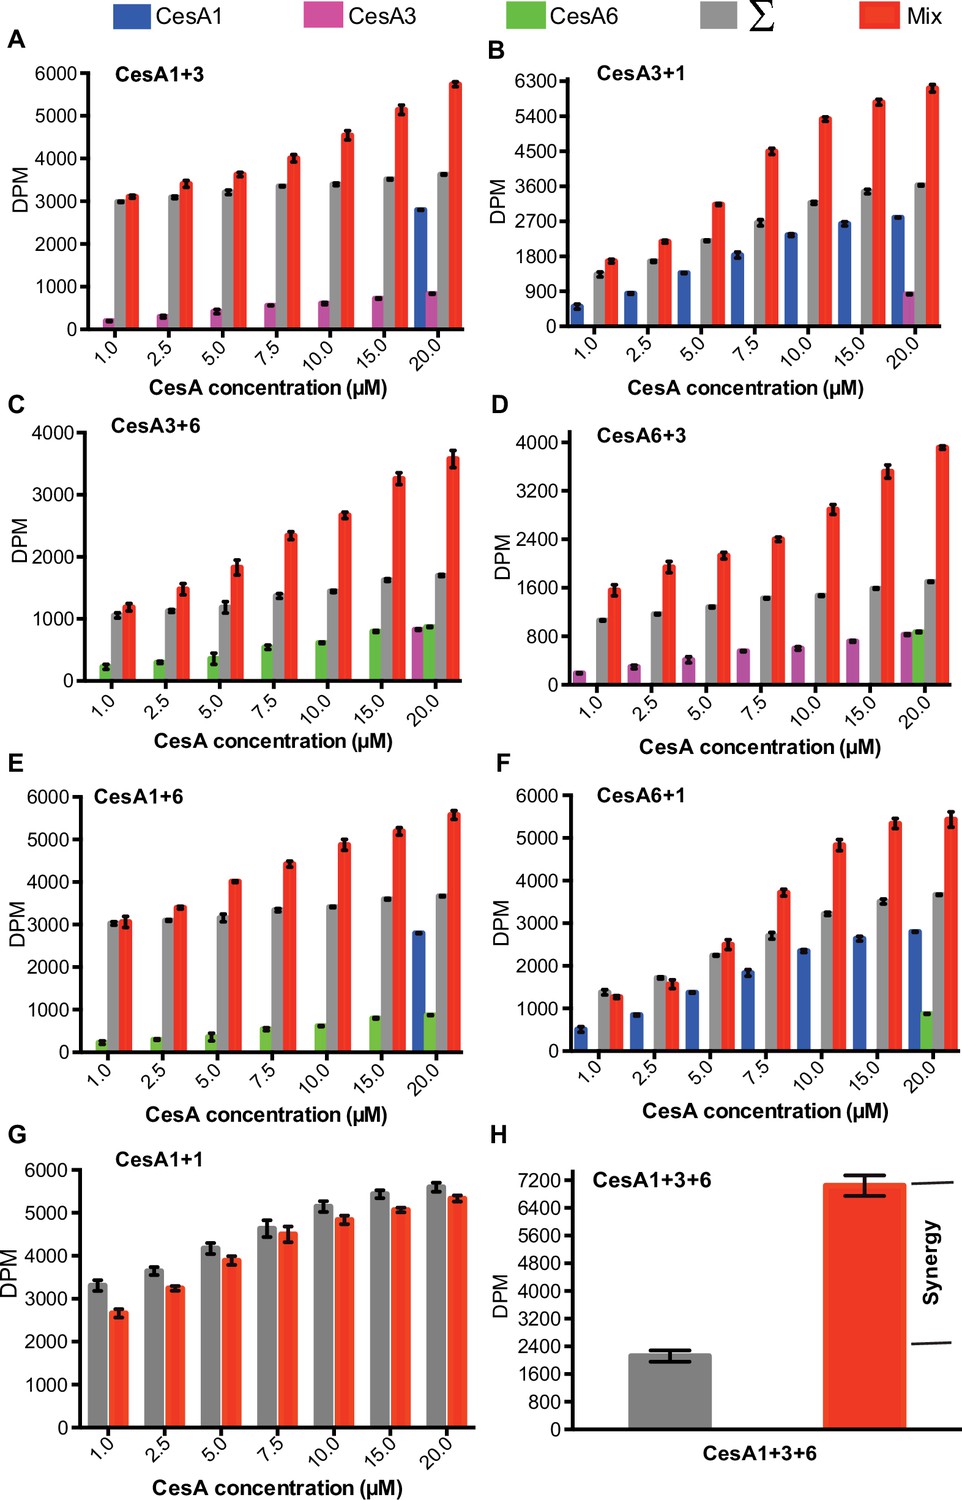
Synergistic catalytic activity.
Cellulose biosynthesis from mixtures of GmCesA isoform homotrimers. The formation of 3H-labeled cellulose was quantified by scintillation counting for reaction mixtures containing one GmCesA isoform at 20 µM concentration and another isoform at the indicated increasing concentrations. Blue, magenta and green columns represent activities measured for the individual single isoforms alone. Gray columns represent the calculated theoretical activities for the isoform mixtures by adding the individually determined activities. Red columns represent the experimentally determined activities for the isoform mixtures. (A and B) CesA120 μM + CesA31- 20 μM and CesA320 μM + CesA11- 20 μM; (C and D) CesA320 μM + CesA61- 20 μM and CesA620 μM + CesA31- 20 μM; and (E and F) CesA120 μM + CesA61- 20 μM and CesA620 μM + CesA11- 20 μM, respectively. (G) The same as for panel (A) but titrating the same GmCesA isoform (CesA120 μM + CesA11- 20 μM). (H) The same as for panels A-F but for a combination of all three GmCesA isoforms. Individual and combined activities were determined at a concentration of 6.6 µM for each GmCesA isoform. DPM, disintegrations per minute. In all panels, error bars represent deviations from the means of at least three replicates.
Figure 7—figure supplement 1
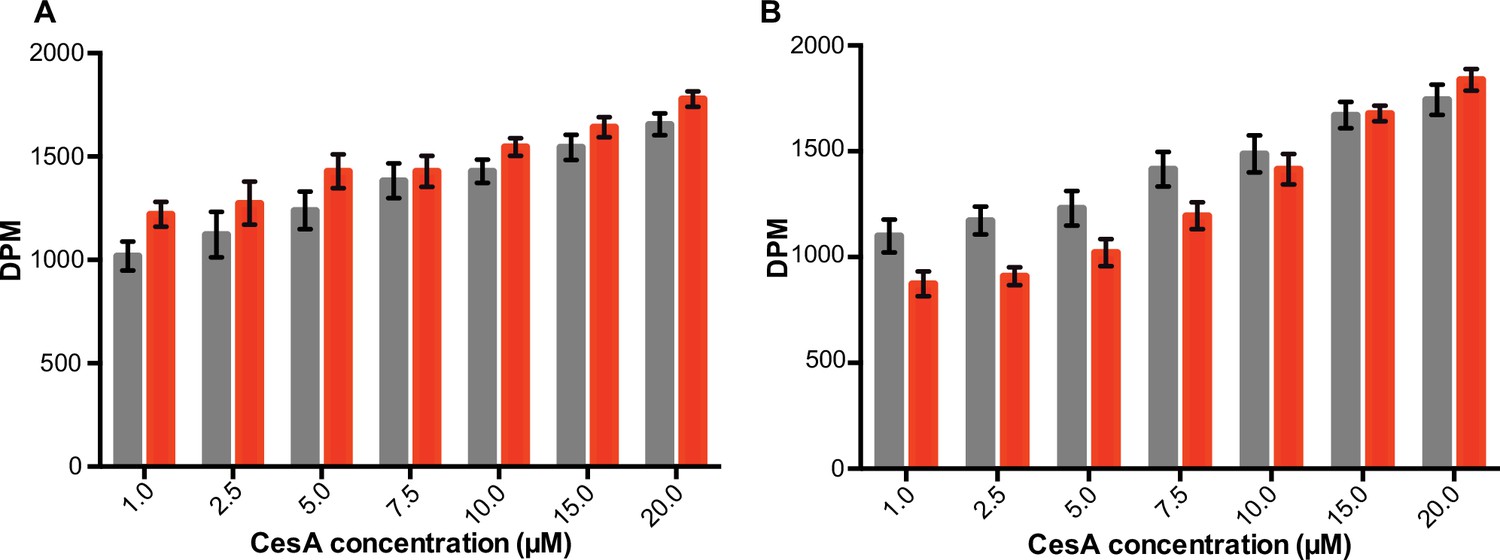
Control synergistic activity assays by titrating the same GmCesA isoforms.
(A) GmCesA320 μM + GmCesA31- 20 μM, (B) GmCesA620 μM + GmCesA61- 20 μM. Gray columns indicate calculated theoretical activities from individual measurements, red columns are experimentally determined activities. DPM: Disintegrations per minute. In both panels,error bars represent deviations from the means of at least three replicates.
Figure 7—figure supplement 2

Tetrathionate-inactivated CesAs interact with another GmCesA isoforms.
(A–C) Co-purification of catalytically active GmCesA homotrimers with tetrathionate inactivated GmCesA homotrimers (indicated by a.T extension). The indicated combinations of CesAs were purified over Ni-NTA beads. Results were analyzed by Coomassie stained SDS-PAGE (top panels) and Western blotting (bottom panels). (D–F) Control binding experiments of Strep-tagged GmCesAs and Ni-NTA resin. (G) Catalytic activity of tetrathionate treated GmCesA3. Error bars represent standard deviations from the means of three technical replicates.
-
Figure 7—figure supplement 2—source data 1
Raw uncropped data of western blots and Coomassie-stained PAGE gels shown in Figure 7—figure supplement 2A–F.
- https://cdn.elifesciences.org/articles/96704/elife-96704-fig7-figsupp2-data1-v3.zip
-
Figure 7—figure supplement 2—source data 2
Boxed source data of western blots and Coomassie-stained PAGE gels shown in Figure 7—figure supplement 2A-F.
- https://cdn.elifesciences.org/articles/96704/elife-96704-fig7-figsupp2-data2-v3.zip
Figure 7—figure supplement 3
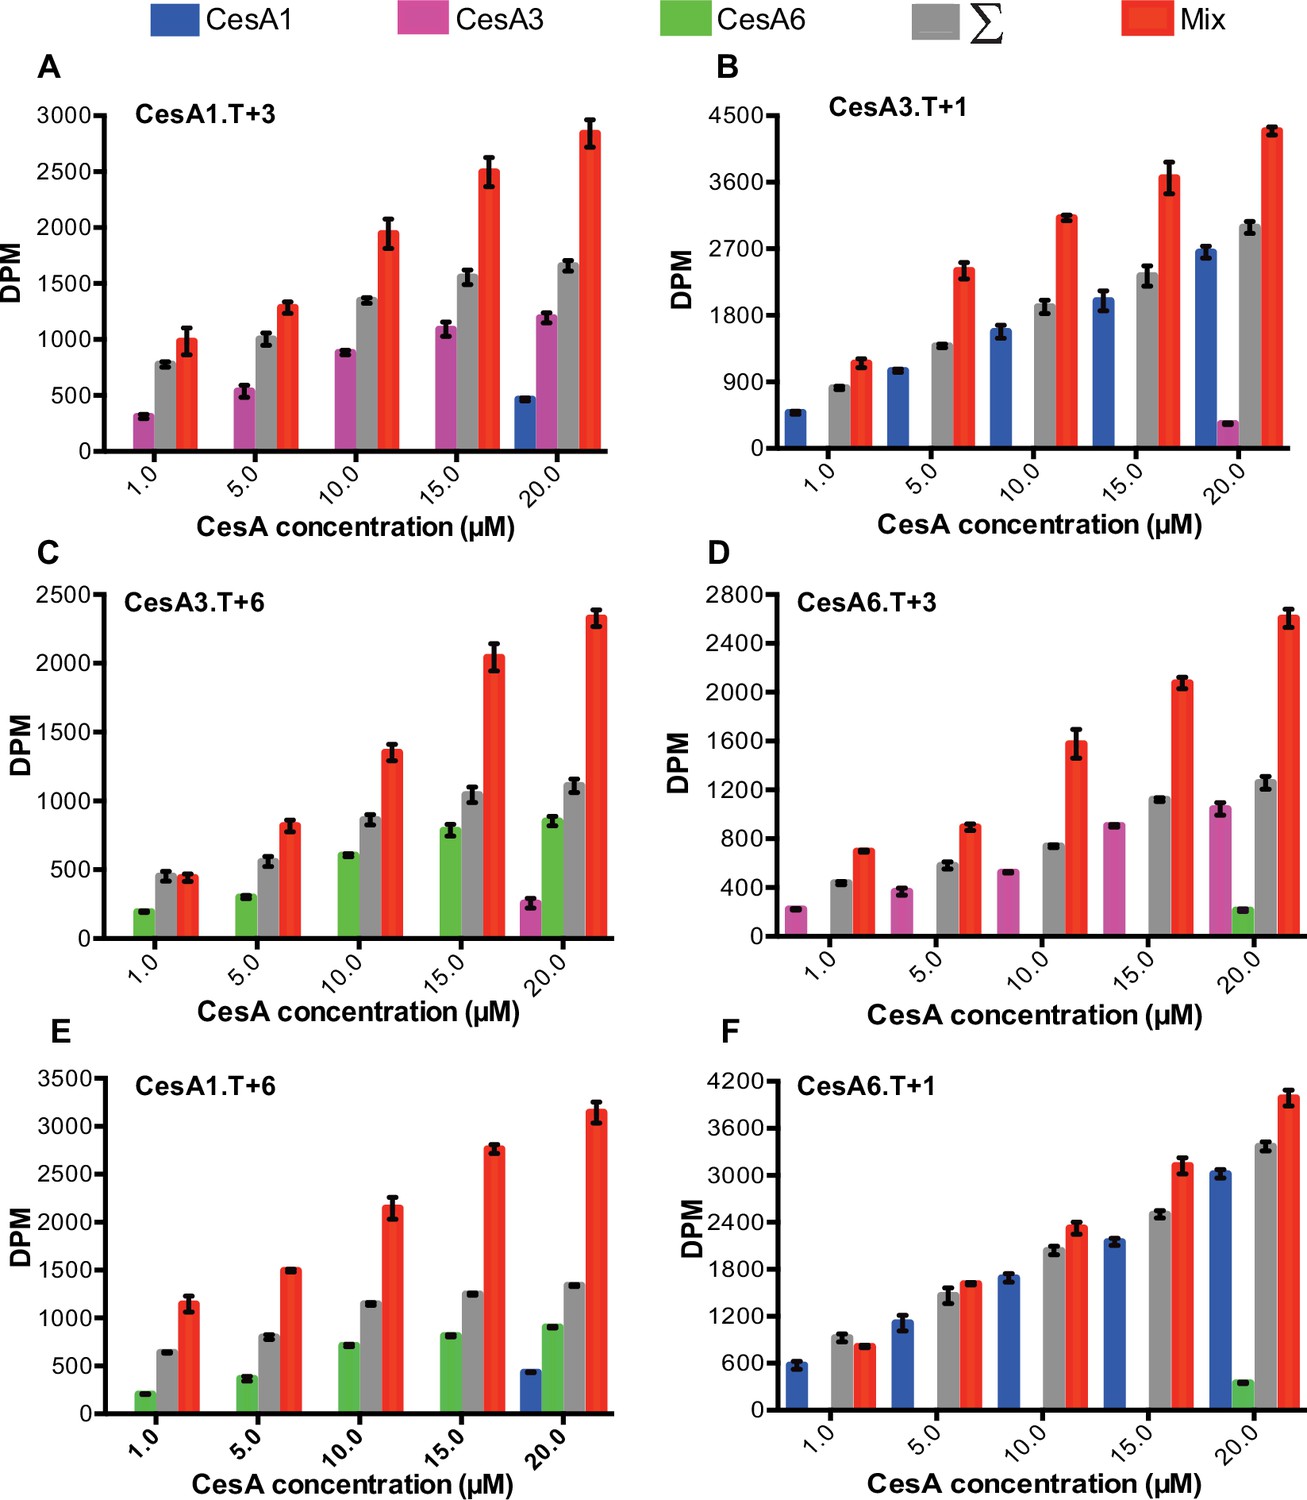
Synergistic cellulose biosynthesis with tetrathionate inactivated CesA trimers.
(A–F) Inactivated GmCesA trimers (indicated by a ‘.T’ extension) at a constant concentration were incubated with increasing concentrations of wild type GmCesAs of a different isoform. Background activities of the inactivated GmCesAs range from ~200–400 DPM. Calculated total theoretical activities are shown as gray columns, experimentally determined activities are shown as red columns. DPM: disintegrations per minute. In all panels, error bars represent deviations from the means of at least three replicates.
Figure 8
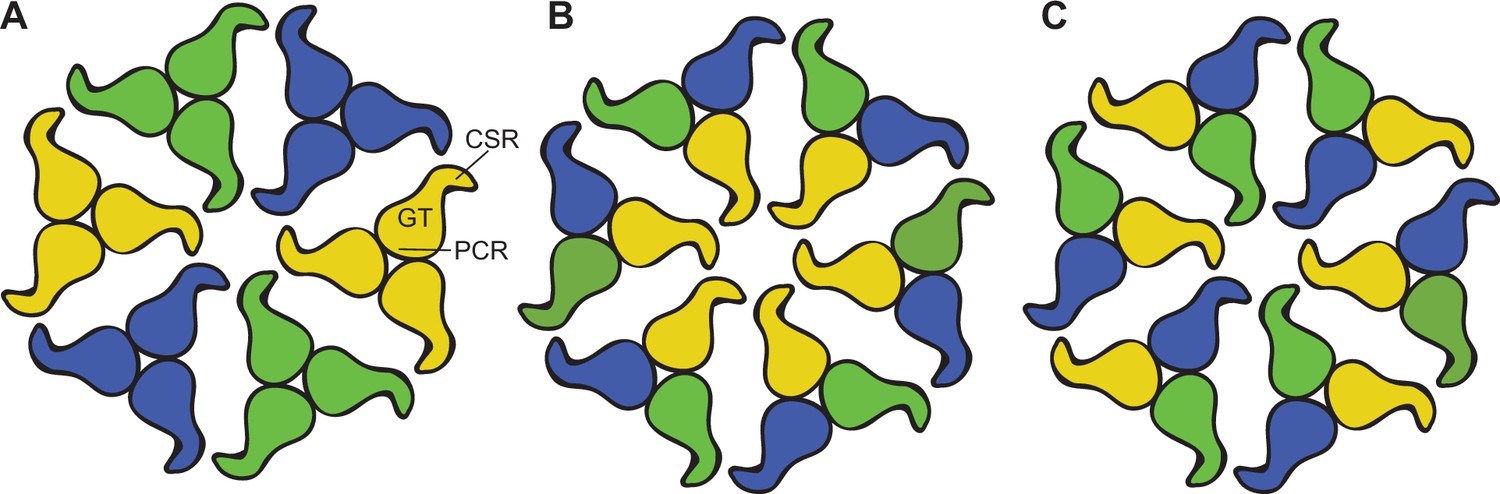
CSC models consisting of different CesA isoforms.
(A) Association of homotrimers of three different CesA isoforms. Isoforms are indicated by different colors. The shapes represent the cytosolic CesA domains. (B and C) Alternative models of CSC assembly from heterotrimeric CesA complexes that have not been detected in vitro. Model (B) would require interactions between the same CesA isoforms at the center, also not observed in vitro. PCR: Plant conserved region, GT: Glycosyltransferase, CSR: Class specific region.
Additional files
-
Supplementary file 1
Cryo-EM data collection, refinement, and validation statistic.
- https://cdn.elifesciences.org/articles/96704/elife-96704-supp1-v3.docx
-
MDAR checklist
- https://cdn.elifesciences.org/articles/96704/elife-96704-mdarchecklist1-v3.pdf
Download links
A two-part list of links to download the article, or parts of the article, in various formats.
Downloads (link to download the article as PDF)
Open citations (links to open the citations from this article in various online reference manager services)
Cite this article (links to download the citations from this article in formats compatible with various reference manager tools)
Structure, function and assembly of soybean primary cell wall cellulose synthases
eLife 13:RP96704.
https://doi.org/10.7554/eLife.96704.3


