Feature sequence-based genome mining uncovers the hidden diversity of bacterial siderophore pathways
- Center for Quantitative Biology, Academy for Advanced Interdisciplinary Studies, Peking University, China
- Peking-Tsinghua Center for Life Sciences, Academy for Advanced Interdisciplinary Studies, Peking University, China
- University of Zurich, Department of Chemistry, Switzerland
- School of Life Science, Shandong University, China
- Jiangsu Provincial Key Lab for Organic Solid Waste Utilization, Key Lab of Organic-based Fertilizers of China, Nanjing Agricultural University, China
- University of Helsinki, Department of Microbiology, Finland
- Helmholtz International Lab for Anti-infectives, State Key Laboratory of Microbial Technology, Shandong University, China
- University of Zurich, Department of Quantitative Biomedicine, Switzerland
Figures
Figure 1
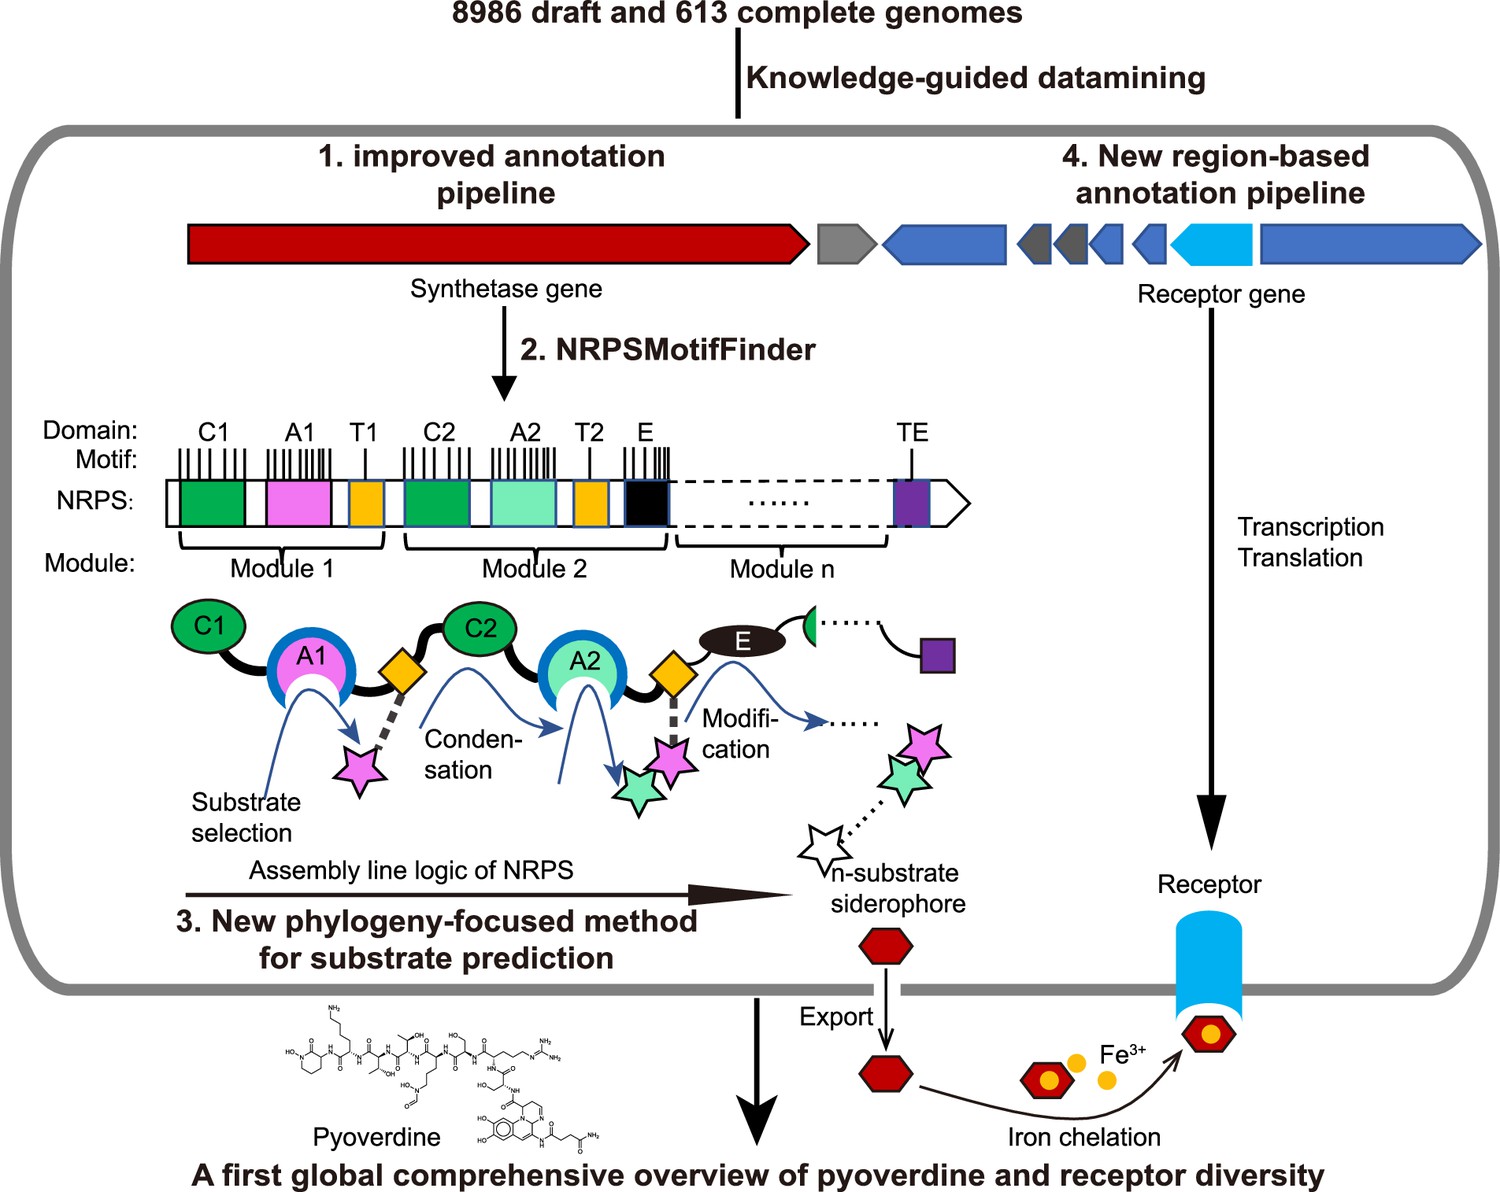
Scheme depicting our new genome mining pipeline to precisely predict the biosynthesis, the molecular structure, and the uptake machinery of pyoverdines, a family of iron-scavenging siderophores produced by members of the Pseudomonas genus.
The gray rounded outer rectangle represents a bacterial cell. The red and blue arrow-shaped boxes stand for the synthetase and receptor genes for pyoverdines, respectively. Synthetase genes are transcribed and translated to form the n-modular non-ribosomal peptide synthetase (NRPS) enzymes. These enzymes synthesize the peptide backbone of pyoverdine through an assembly line using their repeating module units, with the A domain being responsible for substrate selection and the E domain for chirality. The n-substrate siderophores are then exported to the extracellular space for iron chelation. Membrane-embedded TonB-dependent receptors recognize the ferri-siderophore complex and import it into the cell. Bold black text and black arrows describe our multi-step computational methods developed to reconstruct the entire process from genome sequence data. First, the annotation pipeline was improved (from antiSMASH, Blin et al., 2019) to extract the complete sequence of pyoverdine synthetase genes from draft genomes. Second, NRPSMotifFinder was used to define A and E domains and to determine the exact motif-intermotif structure of the pyoverdine assembly line. Third, intermotif regions most indicative of substrate specificity were used to develop a phylogeny-focused method for precise product prediction. Fourth, a sequence region-based annotation method was combined with genome architecture features to identify the FpvA, receptors responsible for ferri-pyoverdine import.
Figure 2
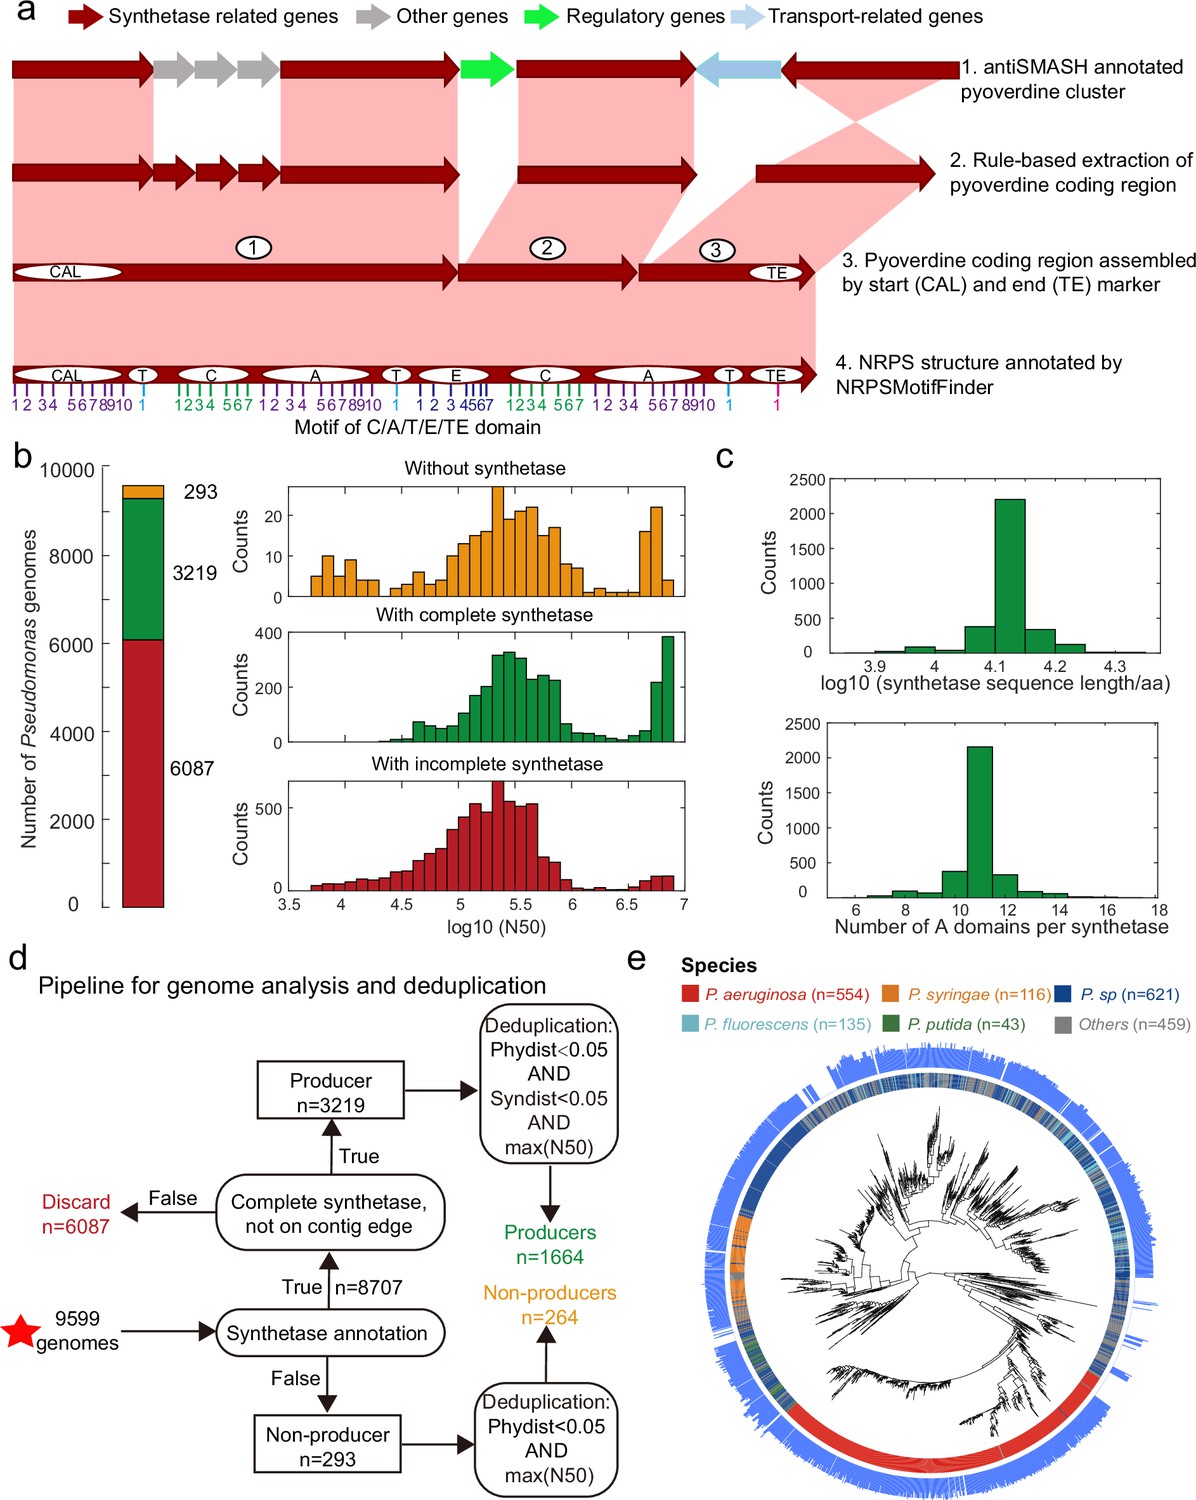
Improved annotation pipeline reveals a vast diversity of pyoverdine synthetase genes.
(a) Improved annotation pipeline based on the raw annotation from antiSMASH (Blin et al., 2019). (b) The annotation pipeline was applied to 9599 Pseudomonas genomes (94% draft genomes). Genomes could be separated into three categories. Yellow: genomes without pyoverdine cluster. Green: genomes with a complete pyoverdine cluster. Red: genomes with incomplete pyoverdine synthetase cluster. The red category involved genomes with truly incomplete clusters (lacking Flu or Pep synthetic genes) or genomes with likely truncated synthetic genes at the edge of contigs. (c) Distributions of the sequence length (upper panel) and the number of A domains (lower panel) across all the genomes with a complete synthetase cluster. (d) Workflow applied to separate the 9599 Pseudomonas genomes into the three categories described in b and removing of redundant genomes with high phylogenic similarity and showing high similarity in pyoverdine synthetases. Red star indicates the start of the workflow. (e) Phylogenetic tree depicting the relationship among the 1928 non-redundant Pseudomonas strains (1664 producers and 264 non-producers) based on the concatenated alignment of 400 single-copy conserved genes in their genomes. The inner ring depicts the taxonomical classification including the four most prevalent species. The outer ring shows the number of A domains present in the pyoverdine synthetase assembly line in each strain.
Figure 3 with 2 supplements
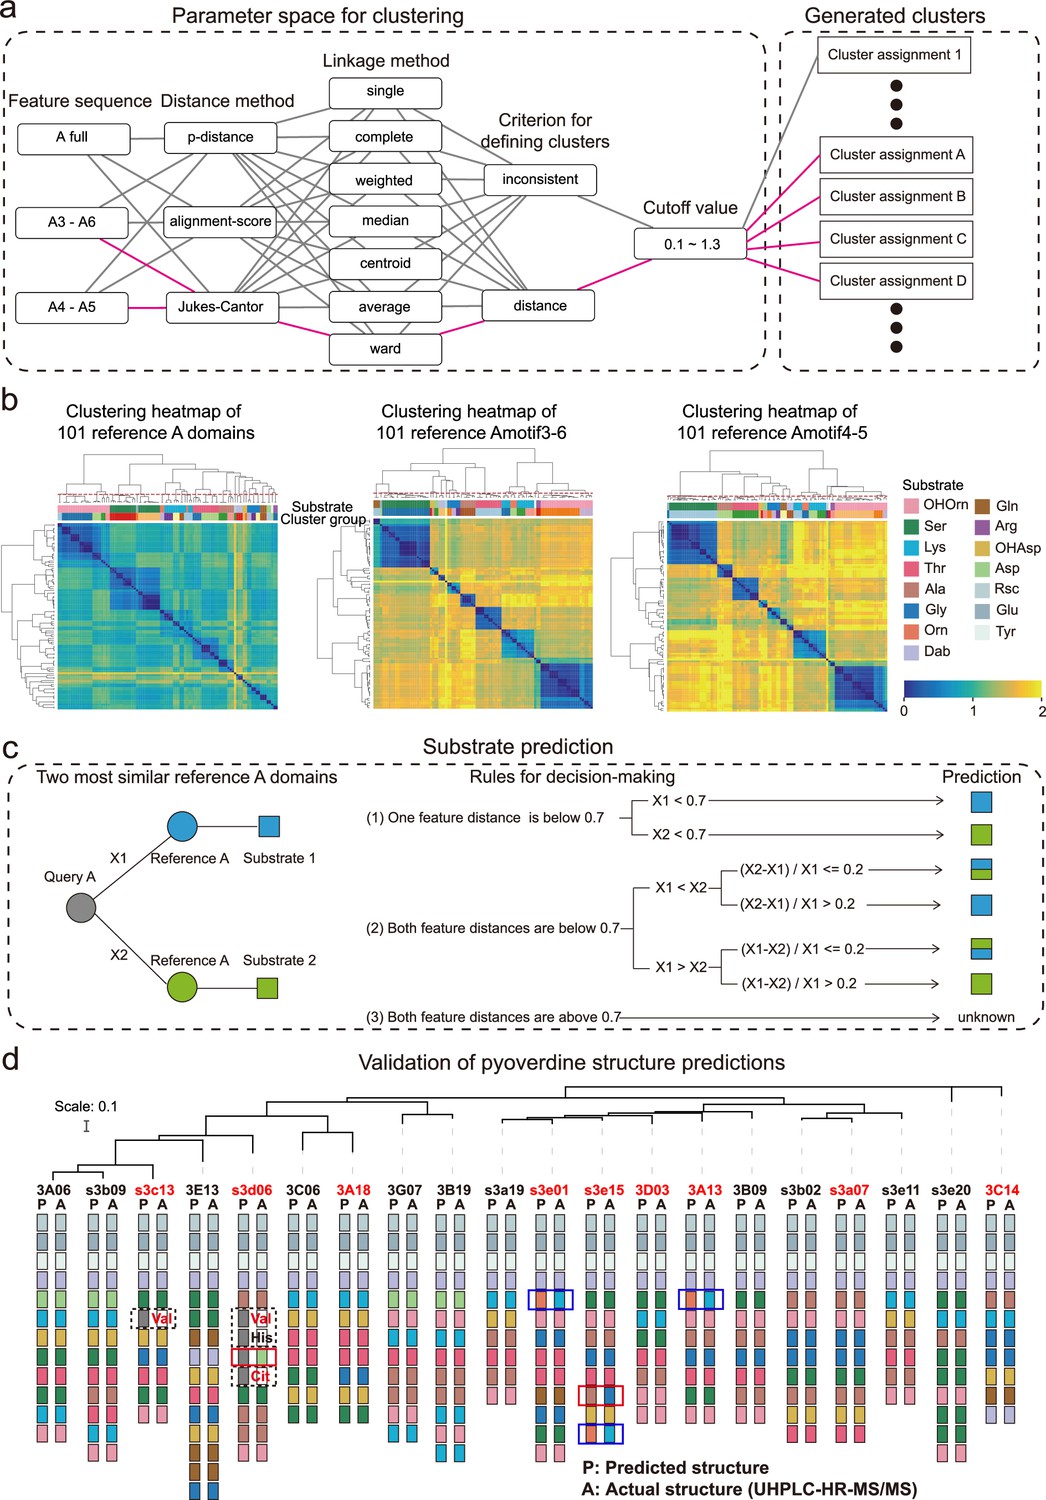
Phylogeny-focused substrate prediction for pyoverdine synthetase assembly lines.
(a) Information from 101 reference A domains with known amino acid substrates were used to develop an algorithm that predicts substrates from A domain sequence data with high accuracy. The challenge is to group the variable A domains into clusters that predict the same substrate (captured by the silhouette index). To find the most distinctive algorithm, we combined different feature sequences of A domains (Amotif) with different distance and linkage methods in our hierarchical clustering analyses. The best performing path is shown in pink. (b) Heatmap showing the hierarchically clustered distances of the 101 reference A domains as a function of the feature sequence used. Color bar in the lower right shows the sequence distance. Left panel: complete A domain sequences. Middle panel: Amotif3-6 sequences. Right panel: Amotif4-5 sequences. The heatmaps show that hierarchical clustering, reliably associating sequence distances with substrates, worked best with the Amotif4-5. The experimentally validated substrates are shown on top of each heatmap and consist of 13 amino acids and 2 amino acid derivatives: Ser (serine), Lys (lysine), Thr (threonine), Ala (alanine), Gly (glycine), Gln (glutamine), Arg (arginine), Asp (aspartic acid), Glu (glutamic acid), Tyr (tyrosine), Orn (ornithine), Rsc (succinic acid derivatives), Dab (2,4-diaminobutyric acid), OHAsp (aspartic acid derivative), and OHOrn (a general term for three ornithine derivatives: FoOHOrn, AcOHOrn, cOHOrn). (c) Phylogeny-focused substrate prediction pipeline for query A domains (gray circle) based on Amotif4-5 feature sequence comparisons. X1 and X2 represent the feature distance between the query A domain and two closest reference A domains (blue and green circles), respectively. Three rules are used, based on the feature sequence distances X1 and X2 and a threshold value of 0.7 (50% similarity), to make substrate predictions for the query A domain. There are three possible outcomes: unambiguous substrate prediction (blue or green squares), ambiguous substrate prediction (dual-colored squares), and no prediction (‘unknown’). (d) Phylogenetic tree of 20 Pseudomonas strains and visualization of their predicted and actual pyoverdine structures to validate our phylogeny-focused substrate prediction pipeline. Strains marked in red font indicate cases with novel (not yet characterized) pyoverdines structures. 151 out of the 160 substrates (94.4%) were correctly predicted. The nine inconsistencies are boxed in blue (lysine and ornithine are indistinguishable), in dashed black (detection of ‘unknown’ substrates), and in red (true mismatches). Note that our prediction pipeline (as any other pipeline) cannot distinguish between modified variants of the same amino acid, for example, we cannot distinguish the three derivatives of ornithine (FoOHOrn, AcOHOrn, cOHOrn).
Figure 3—figure supplement 1
Clustering heatmap of sequence distance matrix between 318 Amotif4-5 from Pseudomonas strains in the MIBiG database (Supplementary file 4).
MIBiG is a standard annotation database of biosynthetic gene clusters. We retrieved all secondary metabolites produced by members of the Pseudomonas genus from MIBiG. The colors on top of the heatmap indicate the substrate of the A domains. We focus on the domains with closed sequence distance but with distinct substrate specificity (marked with red text). After checking the original reference, theses domains were labeled incorrectly in MIBiG (Supplementary file 5).
Figure 3—figure supplement 2
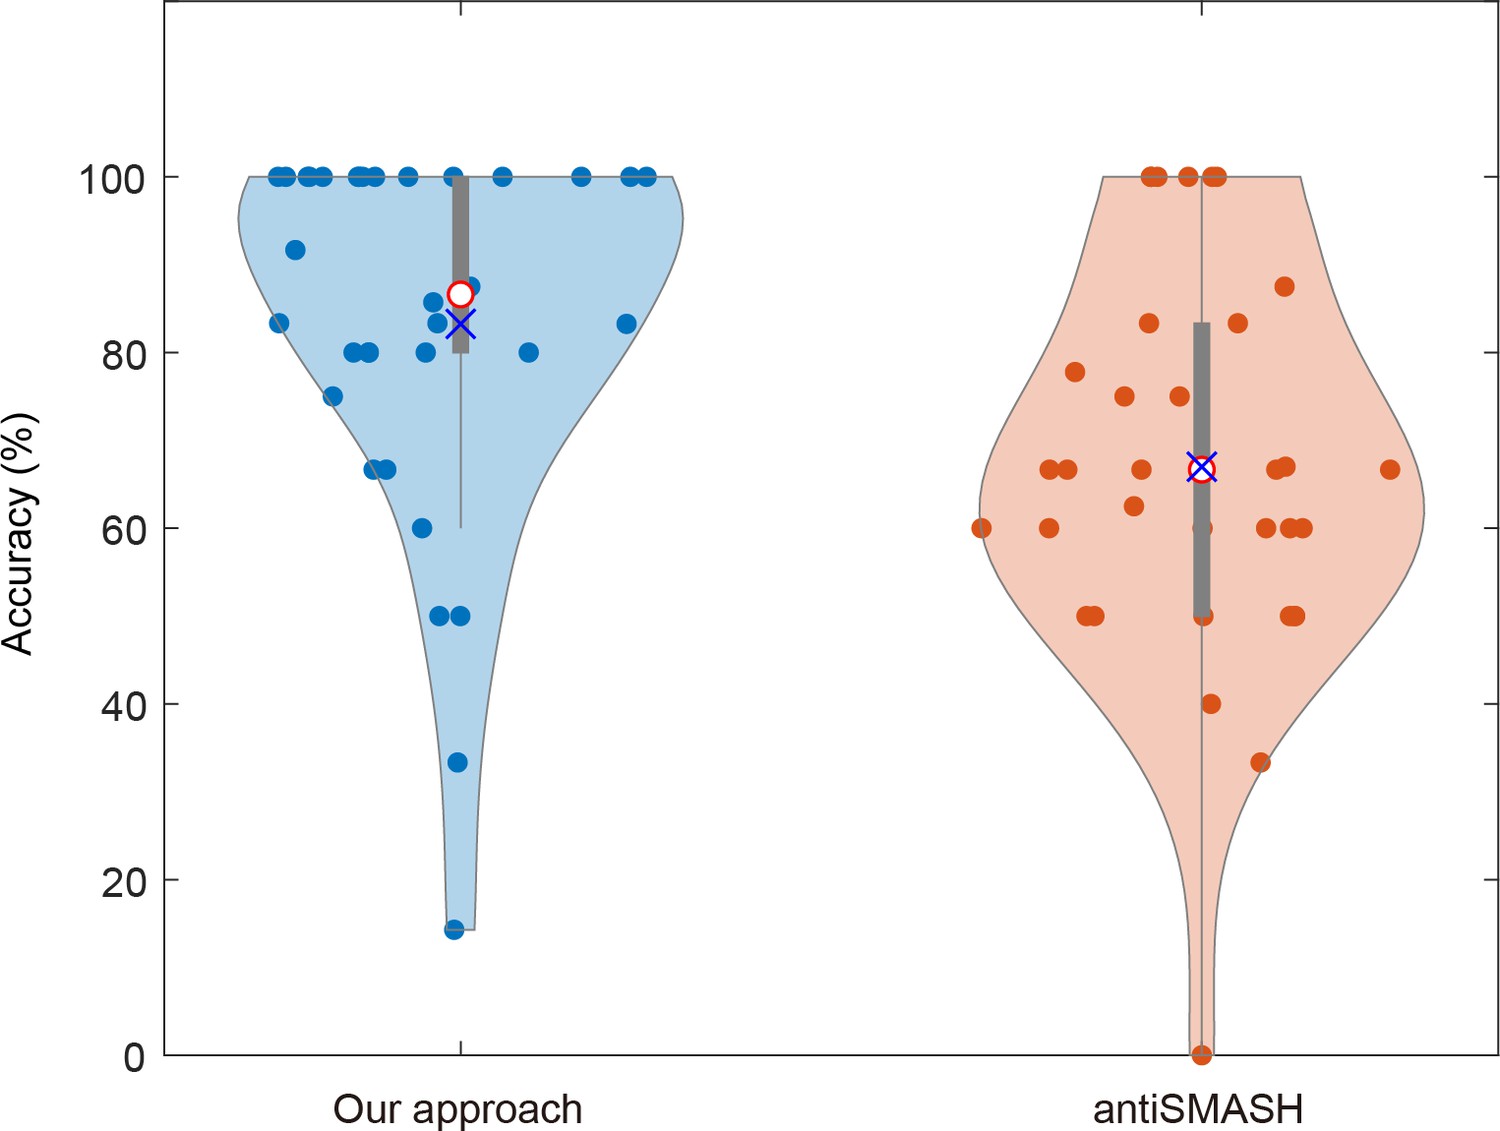
Comparison of prediction accuracy in the structural composition of secondary metabolites between our approach and antiSMASH in Burkholderiales.
Each data point in the violin plot symbolizes a distinct secondary metabolite. The median is denoted by a red circle, while the mean is represented by a blue ‘×’.
Figure 4 with 1 supplement
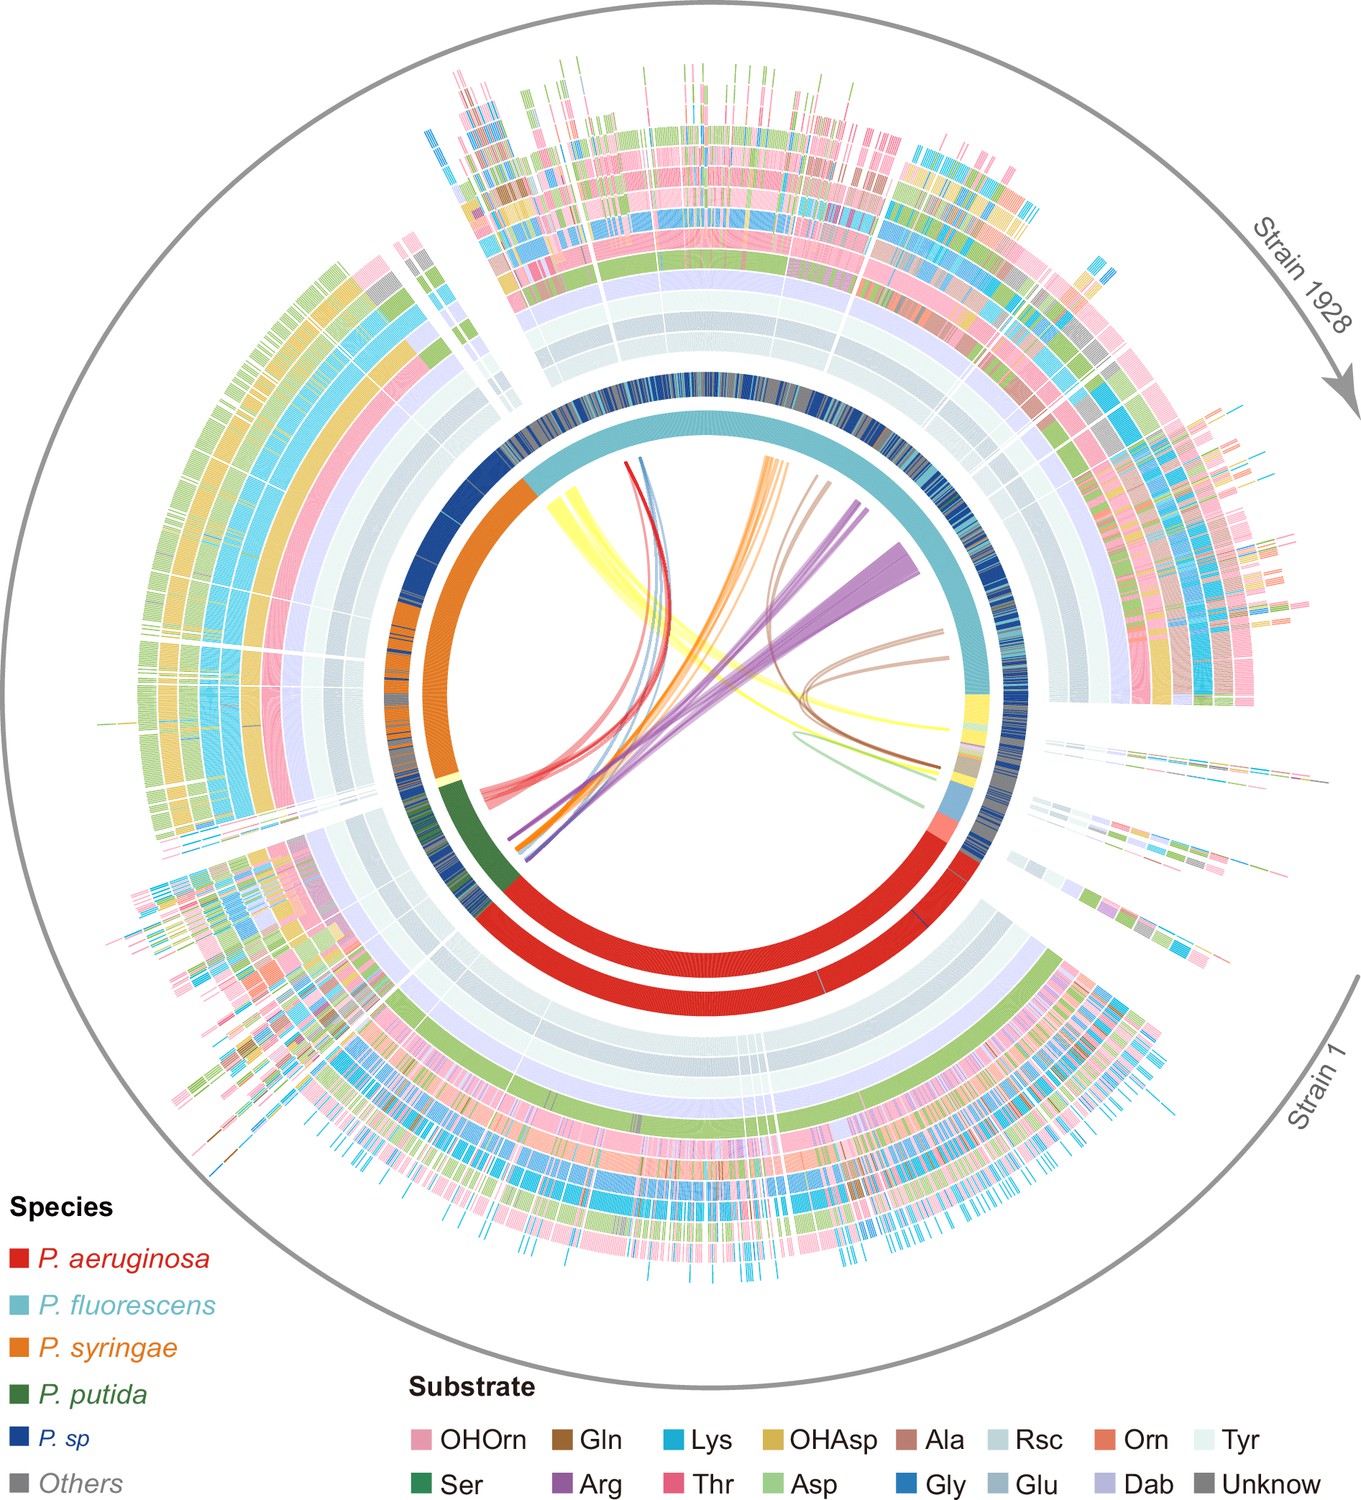
Predicted pyoverdine structural diversity based on our developed algorithm mapped onto the phylogenetic tree of all 1928 (non-redundant) Pseudomonas strains.
In this figure, the strains are arranged based on the phylogenetic tree without showing the tree itself. The stacked boxes in the outermost circle show the predicted structure of pyoverdines, whereby each color represents a specific amino acid substrate. Strains without boxes represent non-producers (n=264). Boxes with two colors indicate cases of ambiguous (dual) substrate prediction. The inner circle shows the taxonomic species classification following Figure 2e. Because the allocation of strains to species names is often imprecise, we divided the 1928 strains by their phylogenetic distance into 18 clades (color shadings in innermost circle), out of which 13 contained more than one strain. Lines within the innermost circle link strains from different clades that share the same pyoverdine structures, whereby line colors represent the shared unique pyoverdines. The bending of the lines represents the phylogenetic sequence distances of the connected strain pairs.
Figure 4—figure supplement 1

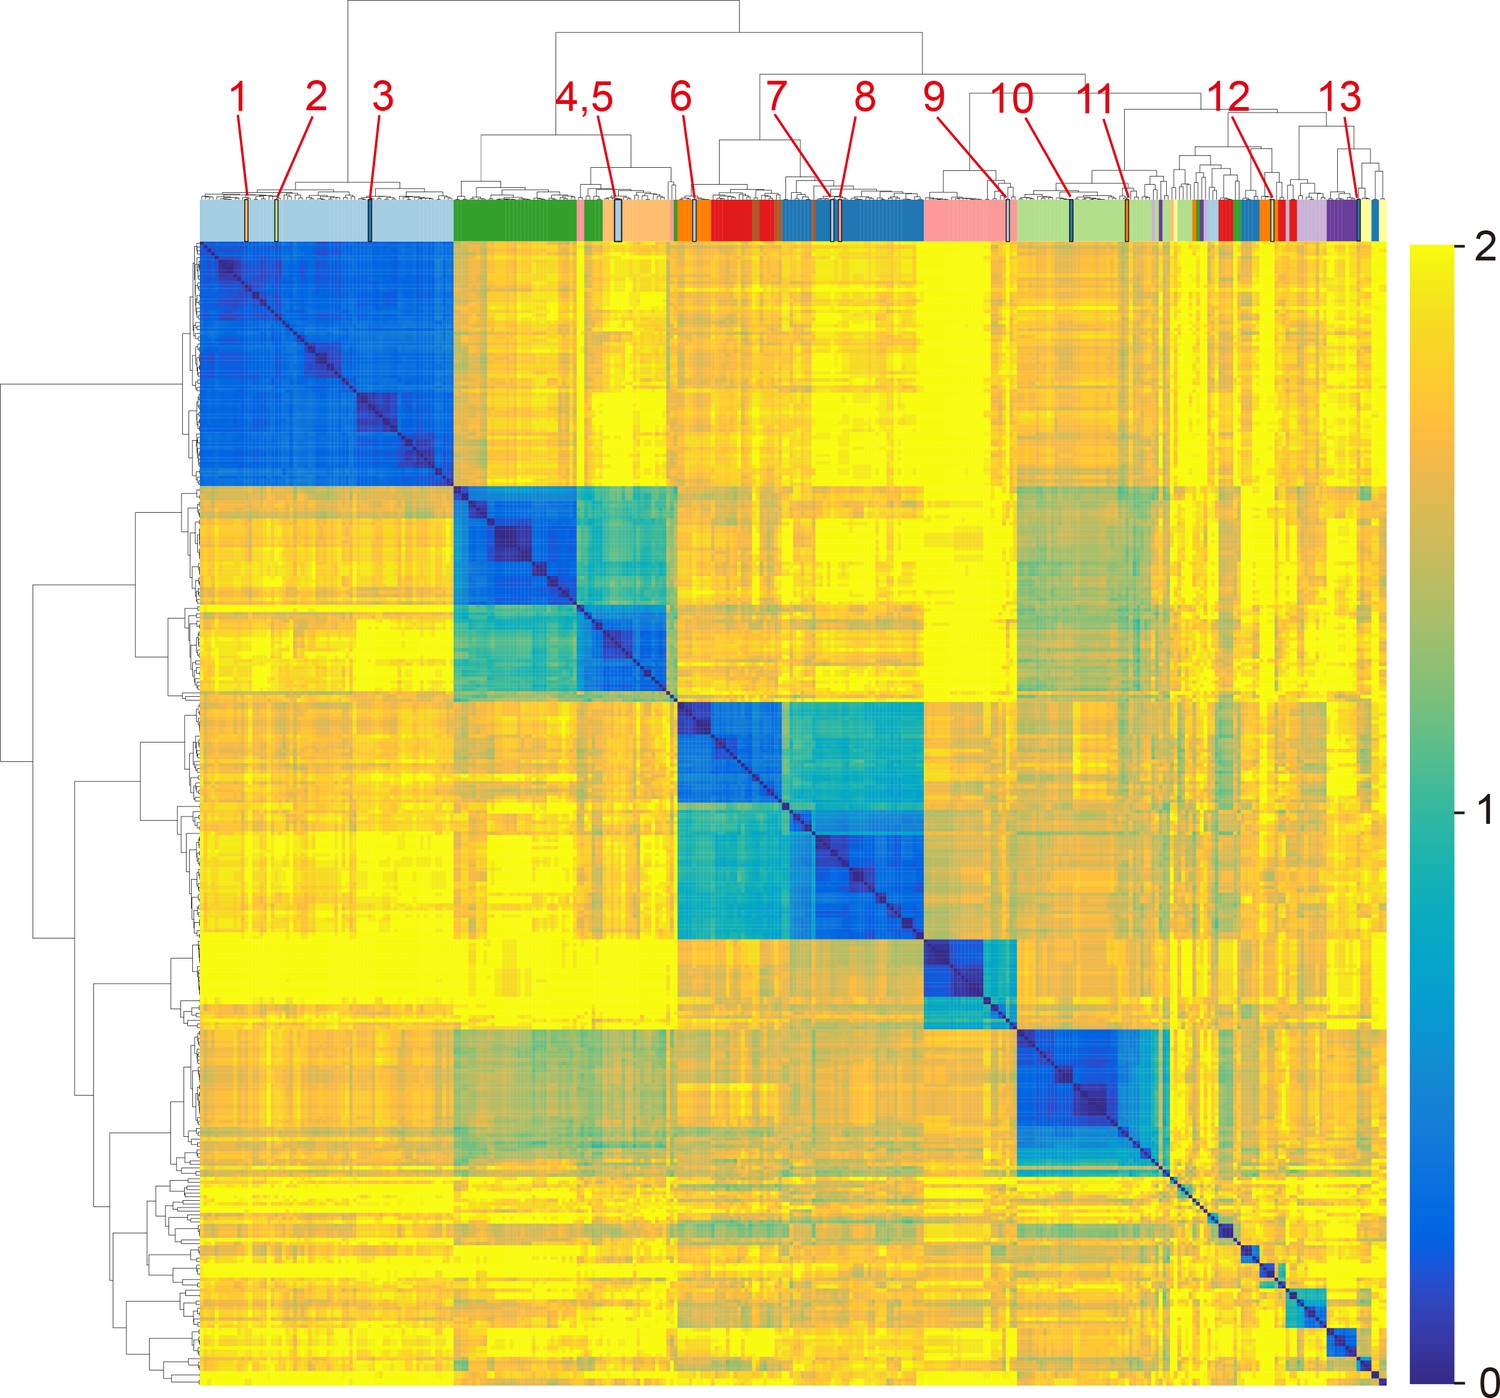
Clustering heatmap of sequence distance matrix between A domains from 1664 strains and 101 reference A domains.
The color on top indicates the substrate of reference A domains.
Figure 5
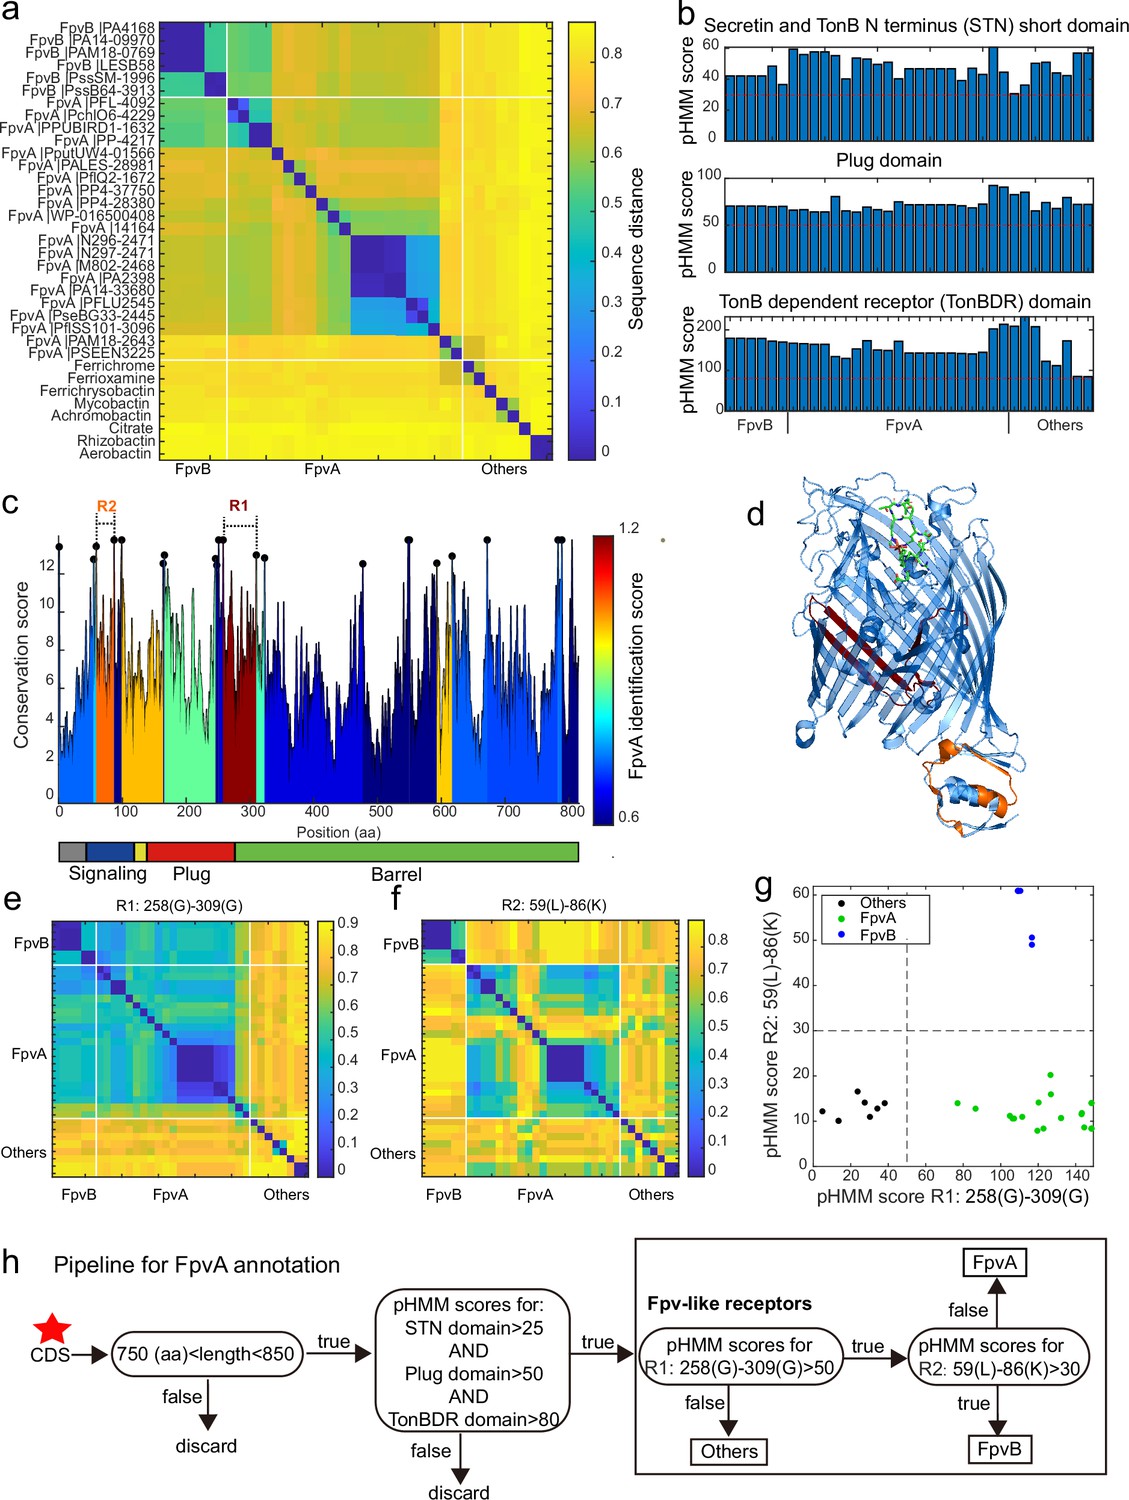
A sequence region-based identification pipeline for annotating FpvA receptors.
(a) Heatmap displaying the hierarchically clustered sequence distances (p-distance calculation method, identity (%) = (1-sequence distance) * 100) of 35 reference siderophore receptors identified in Pseudomonas spp., based on full sequences. No clear discrimination between FpvA, FpvB, and other receptors is possible. The order of receptors is consistent across panels (b), (e), and (f). (b) The profile hidden Markov model (pHMM) scores of the three standard receptor domains (STN, Plug, and TonBDR) vary across the 35 reference sequences (A: FpvA, B: FpvB, and NA: others), but do not allow to distinguish between receptor groups. (c) FpvA region-based conservation scores from a multi-alignment of the 35 reference sequences mapped to the FpvA sequence of strain P. aeruginosa PAO1. All residues within the top 10% of the conservation score are denoted with black dots. For each region flanked by two black dots, we calculated the FpvA identification score (heatmap), representing the ability to distinguish FpvA from non-FpvA receptors. (d) Mapping of the two regions with the highest FpvA identification scores R1 (dark red) and R2 (orange) to the crystal structure of FpvA from PAO1 conjugated with pyoverdine (PDB 2IAH). (e) Heatmap showing the hierarchically clustered sequence distances of 35 reference siderophore receptors based on the R1 sequence region. A clear discrimination between FpvA/FpvB and other receptors emerges. (f) Heatmap showing the hierarchically clustered sequence distances of 35 reference siderophore receptors based on the R2 sequence region. A clear discrimination between FpvA and FpvB receptors emerges. (g) The pHMM scores of regions R1 and R2 for the 35 siderophore reference receptors are contrasted against each other, yielding a clear separation between FpvA, FpvB, and other receptors. Dashed lines indicate the pHMM threshold scores used for later analysis. (f) Flowchart showing all steps involved in the FpvA annotation from genome sequence data. The red star indicates the start of the workflow.
Figure 6 with 3 supplements
Application of the receptor annotation pipeline to the full database.
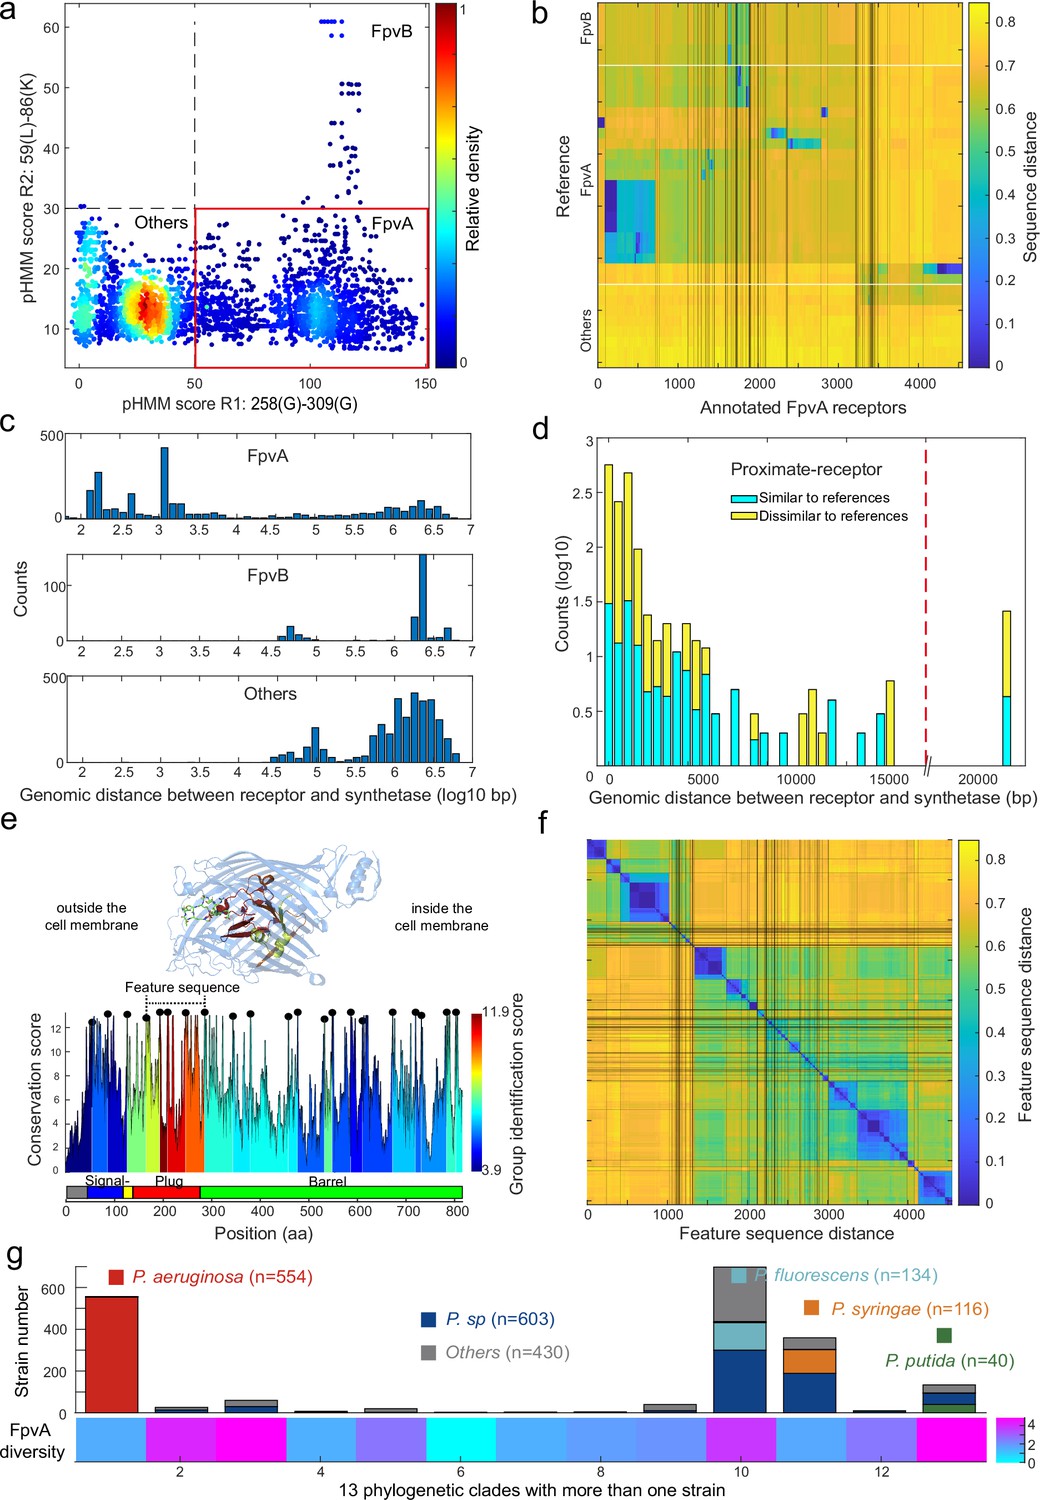
(a) Applying the receptor annotation pipeline to the genomes of the 1928 non-redundant Pseudomonas strains yields 14301 Fpv-like receptors, which segregate into 4547 FpvA receptors (red box), 615 FpvB receptors, and 9139 other receptors, based on the profile hidden Markov model (pHMM) score thresholds for regions R1 and R2. The heatmap indicates receptor density. (b) Sequence distance matrix between the 35 reference sequences (y-axis) and the 4547 annotated FpvA sequences in the full database (x-axis). Database sequences were ordered by hierarchically clustering and segregated into 114 groups. 2254 of the annotated FpvA sequences have low sequence identity <60% compared to the reference receptors, pointing at many novel subtypes of FpvA receptors. (c) Genomic distance (in base pairs) between each Fpv-like receptor sequence and its pyoverdine peptide synthetase gene (Pep) for annotated FpvA receptors (upper panel), FpvB receptors (middle panel), and other receptors (lower panel). (d) Distribution of the genomic distance between each FpvA receptor and its nearest pyoverdine peptide synthetase depending on whether the annotated FpvA receptor has high sequency similarity (blue, ≥50%) or low sequence similarity (yellow, <50%) with at least 1 of the 21 reference FpvAs. (e) FpvA region-based conservation scores from a multi-alignment of all the annotated FpvA receptors that are proximate (<20 kbp) to the pyoverdine synthetase cluster mapped to the FpvA sequence of strain P. aeruginosa PAO1. All residues within the top 10% of the conservation score are denoted with black dots. For each region flanked by two black dots, we calculated the group identification score (heatmap, lower panel), representing the ability of the region to distinguish between different groups of FpvA receptors. Four regions in the plug domains had a particularly high group identification score (called the feature sequence). They are mapped to the crystal structure of FpvA from PAO1 conjugated with pyoverdine (PDB 2IAH, upper panel). All four regions surround the pyoverdine transmission channel and are shown in the respective heatmap color. (f) Heatmap showing the hierarchically clustered distances between the 4547 annotated FpvA receptors based on the feature sequence (comprising the four groups with the highest identification scores). The analysis identifies 94 receptor groups with a 70% identity threshold. (g) The diversity of FpvA receptors along the 13 phylogeny clades containing more than 1 strain. Receptor diversity was calculated by the Shannon entropy, similar to the alpha-diversity in microbial community.
Figure 6—figure supplement 1
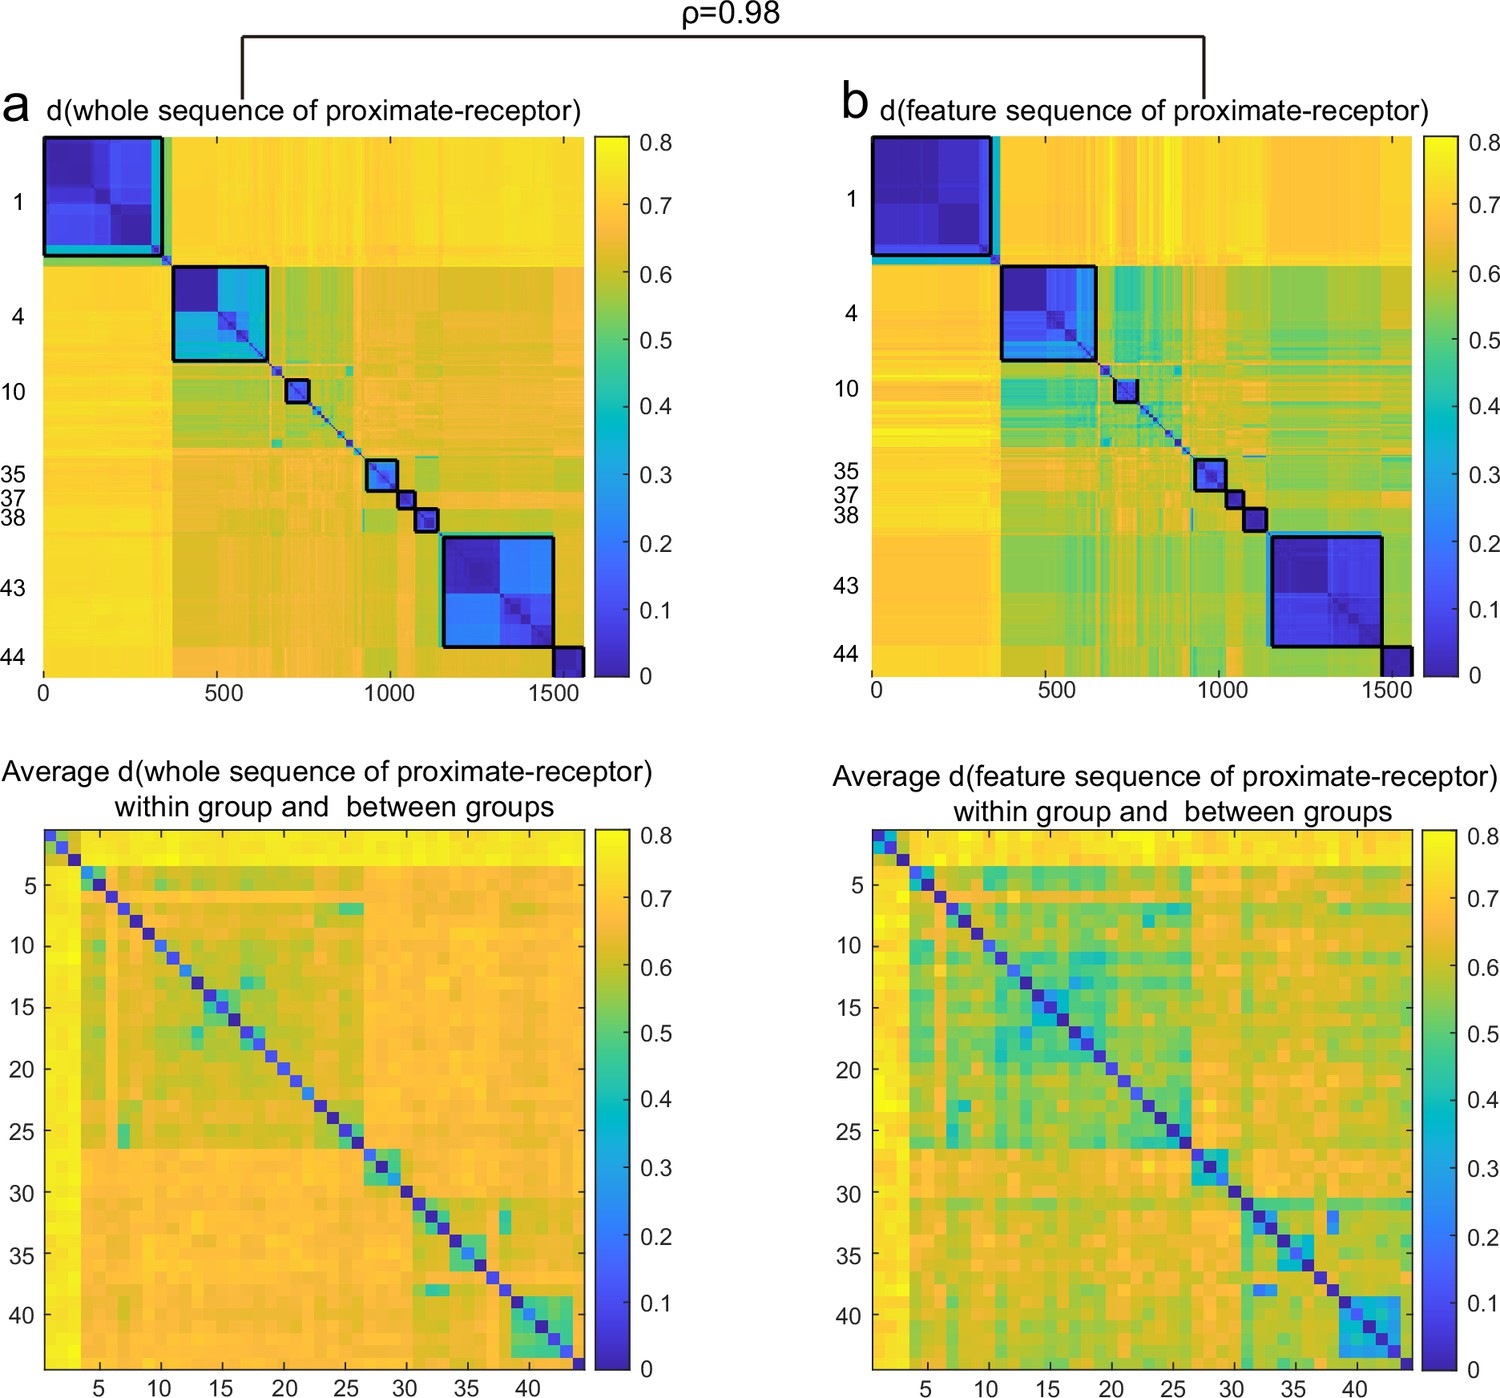
Comparison of clustering and grouping effects of all proximate-receptors.
Complete (a) and feature (b) sequence of proximate-receptors. Comparison of clustering and grouping effects of complete sequences (a) and feature sequences (b) of all proximate receptors.
Figure 6—figure supplement 2

Applying the receptor annotation pipeline to >30,000 complete bacterial genomes in NCBI based on the profile hidden Markov model (pHMM) score thresholds for regions R1 and R2.
The heatmap indicates receptor density.
Figure 6—figure supplement 3
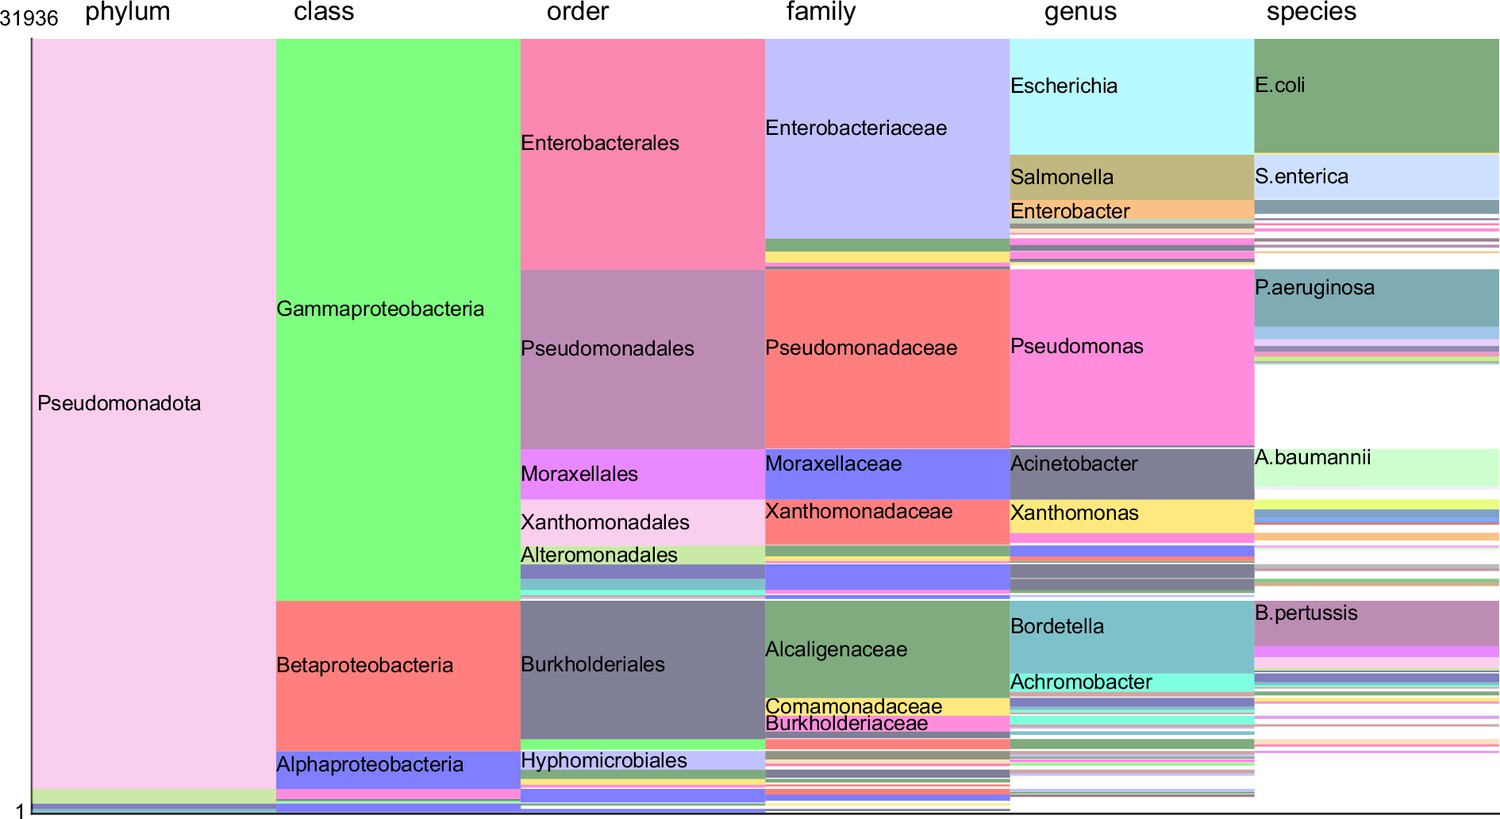
The distribution of 31,936 FpvAs spans various taxonomic categories.
Taxa with an abundance exceeding 1/500 are highlighted with colors, while others remain white. Taxa surpassing an abundance of 1/50 will have their specific names marked.
Author response image 1

Author response image 2

Tables
Author response table 1
| Description | Accuracy | |
|---|---|---|
| PHYfocus (Our method) | phylogeny focus | 94% |
| NP.searcher | specificity code | 63% |
| PRISM4 | phmm | 79% |
| AdenPredictor | Mix | 38% |
| SeMPI2 | randomforest | 58% |
| SANDPUMA | Mix | 46% |
| antiSMASH5 | Mix | 59% |
Additional files
-
Supplementary file 1
The information of 73 pyoverdine structures have been reported.
- https://cdn.elifesciences.org/articles/96719/elife-96719-supp1-v1.xlsx
-
Supplementary file 2
13 Pseudomonas strains for which both pyoverdine structures and completely sequenced synthetase genes were available.
- https://cdn.elifesciences.org/articles/96719/elife-96719-supp2-v1.xlsx
-
Supplementary file 3
The sequences and producing strains of 101A domains that are linked to 13 experimentally confirmed amino acid substrates.
- https://cdn.elifesciences.org/articles/96719/elife-96719-supp3-v1.xlsx
-
Supplementary file 4
All A domain and substrate data for all non-ribosomal peptide synthetase (NRPS) secondary metabolism instances for Pseudonomas within MIBiG 3.0.
- https://cdn.elifesciences.org/articles/96719/elife-96719-supp4-v1.xlsx
-
Supplementary file 5
The A domains with incorrect corresponding substrate information in MIBiG 3.0.
- https://cdn.elifesciences.org/articles/96719/elife-96719-supp5-v1.xlsx
-
Supplementary file 6
The results of comprehensive comparative analysis of our method with six different commonly used methods, including NP.searcher, PRISM4, AdenPredictor, SeMPI2, SANDPUMA, antiSMASH5.
- https://cdn.elifesciences.org/articles/96719/elife-96719-supp6-v1.xlsx
-
Supplementary file 7
A previously curated dataset of A domain sequences with experimentally confirmed substrates for Burkholderiales.
- https://cdn.elifesciences.org/articles/96719/elife-96719-supp7-v1.xlsx
-
Supplementary file 8
All A domain and substrate data for all non-ribosomal peptide synthetase (NRPS) secondary metabolism instances for Burkholderiales within MIBiG 3.0.
- https://cdn.elifesciences.org/articles/96719/elife-96719-supp8-v1.xlsx
-
Supplementary file 9
The test set encompassed 178A domain sequences with experimentally confirmed substrates for Burkholderiales.
- https://cdn.elifesciences.org/articles/96719/elife-96719-supp9-v1.xlsx
-
Supplementary file 10
21 FpvA, 6 FpvB, and 8 TonB-dependent siderophore receptor sequences often found in Pseudomonas genomes, encoding receptors for the uptake of heterologous siderophores.
- https://cdn.elifesciences.org/articles/96719/elife-96719-supp10-v1.xlsx
-
Supplementary file 11
Species information of the genome that can be annotated to the FpvA gene.
- https://cdn.elifesciences.org/articles/96719/elife-96719-supp11-v1.xlsx
-
Supplementary file 12
The finalized training set comprised 124A domain sequences with experimentally confirmed substrates for Burkholderiales.
- https://cdn.elifesciences.org/articles/96719/elife-96719-supp12-v1.xlsx
-
Supplementary file 13
MS/MS profiles of 14 pyoverdines.
- https://cdn.elifesciences.org/articles/96719/elife-96719-supp13-v1.pdf
-
MDAR checklist
- https://cdn.elifesciences.org/articles/96719/elife-96719-mdarchecklist1-v1.pdf
Download links
A two-part list of links to download the article, or parts of the article, in various formats.
Downloads (link to download the article as PDF)
Open citations (links to open the citations from this article in various online reference manager services)
Cite this article (links to download the citations from this article in formats compatible with various reference manager tools)
Feature sequence-based genome mining uncovers the hidden diversity of bacterial siderophore pathways
eLife 13:RP96719.
https://doi.org/10.7554/eLife.96719.3


