Recording γ-secretase activity in living mouse brains
- MassGeneral Institute for Neurodegenerative Disease, Massachusetts General Hospital, Harvard Medical School, United States
Figures
Figure 1 with 2 supplements
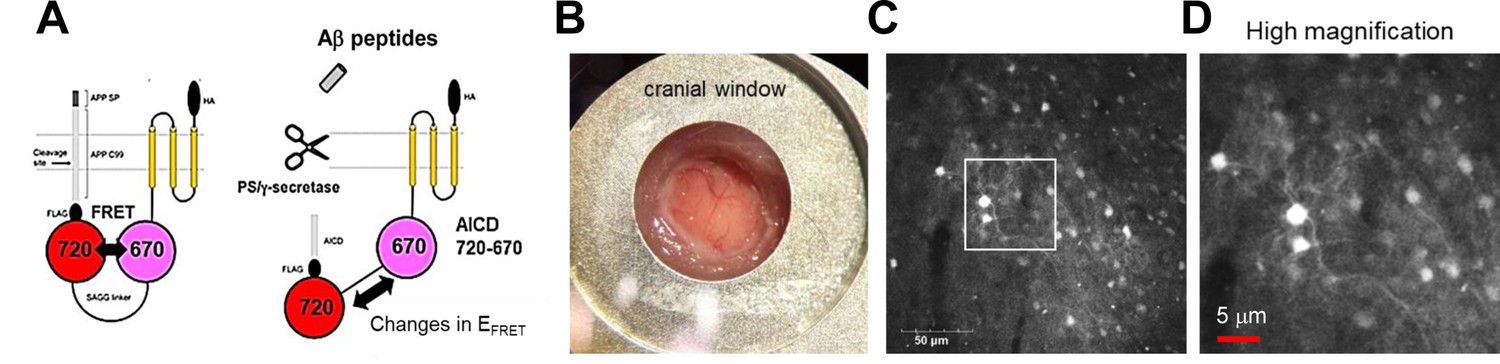
Expression of the C99 720–670 biosensor in living mouse brains.
(A) A schematic presentation of the C99 720–670 biosensor. (B) A cranial window was implanted on the top of the brain for image acquisition. (C) Extensive expression of the C99 720–670 biosensor in the somatosensory cortex was verified by confocal microscopy in vivo. Scale bar: 50 μm. (D) A high-magnification image corresponding to the square in C. Scale bar: 5 μm.
Figure 1—figure supplement 1
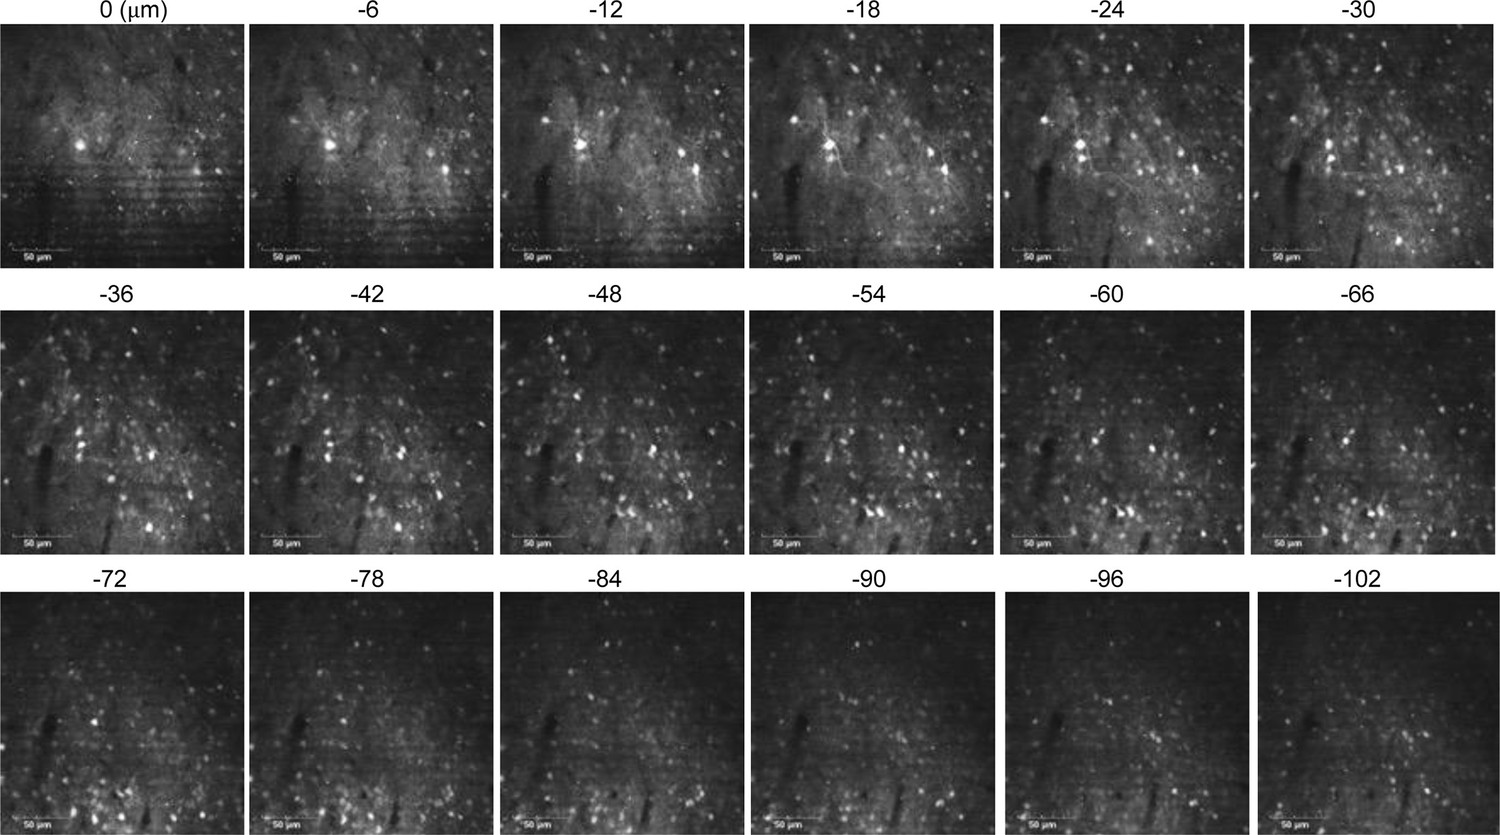
Z-section images of the brain expressing the C99 720–670 biosensor.
The C99 720–670 biosensor fluorescence signal was detected at approximately 100 μm depth from the brain surface. Scale bar: 50 μm.
Figure 1—figure supplement 2
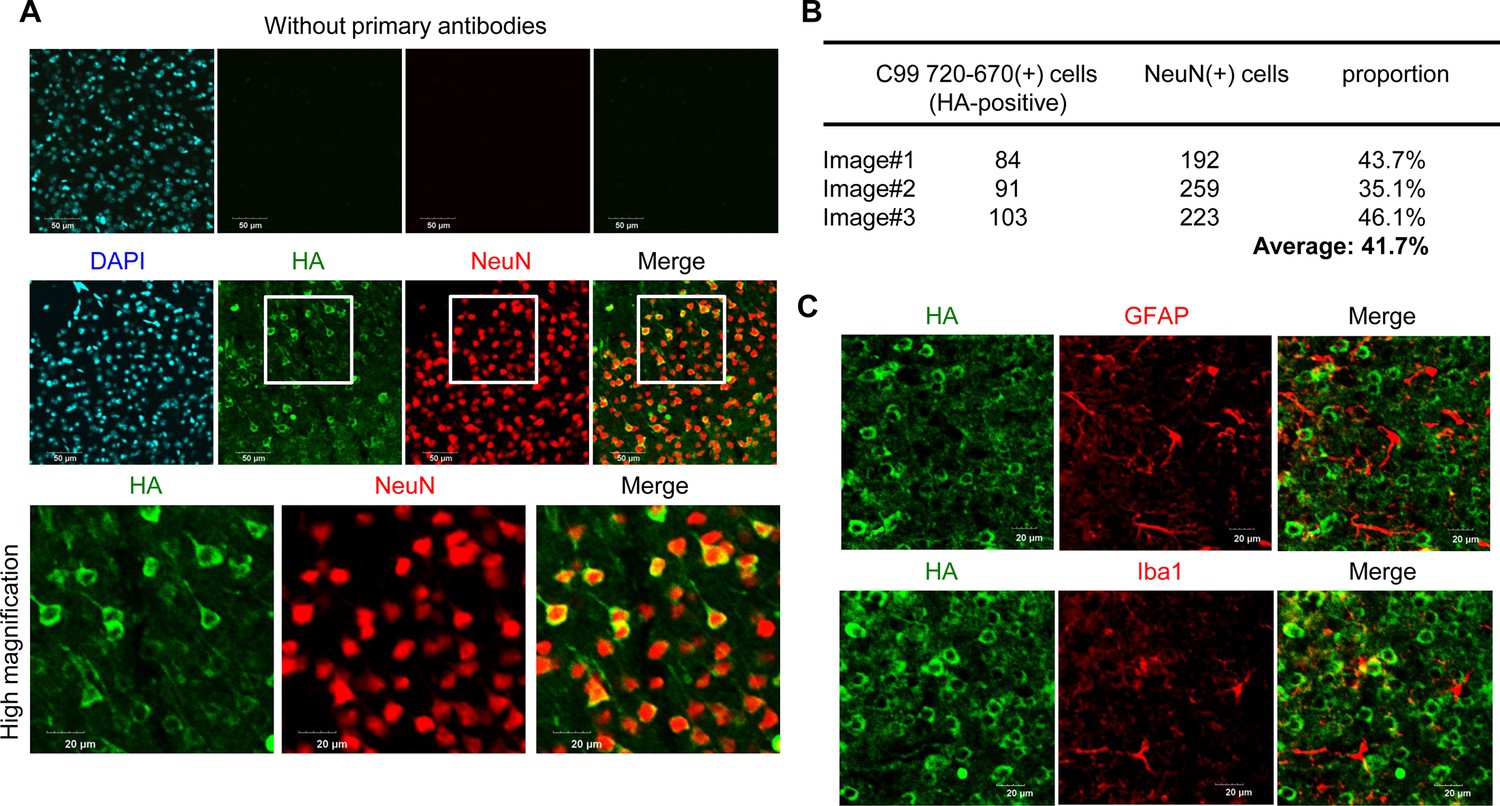
Immunohistochemistry of the brain expressing the C99 720–670 biosensor.
(A) The brain sections of mice injected with an AAV-C99 720–670 were co-stained with HA and NeuN antibodies, showing that nearly 100% of the cells expressing the C99 720–670 biosensor are NeuN-positive. Scale bar: 20 μm (bottom), 50 μm (top). (B) The quantification from three independent images suggests that approximately 40% of NeuN-positive neurons express the C99 720–670 biosensor. (C) Furthermore, we ensured that GFAP or Iba-1-positive cells do not co-localize with the HA signal, suggesting that the C99 720–670 biosensor is predominantly expressed in neurons. Scale bar: 20 μm.
Figure 2 with 2 supplements
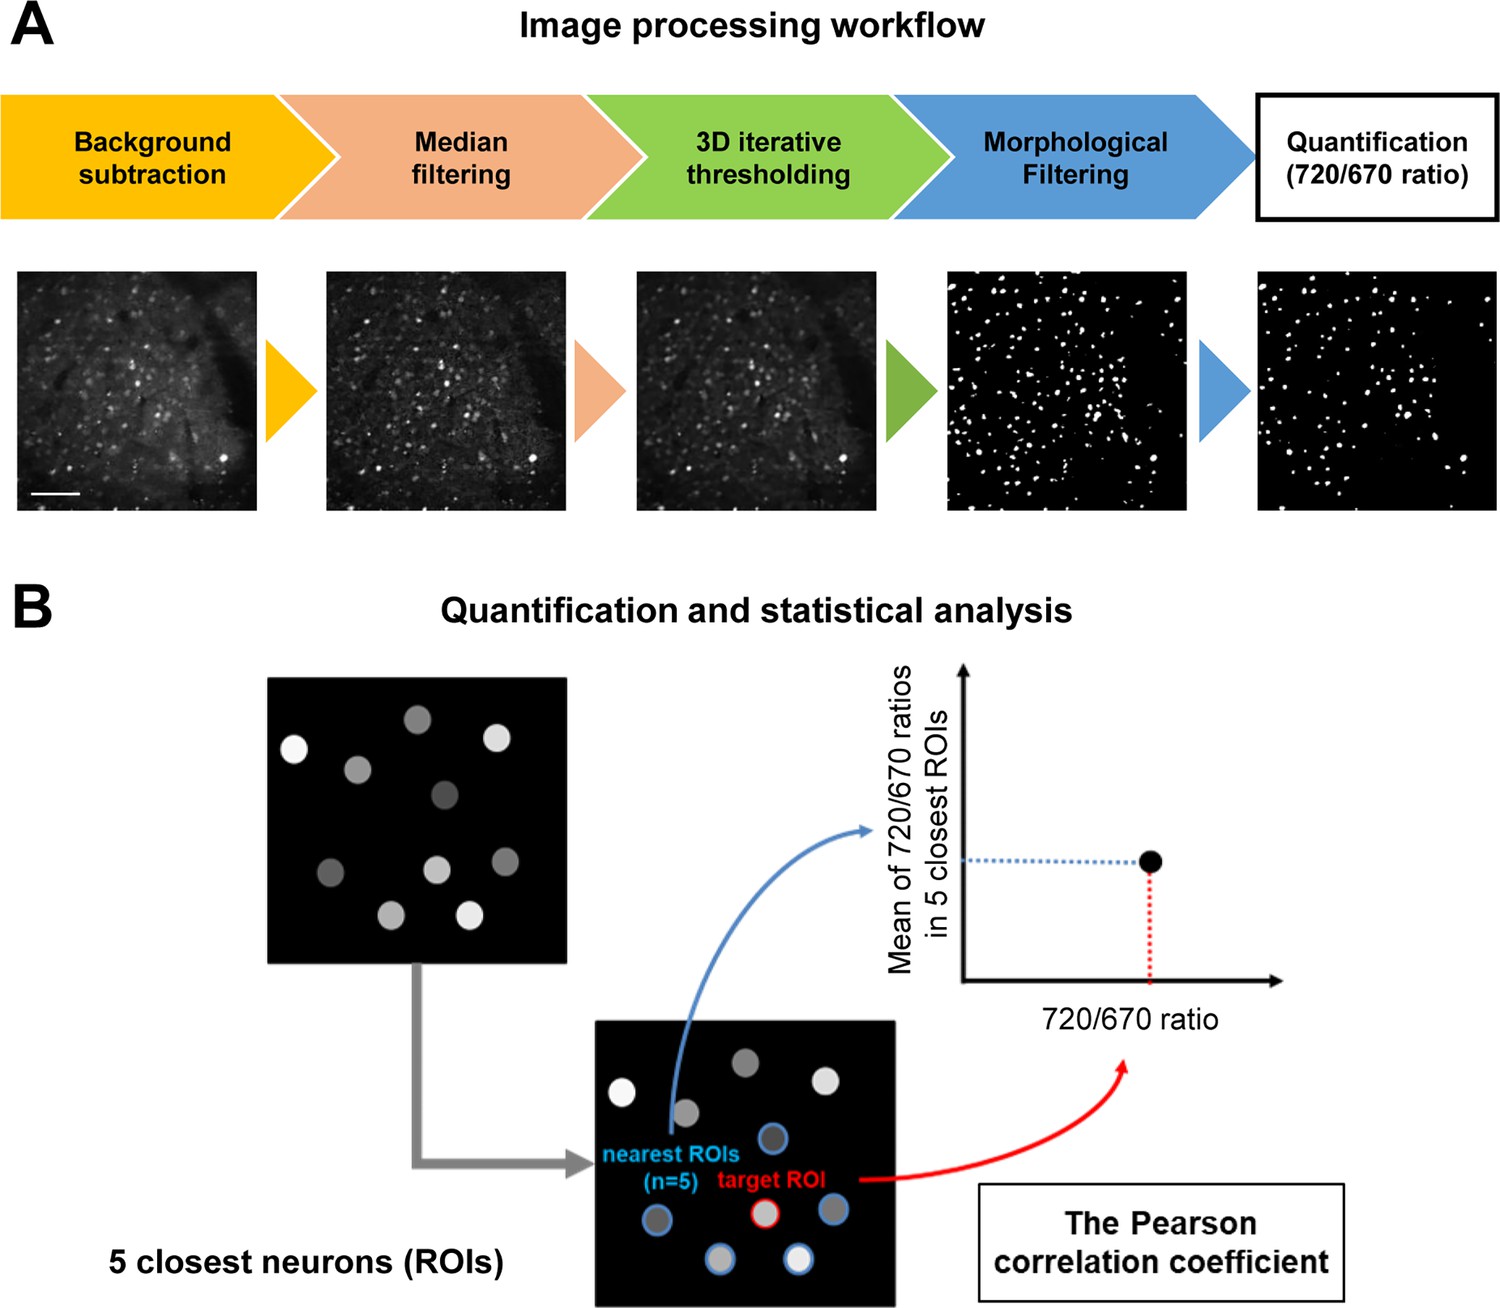
Imaging processing workflow and data analysis.
(A) Before measuring the acceptor over donor emission ratios (i.e., 720/670 ratios) on a cell-by-cell basis, which reports γ-secretase activity in individual neurons, four-step image processing steps were applied: (1) background subtraction, (2) median filtering, (3) 3D iterative thresholding, and (4) morphological filtering. Scale bar: 50 μm. (B) To elucidate the relationship between γ-secretase activity and those in neighboring neurons, the distance between neuron and neuron was first determined, then identified each neuron’s five closest neurons, and calculated the average 720/670 ratio of the five neighboring neurons. The Pearson correlation coefficient between each neuron’s 720/670 ratio and the average ratio of the five neighboring neurons was calculated.
Figure 2—figure supplement 1
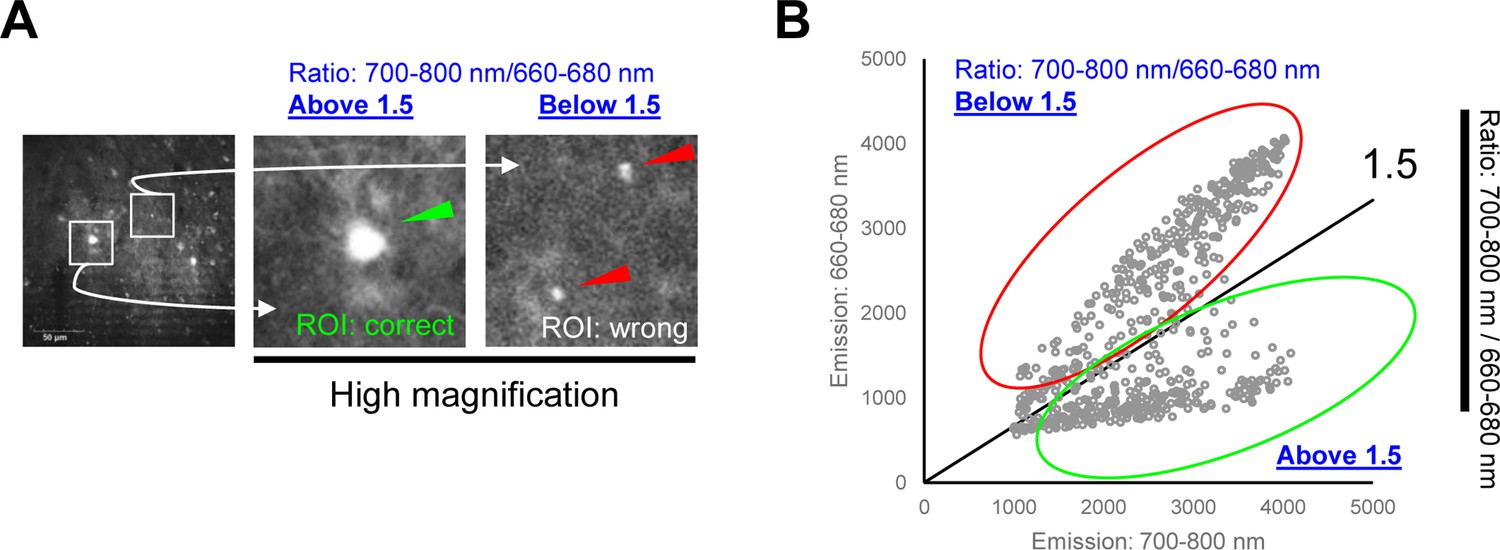
Identification and removal of auto fluorescent objects.
(A) Our four-step segmentation approach still could not perfectly remove wrongly assigned ROIs, such as shown in the right panel (red arrowheads). However, these ROIs displayed higher 660–680 nm emissions and thus significantly lower 720/670 ratios (below 1.5). Scale bar = 50 μm. (B) A scatter plot supported our observation: two populations of ROIs displaying 720/670 ratios above 1.5 and the ratios below, later of which were excluded from our data analysis.
-
Figure 2—figure supplement 1—source data 1
Numerical source data for Figure 2—figure supplement 1B.
- https://cdn.elifesciences.org/articles/96848/elife-96848-fig2-figsupp1-data1-v1.xlsx
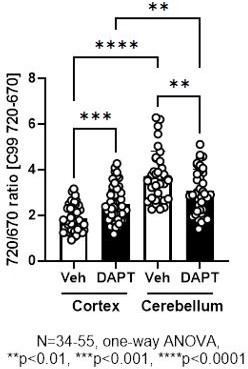
Figure 2—figure supplement 2
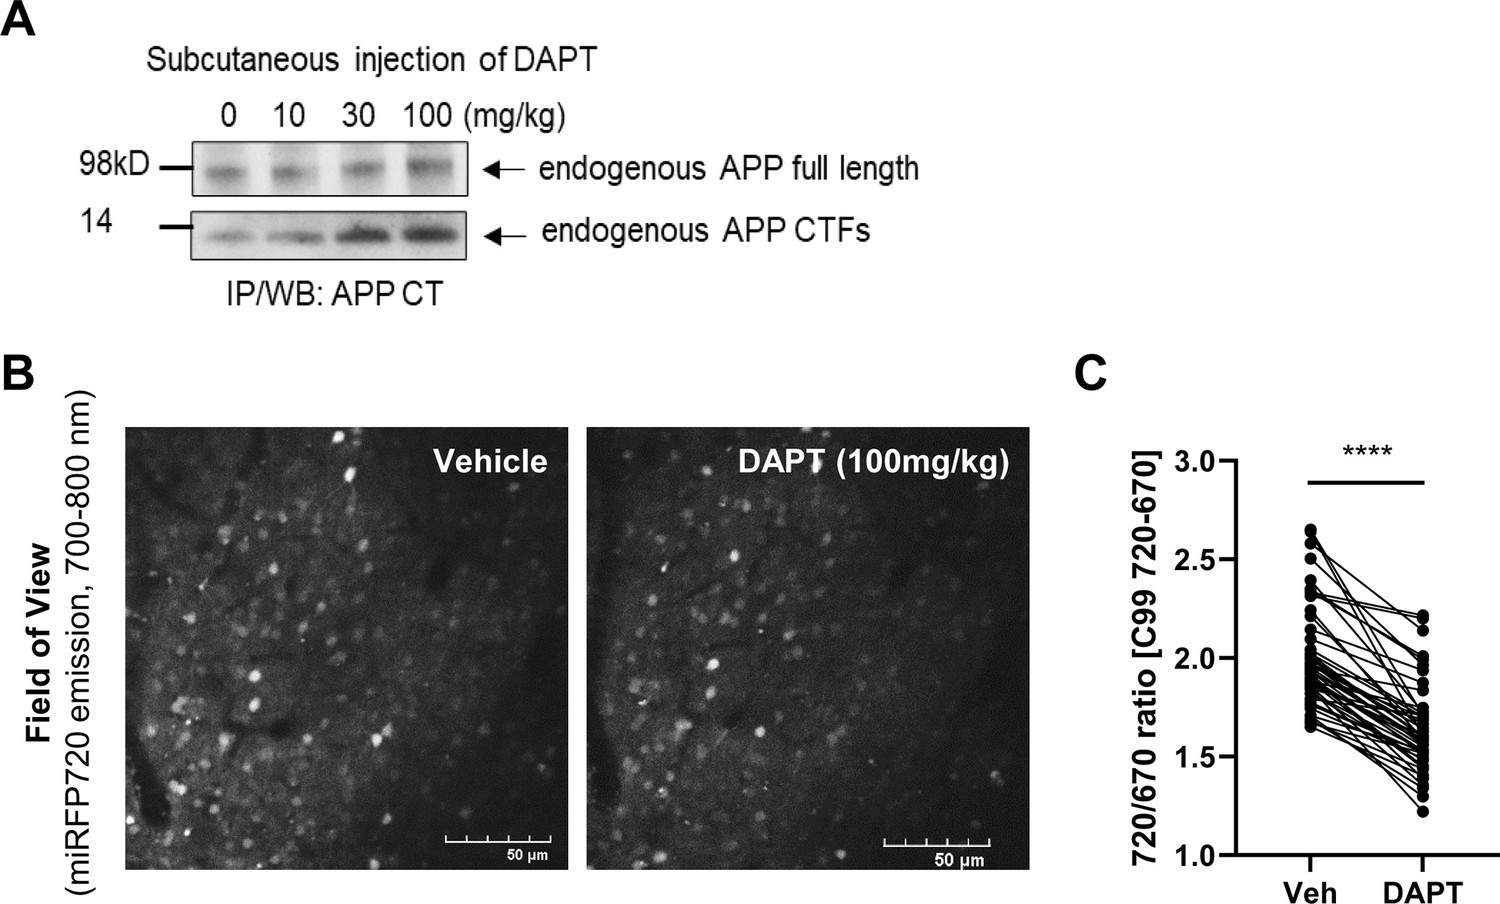
Validation of the C99 720–670 biosensor in the brain using γ-secretase inhibitor.
(A) The dose-dependent accumulation of endogenous APP C-terminus fragments (APP-CTFs) by subcutaneous administration of DAPT evidences the inhibition of γ-secretase activity in mouse brains. (B, C) The 720/670 ratios in the same neurons were compared before (vehicle) and 12 hr post 100 mg/kg DAPT administration. The 720/670 ratios were significantly decreased by DAPT administration (22.1%). N=50 neurons, Mann-Whitney U-test, **** p<0.0001.
-
Figure 2—figure supplement 2—source data 1
Uncropped and labeled gels for Figure 2—figure supplement 2A.
- https://cdn.elifesciences.org/articles/96848/elife-96848-fig2-figsupp2-data1-v1.zip
-
Figure 2—figure supplement 2—source data 2
Raw unedited gels for Figure 2—figure supplement 2A.
- https://cdn.elifesciences.org/articles/96848/elife-96848-fig2-figsupp2-data2-v1.zip
-
Figure 2—figure supplement 2—source data 3
Numerical source data for Figure 2—figure supplement 2C.
- https://cdn.elifesciences.org/articles/96848/elife-96848-fig2-figsupp2-data3-v1.xlsx
Figure 3 with 2 supplements
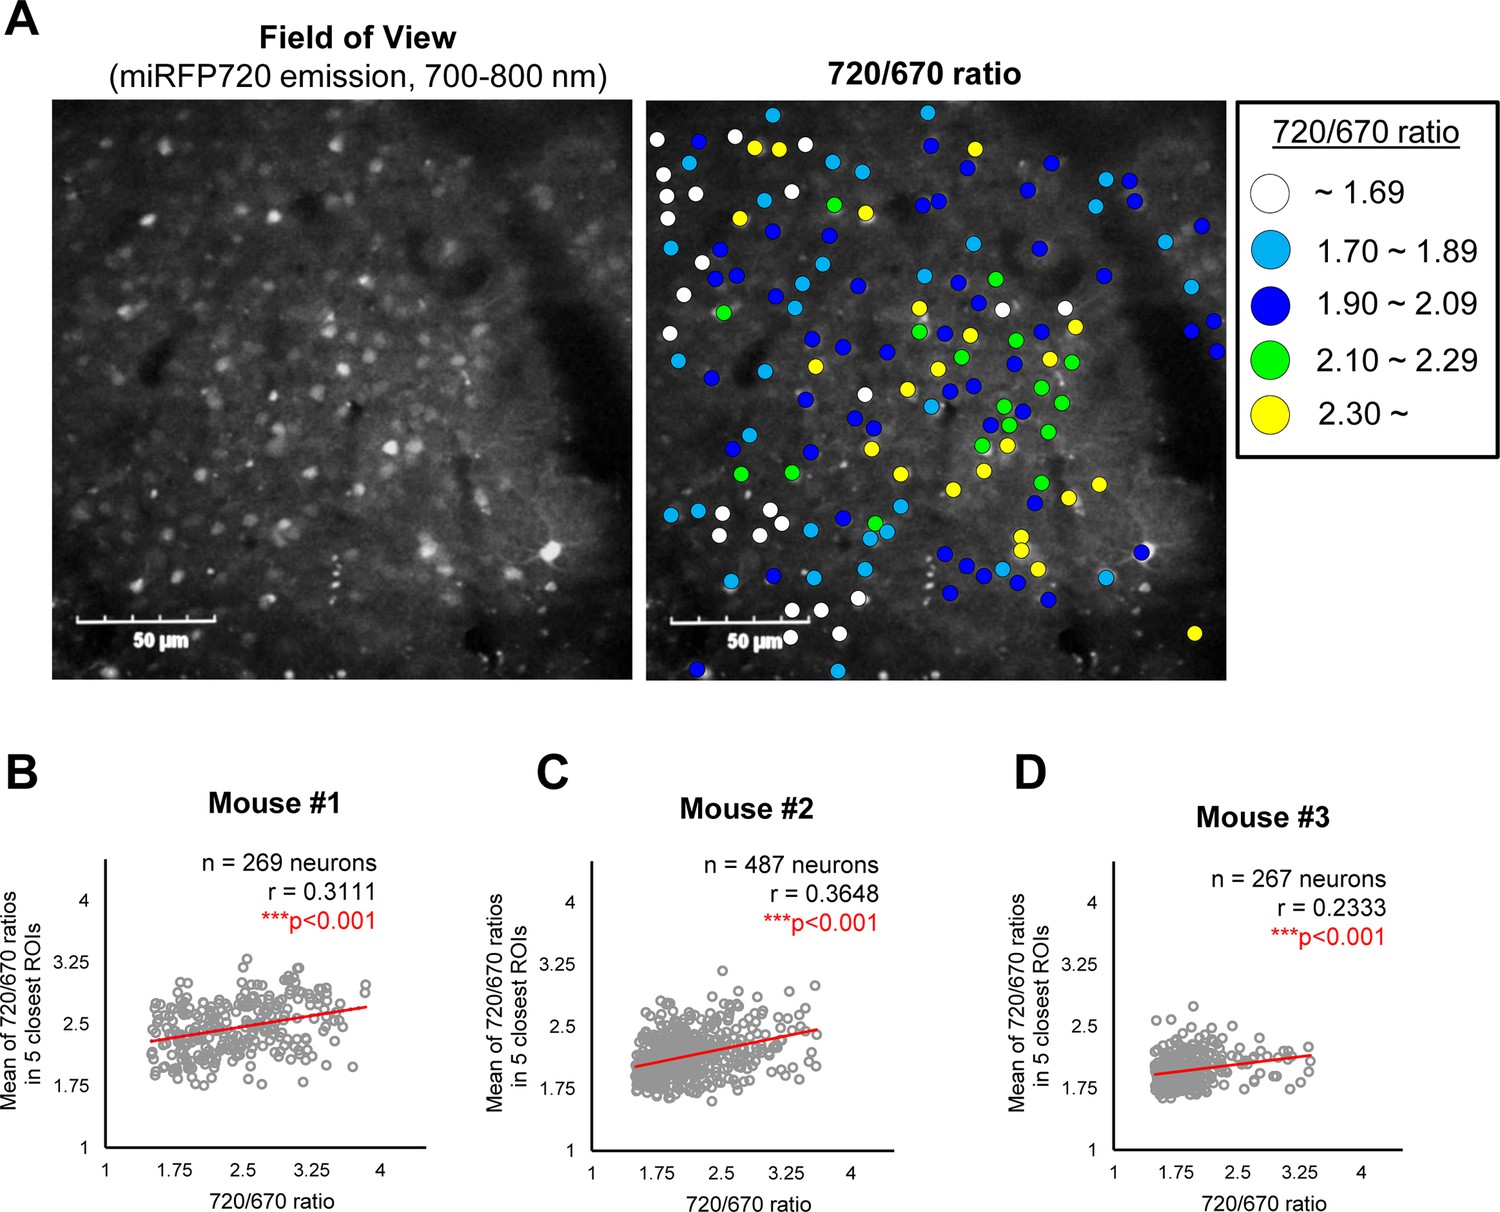
A potential ‘cell non-autonomous’ regulation of γ-secretase in live mouse brains.
(A) A representative image showing the expressions of the C99 720–670 biosensor (Field of view) and a pseudo-color image corresponding 720/670 ratios (Pseudo-color FRET). Scale bar: 50 μm. (B–D) Scatter plots showing the 720/670 ratio in individual neurons (X-axis) and the average Mean of the 720/670 ratio in five neighboring neurons in three independent mice. The number of neurons, correlation coefficient (r), and p-value are shown. Pearson correlation coefficient. *** p<0.001.
-
Figure 3—source data 1
Numerical source data for Figure 3B–D.
- https://cdn.elifesciences.org/articles/96848/elife-96848-fig3-data1-v1.xlsx
Figure 3—figure supplement 1
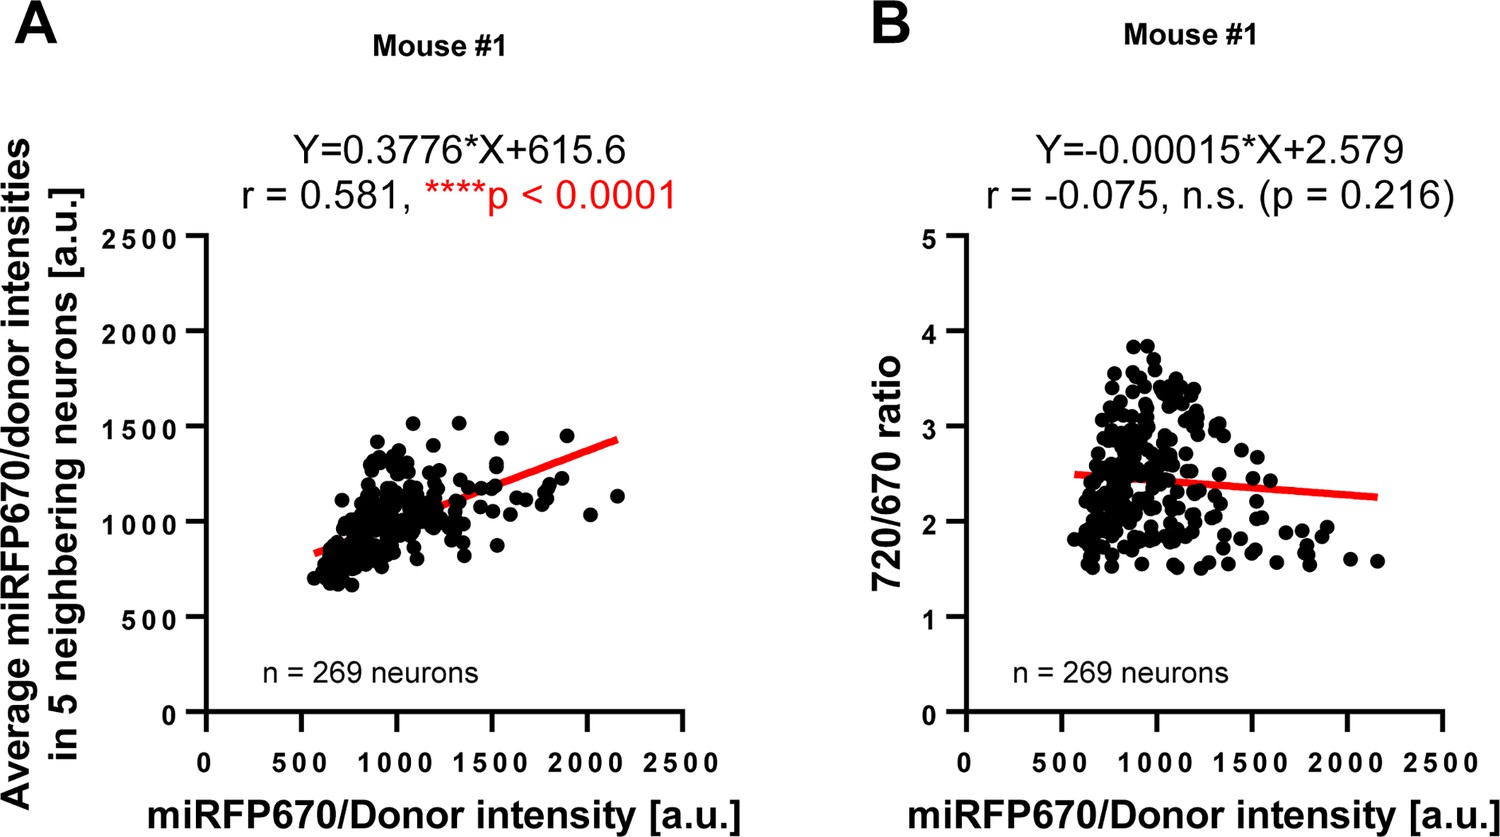
Expression pattern of the C99 720–670 biosensor.
(A) Scatter plots showing miRFP670 emission (as an indicator of the C99 720–670 biosensor expression) in individual neurons (X-axis) and the average Mean of miRFP670 emission in five neighboring neurons (Y-axis), suggesting uneven transduction of the AAV. The number of neurons, correlation coefficient (r), and p-value are shown. Pearson correlation coefficient. **** p<0.0001 (B) However, the 720/670 ratio (i.e. γ-secretase activity) is not correlated with miRFP670 fluorescence intensity (i.e. C99 720–670 biosensor expression) in individual neurons. p=0.216.
-
Figure 3—figure supplement 1—source data 1
Numerical source data for Figure 3—figure supplement 1A and B.
- https://cdn.elifesciences.org/articles/96848/elife-96848-fig3-figsupp1-data1-v1.xlsx
Figure 3—figure supplement 2
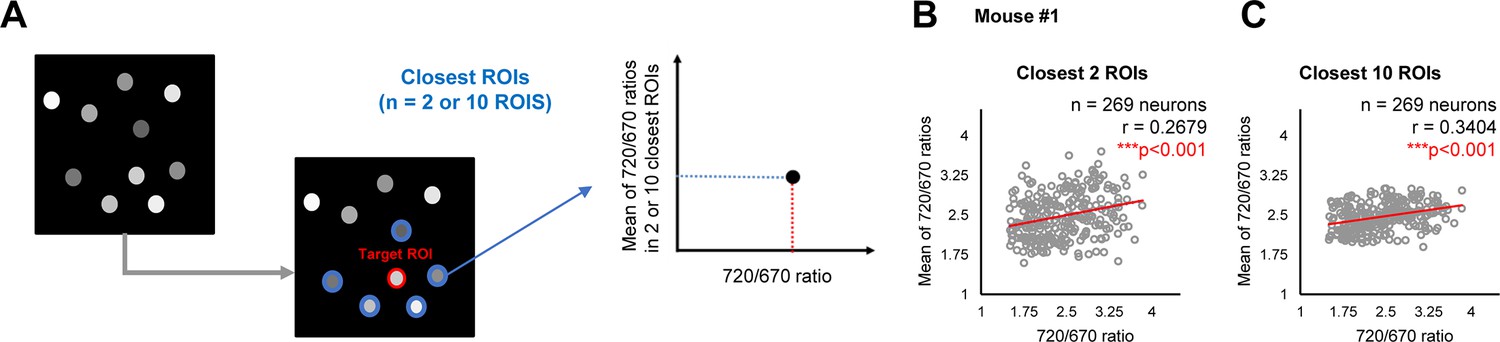
Validation #1 A potential ‘cell non-autonomous’ regulation of γ-secretase in mouse brains.
(A) The two or ten closest neurons were identified, and the average 720/670 ratio of the two or ten neighboring neurons was calculated and plotted. (B) We verified a significant positive correlation between the 720/670 ratio and the average ratio of 2 and (C) 10 closest neurons. The number of neurons, correlation coefficient (r), and p-value are shown. Pearson correlation coefficient. *** p<0.001.
-
Figure 3—figure supplement 2—source data 1
Numerical source data for Figure 3—figure supplement 2B and C.
- https://cdn.elifesciences.org/articles/96848/elife-96848-fig3-figsupp2-data1-v1.xlsx
Figure 4
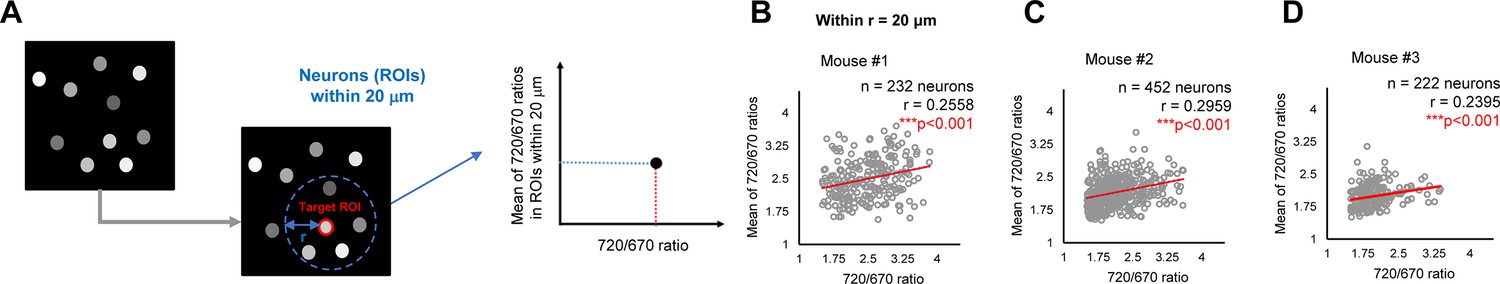
Validation #2 A potential “cell non-autonomous” regulation of γ-secretase in mouse brains.
(A) The average 720/670 ratio of neurons within a 20 μm radius was calculated and plotted. (B–D) There was a significant positive correlation between the 720/670 ratio and the average ratio of neurons within a 20 μm radius in three independent mice. The number of neurons, correlation coefficient (r), and p-value are shown. Pearson correlation coefficient. *** p<0.001.
-
Figure 4—source data 1
Numerical source data for Figure 4B–D.
- https://cdn.elifesciences.org/articles/96848/elife-96848-fig4-data1-v1.xlsx
Figure 5
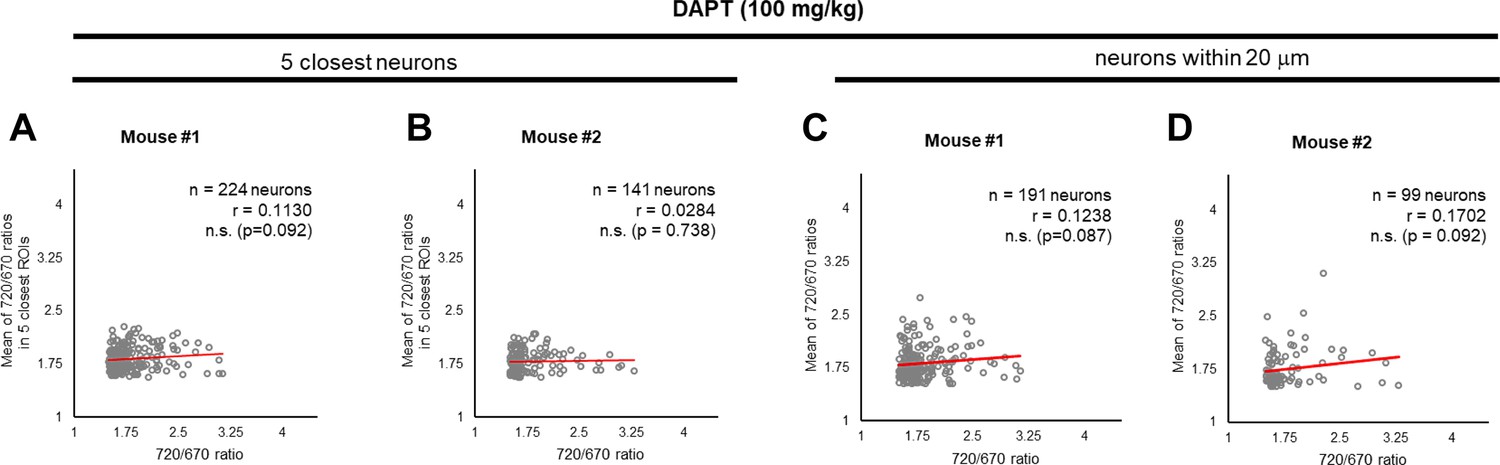
γ-Secretase inhibition cancels the ‘cell non-autonomous’ regulation.
(A, B) Neither significant correlation between the 720/670 ratio and the average ratio of five closest neurons, nor (C, D) the average ratio of neurons within a 20 μm radius was detected after administration of DAPT, a potent γ-secretase inhibitor. The number of neurons, correlation coefficient (r), and p-value are shown. Pearson correlation coefficient. n.s. not significant.
-
Figure 5—source data 1
Numerical source data for Figure 5A–D.
- https://cdn.elifesciences.org/articles/96848/elife-96848-fig5-data1-v1.xlsx
Author response image 1
Additional files
Download links
A two-part list of links to download the article, or parts of the article, in various formats.
Downloads (link to download the article as PDF)
Open citations (links to open the citations from this article in various online reference manager services)
Cite this article (links to download the citations from this article in formats compatible with various reference manager tools)
Recording γ-secretase activity in living mouse brains
eLife 13:RP96848.
https://doi.org/10.7554/eLife.96848.3


