Task-dependent coarticulation of movement sequences
- Institute for Information and Communication Technologies, Electronics and Applied Mathematics (ICTEAM), Université Catholique de Louvain, Belgium
- Institute of Neuroscience (IoNS), Université Catholique de Louvain, Belgium
- WEL Research Institute, Belgium
Figures
Figure 1
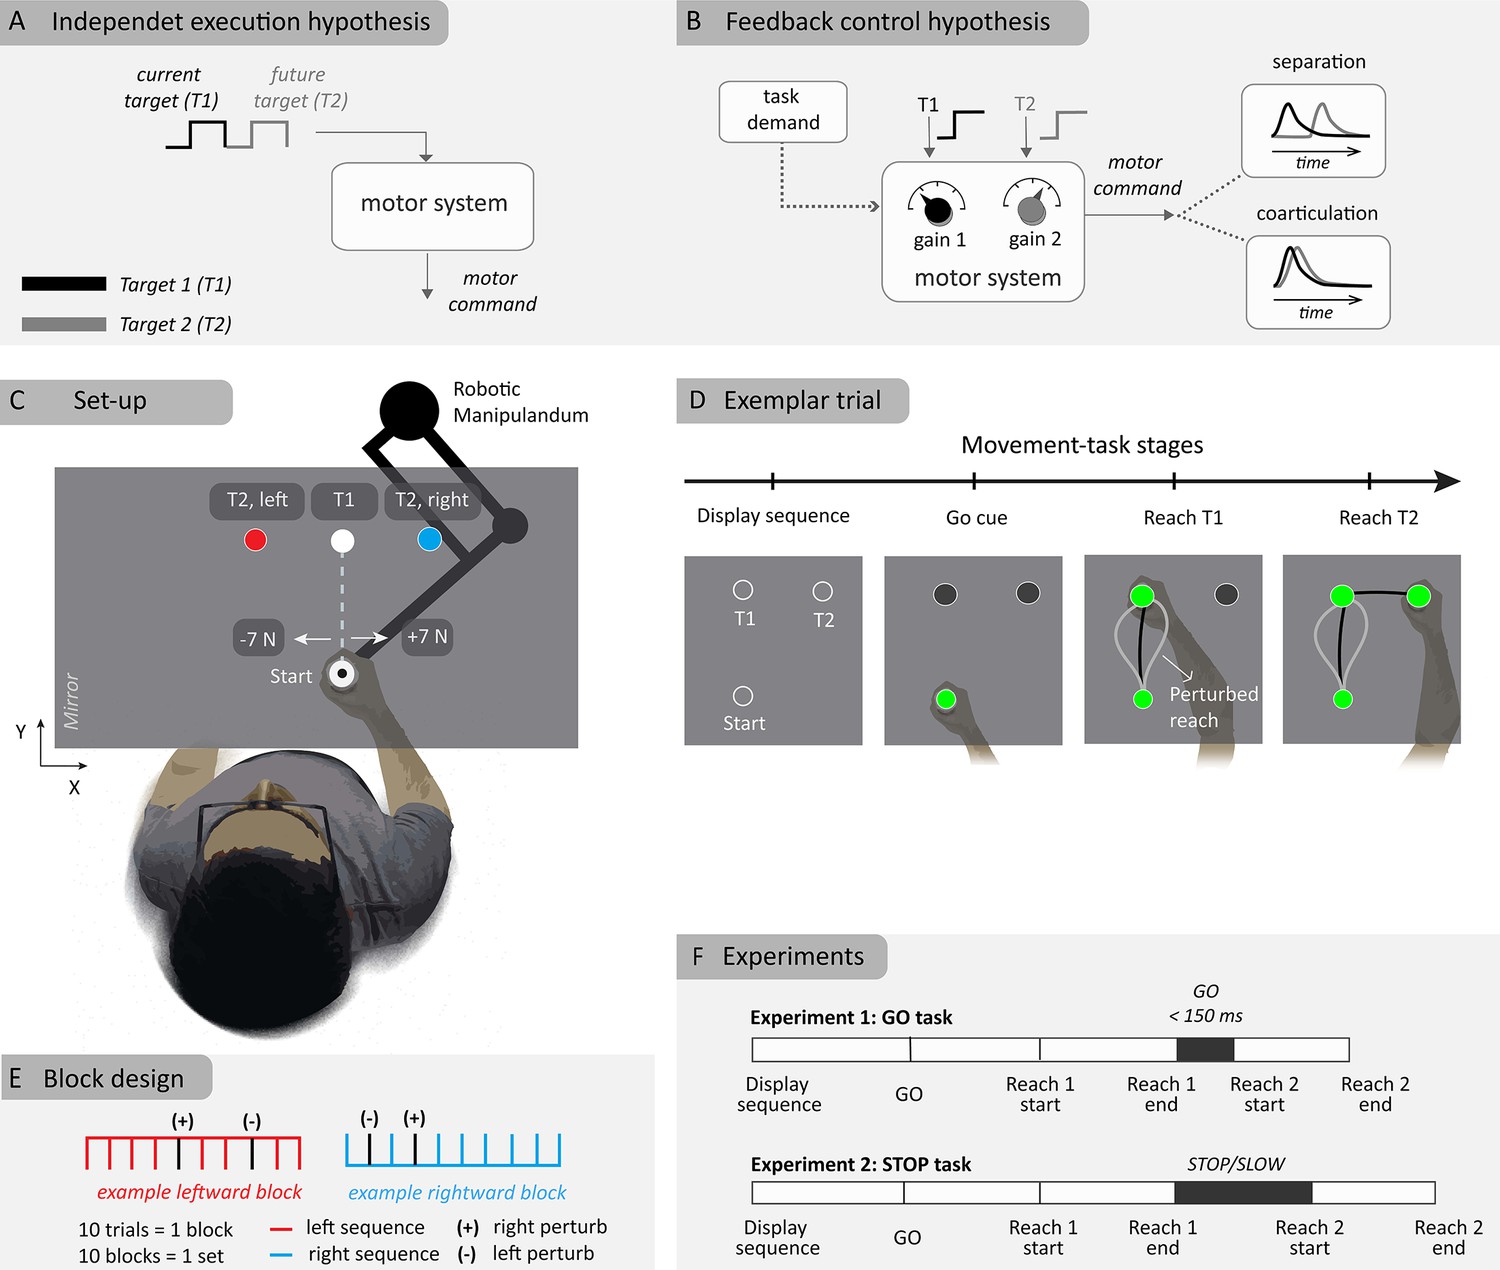
Schematic illustration of hypotheses and experiment method.
(A) Independent control hypothesis where each target is specified one at a time onto the controller. (B) Flexible feedback control hypothesis where multiple targets are simultaneously considered. (C) Experimental setup of two-reach sequences with two different second targets (T2) sharing the first target (T1). Perturbations of 7 N magnitude (rightward or leftward) were applied close to the start location. (D) Sequence of events in a typical (example) trial. (E) Block design where the right, left-target blocks are randomly interleaved within a set where each block consist of eight unperturbed and two perturbed trials. (+) and (-) represent the direction of applied loads in perturbation trials (F) Experiment protocol for the ‘GO’ and ‘STOP’ tasks, with differing demands at the first target.
Figure 2 with 4 supplements
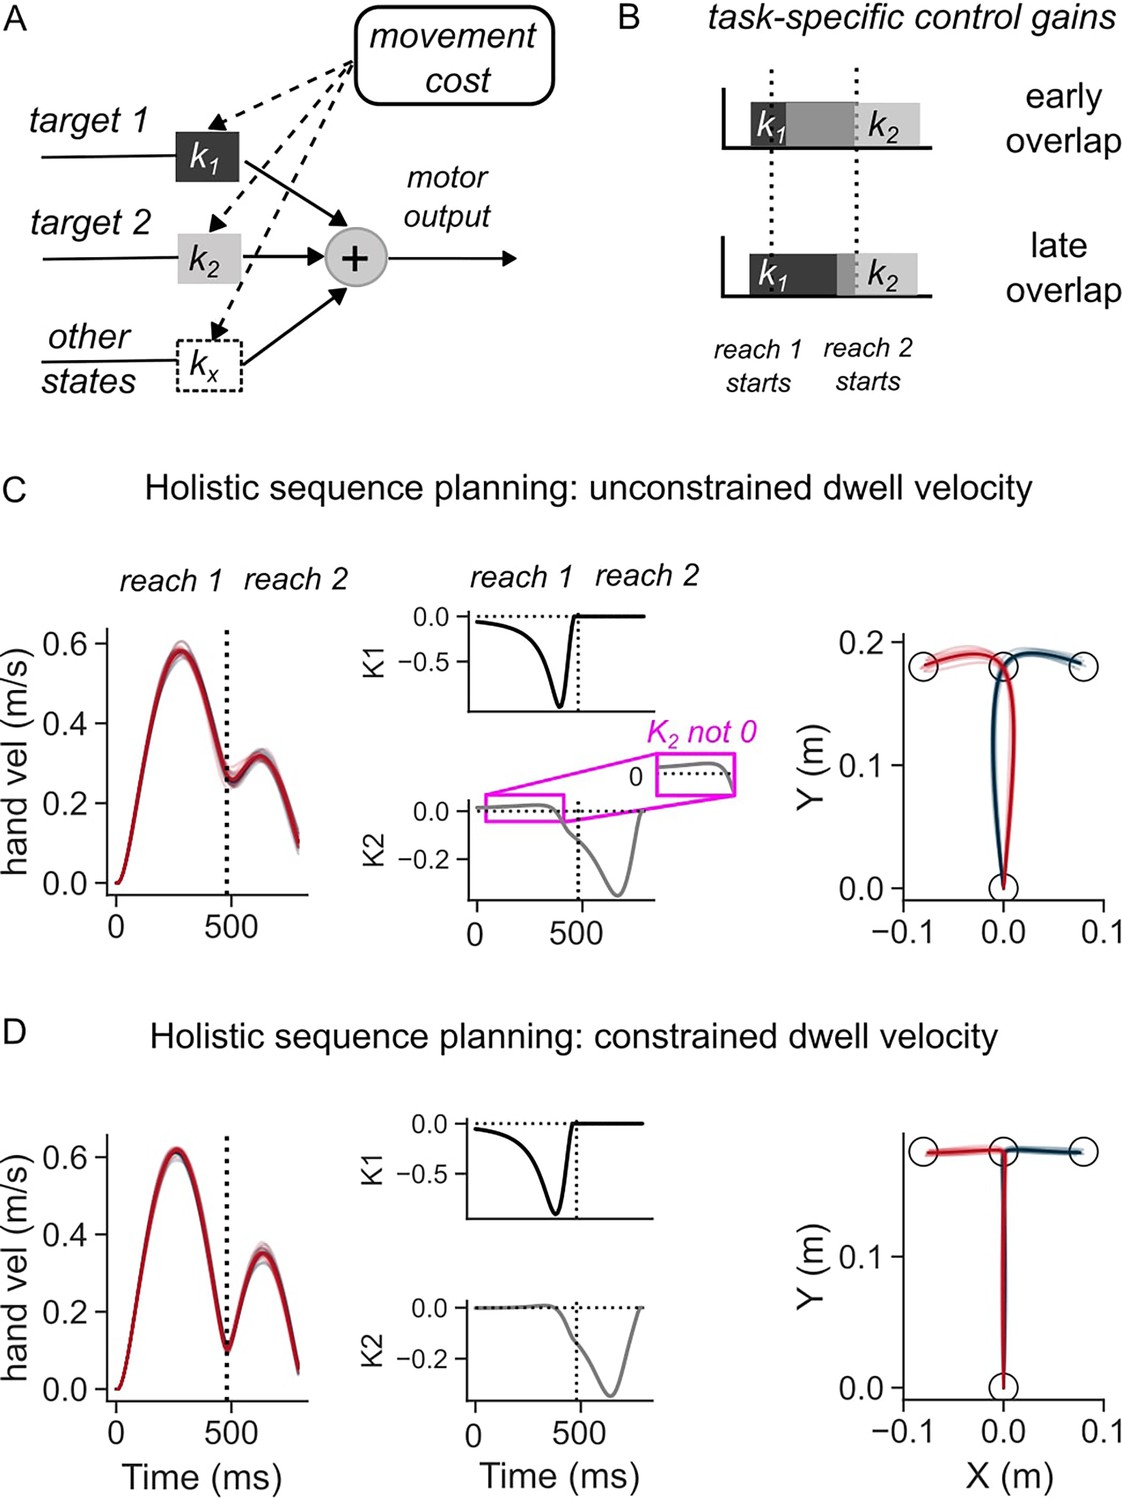
Simulations of the optimal feedback control (OFC) model in two-reaches sequence task.
(A) Schematic illustration of the feedback control policy. Targets influence motor output through control gains, which are themselves derived by minimizing movement costs. (B) Illustration of how overlap of control gains can explain coarticulated reaches (top panel), and late influence of second target on first reach (middle). (C) Hand speed (left), control gains corresponding to the two targets (middle), and hand path (middle) when dwell velocity at target 1 was not constrained. (D) Same as (C) except the dwell velocity was penalized.
Figure 2—figure supplement 1
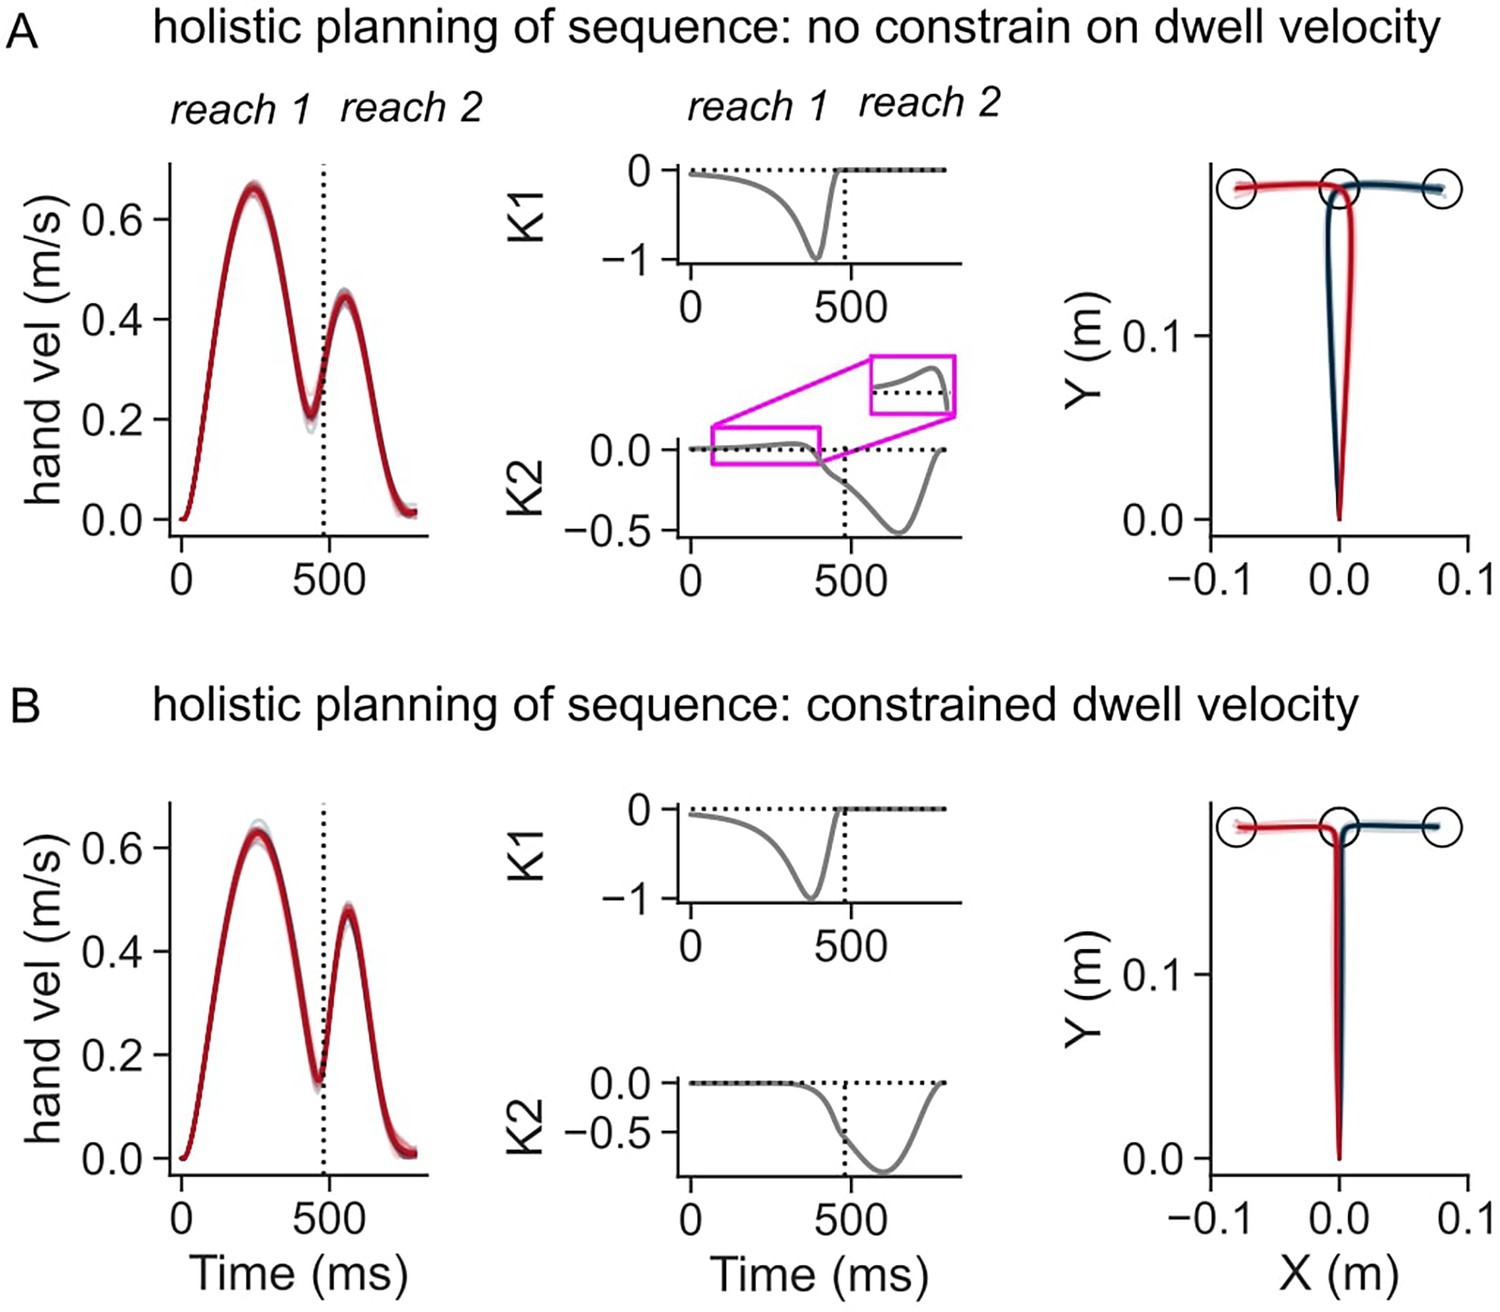
Simulations of the optimal feedback control (OFC) model in two-reaches sequence tasks using temporal buildup costs.
(A) Hand speed (left), control gains corresponding to the two targets (middle), and hand path (middle) when dwell velocity at target 1 was not constrained. (B) Same as (A) except the dwell velocity was penalized.
Figure 2—figure supplement 2
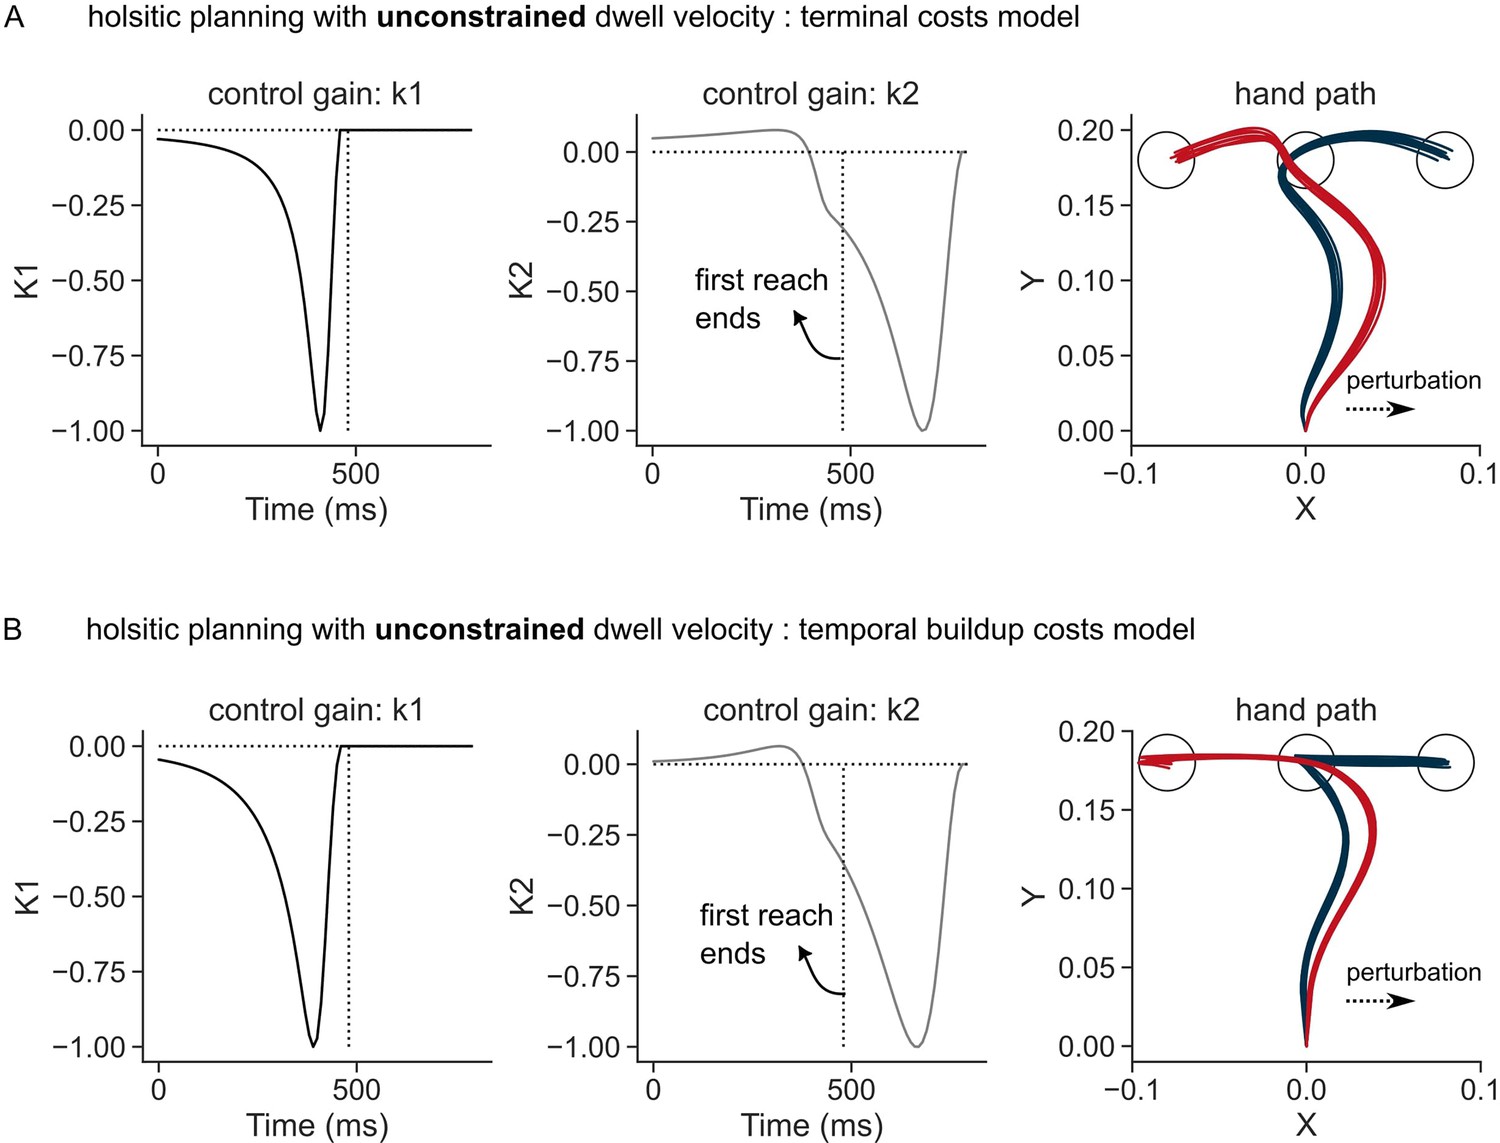
Simulated perturbation trials when the whole sequence was planned for with no constraints on dwell velocity at the first target.
(A) Control gains corresponding to the position errors relative to T1 (left column), control gains corresponding to T2 (middle column), and the perturbed hand path, when a sudden load (+4 N) was applied in the rightward direction (right column) simulated using terminal costs. (B) Same as (A) where simulations used buildup costs, leading to a straighter hand path in the beginning of the movement. Each curve in the hand path represents a single trial.
Figure 2—figure supplement 3
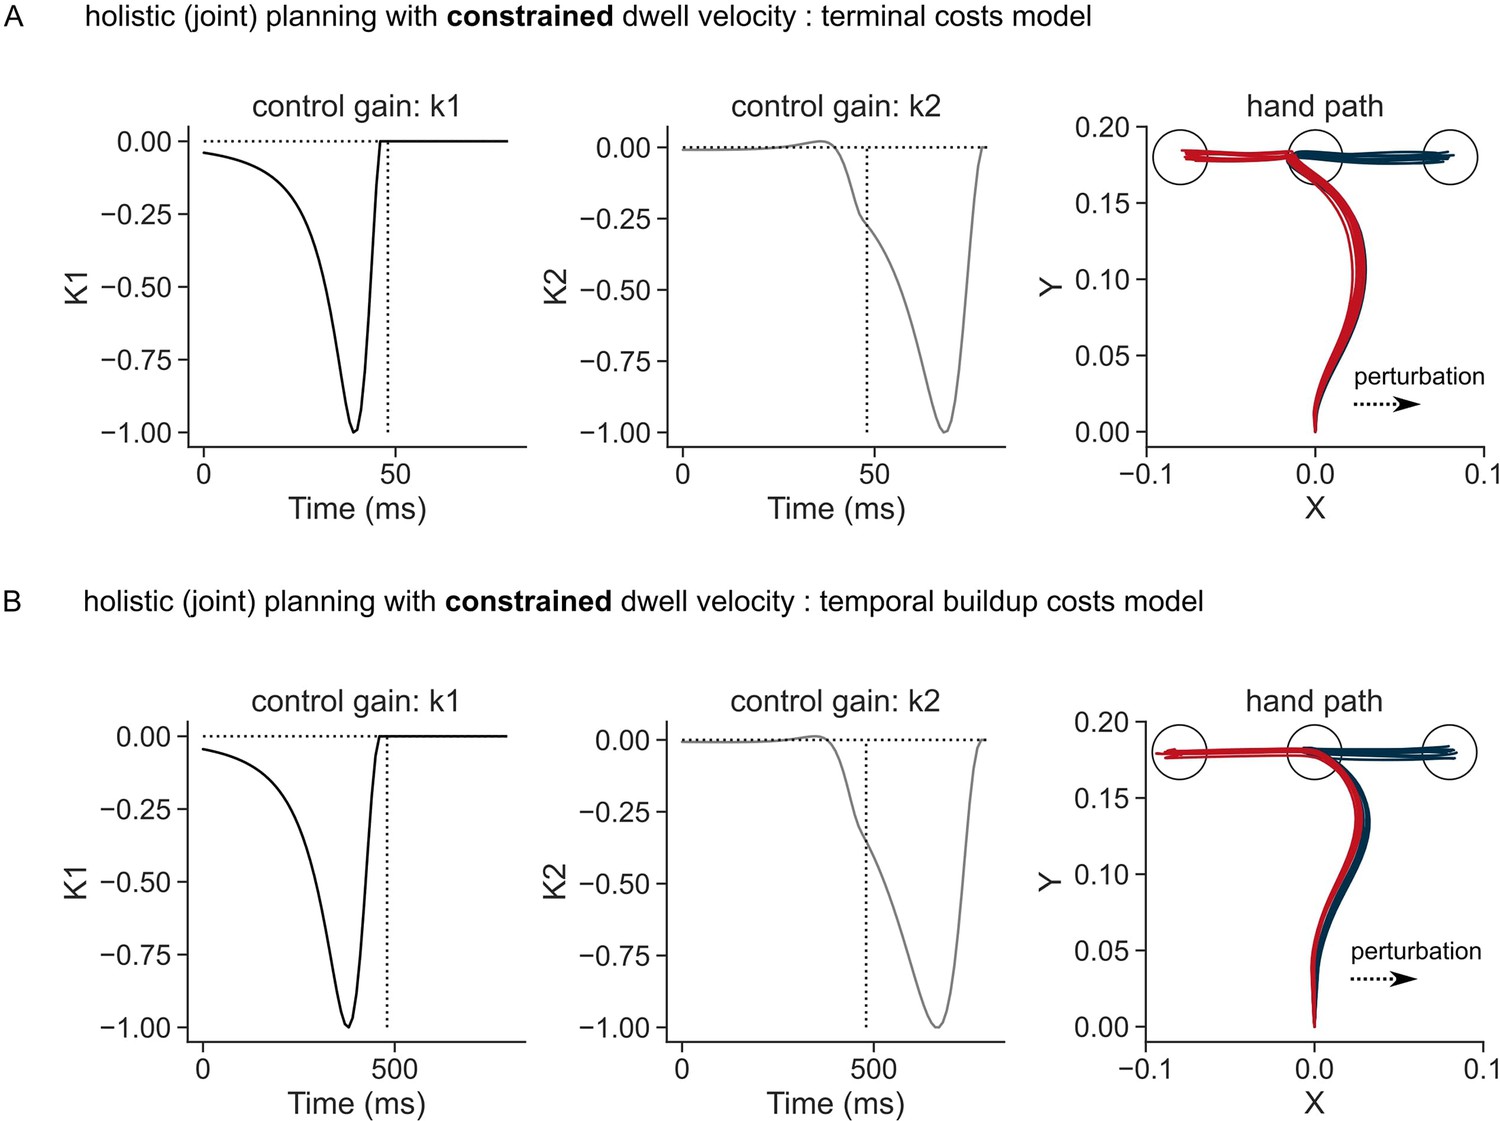
Simulated perturbation trials when the whole sequence was planned for but with a constraint on dwell velocity at the first target.
(A) control gains corresponding to the position errors relative to T1 (left column), control gains corresponding to T2 (middle column), and the perturbed hand path when a sudden load (+4 N) was applied in the rightward direction (right column) simulated using terminal costs. (B) Same as (A) where simulations used buildup costs, leading to a straighter hand path in the beginning of the movement. Each curve in the hand path represents a single trial.
Figure 2—figure supplement 4
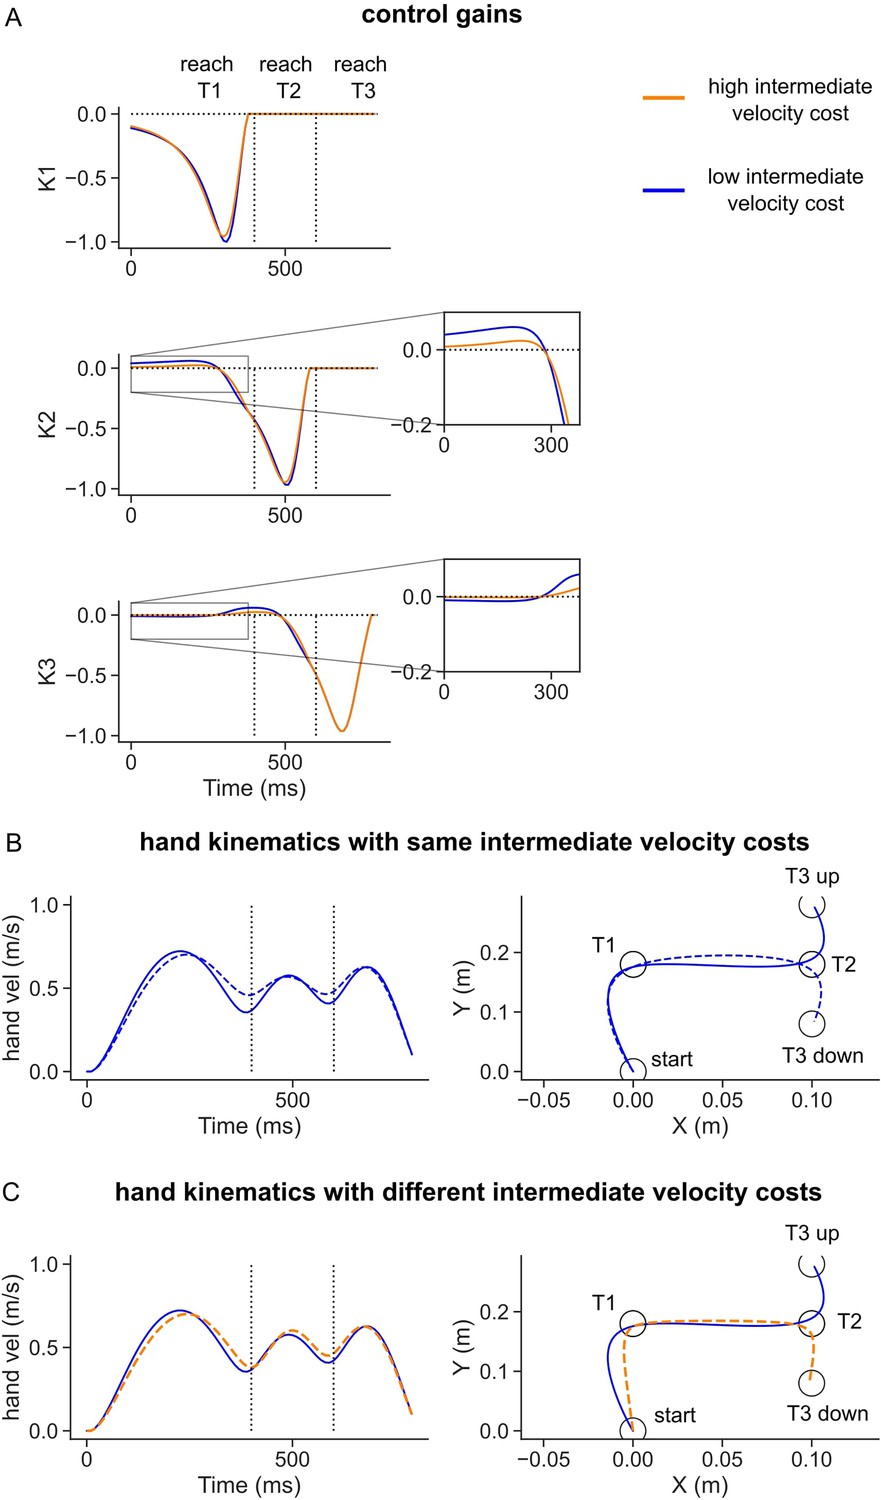
Simulations with two different values of intermediate (dwell) velocity cost parameters.
(A) Control gain across time and change in the intermediate velocity cost. (B) Simulated hand velocity (left panel) and hand path (right panel) when the same intermediate velocity costs were considered for both final targets (T3 up and T3 down). (C) Simulated hand velocity and path when the intermediate velocity cost was changed between two sequences. Blue curves had the lowest cost on the intermediate velocity of = = 0.0, followed by orange curves with = = 0.8.
Figure 3 with 1 supplement
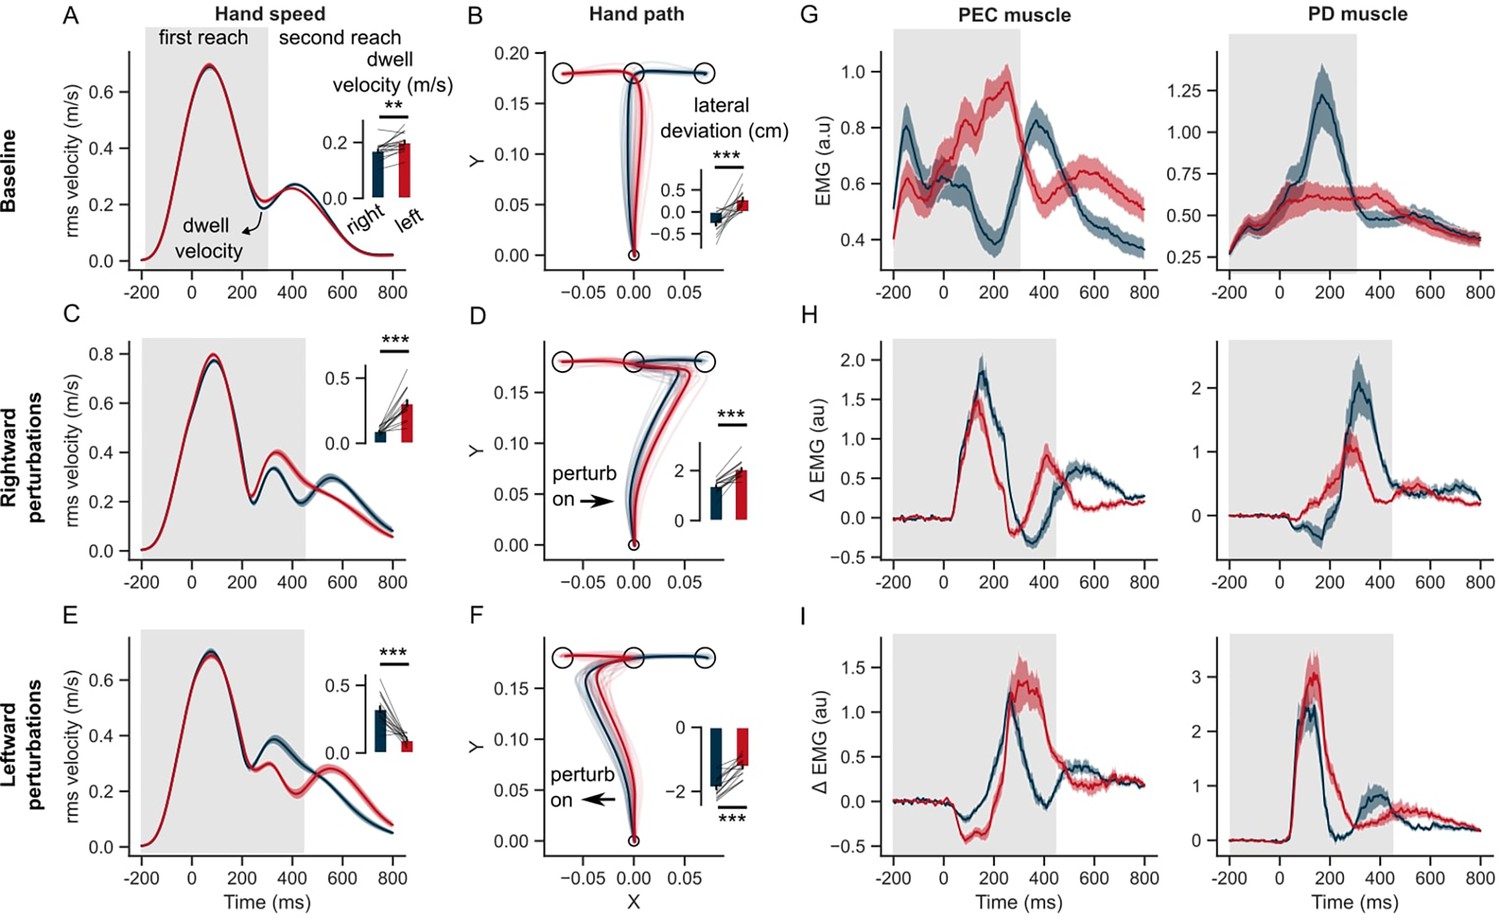
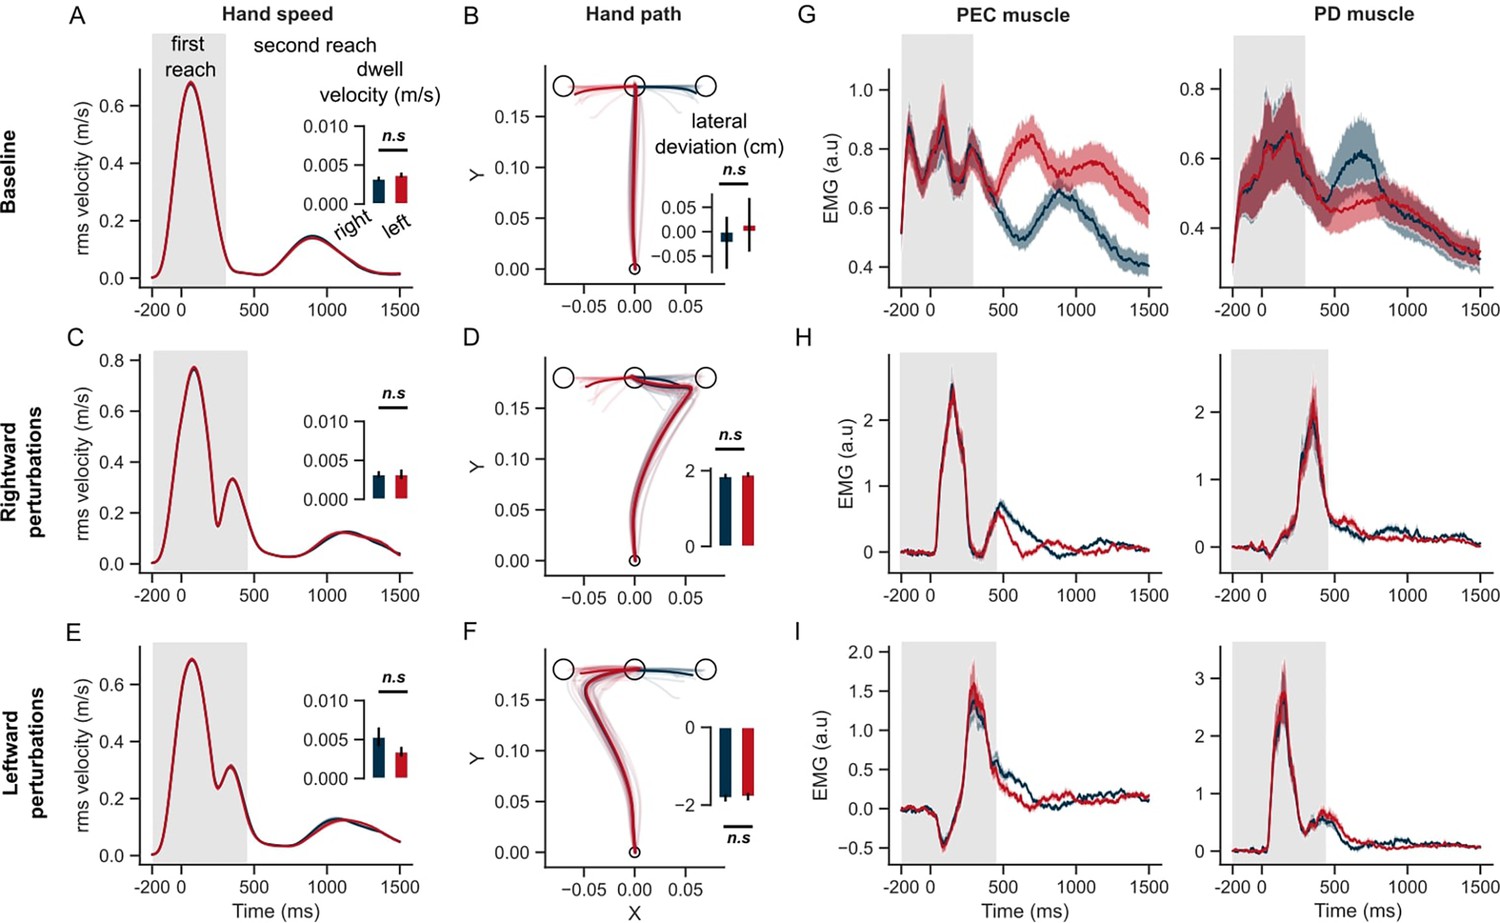
Hand kinematics in the GO task (experiment 1).
(A) Hand speed and (B) hand path in unperturbed baseline trials. (C, E) Same as (A) but for perturbation trials. (D, F) Same as (B) but for perturbation trials. (G) Baseline EMG response of pectorialis major (PEC) and posterior deltoid (PD) muscles. (H) Perturbation response (baseline subtracted) of PEC and PD muscle during rightward and (I) leftward perturbations. Light curves in the hand path panels are the average paths of individual participants. Shaded area around the average curves represent the standard error (±sem) across participants around the mean. Gray colored box indicates the average duration of the first reach. Red and blue colors correspond to reaches made towards left and right second targets, respectively. t=0 ms represents the time of perturbation onset. *p<0.05, **p<0.005, ***p<0.001.
Figure 3—figure supplement 1
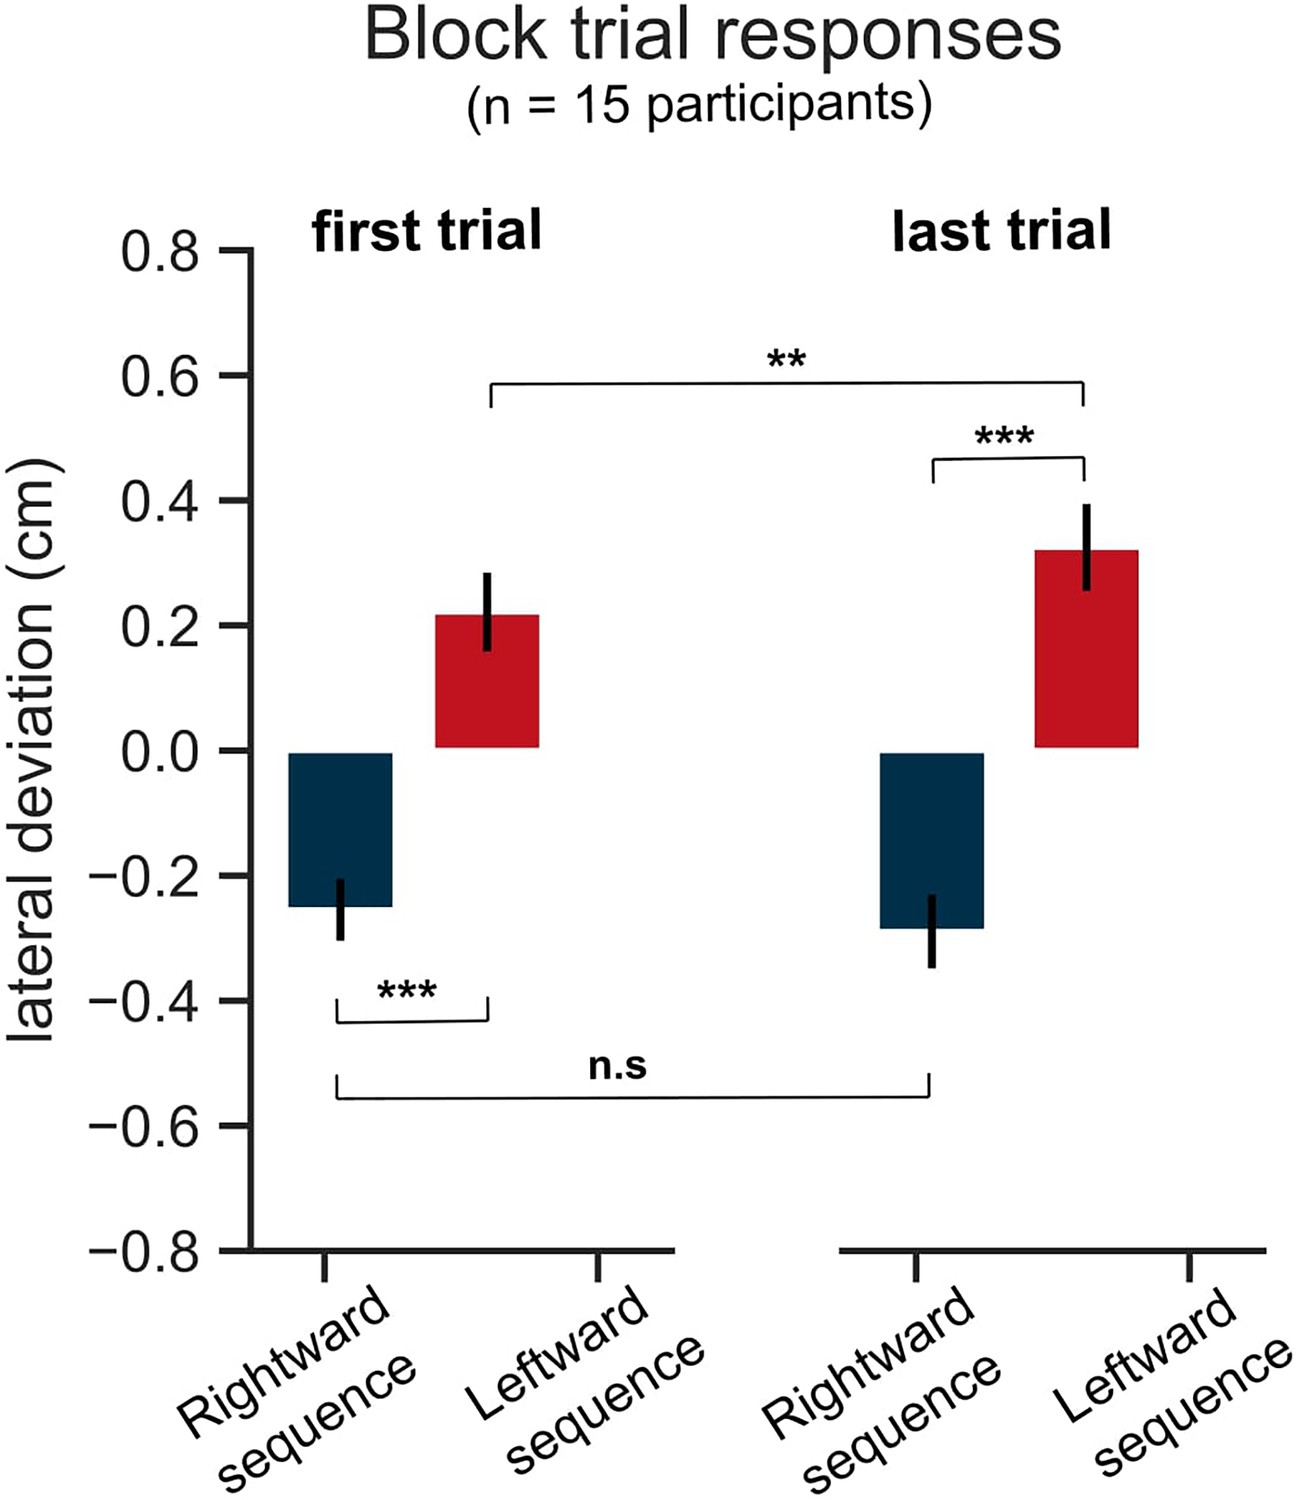
Comparison between first and last (eighth) unperturbed trials of a block, averaged across blocks of each participant in the GO task (Experiment 1).
Red color represents leftward sequence condition and blue color represents rightward sequence condition. Error bars represent ±1 SEM. ***p< 0.0005, **p< 0.005, n.s for p>0.05 after correcting for multiple comparisons using Holm-Bonferroni method.
Figure 4
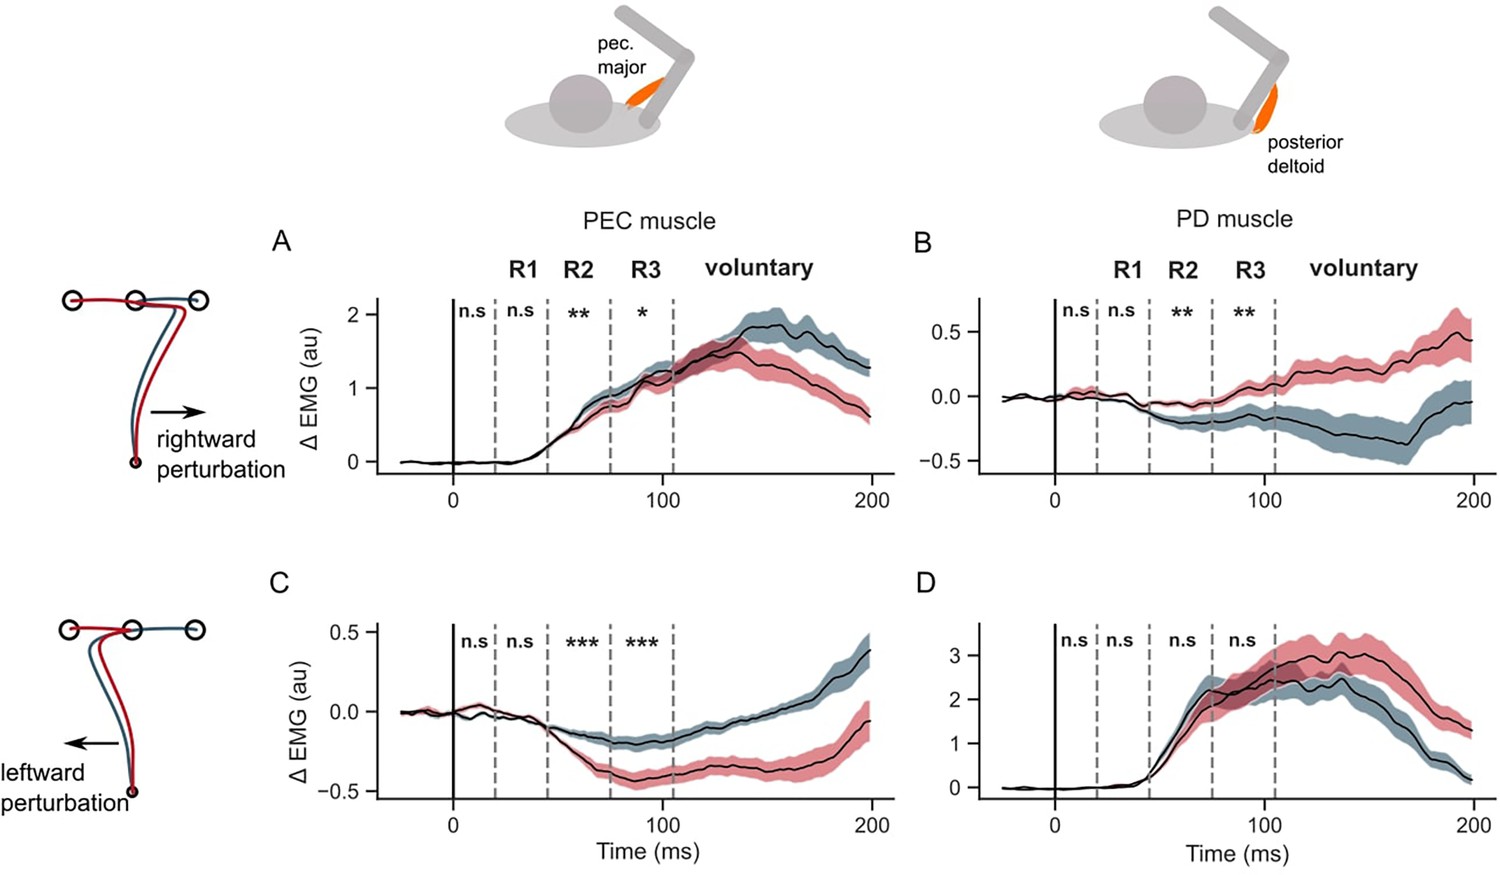
EMG perturbation responses in the GO task (Experiment 1).
(A) Pectorialis major (PEC) muscle response to a rightward perturbation. (B) Posterior deltoid (PD) muscle response to a rightward perturbation. (C) PEC muscle response to a leftward perturbation. (D) PD muscle response to a leftward perturbation. Red and blue colors represent sequences to leftward and rightward second targets, respectively. Shaded area represents the standard error (±1 SEM) across participants around mean. All traces were aligned to perturbation onset. t=0 ms indicates the time of perturbation onset. *p<0.05, **p<0.005, ***p<0.001 and n.s indicates non-significant effects of one-tailed t-test with p>0.05.
Figure 5
Hand kinematics in the STOP task (experiment 2).
(A) Hand speed and (B) hand path in unperturbed baseline trials. (C, E) Same as (A) but for perturbation trials. (D, F) Same as (B) but for perturbed trials. (G) Baseline EMG response of pectorialis major (PEC) and posterior deltoid (PD) muscles. (H) Perturbation response (baseline subtracted) of PEC and PD muscle during rightward and (I) leftward perturbations. Light curves in hand path panels are average paths of individual participants. Shaded area around the average curves represent the standard error (±sem) across participants around the mean. Gray colored box indicates the average duration of the first reach. Red and blue colors correspond to reaches made towards left and right second targets, respectively. t=0 ms represents the time of perturbation onset. *p<0.05, **p<0.005, ***p<0.001.
Figure 6
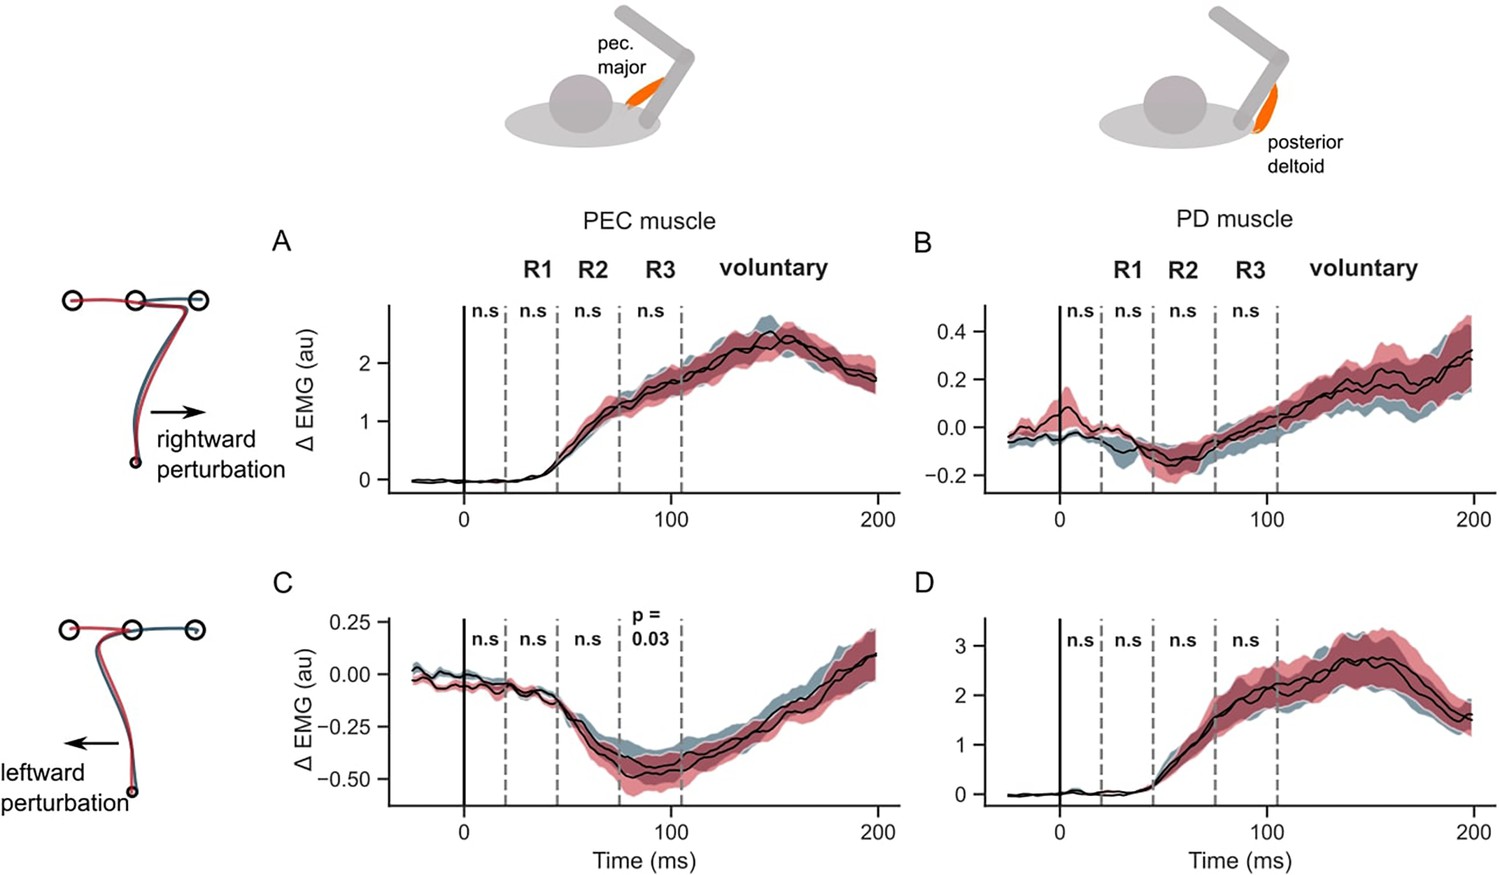
EMG perturbation responses in the STOP task (Experiment 2).
(A) Pectorialis major (PEC) muscle response to a rightward perturbation. (B) Posterior deltoid (PD) muscle response to a rightward perturbation. (C) PEC muscle response to a leftward perturbation. (D) PD muscle response to a leftward perturbation. Red and blue colors represent sequences to leftward and rightward second targets, respectively. Shaded area represents the standard error (±1 SEM) across participants around mean. All traces were aligned to perturbation onset. t=0 ms indicates the time of perturbation onset. n.s indicates non-significant effects of one-tailed t-test with p>0.05.
Author response image 1

Impact of movement costs (motor effort and intermediate goal reach errors) on the hand path following a mechanical perturbation.
Additional files
Download links
A two-part list of links to download the article, or parts of the article, in various formats.
Downloads (link to download the article as PDF)
Open citations (links to open the citations from this article in various online reference manager services)
Cite this article (links to download the citations from this article in formats compatible with various reference manager tools)
Task-dependent coarticulation of movement sequences
eLife 13:RP96854.
https://doi.org/10.7554/eLife.96854.3


