Drosophila medulla neuroblast termination via apoptosis, differentiation, and gliogenic switch is scheduled by the depletion of the neuroepithelial stem cell pool
- Peter MacCallum Cancer Centre, Australia
- Department of Anatomy and Physiology, The University of Melbourne, Australia
- Sir Peter MacCallum Department of Oncology, The University of Melbourne, Australia
Figures
Figure 1 with 2 supplements
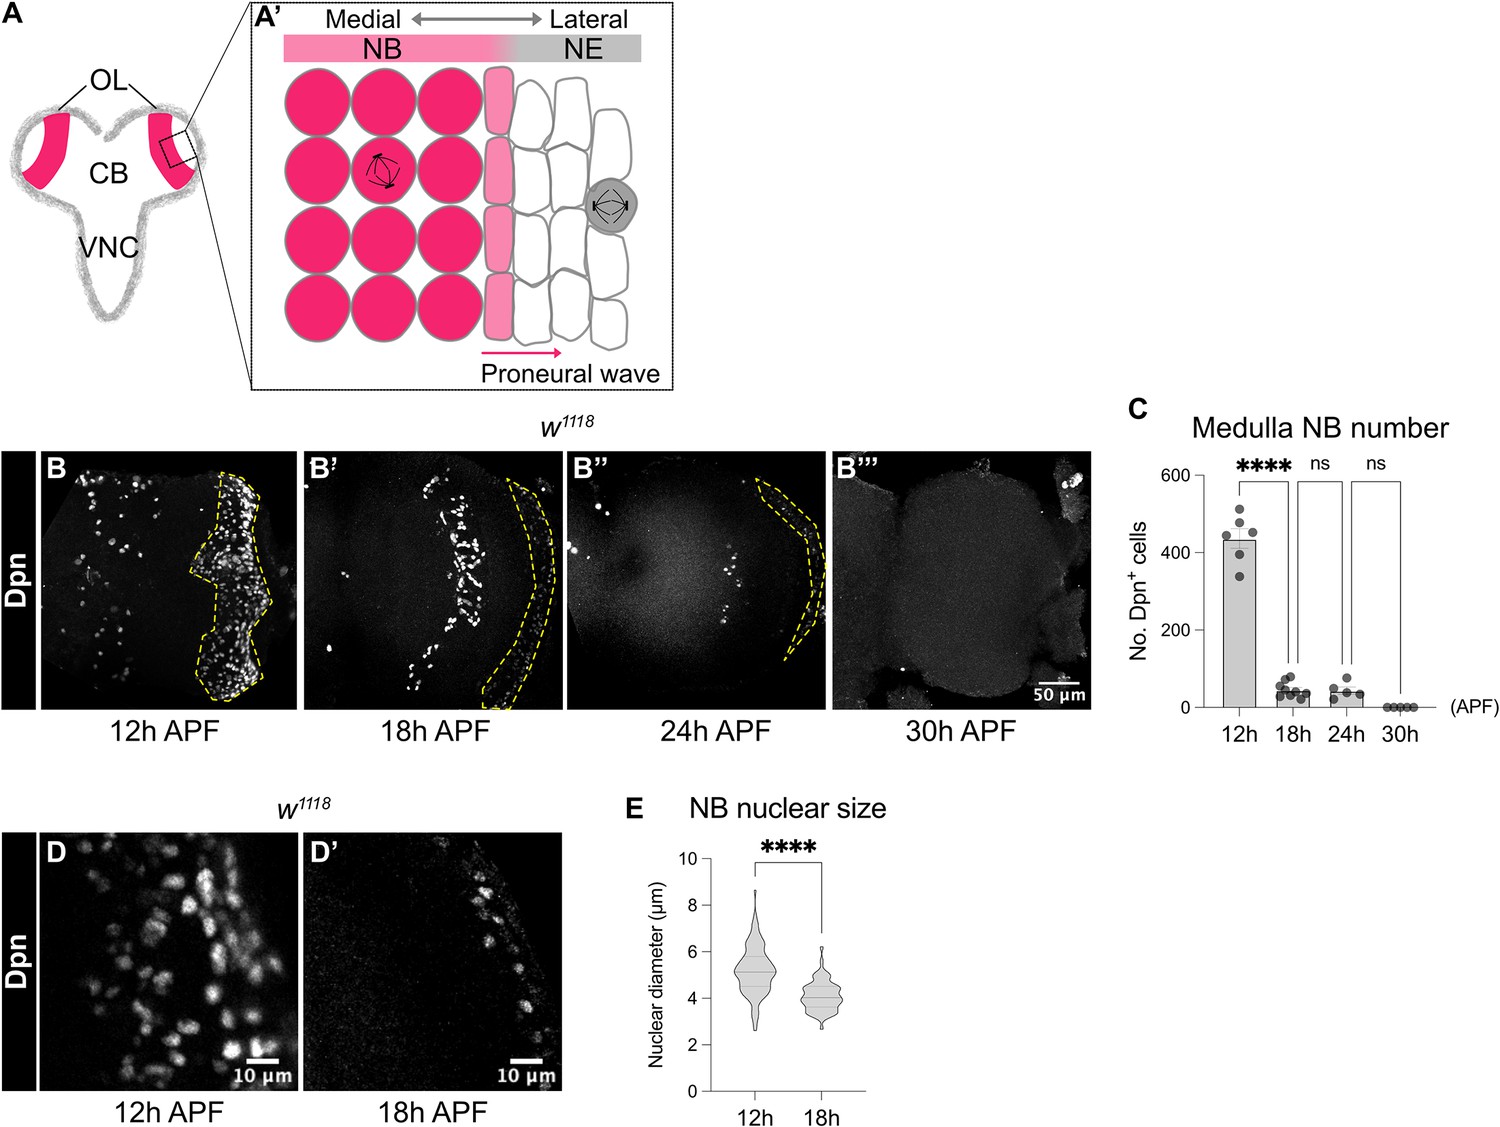
Medulla NBs are terminated during early pupal development.
(A-A’) Schematic depicting the larval CNS that is consisted of three main regions: the central brain (CB), the ventral nerve cord (VNC) and the optic lobe (OL). Box area indicates inset shown in A’. (A’) The superficial section of the outer proliferation centre (OPC) of the OL. Here, NE cells first symmetrically divide to self-renew. At mid-larval development, a proneural wave is initiated and travels from the medial to lateral of the NE. At the front of the proneural wave, NE cells differentiate into NBs and switch to asymmetric cell division for neurogenesis. (B-B’’’) Representative maximum projections of the wildtype (w1118) OL. The number of medulla NBs marked by Dpn (dashed lines), gradually reduces from 12 hr to 30 hr APF. Medulla NBs completely disappear at 30 hr APF. (C) Quantification of the number of medulla NBs at 12 hr, 18 hr, 24 hr, and 30 hr APF in the wildtype OLs. One-way ANOVA and Holm-Šídák’s multiple comparisons tests: ****p<0.0001. 12 hr: n=6, m=436 ± 25.2. 18 hr: n=9, m=45.2 ± 6.62. 24 hr: n=5, m=43.6 ± 9.26. 30 hr: n=5, m=0.00 ± 0.00. (D-D’) Representative single confocal sections of the wildtype OL. The nuclear size of medulla NBs marked by Dpn decreases from 12 hr to 18 hr APF. (E) Quantification of the nuclear diameters of medulla NBs at 12 hr and 18 hr APF. Mann-Whitney test: ****p<0.0001. 12 hr: n=109 cells, m=5.18 ± 0.099 μm. 18 hr: n=61 cells, m=4.10 ± 0.082 μm.
Figure 1—figure supplement 1
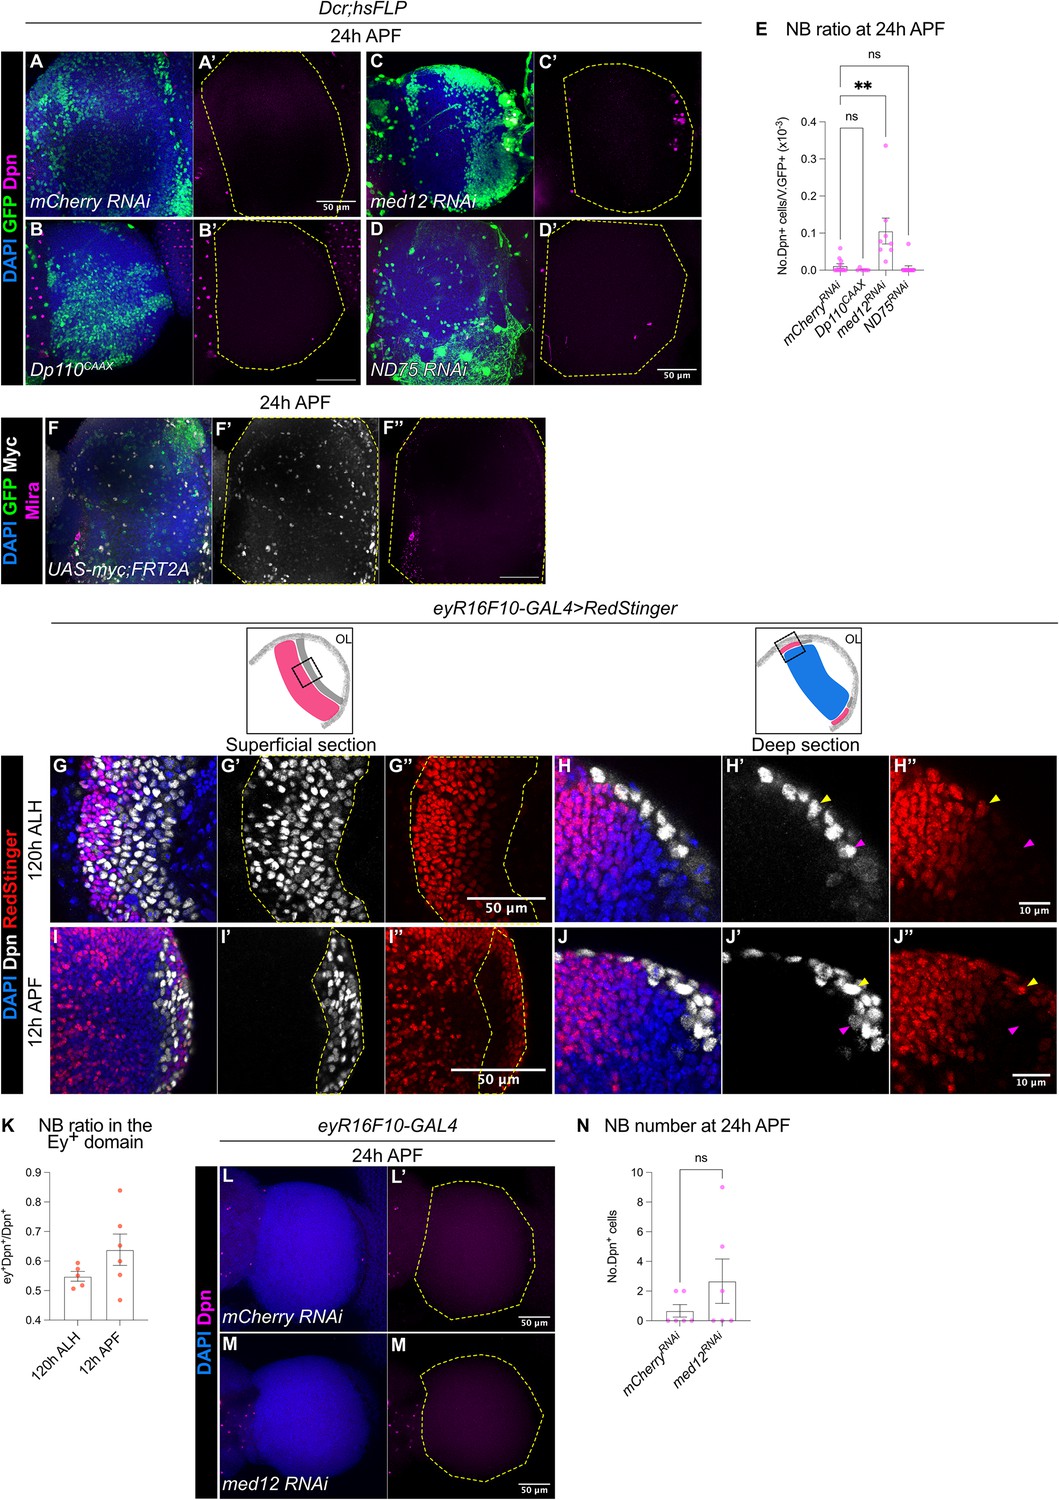
The termination of medulla NBs does not require cell growth, the Mediator complex and OxPhos.
(A–D) Representative maximum projections of the OLs (dashed lines) at 24 hr APF in which hsFLP clones are induced with (A-A’) UAS-mCherry RNAi, (B-B’) UAS-Dp110CAAX, (C-C’) UAS-med12 RNAi, and (D-D’) UAS-ND75 RNAi. DAPI (blue), GFP clones (green), Dpn (magenta). (E) Quantification of the NB ratio within hsFLP clones induced with UAS-mCherry RNAi, UAS-Dp110CAAX, UAS-med12 RNAi, UAS-ND75 RNAi in the OLs at 24 hr APF. Kruskal-Wallis test and Dunn’s test for multiple comparison: (ns) p>0.9, **p=0.002. mCherry RNAi: n=11, m=0.012 ± 0.006. Dp110CAAX: n=6, m=0.001 ± 0.001. med12 RNAi: n=8, m=0.106 ± 0.035. ND75 RNAi: n=12, m=0.006 ± 0.006. (F-F’’) Representative maximum projection of the OL (dashed lines) at 24 hr APF in which MARCM clones are induced with UAS-myc. DAPI (blue), GFP (green), Myc (grey), Mira (magenta). (G, I) Representative maximum projections of the OLs at (G-G’’) 120 hr ALH and (I-I’’) 12 hr APF in the superficial section. Dashed lines outline medulla NBs marked by Dpn (grey). DAPI (blue), RedStinger (red) driven by eyR16F10-GAL4. (H, J) Representative single confocal sections of the OLs at (H-H’’) 120 hr ALH and (J-J’’) 12 hr APF in the deep section. Yellow arrowheads indicate NBs (marked by Dpn, in grey) which also express RedStinger driven by eyR16F10-GAL4, magenta arrows indicate NBs devoid of RedStinger expression. (K) Quantifications of the ratio of NBs expressing eyR16F10-GAL4 out of the total number of medulla NBs at 120 hr ALH and 12 hr APF. 120 hr ALH: n=5, m=0.548 ± 0.016. 12 hr APF: n=6, m=0.638 ± 0.053. (L–M) Representative maximum projections of the OLs (dashed lines) at 24 hr APF where eyR16F10-GAL4 drives (L-L’) UAS-mCherry RNAi and (M-M’) UAS-med12 RNAi. DAPI (blue), Dpn (magenta). (N) Quantifications of NB numbers in the OLs at 24 hr APF with eyR16F10-GAL4 driving UAS-mCherry RNAi and UAS-med12 RNAi. Mann-Whitney test: (ns) P=0.450. mCherry RNAi: n=6, m=0.667 ± 0.422. med12 RNAi: n=6, m=2.67 ± 1.50.
Figure 1—figure supplement 2
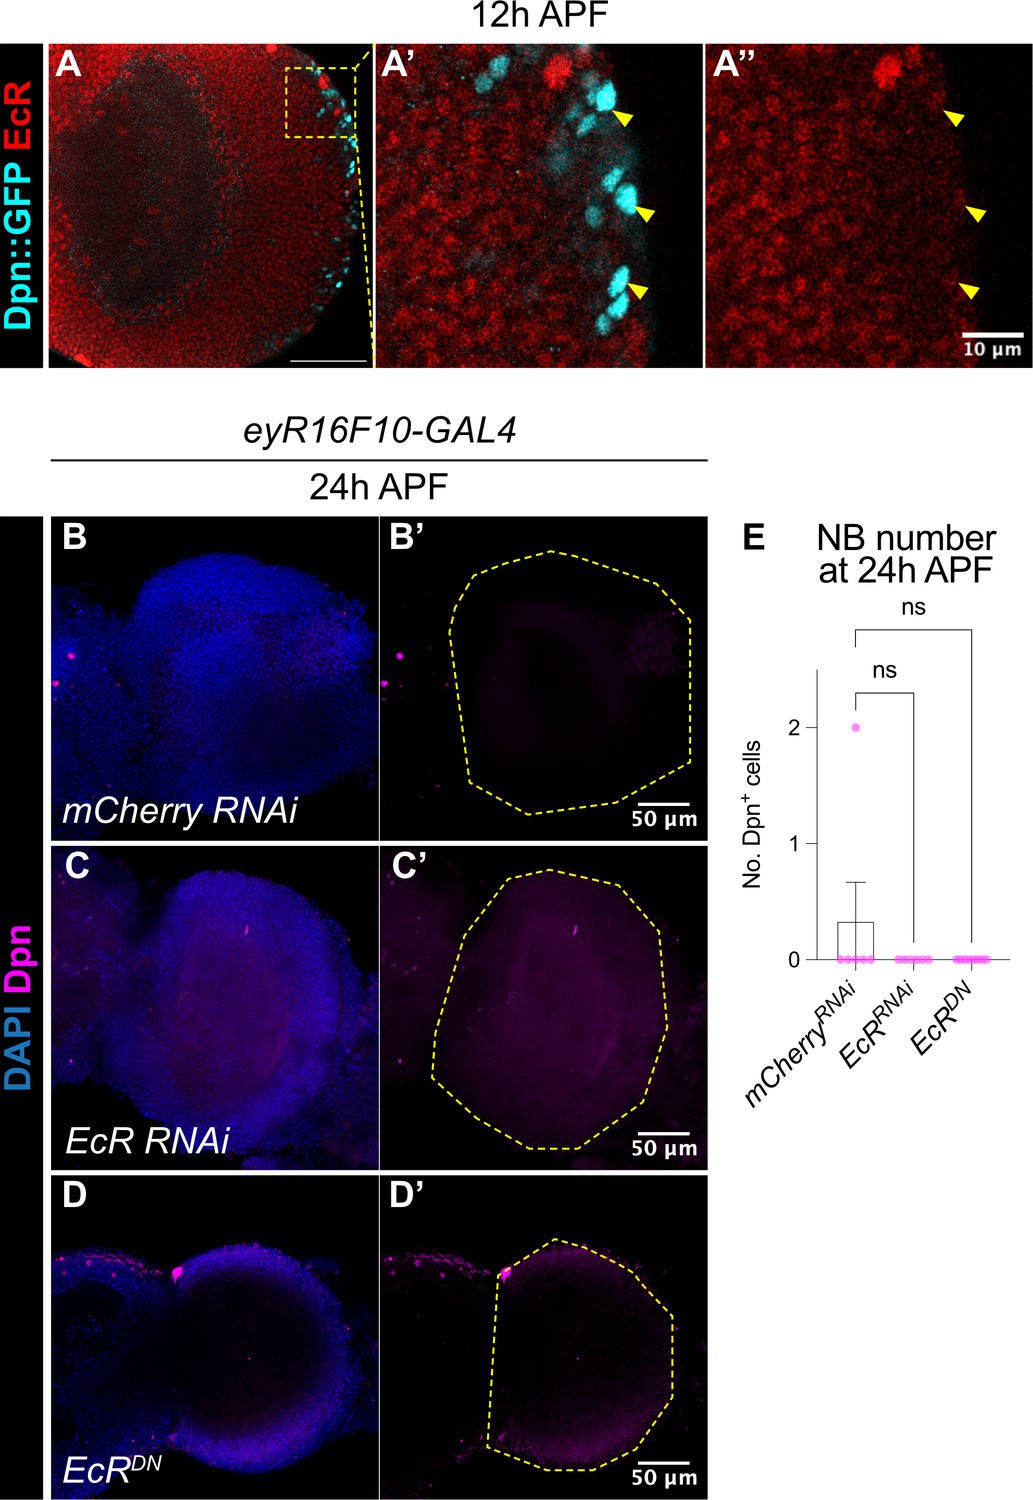
The termination of medulla NBs does not require ecdysone signalling.
(A-A’’) Representative single confocal section of the OL at 12 hr APF. Medulla NBs marked by Dpn::GFP (cyan) do not express EcR (red) (arrowheads). A’-A’’ is the magnified view of the inset from A. (B–D) Representative maximum projections of the OLs at 24 hr APF (dashed line), in which (B-B’) UAS-mCherry RNAi, (C-C’) UAS- EcR RNAi, and (D-D’) UAS-EcRDN are driven by eyR16F10-GAL4. DAPI (blue), Dpn (magenta). (E) Quantifications of medulla NB number in the OL at 24 hr APF in which eyR16F10-GAL4 drives the expression of UAS-mCherry RNAi, UAS-EcR RNAi, and UAS-EcRDN. Kruskal-Wallis test and Dunn’s test to correct for multiple comparisons: (ns) p>0.05. mCherry RNAi: n=6, m=0.333 ± 0.333. EcR RNAi: n=6, m=0.00 ± 0.00. EcRDN: n=8, m=0.00 ± 0.00.
Figure 2 with 1 supplement
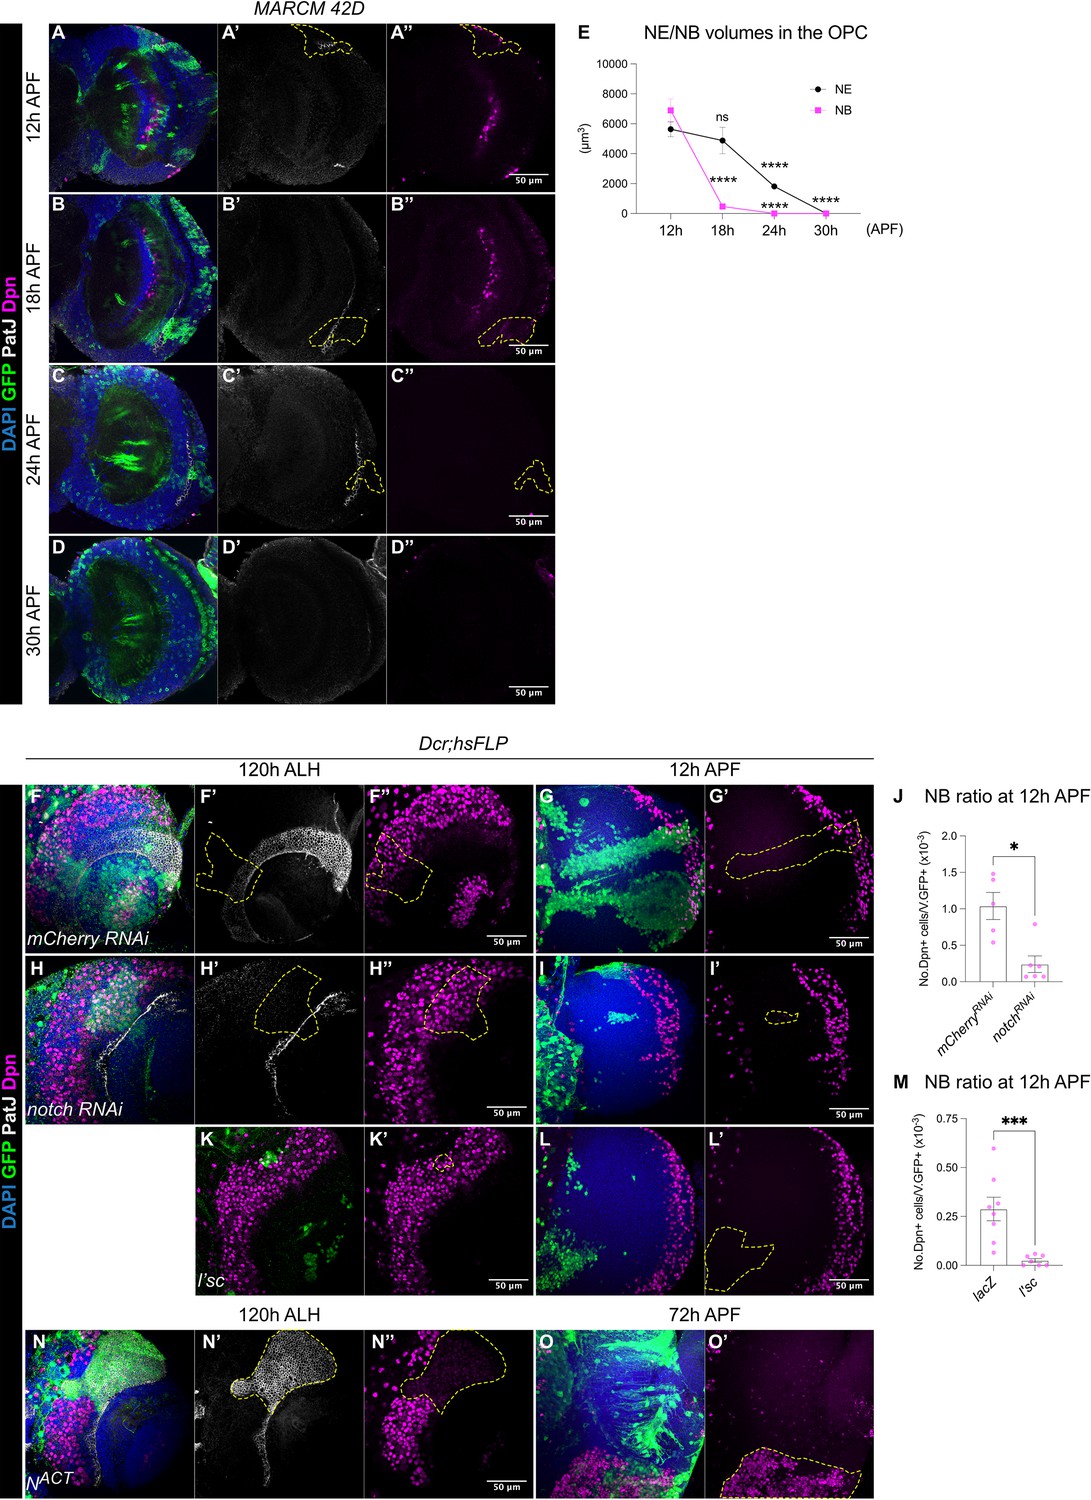
The termination of medulla NBs is scheduled by the timing of the larval NE-NB transition.
(A-D) Representative single confocal sections of the OL, where MARCM clones show that between 12 hr and 30 hr APF the gradual depletion of the NE (marked by PatJ, grey) is accompanied by the elimination of NBs (marked by Dpn, magenta) in the medulla. Dashed lines indicate representative clones (marked by GFP, green), DAPI (blue). Note that at 24 hr and 30 hr APF, neurons migrate and become dispersed across the OL, therefore, the precise annotation of the clones is not possible. (E) Quantification of NE and NB volumes at 12 hr, 18 hr, 24 hr, and 30 hr APF. One-way ANOVA and Holm-Šídák’s multiple comparisons tests: ****p<0.0001. (NE) 12 hr: m=5635 ± 502. 18 hr: 4877±884. 24 hr: 1814±190. 30 hr: 0.00±0.00. (NB) 12 hr: 6892±769. 18 hr: 472±80.1. 24 hr: 0.00±0. 30 hr: 0.00±0.00. (F, H) Representative single confocal sections of the OLs at 120 hr ALH in which hsFLP clones (dashed lines) express (F-F’’) UAS-mCherry RNAi and (H-H’’) UAS-notch RNAi. DAPI (blue), GFP (green), PatJ (grey), Dpn (magenta). (G, I) Representative maximum projections of the OL at 12 hr APF, in which hsFLP clones (dashed lines) express (G-G’) UAS-mCherry RNAi and (I-I’) UAS-notch RNAi. (J) Quantification of the NB ratio in the OL at 12 hr APF in which hsFLP clones were induced with UAS-mCherry RNAi and UAS-notch RNAi. Mann-Whitney test: *p=0.0173. mCherry RNAi: n=5, m=1.04 ± 0.185. notch RNAi: n=6, m=0.241 ± 0.113. (K-K’) Representative single confocal sections of the OLs at 120 hr ALH in which hsFLP clones (dashed line) express UAS-l’sc. (L-L’) Representative maximum projections of the OL (dashed lines) at 12 hr APF in which hsFLP clones express UAS-l’sc. (M) Quantification of the NB ratio in UAS-lacZ and UAS-l’sc clones in the OL at 12 hr APF. Mann-Whitney test: ***p=0.0003. lacZ: n=8, m=0.288 ± 0.061. l’sc: n=7, m=0.025 ± 0.010. (N-N’) Representative single confocal sections of the OLs at 120 hr ALH in which hsFLP clones (dashed line) express UAS-NACT. (O-O’) Representative maximum projections of the OL at 72 hr APF, in which hsFLP clones (dashed line) express UAS-NACT. Note that NACT clones do not generate NBs until late pupal development.
Figure 2—figure supplement 1
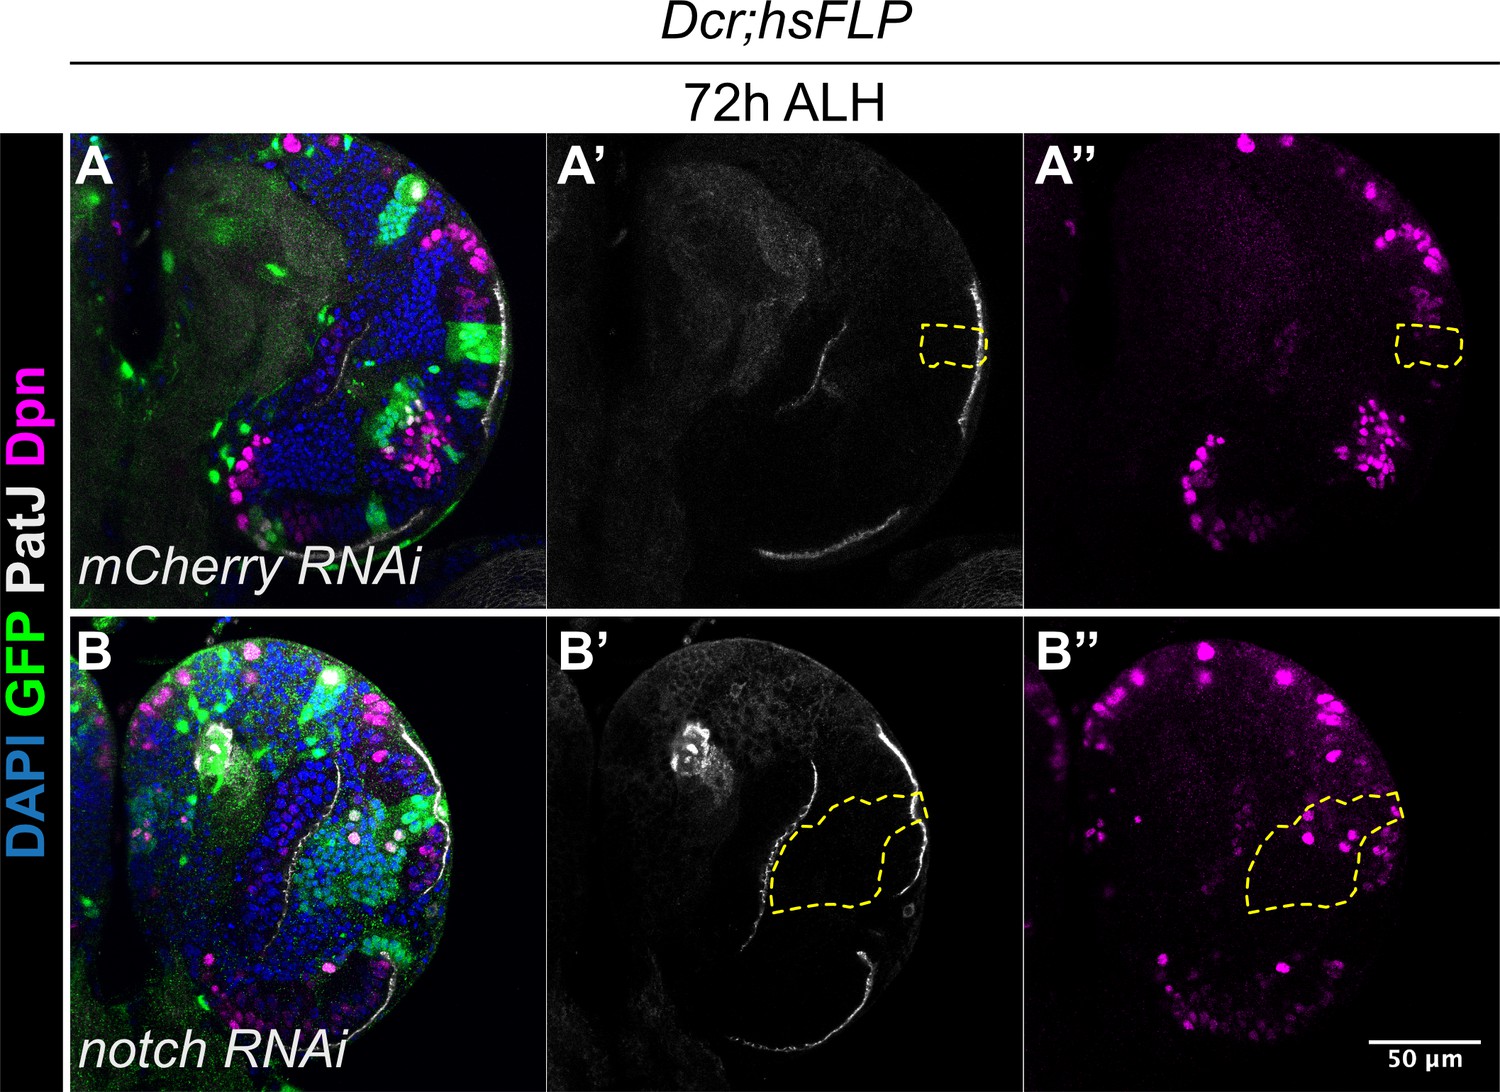
The downregulation of Notch signalling in the NE causes precocious formation of medulla NBs.
Representative single confocal sections of the OLs at 72 h ALH with hsFLP clones (dashed lines) expressing (A-A’’) UAS-mCherry RNAi and (B-B’’) UAS-notch RNAi. DAPI (blue), GFP (green), PatJ (grey), Dpn (magenta).
Figure 3 with 1 supplement
A subset of medulla NBs terminate via apoptosis-mediated cell death.
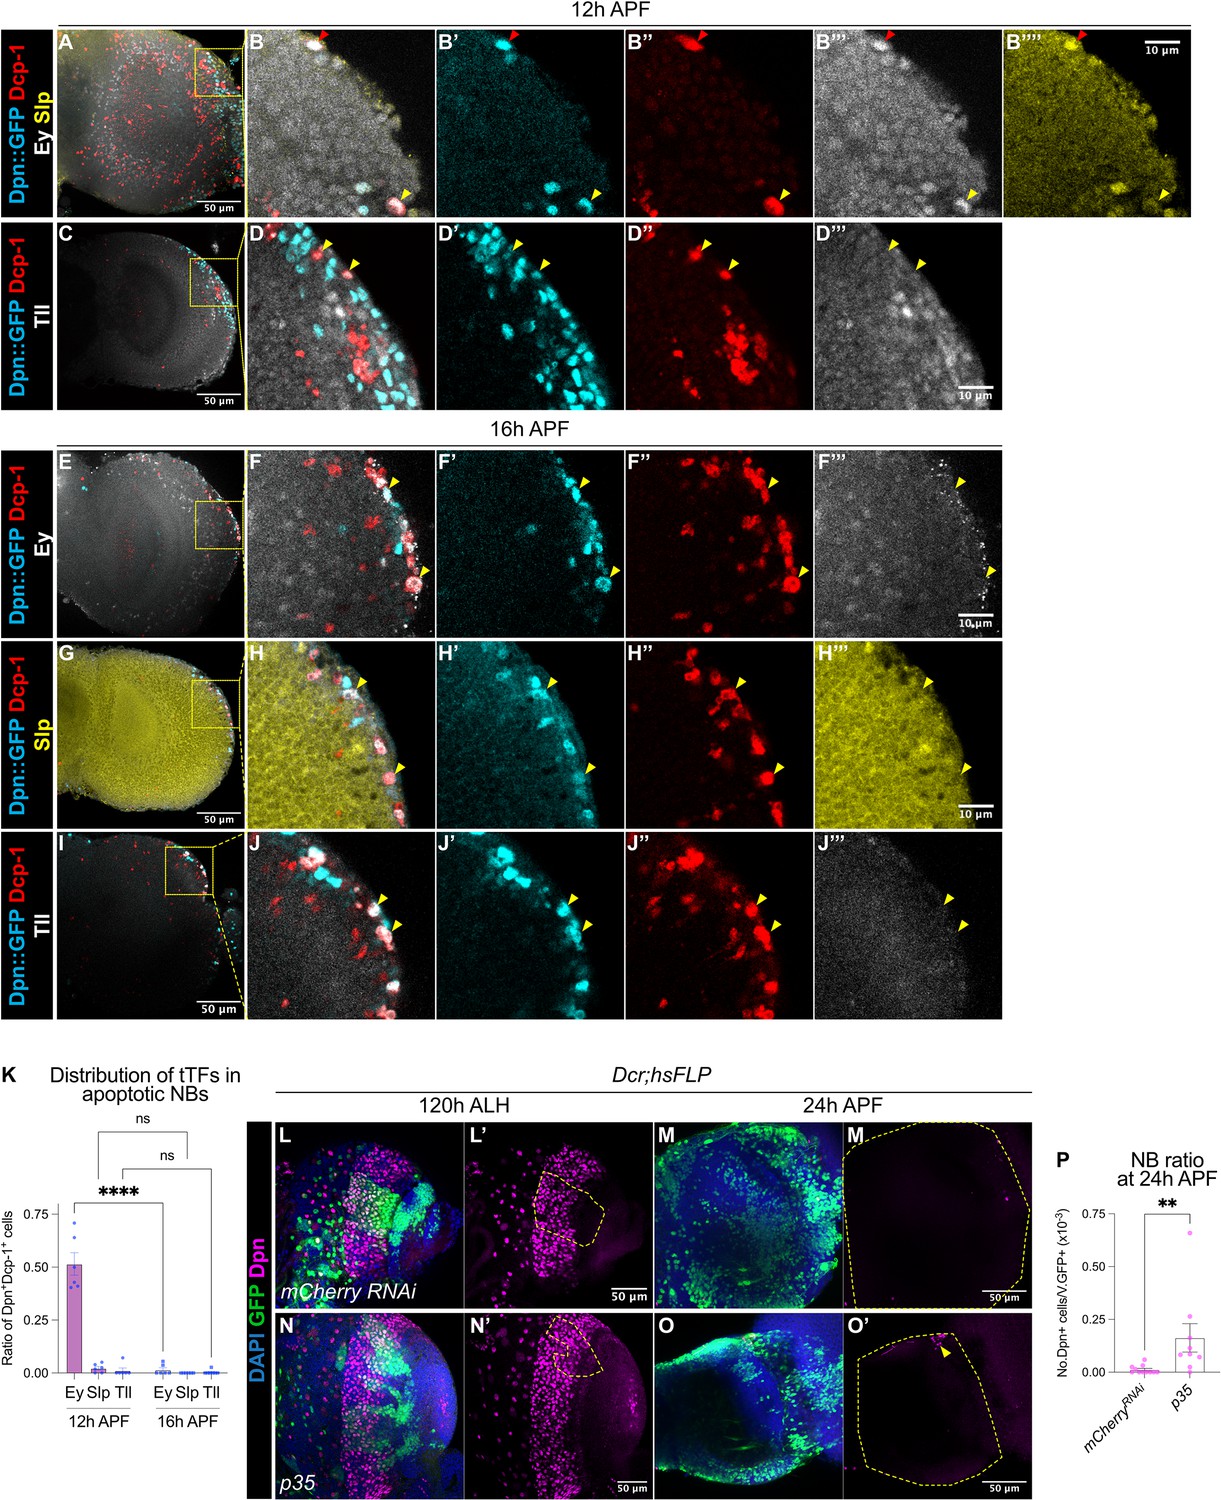
(A–B) Representative maximum projections of the OL at 12 hr APF. A subset of medulla NBs marked by Dpn::GFP (cyan) express the apoptotic marker Dcp-1 (red). B-B’’’’ is the magnified view of the boxed inset in A. Among these, some cells express Ey (grey) (red arrowhead) and a smaller population express Slp (yellow) (yellow arrowhead). (C–D) Representative maximum projections of the OL at 12 hr APF. Medulla NBs marked by Dpn::GFP (cyan) expressing Dcp-1 (red) do not express Tll (grey) (yellow arrowheads). D-D’’’’ is the magnified view of the boxed inset in C. (E–J) Representative maximum projections of the OL at 16 hr APF. Medulla NBs marked by Dpn::GFP (cyan) expressing Dcp-1 (red) express neither Ey, Slp, nor Tll (yellow arrowheads). (F, H, J) are the magnified view of the boxed insets in (E, G, I) respectively. Ey or Tll (grey), Slp (yellow). (K) Quantifications of the ratio of apoptotic NBs in the medulla expressing different temporal Transcription Factors (tTFs) at 12 hr and 16 hr APF. Two-way ANOVA test with Šídák’s multiple comparisons: ****p<0.0001. 12 hr: Ey: n=6, m=0.515 ± 0.053. Slp: n=6, m=0.023 ± 0.008. Tll: n=6, m=0.012 ± 0.012. 16 hr: Ey: n=6, m=0.015 ± 0.010. Slp: n=6, m=0.00 ± 0.00. Tll: n=7, m=0.004 ± 0.004. (L, N) Representative maximum projections of the OLs at 120 hr ALH with hsFLP clones (dashed lines) expressing (L-L’) UAS-mCherry RNAi and (N-N’) UAS-p35. DAPI (blue), GFP (green), Dpn (magenta). (M, O) Representative maximum projections of the OLs at 24 hr APF with hsFLP clones expressing (M-M’) UAS-mCherry RNAi and (O-O’) UAS-p35. The OLs are outlined by dashed lines. DAPI (blue), GFP (green), Dpn (magenta). The same mCherry RNAi representative image is used in Figure 5L. (P) Quantification of the NB ratio in hsFLP clones expressing UAS-mCherry RNAi and UAS-p35 in the OLs at 24 hr APF. Mann-Whitney test: **p=0.002. mCherry RNAi: n=11, m=0.012 ± 0.006. p35: n=9, m=0.163 ± 0.067.
Figure 3—figure supplement 1
Apoptosis but not autophagy is necessary for the termination of medulla NBs.
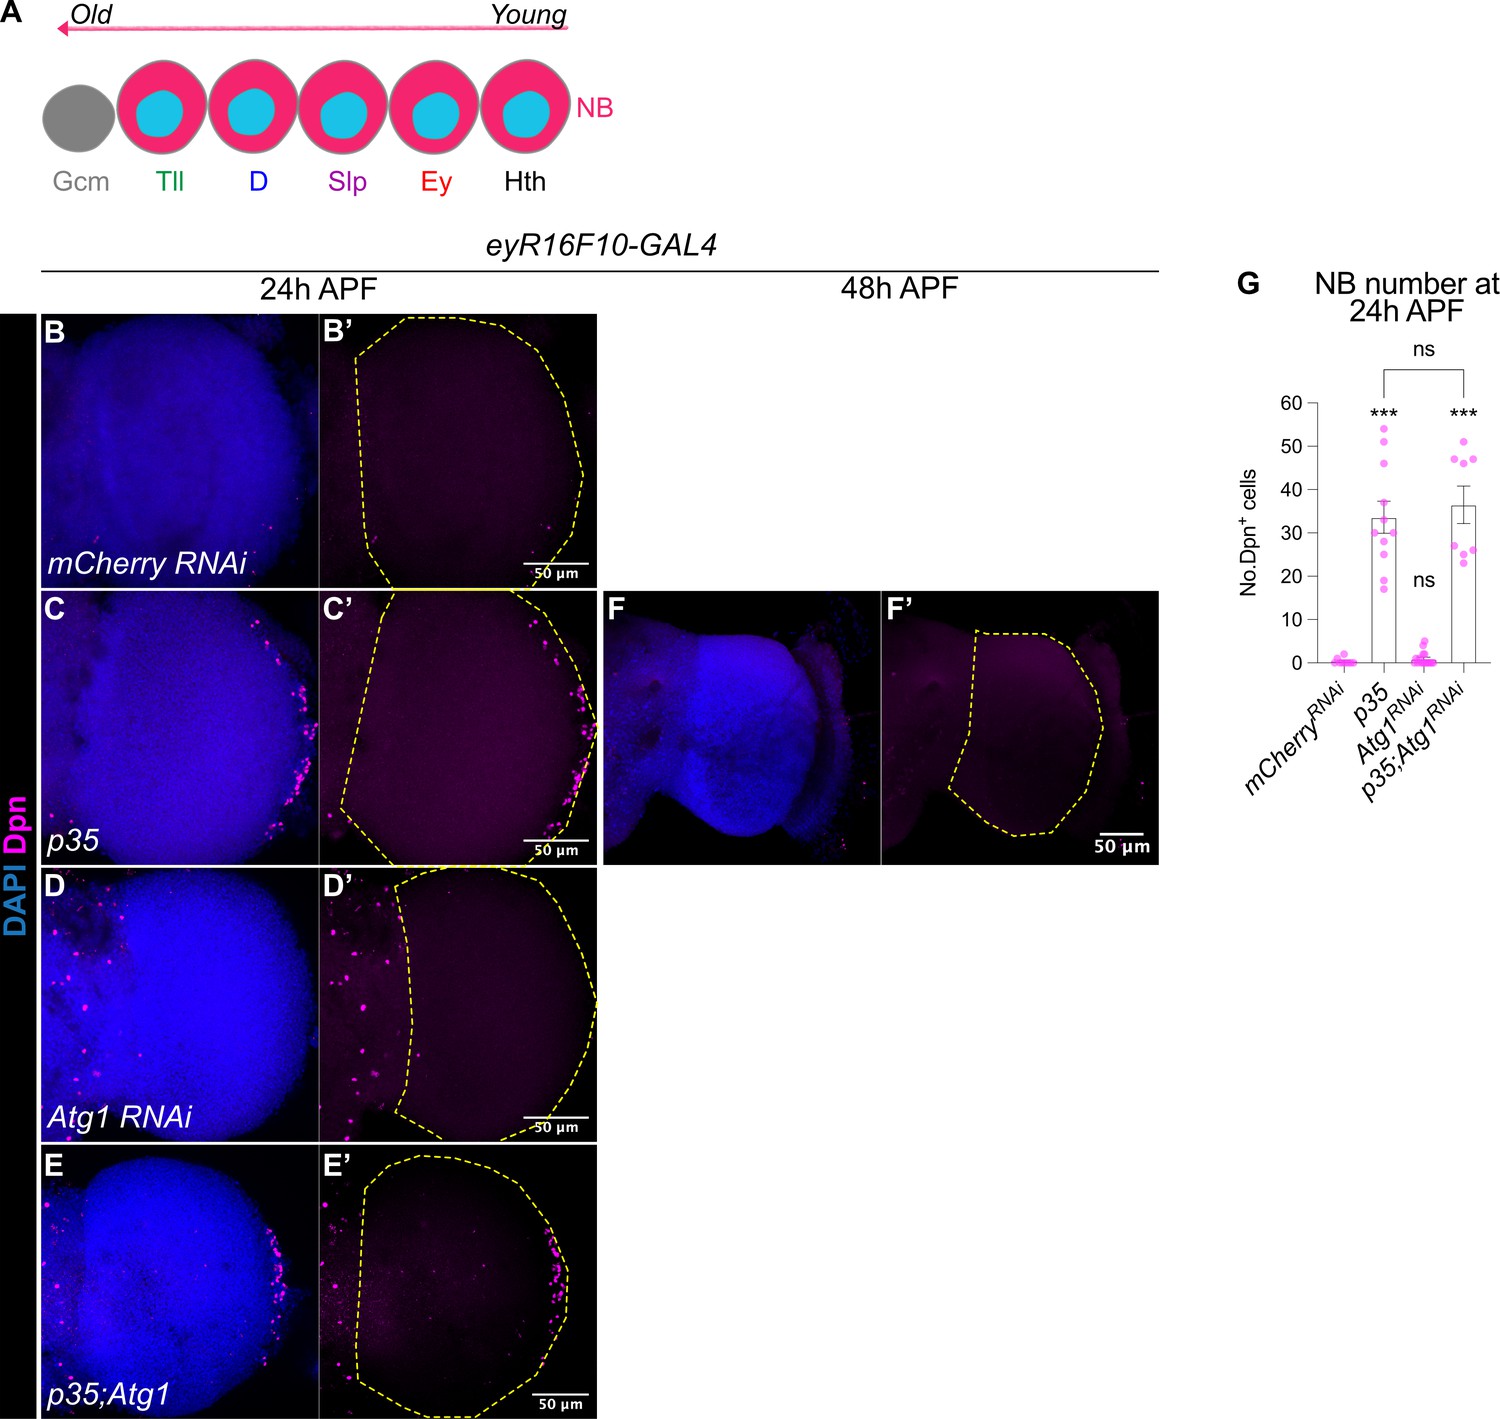
(A) Schematic depicting the temporal series of medulla NBs. (B–E) Representative maximum projections of the OLs (dashed lines) at 24 hr APF, in which eyR16F10-GAL4 drives (B-B’) UAS-mCherry RNAi, (C-C’) UAS-p35, (D-D’) UAS-Atg1 RNAi, and (E-E’) UAS-p35;UAS-Atg1 RNAi. DAPI (blue), Dpn (magenta). (F-F’) Representative maximum projection of the OL (dashed line) at 48 hr APF, in which eyR16F10-GAL4 drives UAS-p35. DAPI (blue), Dpn (magenta). (G) Quantification of the NB numbers in the OLs at 24 hr APF in which eyR16F10-GAL4 drives UAS-mCherry RNAi, UAS-p35, UAS-Atg1 RNAi, and UAS-p35;UAS-Atg1 RNAi. Kruskal-Wallis test and Dunn’s test to correct for multiple comparisons. **p=0.0001 and 0.0004, respectively. (ns) p>0.999. mCherry RNAi: n=9, m=0.333 ± 0.236. p35: n=11, m=33.6 ± 3.70. Atg1 RNAi: n=16, m=0.938 ± 0.392. p35;Atg1 RNAi: n=8, m=36.4 ± 4.30.
Figure 4
The termination of medulla NBs requires Pros-mediated size symmetric divisions.
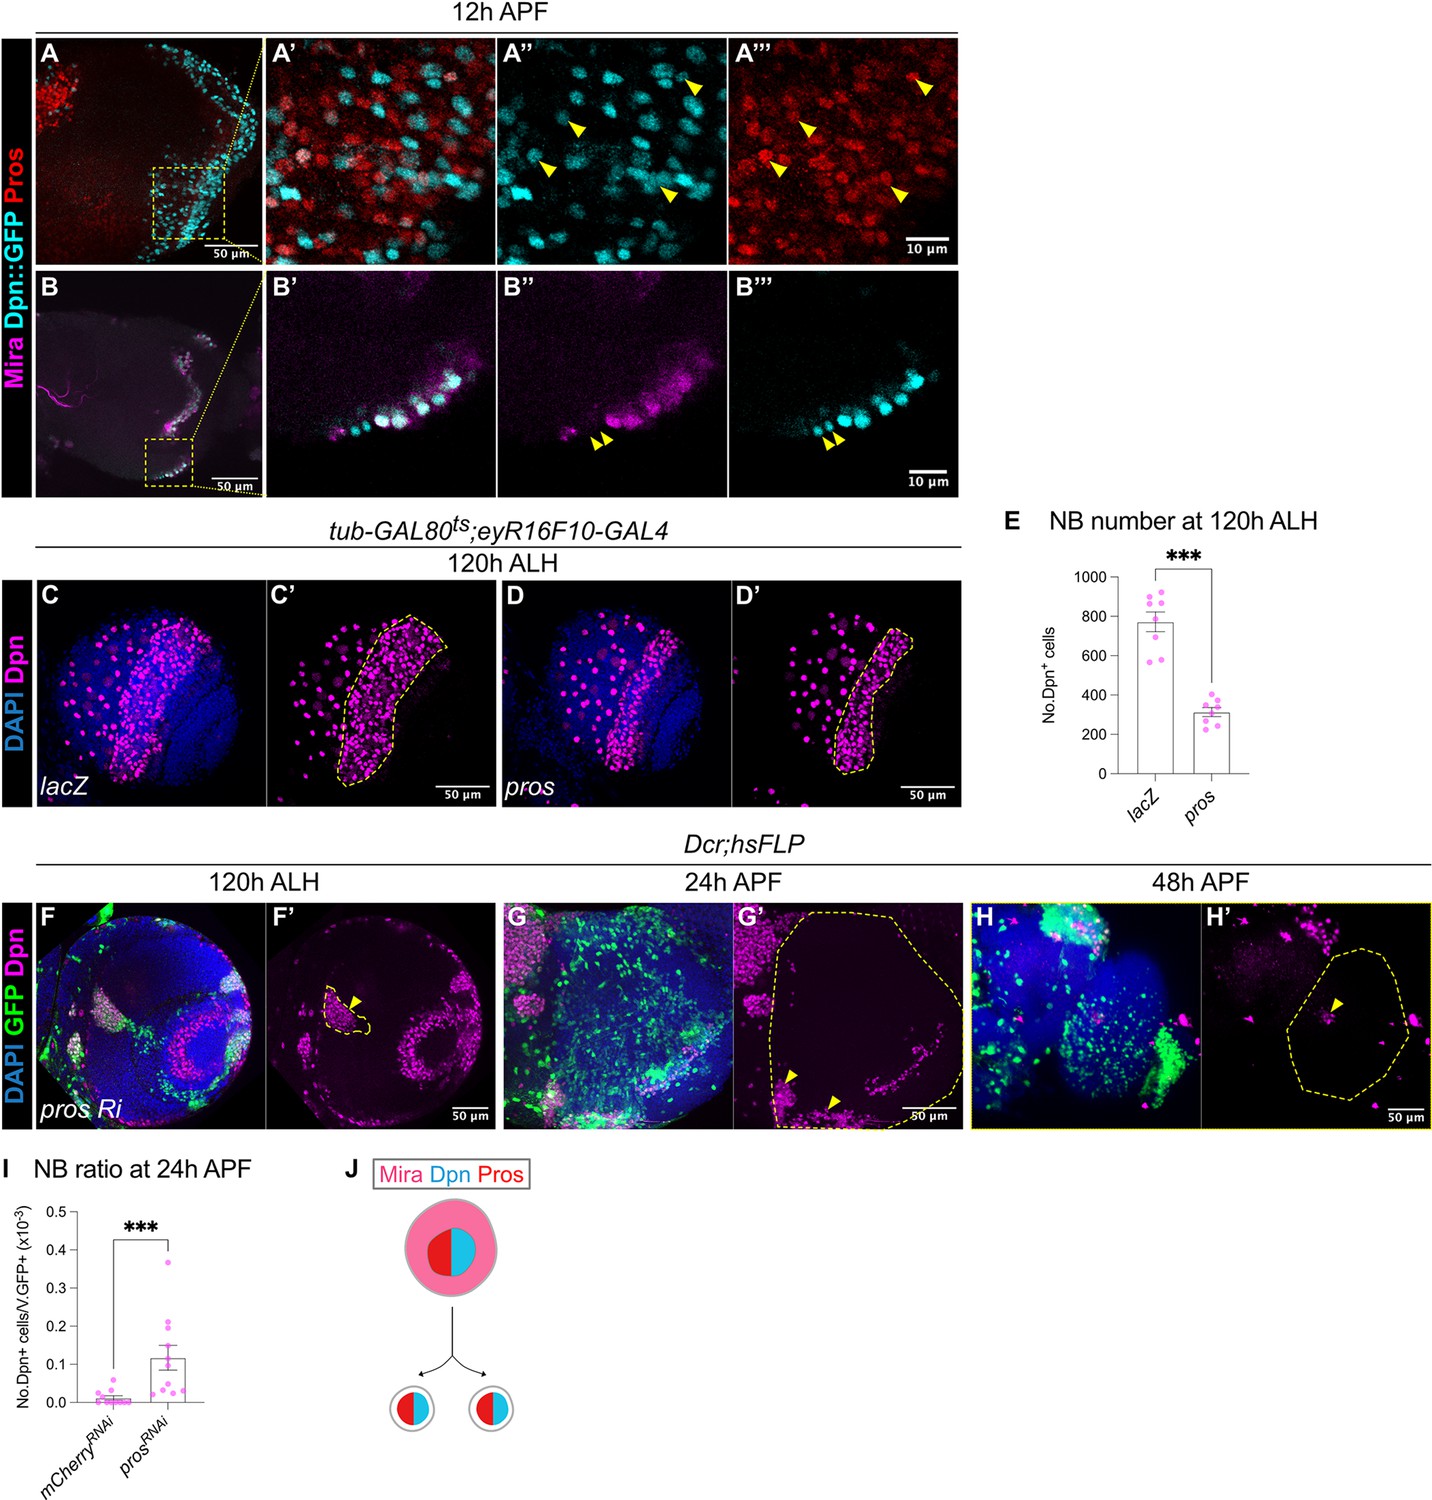
(A-A”’) Representative maximum projection of the OL at 12 hr APF. Some NBs marked by Dpn::GFP (cyan) in the medulla co-express Pros (red) (arrowheads). A’-A’’’ are magnified images of boxed inset in A. (B-B’’’) Representative single confocal section of the OL at 12 hr APF. On the superficial layer where medulla NBs reside, we have occasionally observed a pair of similarly sized cells at the most medial position (arrowheads), that express Dpn::GFP (cyan) but not Mira (magenta). B’-B’’’ are magnified images of boxed inset in B. (C–D) Representative maximum projections of the OLs at 120 hr ALH in which tub-GAL80ts;eyR16F10-GAL4 drives (C-C’) UAS-lacZ and (D-D’) UAS-pros. Dashed lines outline medulla NBs. DAPI (blue), Dpn (magenta). (E) Quantifications of medulla NB numbers at 120 hr ALH where tub-GAL80ts;eyR16F10-GAL4 drives UAS-lacZ and UAS-pros. Mann-Whitney test: ***p=0.0002. lacZ: n=8, m=772 ± 50.4. pros: n=8, m=313 ± 22.7. (F) Representative single confocal section of the OL showing the deep section of the medulla with hsFLP clones (dashed lines) expressing UAS-pros RNAi at 120 hr ALH. Arrowhead indicates ectopic NBs. DAPI (blue), GFP (green), Dpn (magenta). (G–H) Representative maximum projects of an OL (dashed line) at (G-G’) 24 hr APF and (H-H’) 48 hr APF, with hsFLP clones expressing UAS-pros RNAi. Arrowheads indicate persistent NBs. DAPI (blue), GFP (green), Dpn (magenta). (I) Quantification of the NB ratio in hsFLP clones in the OL at 24 hr APF, expressing UAS-mCherry RNAi and UAS-pros RNAi. Mann-Whitney test: ***p=0.0003. mCherry RNAi: n=11, m=0.012 ± 0.006. pros RNAi: n=11, m=0.117 ± 0.033. (J) Schematic depicting a possible model of differentiation: Mira+Dpn+Pros+ NB gives rise to two Dpn+Pros+ progeny.
Figure 5 with 2 supplements
Gcm is sufficient to induce gliogenesis in the medulla at the expense of NBs.
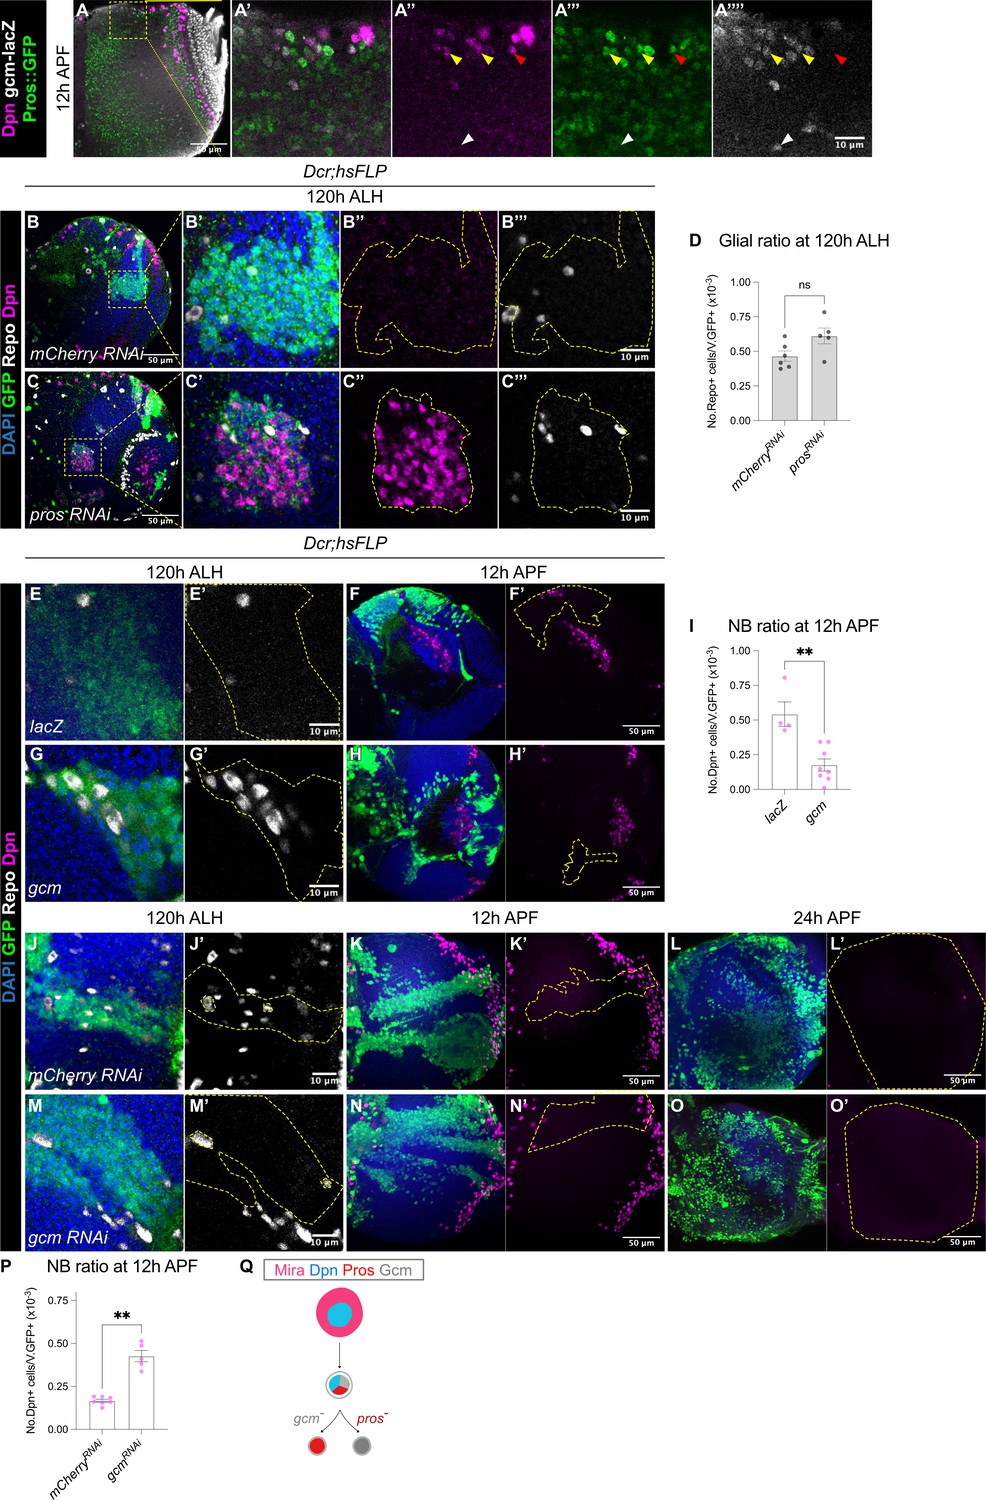
(A-A’’’’) Representative single confocal section of the OL at 12 hr APF. In the superficial layer, some of the most medial NBs are Dpn+Pros+gcm+ (yellow arrowheads), while some NBs are Dpn+Pros+gcm- (red arrowhead). In the deep layers, some cells are Dpn-Pros-gcm+ (white arrowheads). (B–C) Representative single confocal sections of the OLs at 120 hr ALH, with hsFLP clones (dashed lines) induced with (B-B’’’) UAS-mCherry RNAi and (C-C’’’) UAS-pros RNAi. DAPI (blue), GFP (green), Dpn (magenta), Repo (grey). (D) Quantification of glia cell ratio in hsFLP clones in the medulla at 120 hr ALH that express UAS-mCherry RNAi and UAS-pros RNAi. Mann-Whitney test: (ns) p=0.052. mCherry RNAi: n=6, m=0.466 ± 0.037. pros RNAi: n=5, m=0.612 ± 0.057. (E, G) Representative single confocal sections of hsFLP clones (dashed lines) at 120 hr ALH, expressing (E-E’) UAS-lacZ, and (G-G’) UAS-gcm. DAPI (green), GFP (green), Repo (grey). (F, H) Representative images of the OLs (dashed lines) at 12 hr APF, in which hsFLP clones express (F-F’) UAS-lacZ, and (H-H’) UAS-gcm. DAPI (blue), GFP (green), Dpn (magenta). (I) Quantification of the NB ratio in hsFLP clones in the OLs at 12 hr APF, that express UAS-lacZ and UAS-gcm. Mann-Whitney test: **p=0.004. lacZ: n=4, m=0.543 ± 0.088. gcm: n=8, m=0.176 ± 0.044. (J, M) Representative single confocal sections of hsFLP clones (dashed lines) at 120 hr ALH, expressing (J-J’) UAS-mCherry RNAi, and (M-M’) UAS-gcm RNAi. DAPI (green), GFP (green), Repo (grey). (K, L, N, O) Representative maximum projections of the OLs (dashed lines) at (K, N) 12 hr APF and (L, O) 24 h APF, in which hsFLP clones express (K-K’, L-L’) UAS-mCherry RNAi, and (N-N’, O-O’) UAS-gcm RNAi. DAPI (blue), GFP (green), Dpn (magenta). (P) Quantification of the NB ratio in hsFLP clones in the OLs at 12 hr APF, that express UAS-mCherry RNAi and UAS-gcm RNAi. Mann-Whitney test: **p=0.003. mCherry RNAi: n=7, m=0.167 ± 0.009. gcm RNAi: n=5, m=0.426 ± 0.033. (Q) Schematic depicting a Mira+Dpn+ medulla NB expressing nuclear Pros and the glial cell fate determinant Gcm to either produce Gcm+ glial cells, or Pros+ neurons. Pros expression is not affected by the absence of Gcm, and Gcm expression is also not affected by the absence of Pros.
Figure 5—figure supplement 1
Pros-mediated size symmetric division and Gcm-mediated gliogenesis are independent mechanisms that promote medulla NB termination.
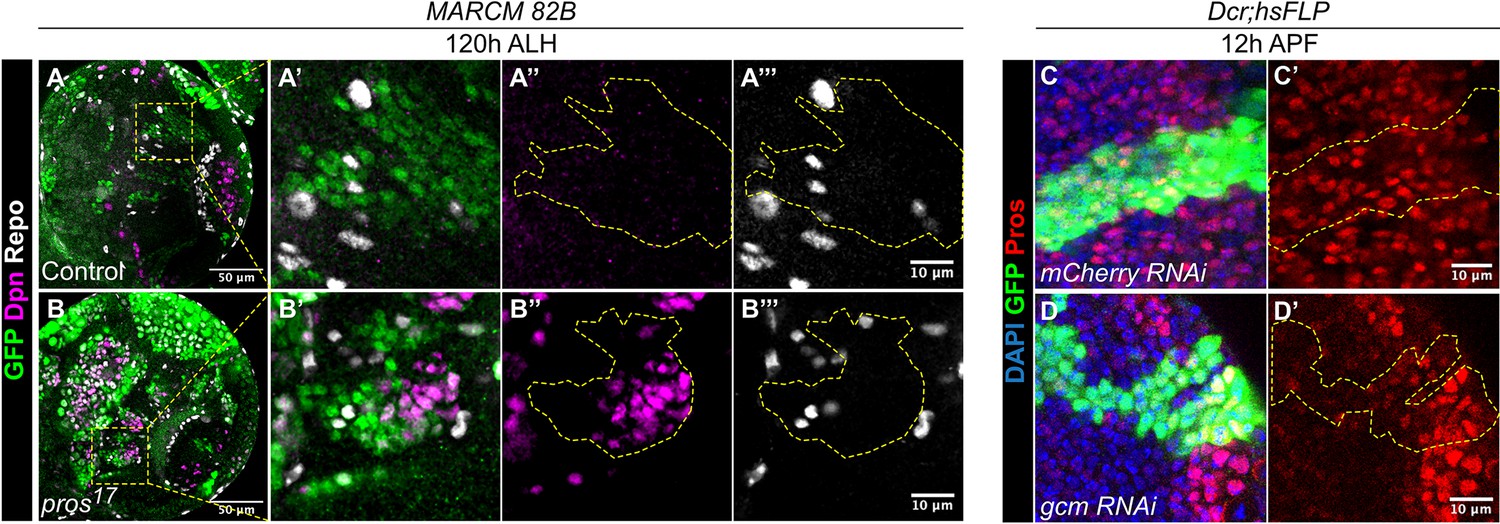
(A–B) Representative single confocal sections of the OLs at 120 hr ALH, containing (A-A’’) FRT82B (control) (dashed lines) or (B-B’’) FRT82B pros17 MARCM clones. A’-A’’’ and B’-B’’’ are magnified images of boxed inset in A and B, respectively. GFP (green), Dpn (magenta), Repo (grey). (C–D) Representative single confocal sections of hsFLP clones (dashed lines) at 12 hr APF, expressing (C-C’) UAS-mCherry RNAi and (D-D’) UAS-gcm RNAi. DAPI (blue), GFP (green), Pros (red).
Figure 5—figure supplement 2
Tll is not required to schedule the gliogenic switch of the medulla NBs.
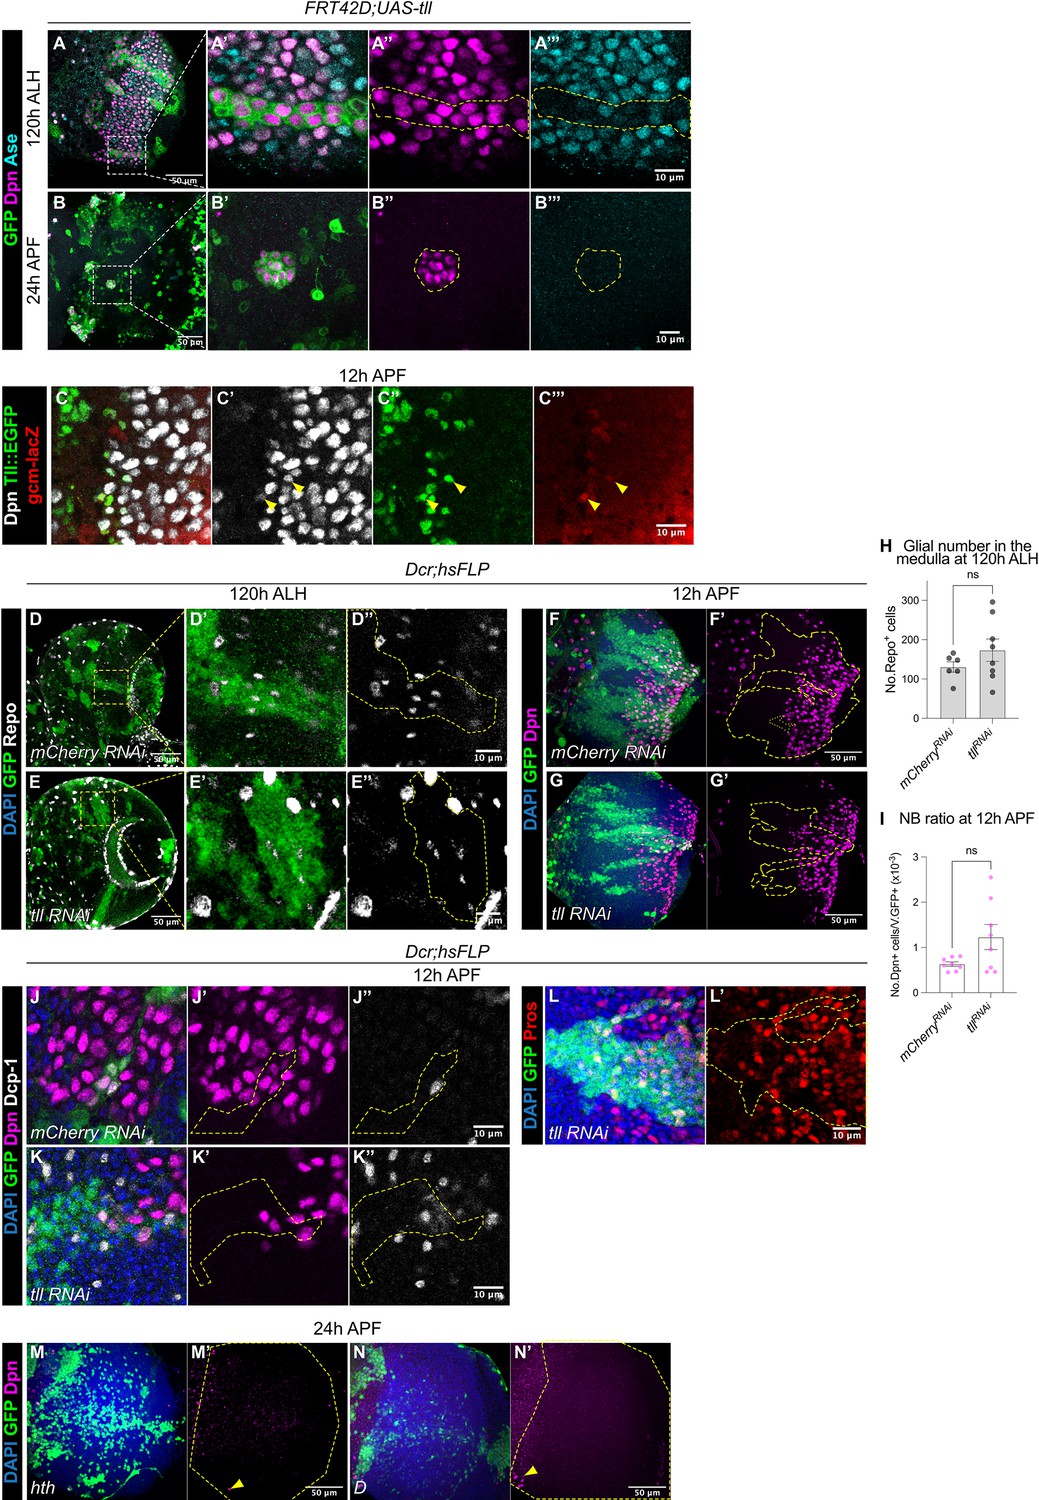
(A–B) Representative images of the OLs at (A-A’’’) 120 hr ALH and (B-B’’’) 24 h APF, where UAS-tll MARCM clones are induced. A’-A’’’ and B’-B’’’ are magnified images of boxed inset in A and B, respectively. In the clones (dashed line, marked by GFP in green), medulla NBs (marked by Dpn, in magenta) expressed low levels of Ase (cyan) compared to wildtype medulla NBs outside of the clones. (C-C’’’) Representative single confocal section of the OL at 12 hr APF, showing the superficial section of the medulla. Some of the most medial NBs (arrowheads) express Dpn (grey), Tll::EGFP (green), and gcm-lacZ (red). (D–E) Representative images of the deep section of the medulla at 120 hr ALH, in which hsFLP clones (dashed lines) are induced with (D-D’’) UAS-mCherry RNAi and (E-E’’) UAS-tll RNAi. D’-D’’ and E-E’’ are magnified images of boxed inset in D and E, respectively. GFP (green), Repo (gray). (F–G) Representative maximum projections of the OLs at 12 hr APF, in which hsFLP clones (dashed lines) are induced with (F-F’) UAS-mCherry RNAi and (G-G’) UAS-tll RNAi. DAPI (blue), GFP (green), Dpn (magenta). (H) Quantification of the glial number in the medulla at 120 hr ALH, in which hsFLP clones are induced with UAS-mCherry RNAi and UAS-tll RNAi. Mann-Whitney test: p=0.433. mCherry RNAi: n=6, m=130.7 ± 13.22. tll RNAi: n=8, m=173.3 ± 28.39. (I) Quantification of the NB ratio in hsFLP clones in the OLs at 12 hr APF, induced with UAS-mCherry RNAi and UAS-tll RNAi. Mann-Whitney test: P=0.224. mCherry RNAi: n=8, m=0.633 ± 0.048. tll RNAi: n=8, m=1.23 ± 0.267. (J–K) Representative single confocal sections of hsFLP clones (dashed lines) at 12 APF expressing (J-J’’) UAS-mCherry RNAi and (K-K’’) UAS-tll RNAi. DAPI (blue), GFP (green), Dpn (magenta), Dcp-1 (grey). (L) Representative single confocal section of a hsFLP clone (dashed lines) at 12 hr APF induced with UAS-tll RNAi. DAPI (blue), GFP (green), Pros (red). (M–N) Representative maximum projections of the OLs (dashed lines) at 24 hr APF, in which hsFLP clones are induced with (M-M’) UAS-hth and (N-N’) UAS-D. Arrowheads indicate ectopic NBs of the clones. DAPI (blue), GFP (green), Dpn (magenta).
Figure 6
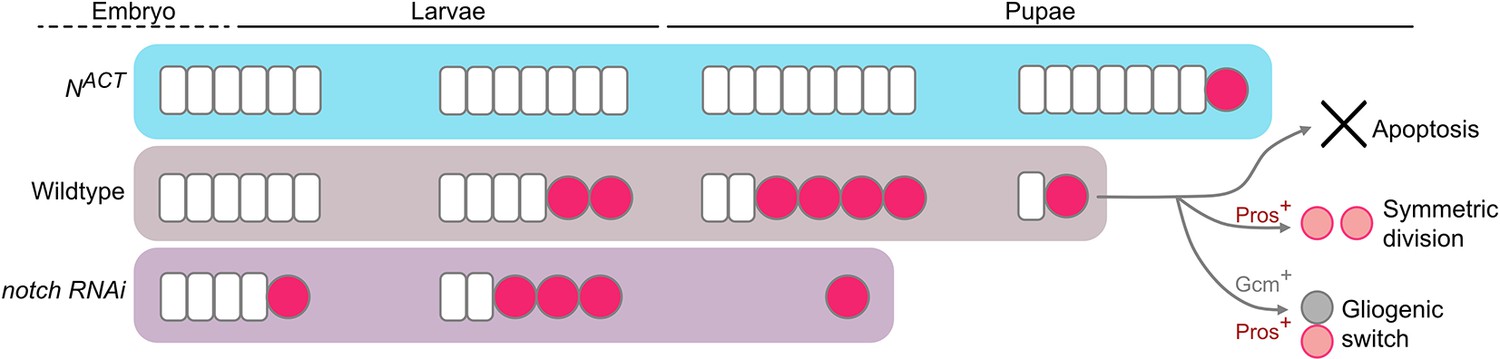
Working model of the termination of medulla NBs.
In the wildtype, medulla NBs terminate during early pupal development via three main mechanisms: (1) apoptosis, (2) Pros-mediated symmetric division, and (3) Gcm-mediated gliogenic switch. It is of note that Pros and Gcm function independently to promote medulla NB termination. Timing of NB termination in the early pupal stages is scheduled by the timing of the NE-NB transition in the larval stages. Upon the expression of NACT, NE cells overgrow resulting in a delayed NE-NB transition and persistent NBs. Conversely, expression of notch RNAi leads to a precocious NE-NB transition, leading to a premature NB termination.
Additional files
Download links
A two-part list of links to download the article, or parts of the article, in various formats.
Downloads (link to download the article as PDF)
Open citations (links to open the citations from this article in various online reference manager services)
Cite this article (links to download the citations from this article in formats compatible with various reference manager tools)
Drosophila medulla neuroblast termination via apoptosis, differentiation, and gliogenic switch is scheduled by the depletion of the neuroepithelial stem cell pool
eLife 13:e96876.
https://doi.org/10.7554/eLife.96876


