Repulsive Sema3E-Plexin-D1 signaling coordinates both axonal extension and steering via activating an autoregulatory factor, Mtss1
- Neurovascular Unit Research Group, Korea Brain Research Institute, Republic of Korea
- Department of Brain and Cognitive Sciences, Daegu Gyeongbuk Institute of Science and Technology, Republic of Korea
- Department of Life Sciences, Chung-Ang University, Republic of Korea
Figures
Figure 1 with 2 supplements
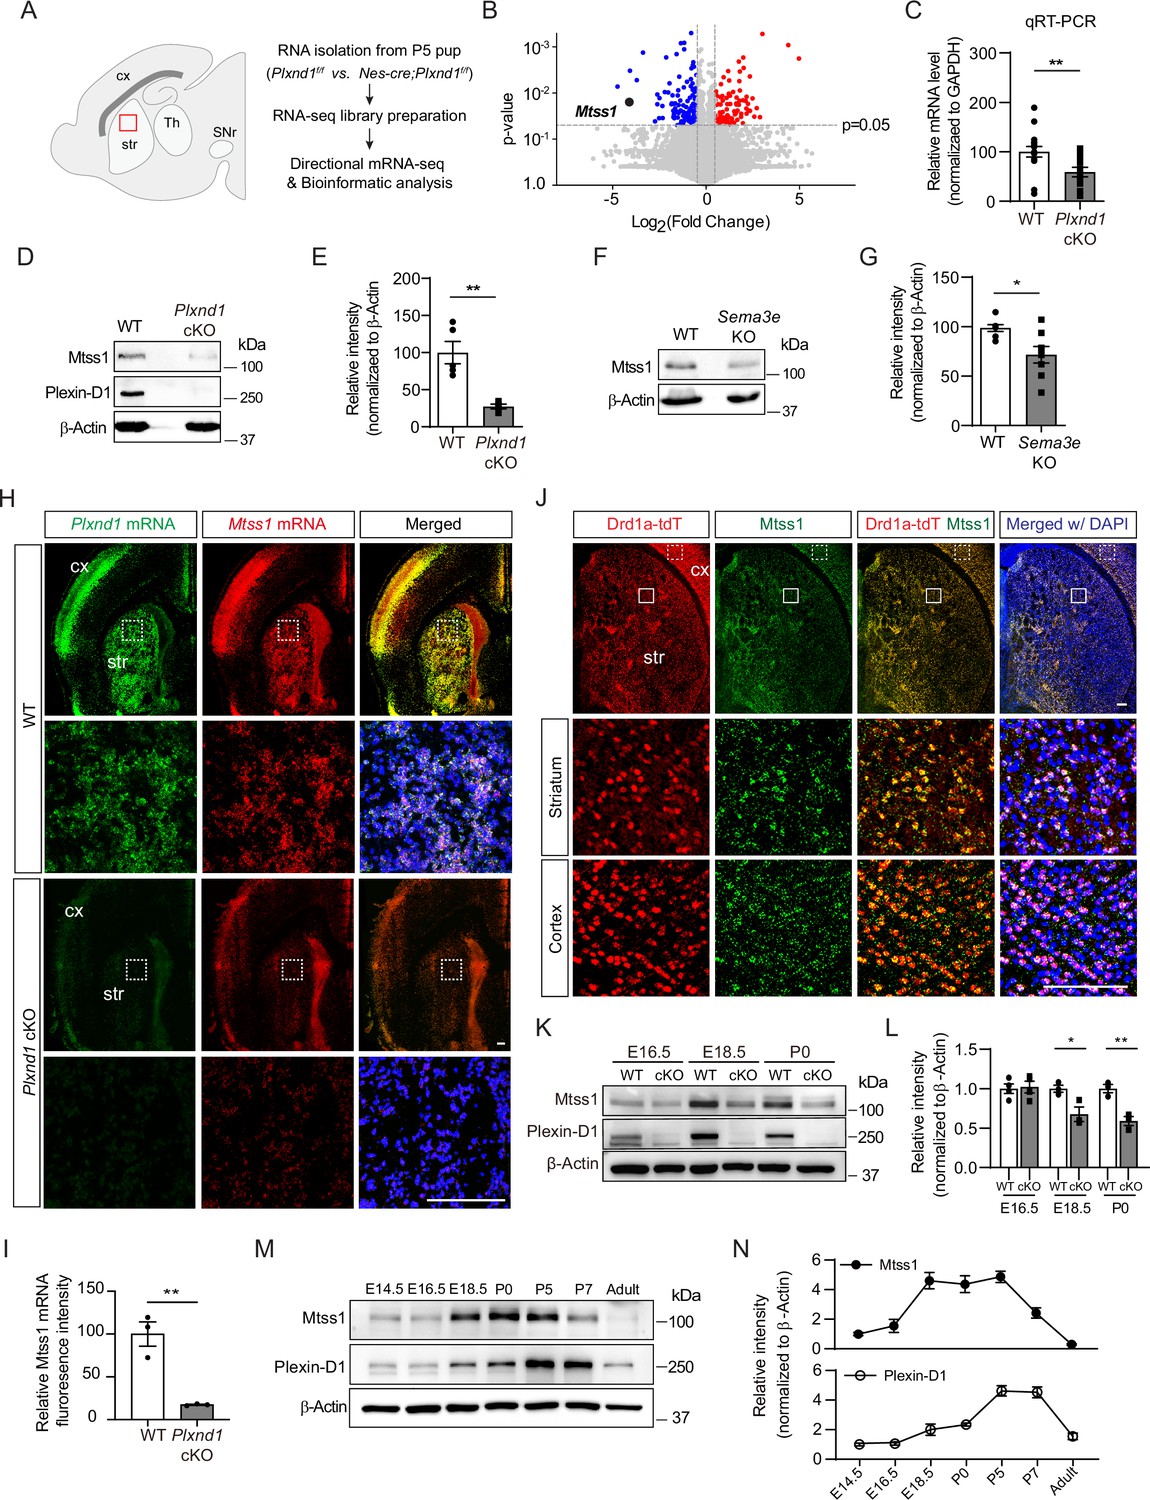
Sema3E-Plexin-D1 signaling induces Mtss1 expression selectively in developing striatonigral projecting neurons.
(A) RNA sequencing (RNA-seq) analysis of wild-type (WT) (Plxnd1f/f) and conditional neuronal knockout (cKO) (Nes-cre; Plxnd1f/f) pups at P5. The box in red indicates the dorsal striatum region from which RNA was isolated. (B) Volcano plot of significant differentially expressed genes (DEGs) between WT and Plxnd1 cKO. Blue and red circles indicate significantly down- and upregulated genes, respectively, as indicated by a fold change greater than 2. (C) Relative levels of Mtss1 expression in the striatum of WT or Plxnd cKO mice at P5 were compared by quantitative RT-PCR (RT-qPCR). n = 16 for WT mice, n = 14 for Plxnd1 cKO mice in four independent experiments. (D, E) Western blot images showing Mtss1 expression in the striatum of WT or Plxnd1 cKO mice and quantification. The values are averaged from n = 5 for WT mice and n = 4 for Plxnd1 cKO mice. (F, G) Western blot images and quantification of Mtss1 expression in the striatum of WT or Sema3e KO mice at P5. WT mice, n = 7, and Sema3e KO mice, n = 8. (H) Fluorescence in situ hybridization (FISH) for Plxnd1 mRNA (green) and Mtss1 mRNA (red) in the striatum of WT or Plxnd1 cKO mice at P5. White dotted boxes are shown in the inset image on the bottom. Scale bar, 200 μm. (I) Quantification of fluorescence intensity to measure the expression levels of Mtss1 in (H). WT mice, n = 3, and Plxnd1 cKO mice, n = 3. (J) Immunohistochemistry showing tdTomato-expressing Drd1a+MSNs (red) and Mtss1 (green) in the striatum of Drd1a-tdT mice at P5. The small boxes in the striatum and cortex are shown at better resolution in the inset images. Scale bar, 100 μm. (K) Western blot images showing the expression of Mtss1 and Plexin-D1 in the striatum of WT or Plxnd1 cKO mice at different developmental stages ranging from embryonic day 16.5 (E16.5) to postnatal day 0 (P0). (L) Quantification of band intensity in (K). WT, n = 4, and KO, n = 4 at E16.5, WT, n = 3, and KO, n = 3 at E18.5, WT, n = 3, and KO, n = 3 at P0. (M, N) Western blot images showing the temporal expression of Plexin-D1 and Mtss1 in the striatum from E14.5 to adulthood (8 weeks old) and quantification. Error bars, mean ± SEM; *p<0.05, **p<0.01 by Student’s t-test for all quantifications. The values represent the average band intensity, n = 3 at each age. str, striatum; cx, cortex; Th, thalamus; SNr, substantia nigra.
-
Figure 1—source data 1
Western blots shown in Figure 1D, F, K, and M.
- https://cdn.elifesciences.org/articles/96891/elife-96891-fig1-data1-v2.zip
Figure 1—figure supplement 1
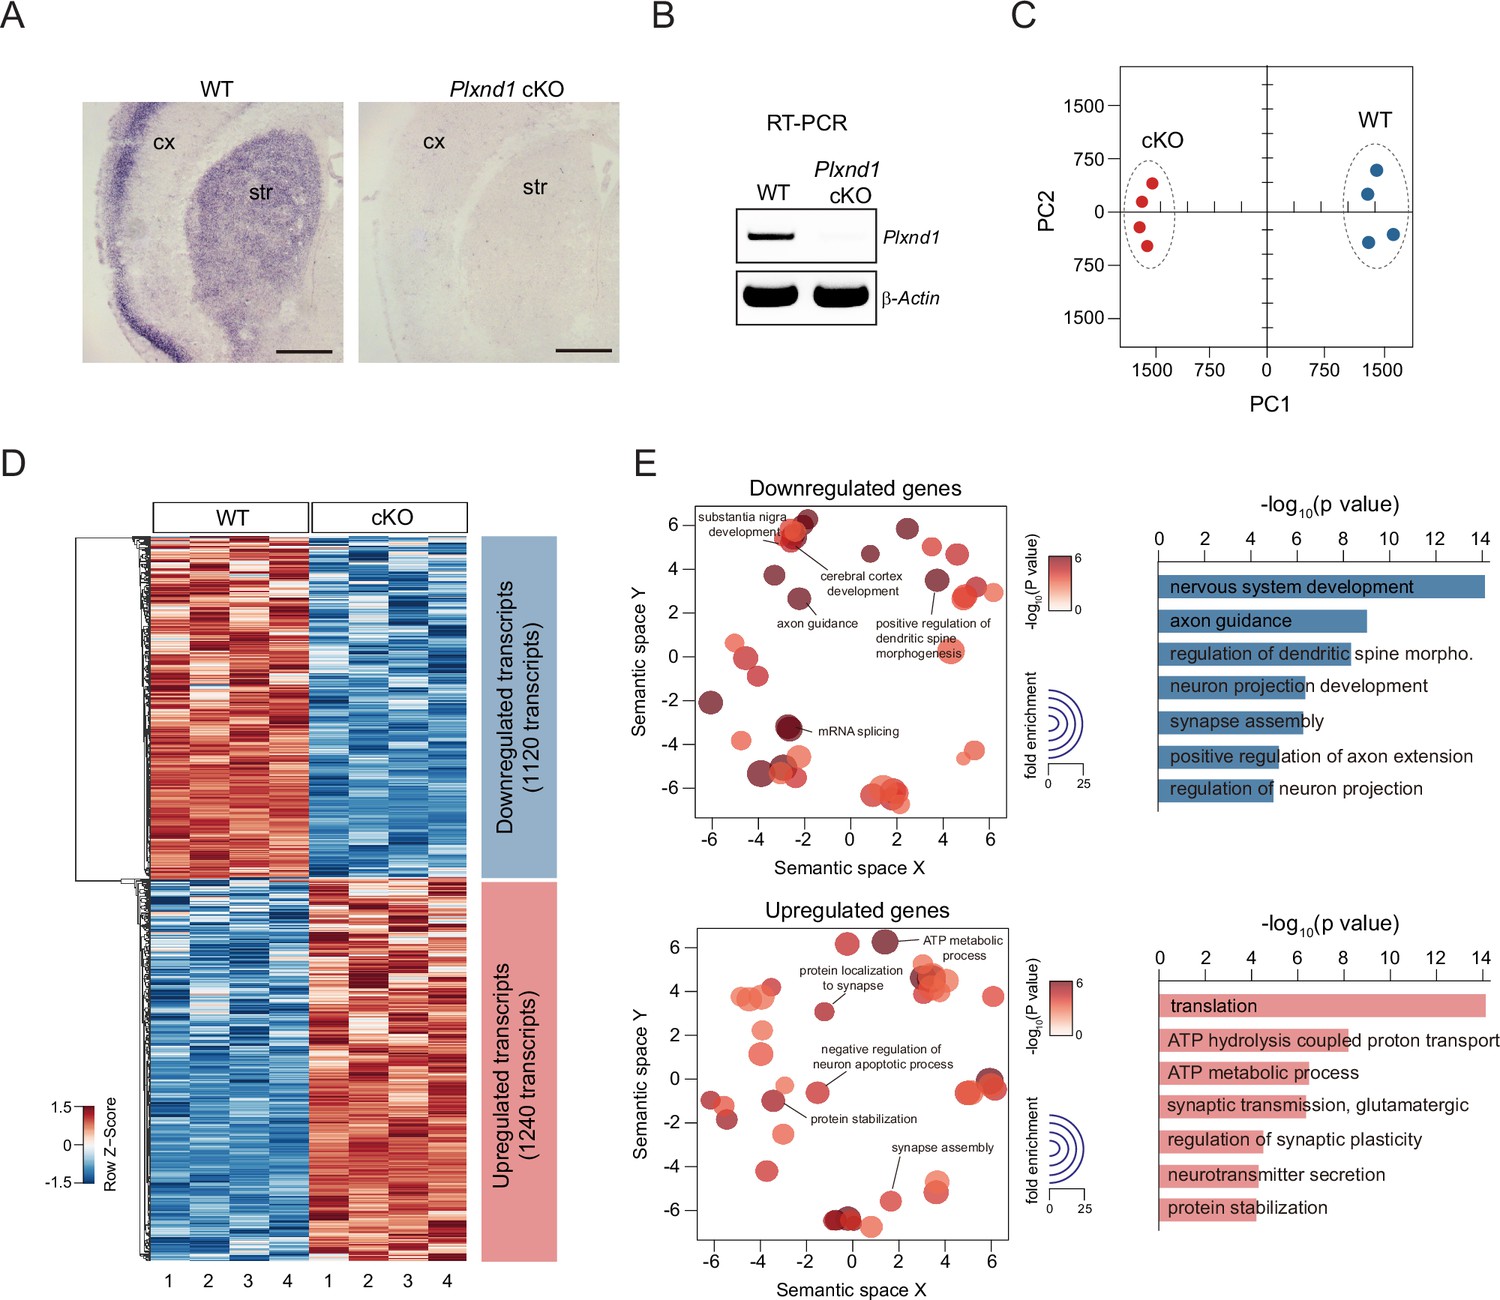
Identification of Mtss1 in the striatum on P5 through RNA sequencing (RNA-seq) analysis.
(A) Expression of Plxnd1 mRNA from wild-type (WT) (Plxnd1f/f) or conditional knockout (cKO) (Nes-cre; Plxnd1f/f) littermate mouse striatum at P5 was examined via in situ hybridization (ISH). Scale bars, 500 μm. (B) Plxnd1 mRNA expression was determined by reverse transcription-polymerase chain reaction (RT-PCR). (C) Common gene expression patterns were determined through two independent experiments and by RNA-seq. The values in the principal component analysis (PCA) plot indicate the amount of variation attributed to each principal component. Small circles indicate individual samples, and large ovals represent experimental groups. (D) Heatmap showing differential gene expression patterns as determined through RNA-seq analysis. Each row represents hierarchically clustered genes, and each column represents experimental samples with dendrograms and clusters generated with RNA-seq data. Red in the heatmap indicates upregulation of gene expression, and blue denotes downregulation of gene expression; the measures were based on z-score. (E) The most highly enriched Gene Ontology (GO) biological process and cellular component categories in Nes-cre; Plxnd1f/f samples were visualized on the basis of significant differentially expressed genes (DEGs) determined by RNA-seq. The size of a circle represents enriched genes, and the color represents the −log10 of the p-value.
-
Figure 1—figure supplement 1—source data 1
RT-PCR shown in Figure 1—figure supplement 1B.
- https://cdn.elifesciences.org/articles/96891/elife-96891-fig1-figsupp1-data1-v2.zip
Figure 1—figure supplement 2
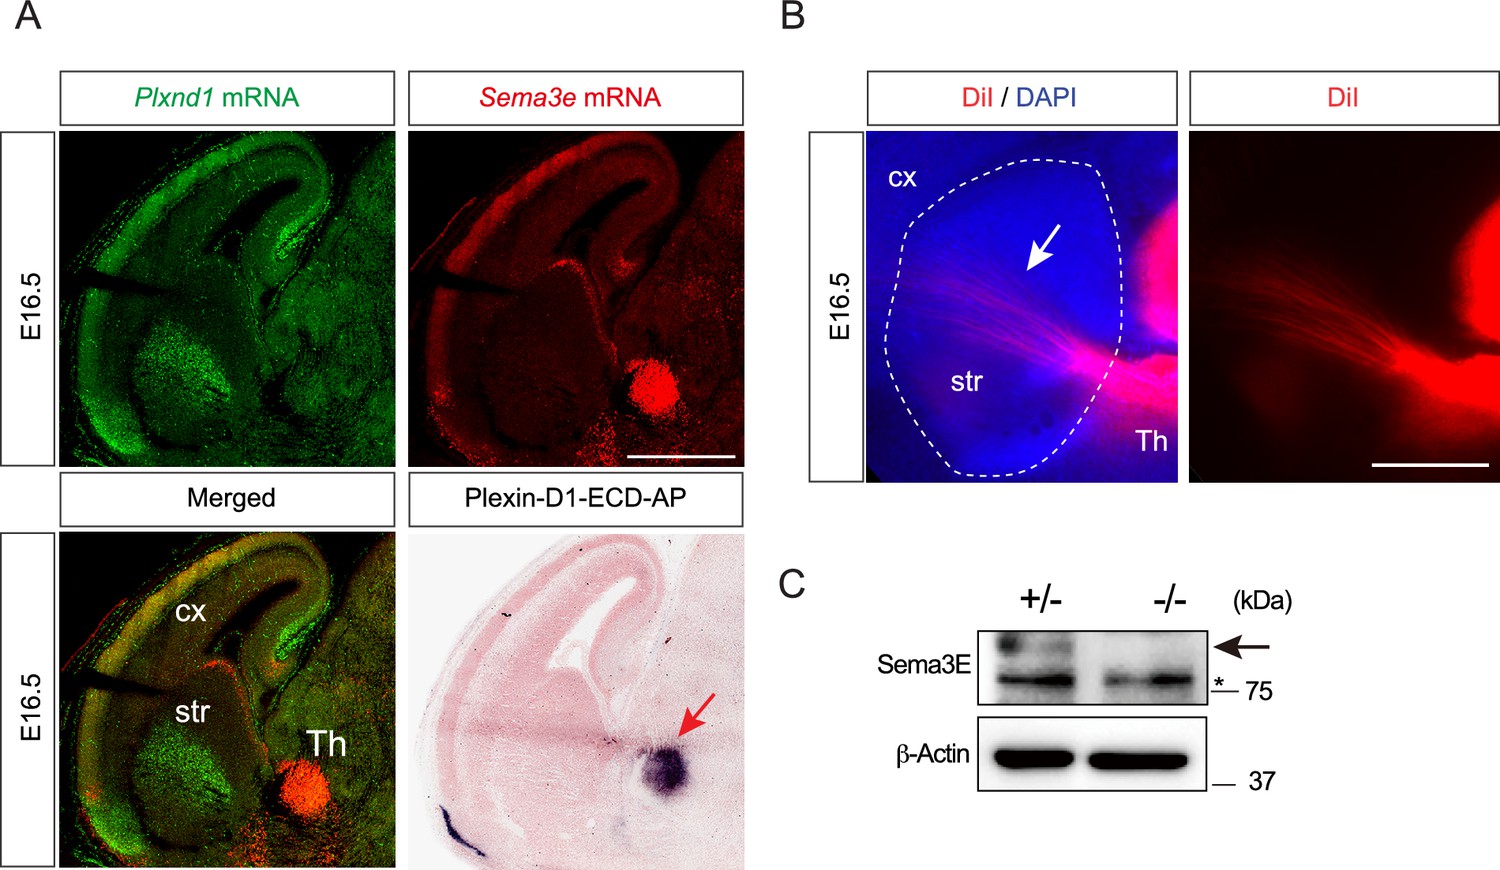
Sema3E expression through thalamostriatal projections at E16.5.
(A) The expression levels of Plxnd1 mRNA (green) and Sema3e mRNA (red) in the brains of E16.5 mice were detected by double fluorescence in situ hybridization. The red arrow in the bottom-right image indicates the Sema3E protein detected by AP-Plexin-D1-ECD (extracellular domain). Scale bar, 1 mm. (B) Thalamostriatal projections in the parasagittal sections of the brains at E16.5 were stained by DiI to visualize the projecting axons from neurons in the thalamus. Scale bar, 500 μm. (C) Sema3E protein in the striatum of E16.5 brains was detected by western blot analysis. * indicates a nonspecific band. cx, cortex; str, striatum; and Th, thalamus. .
-
Figure 1—figure supplement 2—source data 1
Western blots shown in Figure 1—figure supplement 2C.
- https://cdn.elifesciences.org/articles/96891/elife-96891-fig1-figsupp2-data1-v2.zip
Figure 2
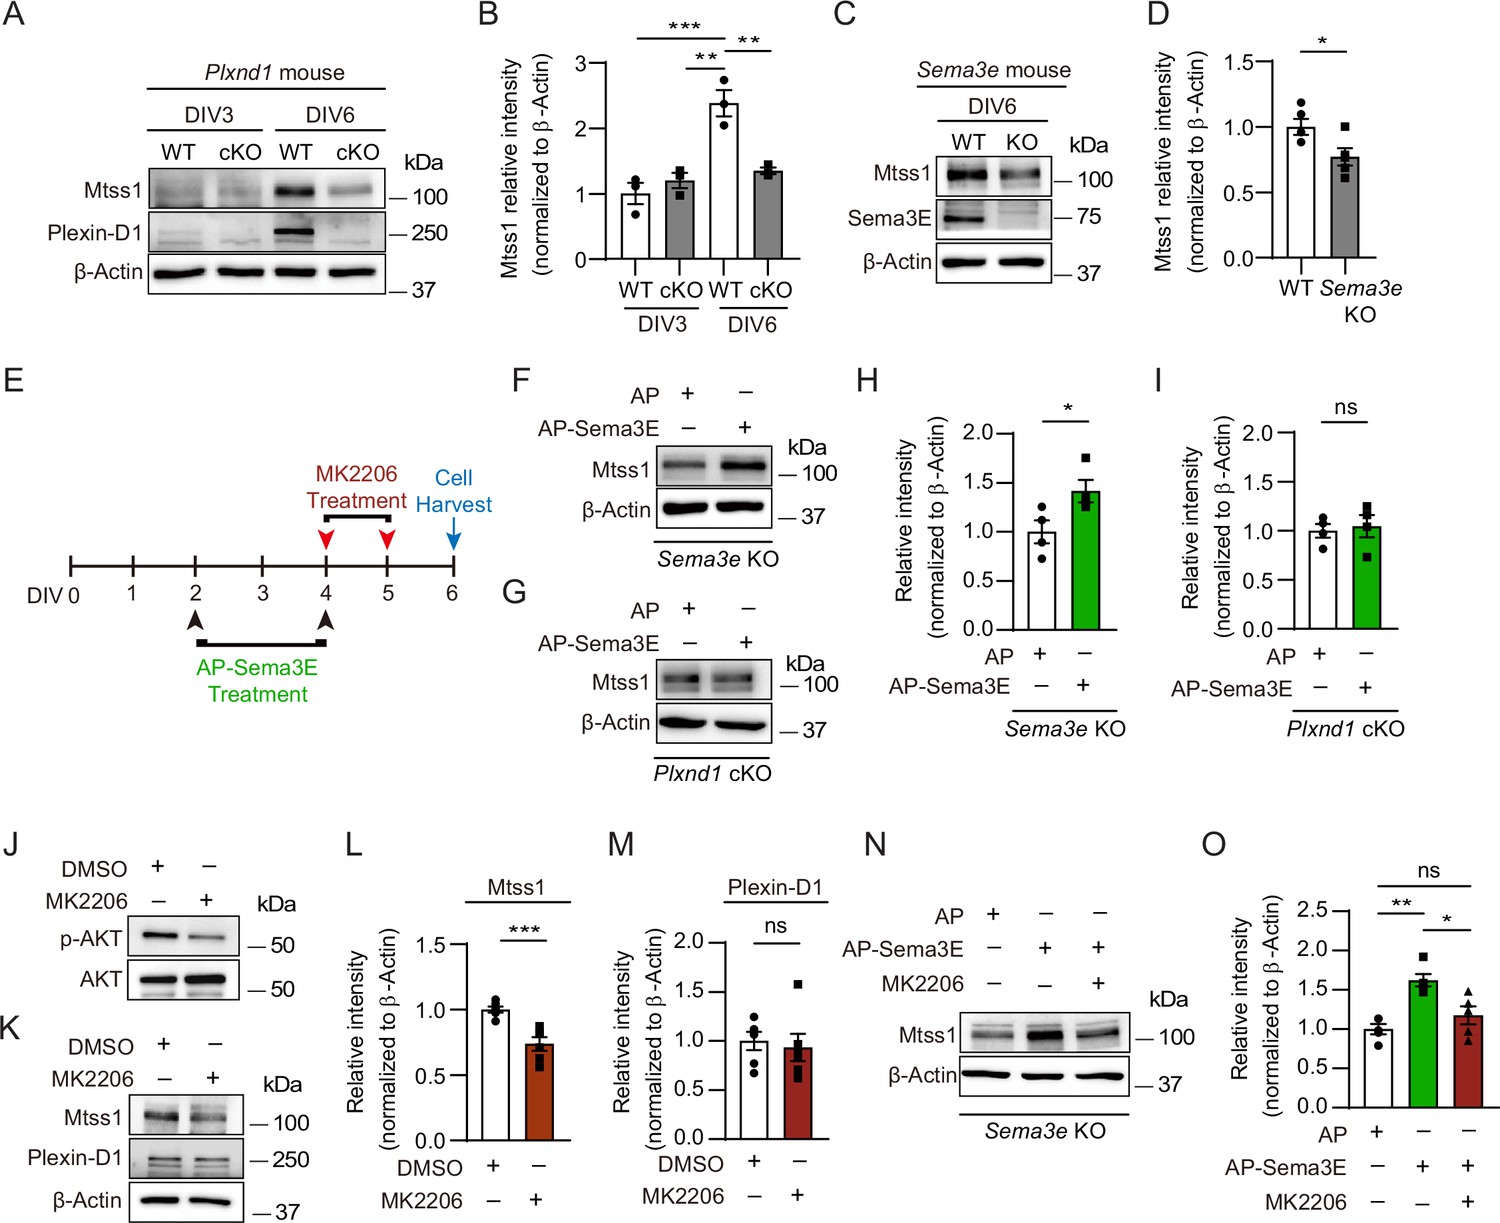
In cultured medium spiny neurons (MSNs), Mtss1 expression is directly regulated by Sema3E-Plexin-D1 signaling through the AKT pathway.
(A) Western blot images showing Mtss1 expression in MSNs derived from the striatum of wild-type (WT) or Plxnd1 conditional knockout (cKO) mice at P0 and measured at DIV3 and DIV6 in culture. (B) Quantification of band intensity in (A). Two-way ANOVA with Tukey’s post hoc correction for multiple comparisons; n = 3. (C) Mtss1 expression in MSNs obtained from the striatum of WT or Sema3e KO mice at P0 and measured at DIV6 in culture. (D) Quantification of the blots shown in (C). Student’s t-test; n = 5 for WT, n = 5 for KO in five independent experiments. (E) Schematic illustration of the experimental strategy for Sema3E-ligand or MK2206, an AKT inhibitor treatment in MSN culture. (F, G) Western blot images showing Mtss1 expression after AP-Sema3E (2 nM) treatment in cultured MSNs derived from Sema3e KO mice or Plxnd1 cKO mice. (H, I) Quantification of (F, G). Student’s t-test; AP, n = 4, AP-sema3E, n = 4 for sema3e KO mice, AP n = 4, AP-sema3E n = 4 for Plxnd1 cKO mice in three independent experiments. (J, K) Western blot to analyze the expression of Mtss1 and Plexin-D1 after MK2206 (100 nM) treatment in cultured MSNs and subsequent quantification for band intensity (L, M). Student’s t-test; n = 6 for sham, n = 6 for MK2206 in six independent experiments. (N O) Western blot image and analysis showing Mtss1 expression in Sema3e knockout MSNs treated with MK2206 after incubation with AP-Sema3E. Two-way ANOVA with Tukey’s post hoc correction for multiple comparisons; n = 5 in five independent experiments. Error bars, mean ± SEM; *p<0.05, **p<0.01, ***p<0.001 by indicated statistical tests. .
-
Figure 2—source data 1
Western blots shown in Figure 2A, C, F, G, J, K, and N.
- https://cdn.elifesciences.org/articles/96891/elife-96891-fig2-data1-v2.zip
Figure 3 with 1 supplement
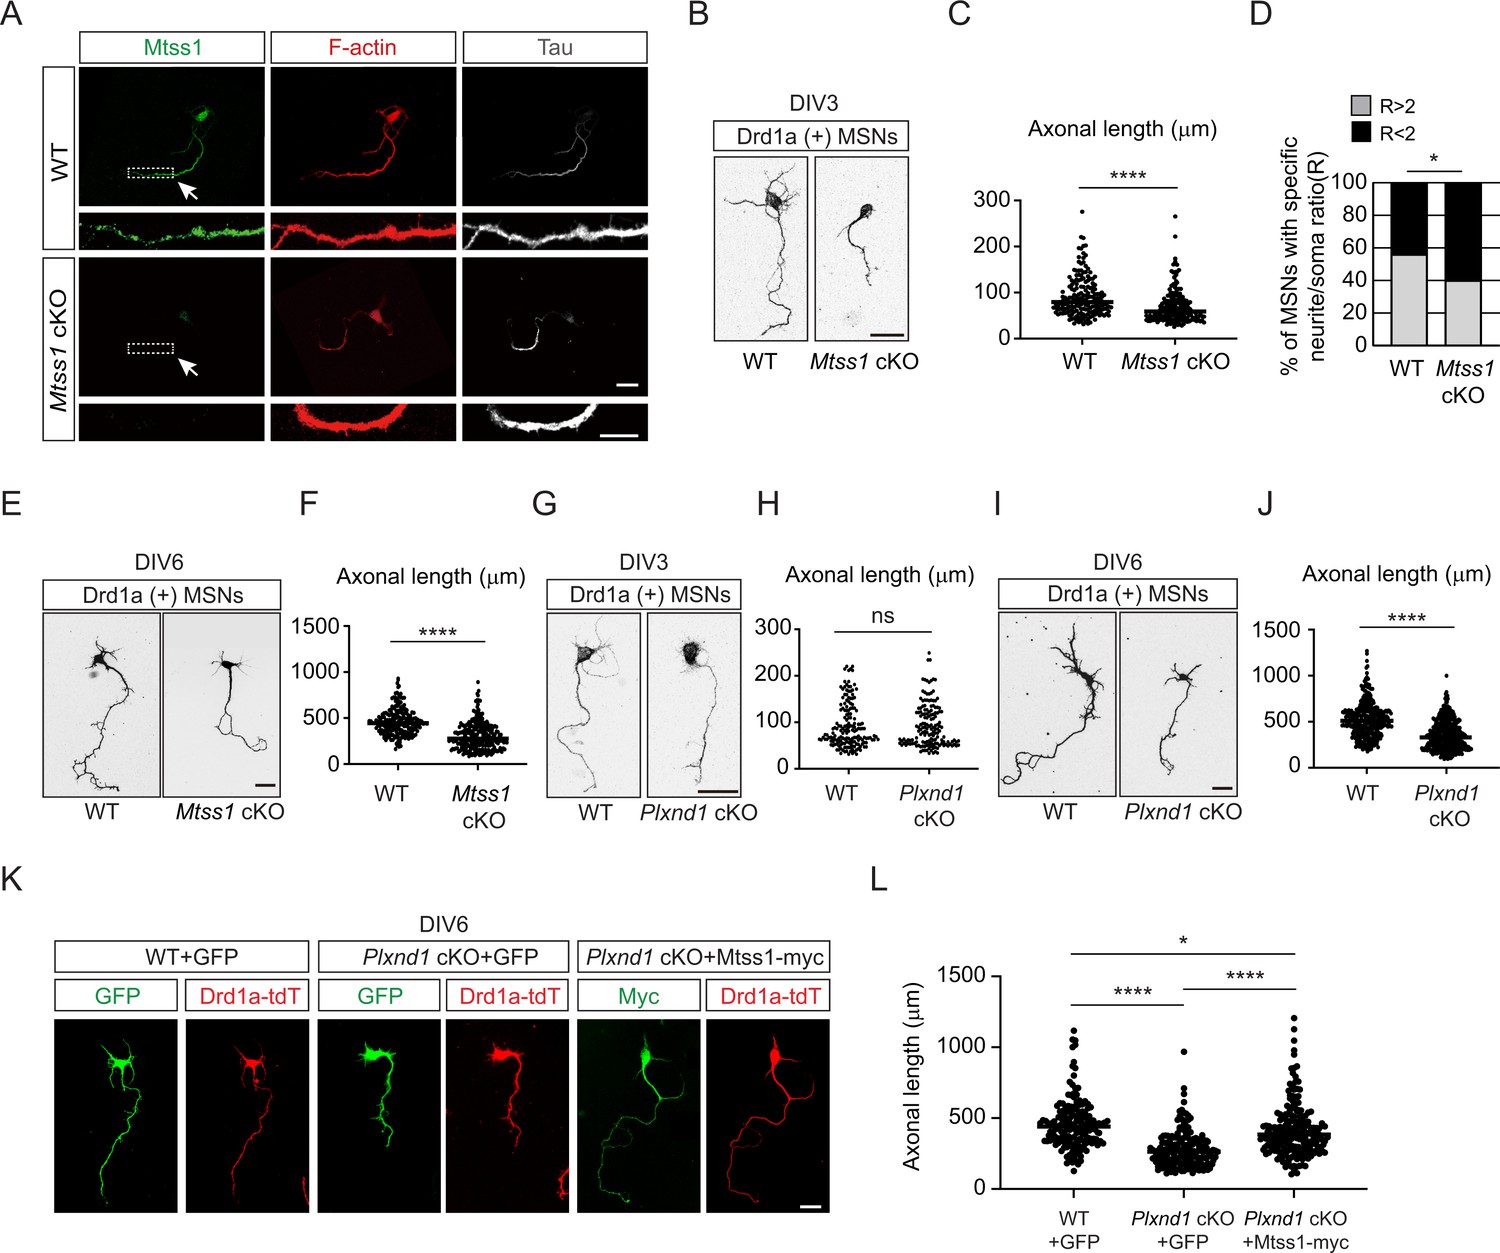
Mtss1 contributes to neurite extension of Drd1a-positive medium spiny neurons (MSNs) under the regulation of Sema3E-Plexin-D1 signaling.
(A) Immunocytochemistry for Mtss1 (green), Tau (gray), and F-actin (red) in cultured MSNs at DIV3 obtained from wild-type (WT) or Mtss1 conditional knockout (cKO) mice. White dotted boxes are shown in the inset image on the bottom. Scale bar, 10 μm. (B) Representative images of Drd1a+MSNs at DIV3 derived from WT (Drd1a-tdT; Mtss1f/f) or Mtss1 cKO (Drd1a-tdT; Nes-cre; Mtss1f/f) mice. Scale bar, 20 μm. (C) Quantification of neurite length in (B) was performed as previously reported (Chauvet et al., 2016). The values represent the average ratio of the fold change in length compared to the control samples. Student’s t-test; n = 179 for WT, n = 184 for Mtss1 cKO, in three independent experiments. (D) Percentage of Drd1a-positive MSNs with neurites shorter than twice the cell body diameter in (B, C). χ2 test; n = 48 for WT, n = 48 for Mtss1 cKO in four independent experiments. (E) Representative images of Drd1a+MSNs at DIV6 derived from WT (Drd1a-tdT; Mtss1f/f) or Mtss1 cKO (Drd1a-tdT; Nes-cre; Mtss1f/f) mice. Scale bar, 50 μm. (F) Quantification of neurite length in (E). Student’s t-test; n = 210 for WT, n = 260 for Mtss1 cKO in three independent experiments. (G) Representative images of Drd1a+MSNs at DIV3 derived from WT (Drd1a-tdT; Plxnd1f/f) or Plxnd1 cKO (Drd1a-tdT; Nes-cre; Plxnd1f/f) mice. Scale bar, 20 μm. (H) Quantification of neurite length in (G). Student’s t-test; n = 167 for WT, n = 159 for Plxnd1 cKO in three independent experiments. (I) Representative images of Drd1a+MSNs at DIV6 derived from WT or Plxnd1 cKO mice. Scale bar, 50 μm. (J) Quantification of neurite length in (I). Student’s t-test; n = 339 for WT, n = 403 for Plxnd1 cKO in three independent experiments. (K) Representative images of GFP- or Mtss1-myc-transfected-Drd1a+MSNs at DIV6 derived from WT or Plxnd1 cKO mice. Scale bar, 50 μm. (L) Quantification of neurite length in (K). Error bars, mean ± SEM; *p<0.05, ****p<0.0001 by one-way ANOVA with Tukey’s post hoc correction for multiple comparisons; n = 163 for WT + GFP, n = 187 for Plxnd1 cKO + GFP, n = 195 for Plxnd1 cKO + Mtss1-myc in three independent experiments. Error bars, mean ± SEM; ns p>0.05, *p<0.05, ****p<0.0001 by indicated statistical tests.
Figure 3—figure supplement 1
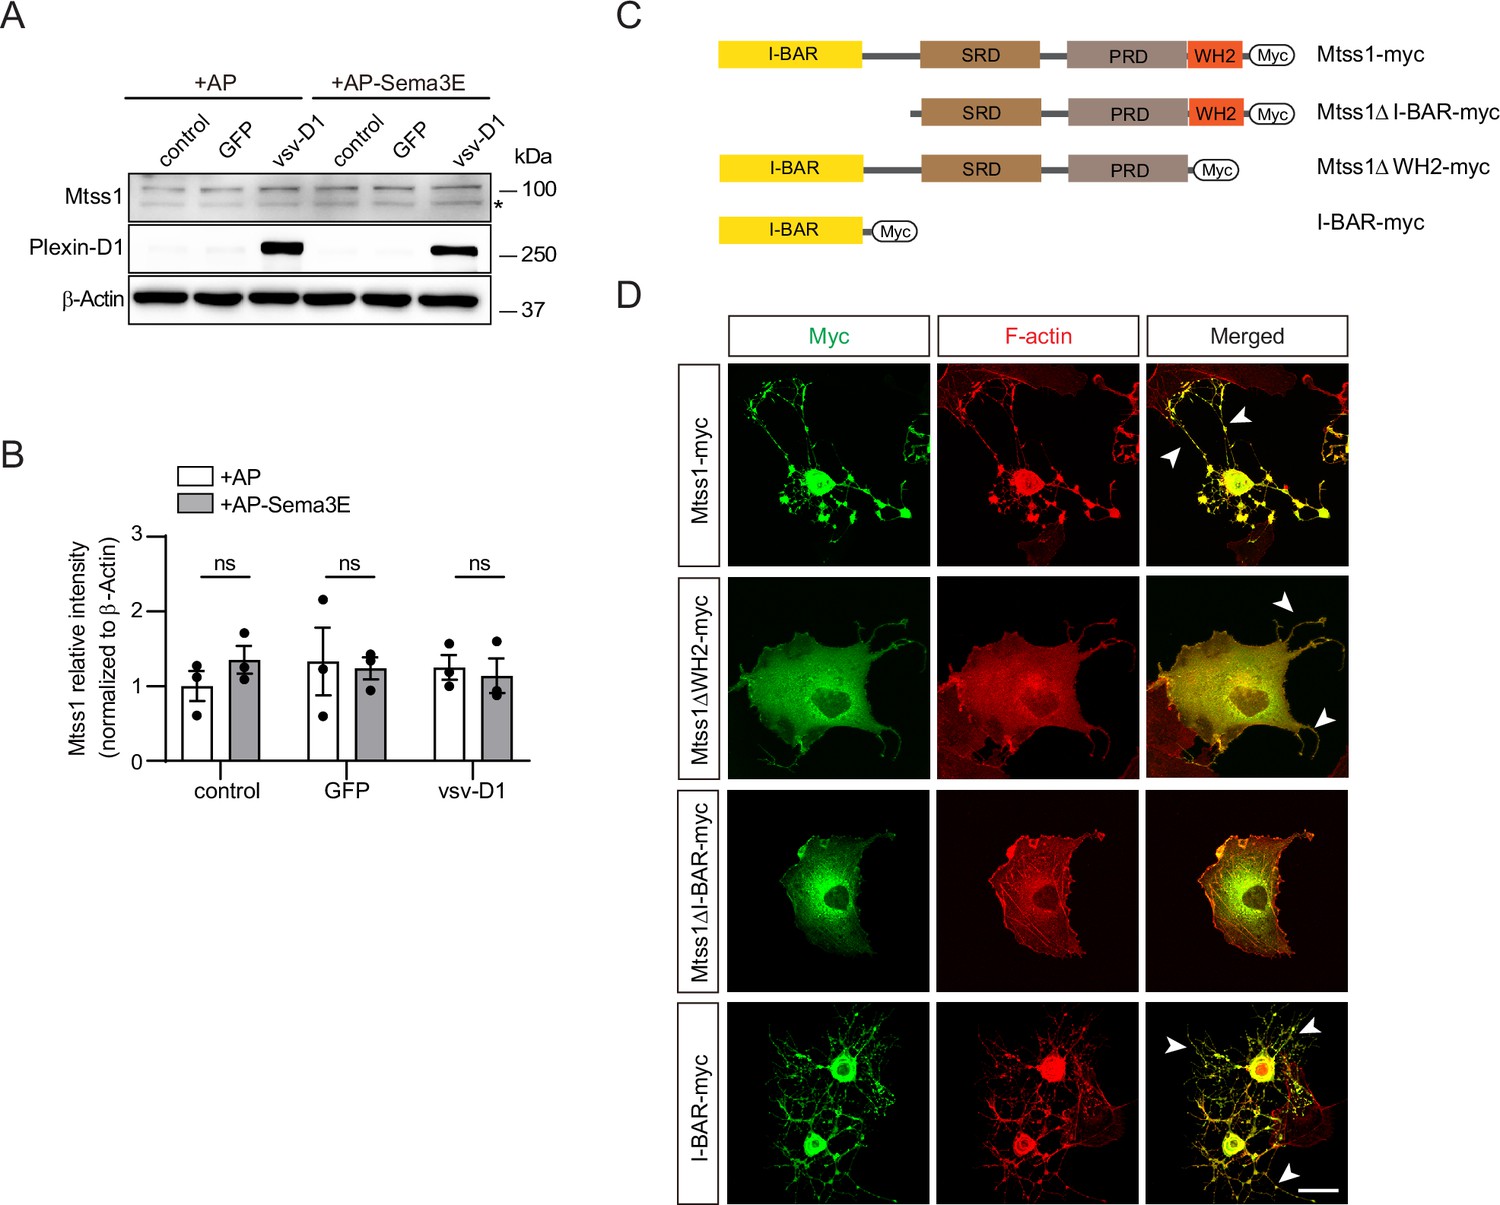
Expression of Mtss1 induces I-BAR domain-dependent morphological changes in COS7 cells, generating protrusions.
(A) Western blot images showing that weakly expression of endogenous Mtss1 was not altered by overexpression of Plexin-D1 with or without Sema3E in COS7 cells. Asterisk indicates nonspecific band. (B) Quantification of the band intensity in (A). Error bars, mean ± SEM; ns p>0.05 by two-way ANOVA with Bonferroni’s post hoc correction for multiple comparisons; n = 3. (C) Schematics describing the full-length construct of Mtss1-myc and its deletion mutant constructs (Mtss1ΔI-BAR-myc, Mtss1ΔWH2-myc, and I-BAR-myc). (D) Immunocytochemistry images taken after overexpression of each construct. Constructs show the I-BAR domain leading to diverse cell protrusion morphologies. Some of the protrusions were excessively spiked or thin and long (arrowheads). Overexpression of the I-BAR domain only (I-BAR-myc) can induce extreme protrusion structures. Scale bar, 20 μm.
-
Figure 3—figure supplement 1—source data 1
Western blots shown in Figure 3—figure supplement 1A.
- https://cdn.elifesciences.org/articles/96891/elife-96891-fig3-figsupp1-data1-v2.zip
Figure 4 with 1 supplement
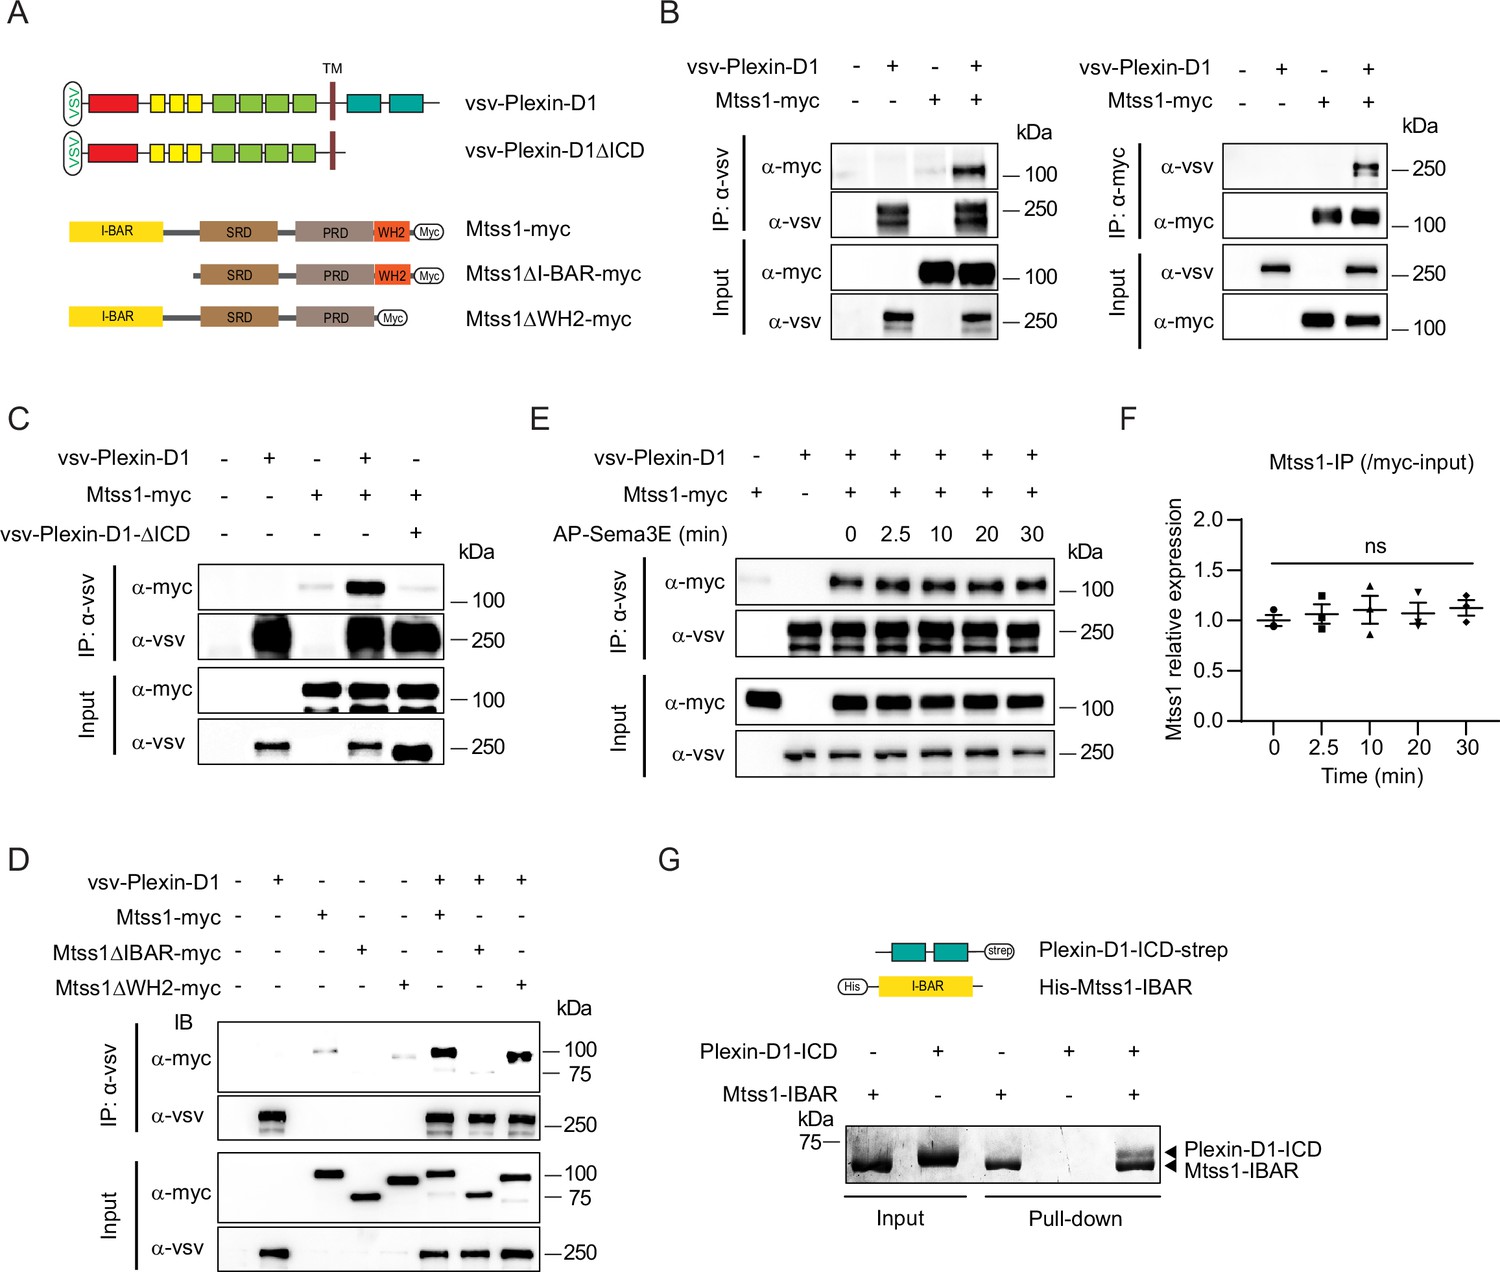
The Mtss1 I-BAR domain directly binds to Plexin-D1, independent of Sema3E.
(A) Schematics depicting full-length constructs of Mtss1 and its truncation mutants. (B) Coimmunoprecipitation and immunoblot analysis of HEK293T cells transfected with Mtss1-myc with vsv-Plexin-D1. The interaction between Mtss1 and Plexin-D1 was investigated by immunoprecipitation with anti-vsv (left) or anti-myc (right) antibodies and subsequent western blotting with reciprocal antibodies. (C) Immunoprecipitation and western blot analysis after Plexin-D1 and Mtss1 overexpression. The vsv-Plexin-D1ΔICD did not bind to Mtss1-myc. (D) Immunoprecipitation and western blot assays to identify the binding domain in Mtss1 that interacts with Plexin-D1. (E) The interaction between Mtss1 and Plexin-D1 was assessed over time following treatment with Sema3E (2 nM) and was not affected by AP-Sema3E treatment. (F) Graph quantifying the band intensity in (E). Error bars, mean ± SEM; ns p>0.05 by two-way ANOVA with Bonferroni’s post hoc correction for multiple comparisons; n = 3 in three independent experiments. (G) Pull-down assay and visualization of the protein bands using Coomassie staining. His-Mtss1-IBAR binds directly to Plexin-D1-ICD-strep.
-
Figure 4—source data 1
Western blots and gel shown in Figure 4B, C, D, E, and G.
- https://cdn.elifesciences.org/articles/96891/elife-96891-fig4-data1-v2.zip
Figure 4—figure supplement 1
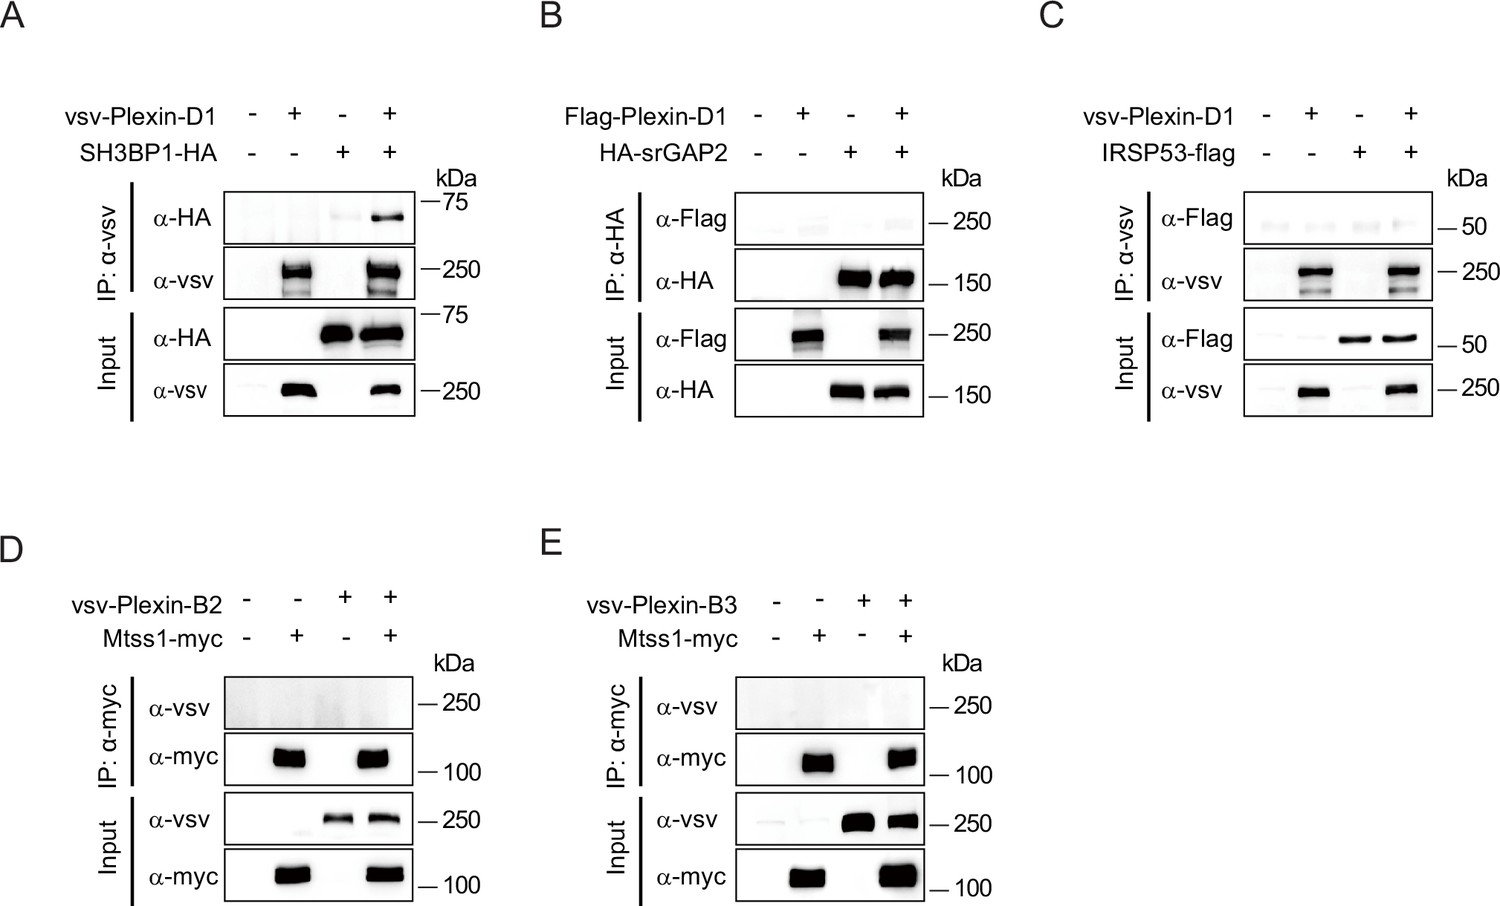
The interaction between BAR domain-containing proteins and Plexin-D1, or between Mtss1 and Plexin family proteins.
(A–C) Coimmunoprecipitation and immunoblot analysis of HEK293T cells transfected with BAR family genes (SH3BP1-HA (N-BAR), HA-srGAP2 (F-BAR), and IRSP53-Flag (I-BAR)) with vsv-Plexin-D1. (D, E) Immunoprecipitation and western blot analysis after overexpression of Mtss1-myc and Plexin proteins (vsv-Plexin-B2 and vsv-Plexin-B3). The vsv-Plexin-B2 and vsv-Plexin-B3 did not bind to Mtss1-myc.
-
Figure 4—figure supplement 1—source data 1
Western blots shown in Figure 4—figure supplement 1A–E.
- https://cdn.elifesciences.org/articles/96891/elife-96891-fig4-figsupp1-data1-v2.zip
Figure 5 with 2 supplements
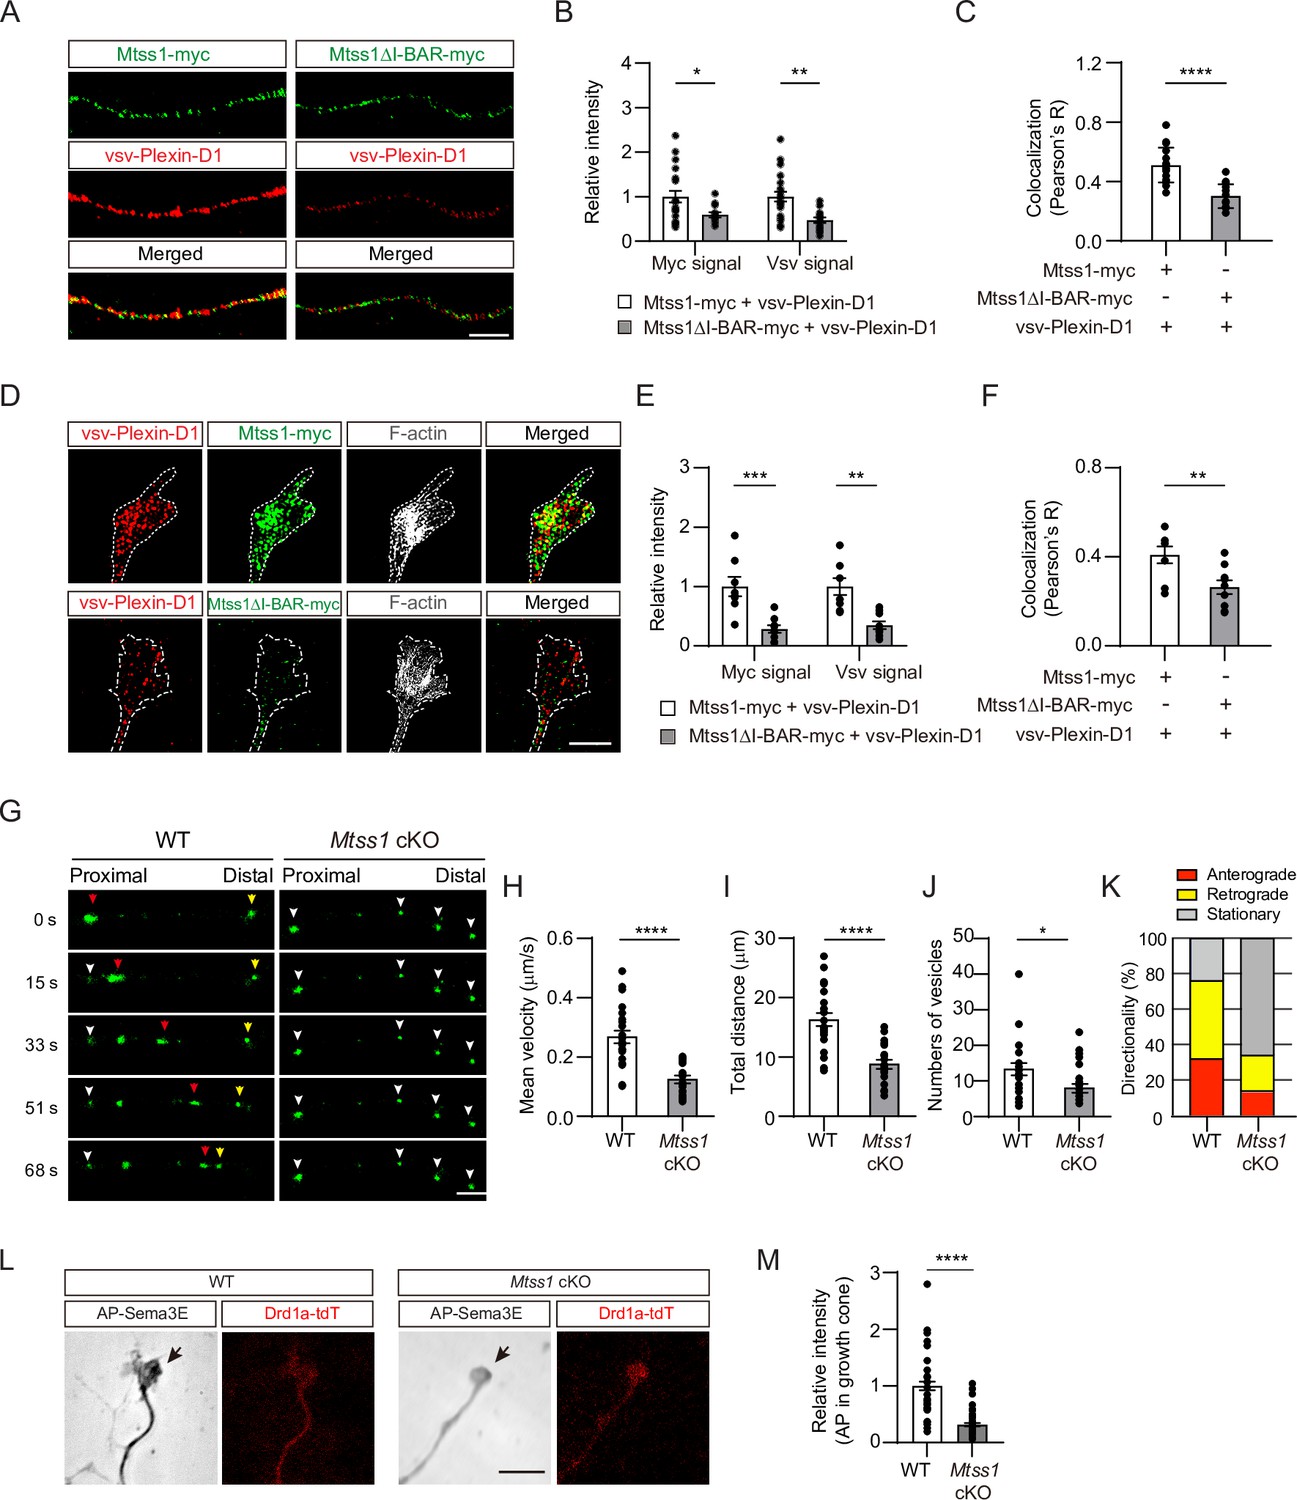
Mtss1 facilitates Plexin-D1 transport to the growth cone in cultured Drd1a-positive medium spiny neurons (MSNs).
(A) Immunocytochemistry for Mtss1-myc or Mtss1ΔI-BAR -myc (green), vsv-Plexin-D1 (red) in the axons of MSNs transfected with vsv-Plexin-D1 and Mtss1-myc or Mtss1ΔI-BAR-myc, using Mtss1-null mice as a background. The images were acquired using structured illumination microscopy (N-SIM). Scale bar, 5 μm. (B) Quantification of the fluorescence intensity in the axons of (A). Two-way ANOVA with Tukey’s post hoc correction for multiple comparisons; vsv-Plexin-D1+Mtss1-myc, n = 21, and vsv-Plexin-D1+Mtss1ΔI-BAR-myc, n = 14. (C) Quantification of colocalization by Pearson’s correlation coefficient calculated using Costes’ randomized pixel scrambled image method. Student’s t-test; vsv-Plexin-D1+Mtss1-myc, n = 21, and vsv-Plexin-D1+Mtss1ΔI-BAR-myc, n = 14. (D) Immunocytochemistry for vsv-Plexin-D1 (red), Mtss1-myc (green), and F-actin (gray) in the growth cones of MSNs transfected with vsv-Plexin-D1 and Mtss1-myc or Mtss1ΔI-BAR-myc originating from Mtss1-null mice. Scale bar, 5 μm. (E) Quantification of the intensities in the growth cones. The values represent the average fold change in expression compared to the control samples (vsv-Plexin-D1+Mtss1-myc). Two-way ANOVA with Tukey’s post hoc correction for multiple comparisons; vsv-Plexin-D1+Mtss1-myc, n = 8, and vsv-Plexin-D1+Mtss1ΔI-BAR-myc, n = 9. (F) Quantification of colocalization by Pearson’s correlation coefficient calculated using Costes’ randomized pixel scrambled image method. Student’s t-test; vsv-Plexin-D1+Mtss1-myc, n = 8, and vsv-Plexin-D1+Mtss1ΔI-BAR-myc, n = 9. (G) Representative time-lapse images of Plexin-D1-GFP-positive vesicles (green) from wild-type or Mtss1 conditional knockout (cKO) MSNs at DIV6. Plexin-D1-positive vesicles transported toward distal or proximal directions are indicated by red and yellow arrowheads, respectively. White arrowheads indicate stationary vesicles. A mean velocity of less than 0.1 μm/s was considered to be a stationary condition. See Videos 1–4. Scale bar, 5 μm. (H–J) Quantification of mean velocity (H), total travel distance (I), and number of vesicles (J) along neurites of Plexin-D1-positive vesicles. Student’s t-test; n = 23 for WT, n = 25 for Mtss1 cKO in four independent experiments. (K) Distribution analysis of vesicle directionality. (L) The AP-Sema3E binding assay was performed to visualize Plexin-D1 protein (black arrows) in the growth cones of WT or Plxnd1-deficient MSNs. Scale bar, 10 μm. (L) The AP-Sema3E binding assay performed to visualize Plexin-D1 protein (black arrows) in the growth cones of WT or Mtss1-deficient MSNs. Localization of Plexin-D1 (black arrows) in the growth cone investigated in cultured MSNs from WT (Drd1a-tdT; Mtss1f/f) or Mtss1 cKO (Drd1a-tdT; Nes-cre; Mtss1f/f) mice. (M) Quantification of Plexin-D1 intensity shown in (L). Mann‒Whitney test; WT n = 51, KO n = 50. Error bars in all graphs, mean ± SEM; *p<0.05, **p<0.01, ***p<0.001. ****p<0.0001 by indicated statistical tests.
Figure 5—figure supplement 1
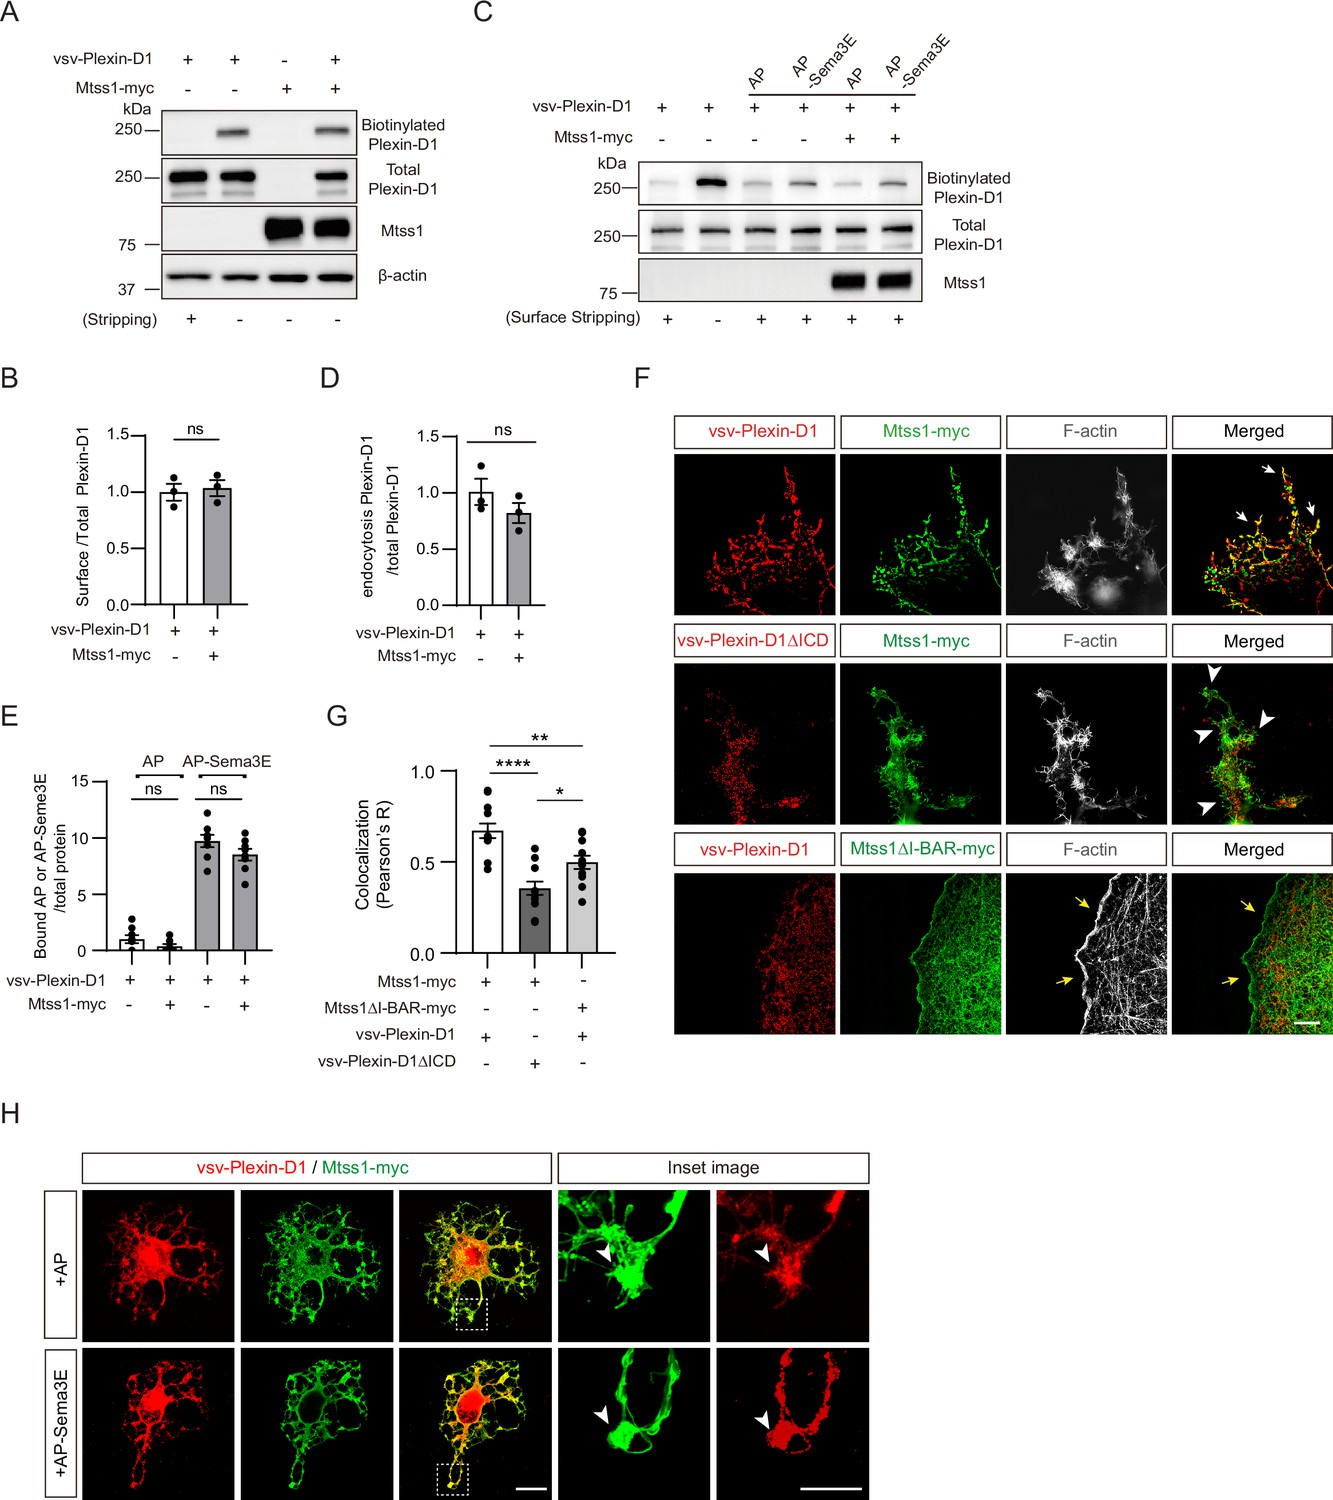
Mtss1 expression alters Plexin-D1 localization to the protrusion structure in COS7 cells without affecting its endocytosis or Sema3E binding.
(A) Cell surface biotinylation and subsequent Western blot analysis to analyze the surface localization of Plexin-D1 in COS7 cells. (B) Quantification of the surface Plexin-D1 level as shown in (A). The values represent the averages of the fold ratios compared to those of total Plexin-D1. Error bars, mean ± SEM; ns p>0.05 by Student’s t-test; n = 3. (C) Endocytosed biotinylated vsv-PlexinD1 was detected by western blot analysis following cell surface stripping in the presence or absence of AP-Sema3E (2 nM). (D) Quantification of the band intensity shown in (C). The values in the graph represent the average fold change compared to the expression in control samples (vsv-Plexind1 treated with AP-Sema3E). (E) AP-Sema3E binding assay to test the effect of Mtss1 on the interaction between Sema3E and Plexin-D1. Error bars, mean ± SEM; ns p>0.05 by Kruskal‒Wallis test with Dunn’s post hoc correction for multiple comparisons; n = 8 for vsv-Plexin-D1+AP; n = 7 for vsv-Plexin-D1+Mtss1-myc+AP, n = 8 for vsv-Plexin-D1+Mtss1-myc+AP, and n = 8 for vsv-Plexin-D1+Mtss1-myc+AP-Sema3E, in three independent experiments. (F) Immunocytochemistry for vsv-Plexin-D1 (red), Mtss1-myc (green), and F-actin (gray) in COS7 cells. Images were obtained by structured illumination microscopy (N-SIM). White arrows (top) indicate colocalized Plexin-D1 and Mtss1 in the protrusion structure. White arrowheads (middle) indicate high Mtss1 levels localized in cell protrusions without Plexin-D1. Yellow arrows (bottom) indicate the normal cell surface with Mtss1ΔI-BAR but no Plexin-D1 colocalization. Scale bar, 5 μm. (G) Quantification of colocalization rates shown in (F) between vsv signals and myc signals was assessed by Pearson’s correlation coefficient calculated using Costes’ randomized pixel scrambled image method. Error bars, mean ± SEM; *p<0.05, **p<0.01, ****p<0.0001 by one-way ANOVA with Tukey’s post hoc correction for multiple comparisons; vsv-Plexin-D1+Mtss1 myc, n = 12; vsv-Plexin-D1ΔICD + Mtss1-myc, n = 12; vsv-Plexin-D1+Mtss1DI-BAR-myc, n = 11. (H) Immunocytochemistry for vsv-Plexin-D1 (red) and Mtss1-myc (green) with or without AP-Sema3E in COS7 cells. The white dotted boxes are magnified in the panels on the right. The presence of Sema3E did not affect the positioning of Plexin-D1 and Mtss1 within the protrusion (arrowheads). Scale bars, 50 μm (left) and 20 μm (magnified images on the right two panels).
-
Figure 5—figure supplement 1—source data 1
Western blots shown in Figure 5—figure supplement 1A and C.
- https://cdn.elifesciences.org/articles/96891/elife-96891-fig5-figsupp1-data1-v2.zip
Figure 5—figure supplement 2
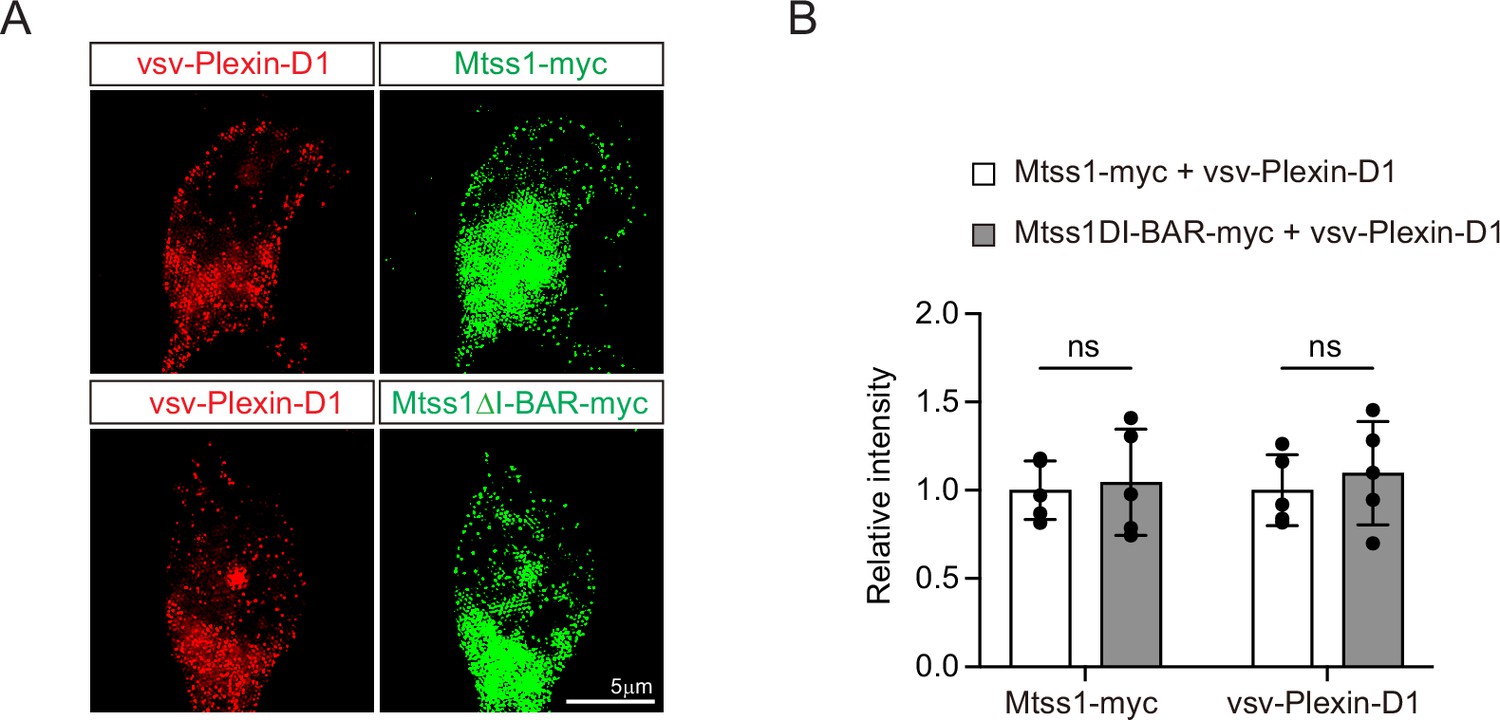
No significant alteration in the expression of vsv-Plexin-D1 or Mtss1-myc or Mtss1ΔI-BAR-myc in the medium spiny neuron (MSN) soma.
(A) Representative image of Immunocytochemistry for vsv-Plexin-D1 (red), Mtss1-myc or Mtss1ΔI-BAR -myc (green) in the cell body of cultured MSNs transfected with vsv-Plexin-D1 and Mtss1-myc or Mtss1ΔI-BAR-myc, using Mtss1-null mice as a background. (B) Quantification of the fluorescence intensity in the cell body of (A). Error bars, mean ± SEM; ns p>0.05 by two-way ANOVA with Tukey’s post hoc correction for multiple comparisons; vsv-Plexin-D1+Mtss1 myc, n = 5, and vsv-Plexin-D1+Mtss1ΔI-BAR-myc, n = 5. Scale bar, 5 μm.
Figure 6
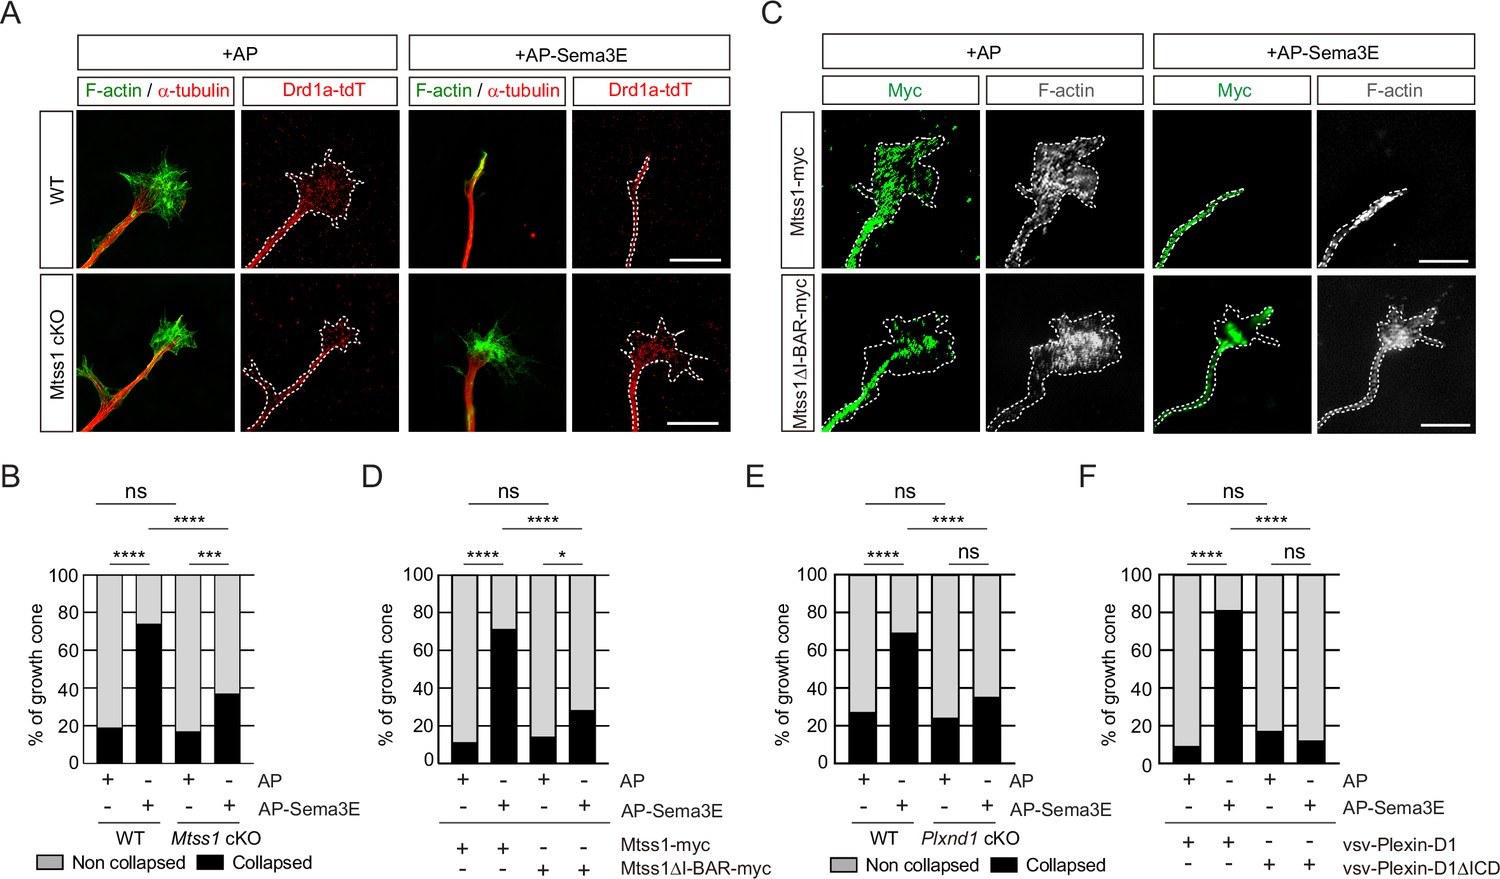
The repulsive response through Sema3E-Plexin-D1 signaling is attenuated in the absence of Mtss1.
(A) A growth cone collapse assay in the presence or absence of Sema3E (2 nM) was performed with medium spiny neuron (MSN) cultures derived from wild-type (WT) (Drd1a-tdT; Mtss1f/f) or Mtss1-KO (Drd1a-tdT; Nes-cre; Mtss1f/f) mice at DIV3. Scale bar, 10 μm. The images were obtained from structured illumination microscopy (N-SIM). (B) Quantification of collapsed growth cones in (A). Error bars, mean ± SEM; ***p<0.001, ****p<0.0001 by χ2 test; WT + AP, n = 155, WT + AP-Sema3E, n = 163, KO + AP, n = 149, KO + AP-Sema3E, n = 149. (C) A growth cone collapse assay in the presence or absence of Sema3E (2 nM) was performed with MSN cultures following ectopic expression of Mtss1-myc or Mtss1ΔΙ−ΒΑR-myc in the Mtss1-null background at DIV3. Scale bar, 10 μm. (D) Quantification of collapsed growth cones in (C). Error bars, mean ± SEM; ***p<0.001, ****p<0.0001 by χ2 test; Mtss1-myc+AP, n = 28, Mtss1-myc+AP-Sema3E, n = 28, Mtss1ΔI-BAR-myc+AP, n = 28, Mtss1ΔΙ−ΒΑR-myc+AP-Sema3E, n = 43. (E) Quantification of the collapse assay in the presence or absence of Sema3E (2 nM) was performed with MSN cultures at DIV6 from WT (Drd1a-tdT; Plxnd1f/f) or Plxnd1-KO (Drd1a-tdT; Nes-cre; Plxnd1f/f) mice. ****p<0.0001 by χ2 test; WT + AP, n = 44, WT + AP-Sema3E, n = 45, KO + AP, n = 45, KO + AP-Sema3E, n = 46. in three independent experiments. (F) Quantification of a growth cone collapse assay in the presence or absence of Sema3E (2 nM) was performed with MSN cultures following ectopic expression of vsv-Plexin-D1 or vsv-Plexin-D1ΔICD in the Plxnd1-KO background at DIV6. ****p<0.0001 by χ2 test; vsv-Plexin-D1+AP, n = 35, vsv-Plexin-D1+AP-Sema3E, n = 32, vsv-Plexin-D1ΔICD + AP, n = 30, vsv-Plexin-D1ΔICD + AP-Sema3E, n = 26 in three independent experiments. tdT, tdTomato.
Figure 7 with 4 supplements
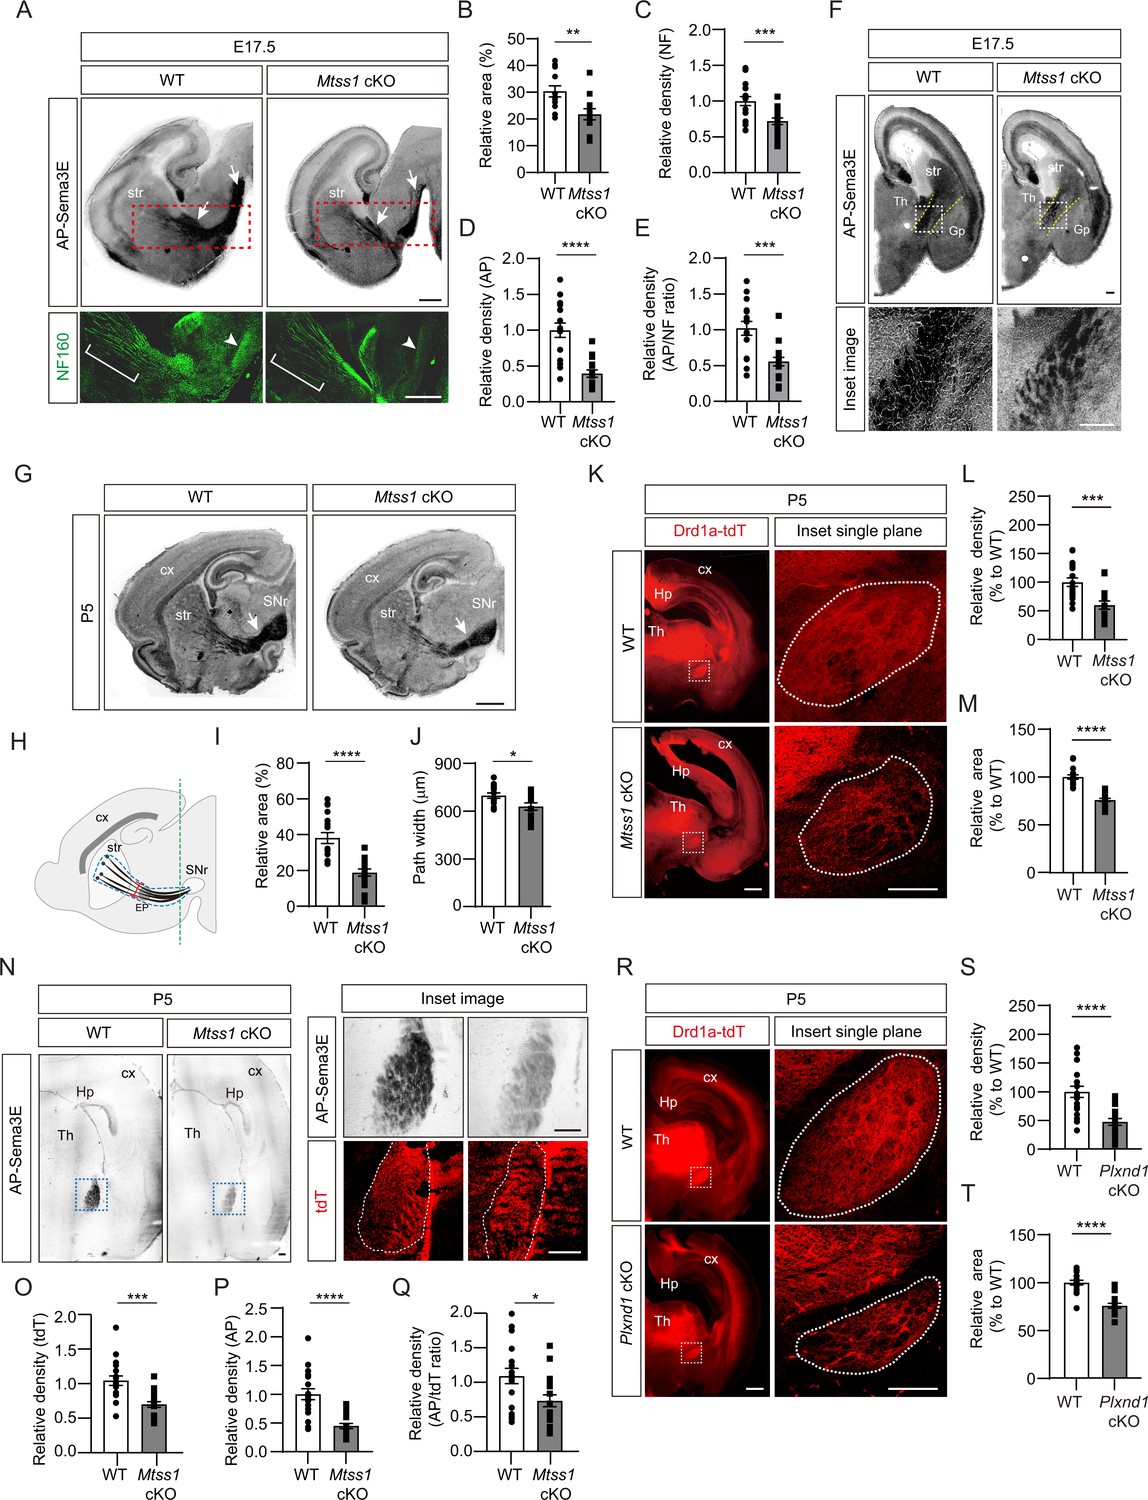
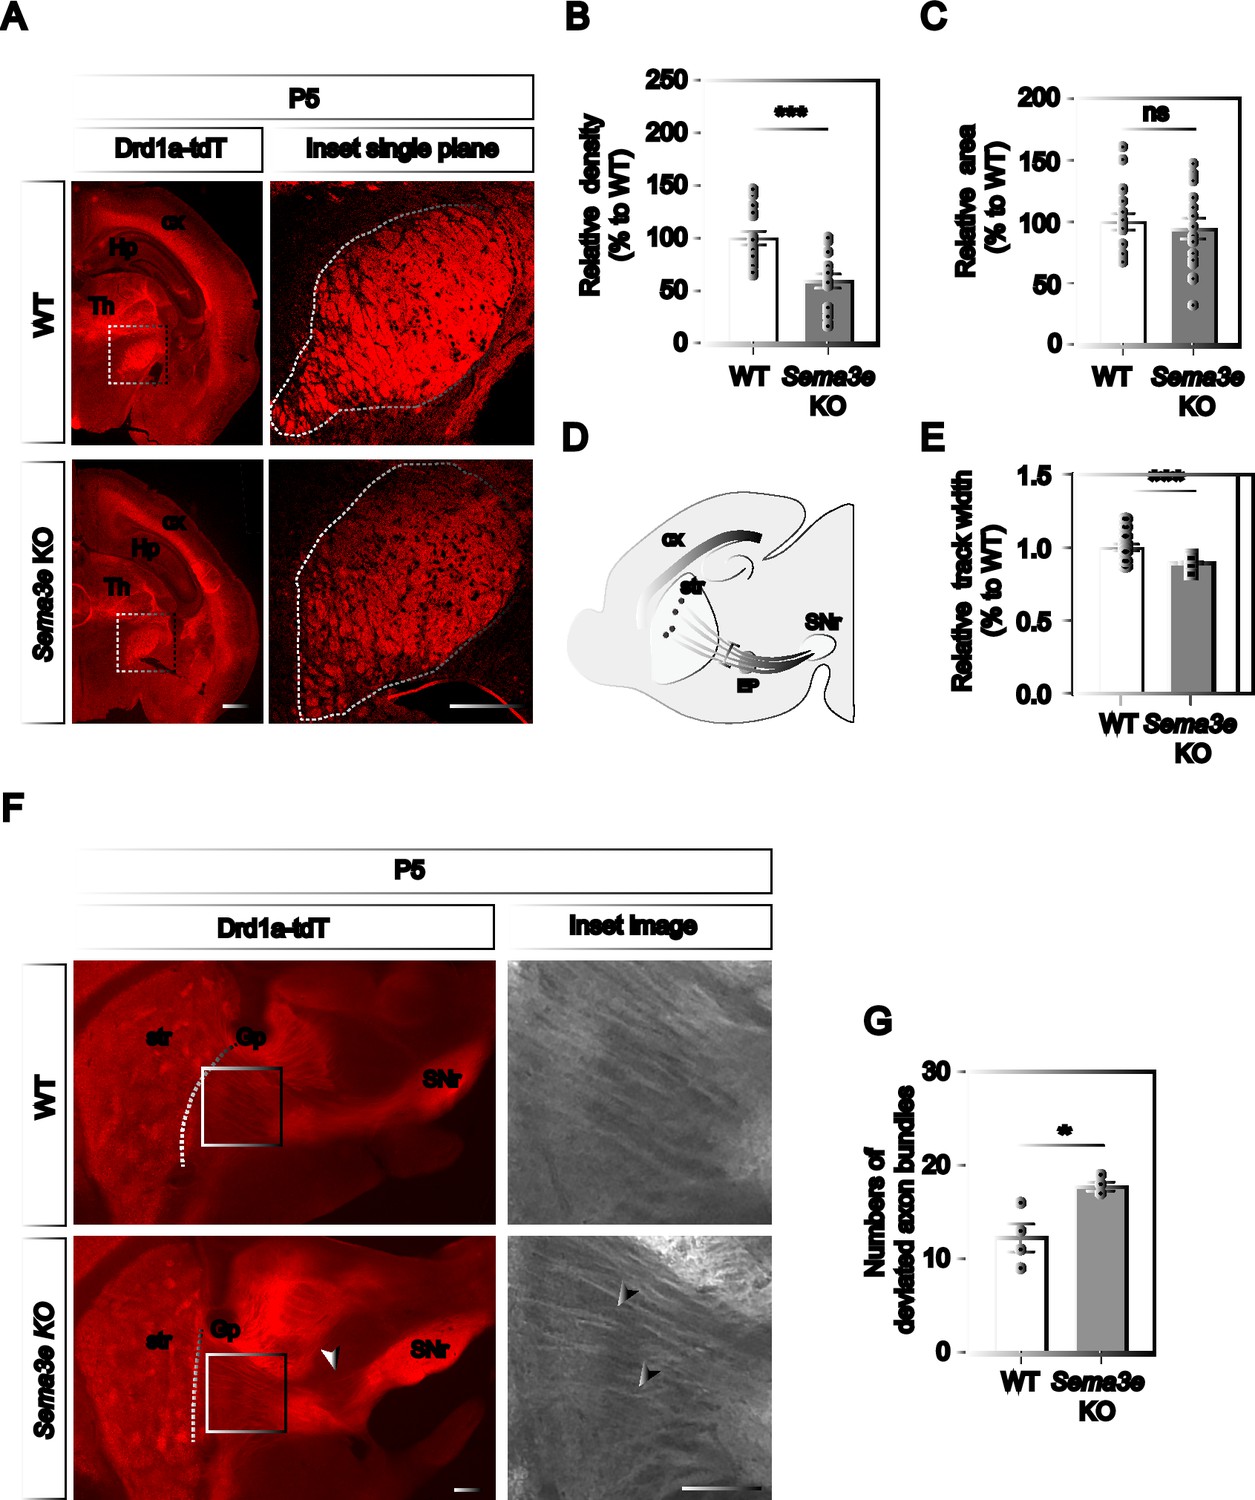
A reduced number of Plexin-D1 molecules localize to the developing striatonigral projections in Mtss1-deficient mice.
(A) AP-Sema3E binding assay (top) to detect Plexin-D1 expression (white arrows) in striatonigral projections and immunohistochemistry (bottom) for neurofilaments (NFs) indicated by red dotted square, performed in adjacent parasagittal sections at E17.5 of wild-type (WT) or Mtss1 conditional knockout (cKO) mice. The diminished projections are marked by white brackets (middle of the striatum) and arrowheads (near substantia nigra regions). Scale bar, 500 μm. (B) Quantification of the Plexin-D1-positive area in the total striatonigral projection at E17.5 of WT or Mtss1 cKO mice. Student’s t-test; WT, n = 12, KO, n = 12 (three sections/mouse). (C) Quantification of the fluorescence density (intensity/area) of NF in striatonigral projections at E17.5 in WT or Mtss1 cKO mice. Student’s t-test; WT, n = 16, KO, n = 17 (three or four sections/mouse). (D) Quantification of the AP density (intensity/area) in striatonigral projections at E17.5 in WT or Mtss1 cKO mice. Student’s t-test; WT, n = 16, KO, n = 17 (three or four sections/mouse). (E) The ratio of AP to NF density (intensity/area). Student’s t-test; WT, n = 16, KO, n = 17 (three or four sections/mouse). (F) Coronal view of Plexin-D1 localization in striatonigral projections at E17.5 in WT or Mtss1 cKO mice. Yellow dotted lines indicate the corridor between the thalamus and globus pallidus. Insets show the images in dotted boxes at higher resolution. Scale bar, 200 μm. (G) Representative images of Plexin-D1 molecules in striatonigral projections visualized by AP-Sema3E binding assay in WT or Mtss1 cKO mice at P5. White arrows indicate striatonigral projections. Scale bar, 1 mm. (H) Schematic representing the quantified region. The dotted blue lines indicate the striatonigral projection-covering areas. The width (red segment) of the striatonigral tract was measured as previously described (Burk et al., 2017). (I, J) Quantification of the Plexin-D1-positive area (%) in dotted blue area and projection width at P5 according to the scheme shown in (H). Mann‒Whitney test (I) and Student’s t-test (J). n = 18 (three sections/mouse). (K) Immunohistochemistry of coronal sections of striatal projections labeled with td-Tomato endogenously expressed through the Drd1a promotor in WT (Drd1a-tdT; Mtss1f/f) or Mtss1 cKO mice (Drd1a-tdT; Nes-cre; Mtss1f/f) at P5. The white dotted boxes on the left images are shown in the inset images on the right, which were captured in a single plane using a high-resolution confocal microscope. Scale bar, 500 μm. (L, M) Quantification of the density (intensity/area) (L) and area size (M) of the striatonigral projection in the dotted region in the inset images. Mann‒Whitney test (L) and Student’s t-test (M); n = 18 per group (six sections/mouse). (N) AP-Sema3E binding assay and tdT immunostaining in adjacent sections of WT or Mtss1 cKO mice located near the SNr. The green line in (H) indicates the location for cross-sectioning. The inset images of Plexin-D1-positive striatonigral projections were taken from the blue dotted boxes on the left panels. The dotted white lines indicate the tdT-positive striatonigral projections. Scale bar, 200 μm. (O, P) Quantification of the density (intensity/area) of tdT (O) and AP (P) of striatonigral projections WT or Mtss1 cKO mice. (Q) The ratio of AP to tdT density (intensity/area). Student’s t-test; WT, n = 18, KO, n = 18 (six sections/mouse). (R) Immunohistochemistry of coronal views of striatonigral projections in WT (Drd1a-tdT; Plxnd1f/f) or Plxnd1 cKO mice (Drd1a-tdT; Nes-cre; Plxnd1f/f) at P5. The white dotted boxes on the left images are shown in the inset images on the right, which were obtained using a high-resolution confocal microscope in a single plane. Scale bar, 500 μm. (S, T) Quantification of the density (intensity/area) of tdT (S) and area size (T). Student’s t-test; n = 18 per group (six sections/mouse). Error bars, mean ± SEM; *p<0.05, **p<0.01, ***p<0.001. ****p<0.0001 by indicated statistical tests. str, striatum; cx, cortex; Th, thalamus; SNr, substantia nigra; EP, entopeduncular nucleus; Gp, globus pallidus; Hp, hippocampus.
Figure 7—figure supplement 1
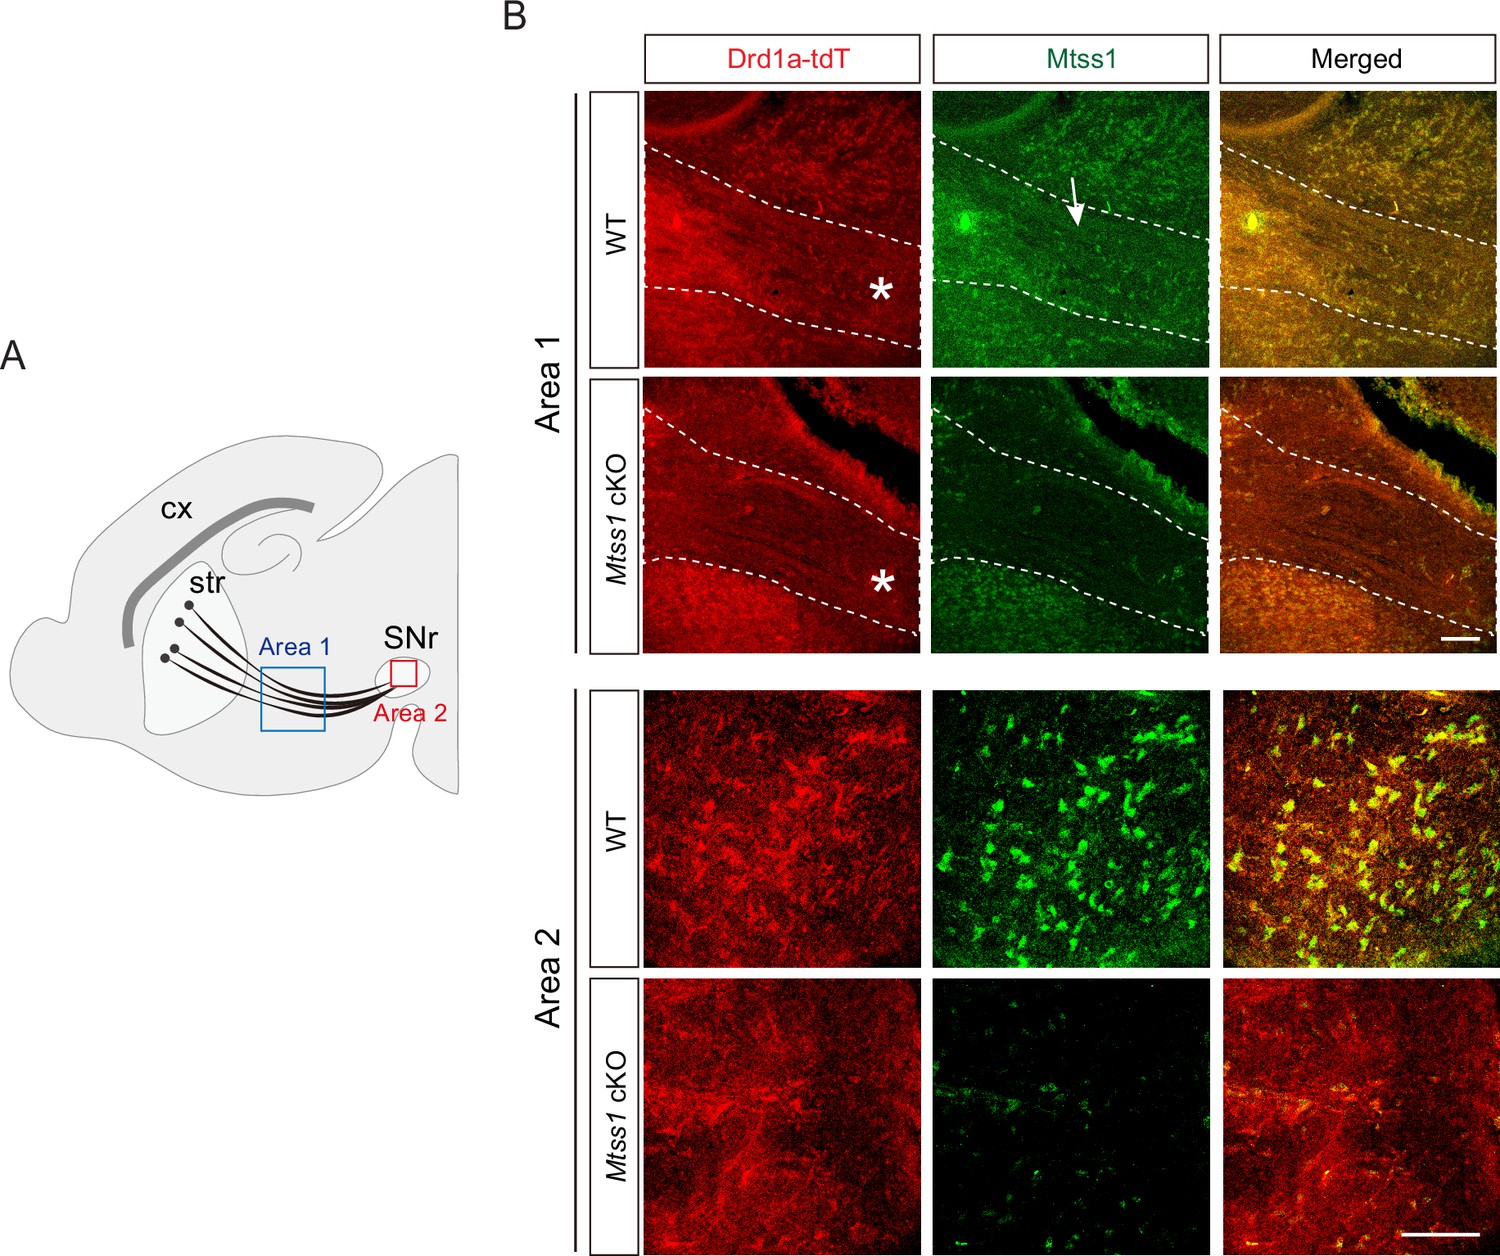
Expression of Mtss1 in the striatonigral tract and SNr at P5.
(A) Illustration showing the region acquired for the striatonigral tract (area 1) and SNr (area 2). (B) Immunohistochemistry showing tdTomato-expressing Drd1a+MSNs (red) and Mtss1 (green) in the striatonigral tract (area 1) and SNr (area 2) in wild-type (WT) (Drd1a-tdT; Mtss11f/f) or Mtss1 conditional knockout (cKO) mice (Drd1a-tdT; Nes-cre; Mtss1f/f) at P5. The white arrow indicates that Mtss1 was expressed in the striatonigral tract (white star). Scale bars, 100 μm.
Figure 7—figure supplement 2
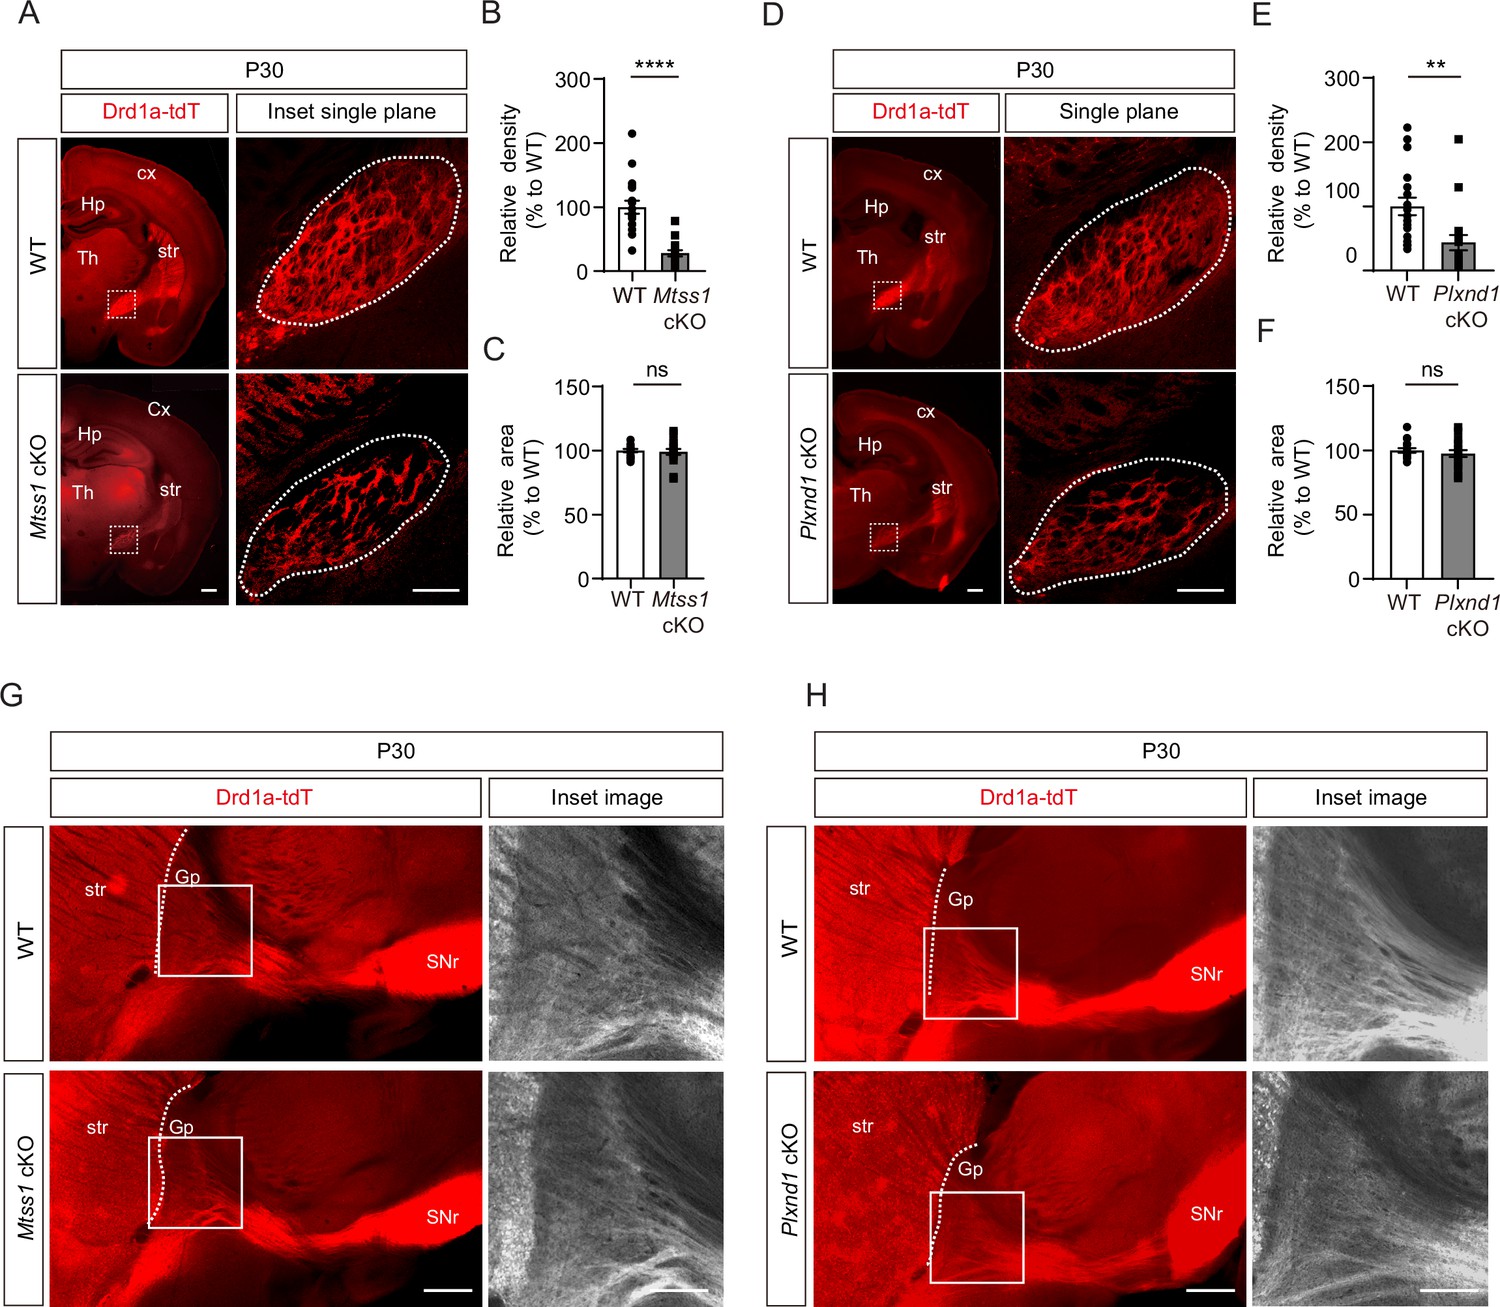
Mtss1 or Plexin-D1 deficiency reduced striatonigral axonal bundles without altering striatonigral projection patterns at P30.
(A) Immunohistochemistry of coronal section images in wild-type (WT) or Mtss1 conditional knockout (cKO) mice at P30. The white dotted boxes on the left images are shown in the inset images, which were captured in a single plane using a high-resolution confocal microscope. Scale bar, 500 μm. (B, C) Quantifications as described for the results obtained at P5. Error bars, mean ± SEM; ****p<0.0001 by Mann‒Whitney test (B) and ns p>0.05 by Student’s t-test (C); n = 18 per group (six sections/mouse). (D) Coronal images of striatonigral projections in WT or Plxnd1 cKO mice at P30. Scale bar, 500 μm. (E, F) Quantification of the density (intensity/area) (E) and the area size (F) at P30. Error bars, mean ± SEM; **p<0.01 by Mann‒Whitney test (E) and ns p>0.05 by Student’s t-test (F); n = 18 per group (six sections/mouse). (G, H) Representative images showing parasagittal sections of brains from WT or Mtss1 cKO mice (G) or Plxnd1 cKO (H). The white boxes on the left images are shown in the inset image on the right. Misguided striatonigral projections were not observed at P30. Scale bar, 500 μm. Hp, hippocampus; str, striatum; cx, cortex; Th, thalamus; Gp, globus pallidus; SNr, substantia nigra.
Figure 7—figure supplement 3
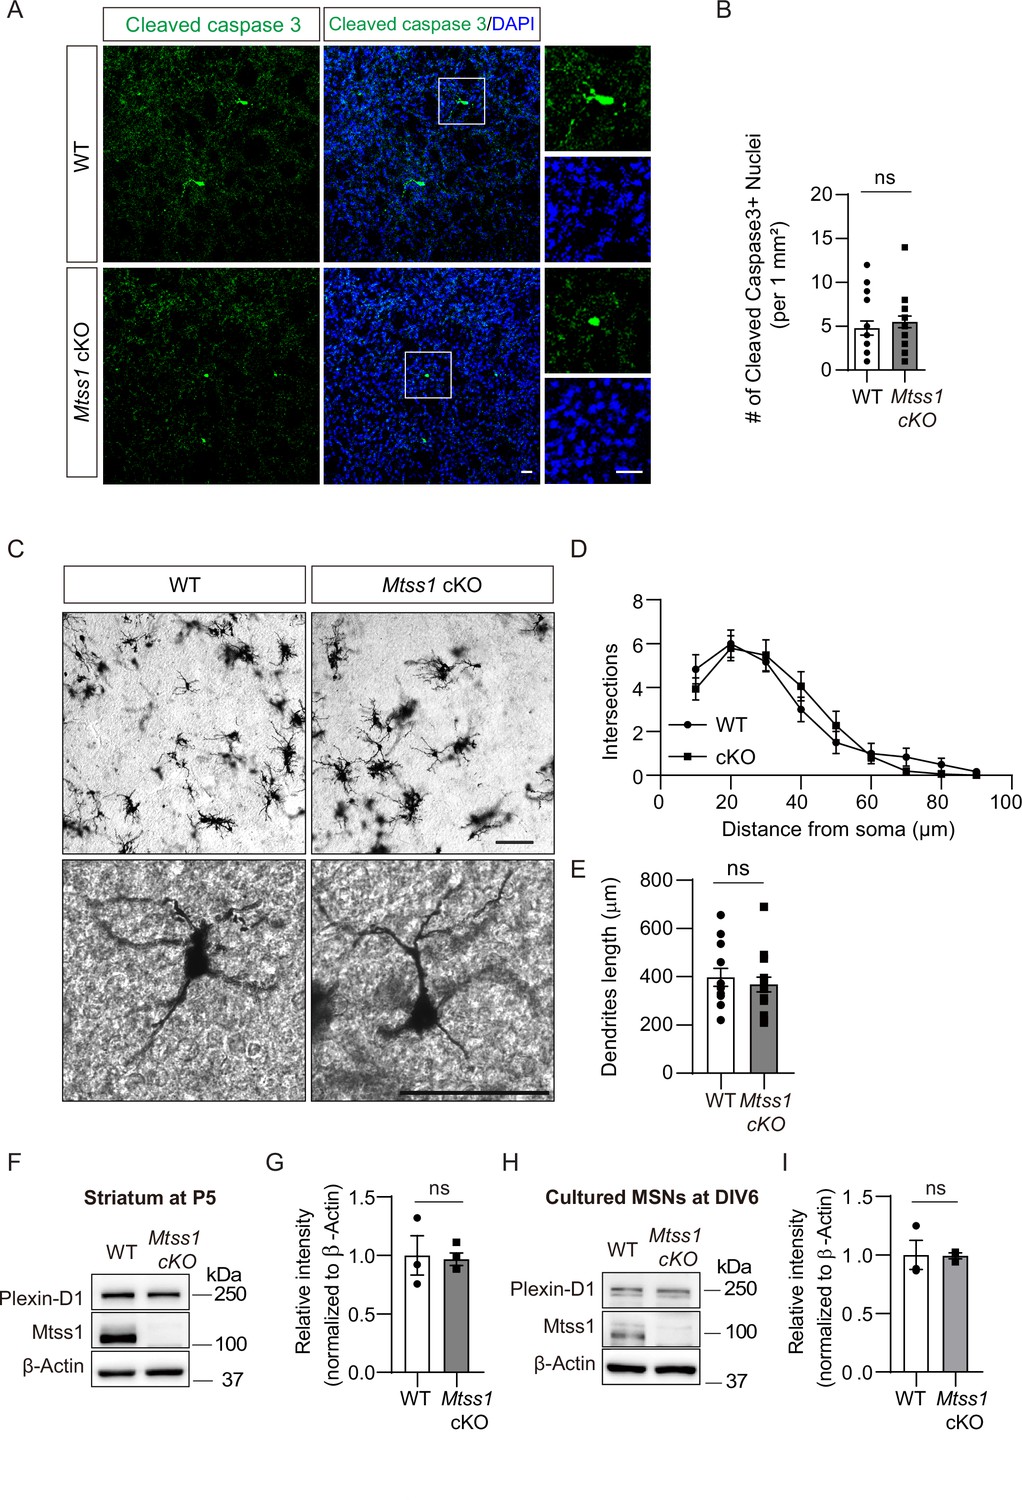
The absence of Mtss1 does not affect medium spiny neuron (MSN) survival, dendritic arborization, and Plexin-D1 expression during striatonigral pathway development.
(A) Immunohistochemistry staining for cleaved caspase 3 (CC3) in the striatum of wild-type (WT) or Mtss1 conditional knockout (cKO) mice. The white dotted boxes on the left images are shown in the inset images on the right at a better resolution. Scale bar, 25 μm. (B) Quantification of cell death by the number of CC3-positive cells in a 1 mm2 area covering the dorsal part of the striatum in WT or Mtss1 cKO mice. Error bars, mean ± SEM; ns p>0.05 by Mann‒Whitney test; WT, n = 20; Mtss1 cKO mice, n = 20 (five sections/mouse). (C) Representative images of Golgi staining at low (top panels) and high (bottom panels) magnification. Scale bars, 100 μm. Sholl analysis of dendritic morphology (D) and dendritic length (E) performed by using Neurolucida360 in 3D analysis. Error bars, mean ± SEM; ns p>0.05 by Student’s t-test; WT, n = 12, and Mtss1 cKO mice, n = 15, from three mice. (F, G) Western blot images and quantification of Plexin-D1 expression in the striatum of WT or Mtss1 cKO mice at P5. Error bars, mean ± SEM; *p<0.05 by Student’s t-test; WT mice, n = 3, and Mtss1 cKO mice, n = 4. (H) Plexin-D1 expression in MSNs obtained from the striatum of WT or Mtss1 cKO mice at P0 and measured at DIV6 in culture. (I) Quantification of the western blots shown in (H). Error bars, mean ± SEM; *p<0.05, by Student’s t-test; n = 3 for WT, n = 3 for KO in three independent experiments.
-
Figure 7—figure supplement 3—source data 1
Raw uncropped western blot & gel images.
Western blots shown in Figure 7—figure supplement 3F and H.
- https://cdn.elifesciences.org/articles/96891/elife-96891-fig7-figsupp3-data1-v2.zip
Figure 7—figure supplement 4
Striatonigral projection defects are observed in Sema3e-null mice at P5.
(A) Immunohistochemistry was performed on coronal sections from wild-type (WT) or Sema3e knockout (KO) mice at P5. The white dotted boxes on the left images are shown in the inset images, which were captured in a single plane using a high-resolution confocal microscope. Scale bar, 500 μm. (B, C) Quantification of the density (intensity/area) (B) and the area size (C) at P5. Error bars, mean ± SEM; ns p>0.05, ***p<0.001 by Student’s t-test; n = 18 per group (six sections/mouse). (D) Diagram depicting the width (red line) of the striatonigral pathway. (E) Quantification of the width of the striatonigral projections at P5. Error bars, mean ± SEM; ***p<0.001 by Student’s t-test; WT, n = 15, KO, n = 14 (3–4 sections/mouse). (F) Representative images showing parasagittal sections of brains from WT or Sema3e-KO mice at P5. White boxes are magnified on the right panels. Scale bar, 500 μm. The phenotype of misguided striatonigral projections was observed in three out of four Sema3e-KO mice at P5 (white arrowheads). (G) The number of deviated axonal bundles within the corresponding area (white boxes in F). Error bars, mean ± SEM; *p<0.05 by Student’s t-test; n = 4 mice for WT, n = 4 mice for KO.
Figure 8 with 2 supplements
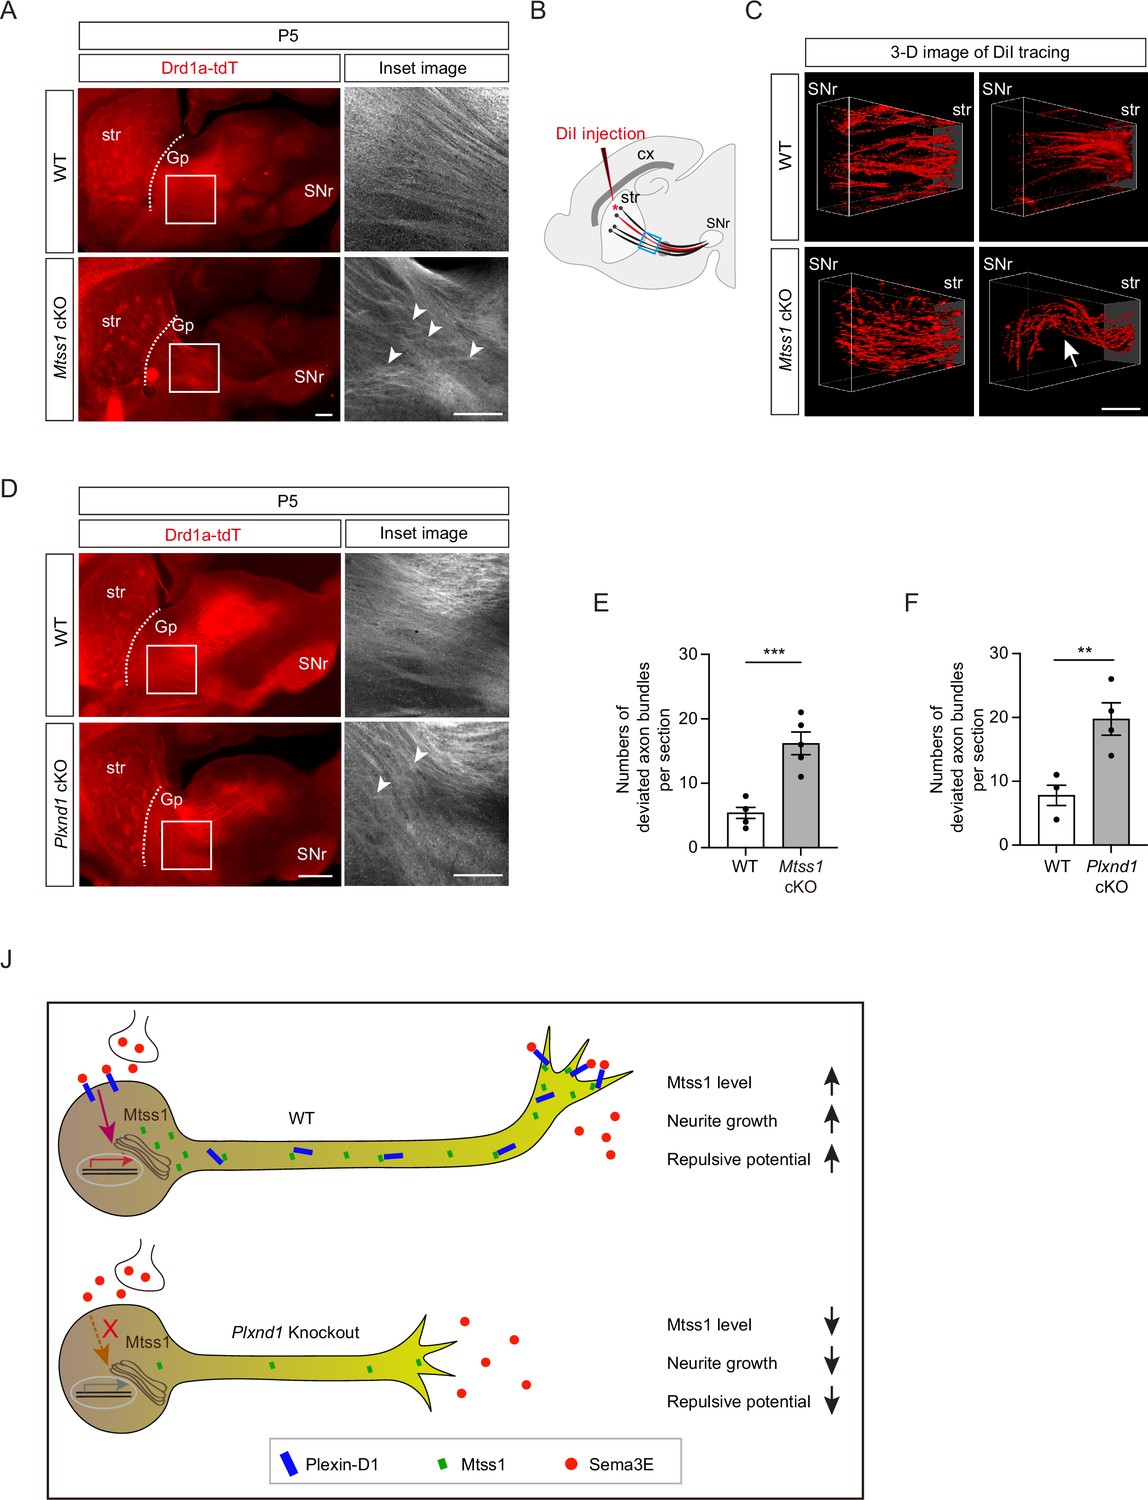
Direct-pathway medium spiny neurons (MSNs) exhibit irregular projection patterns in the absence of either Mtss1 or Plexin-D1.
(A) Immunohistochemistry of parasagittal sections of striatonigral projections labeled with Drd1a-tdT in wild-type (WT) or Mtss1 conditional knockout (cKO) mice at P5. The white boxes on the left images are shown in the inset image on the right. Misguided striatonigral projections are indicated by white arrowheads. The phenotype was observed in five out of five Mtss1 cKO mice at P5. Scale bar, 500 μm. (B) Schematics depicting DiI injection (red asterisk) into the dorsal striatum for sparse labeling of striatonigral projections. The regions indicated in the blue square were captured for three-dimensional (3D) visualization. (C) Representative 3D images of DiI-labeled axonal tracks in WT or Mtss1 cKO mice at P5. Compared to the fasciculated straight projections in WT (top panels), the striatonigral projections of Mtss1 cKO mice presented relatively defasciculated (bottom panels) and occasionally severely misrouted patterns (white arrow in the bottom-right panel). The phenotype was observed in three out of three Mtss1 cKO mice. Scale bar, 200 μm. (D) Representative images showing parasagittal sections of brains from WT or Plxnd1 cKO mice at P5. The misrouted projections are also indicated by white arrowheads in the magnified inset images. The phenotype was observed in four out of four Plxnd1 cKO mice at P5. Scale bar, 500 μm. (E, F) Quantification of the number of intersecting axonal bundles within the corresponding area from Mtss1 cKO (A) or Plxnd1 cKO (D). (E) Student’s t-test; n = 5 mice for WT, n = 5 mice for Mtss1 cKO. (F) Student’s t-test; n = 5 mice for WT, n = 4 mice for Plxnd1 cKO. Error bars, mean ± SEM; **p<0.01, ***p<0.001 by indicated statistical tests. (J) Model showing that Mtss1, upregulated by the Sema3E-Plexin-D1 signaling pathway, promotes axonal growth and directs Plexin-D1 to the growth cone to receive a repulsive guidance signal.
Figure 8—figure supplement 1
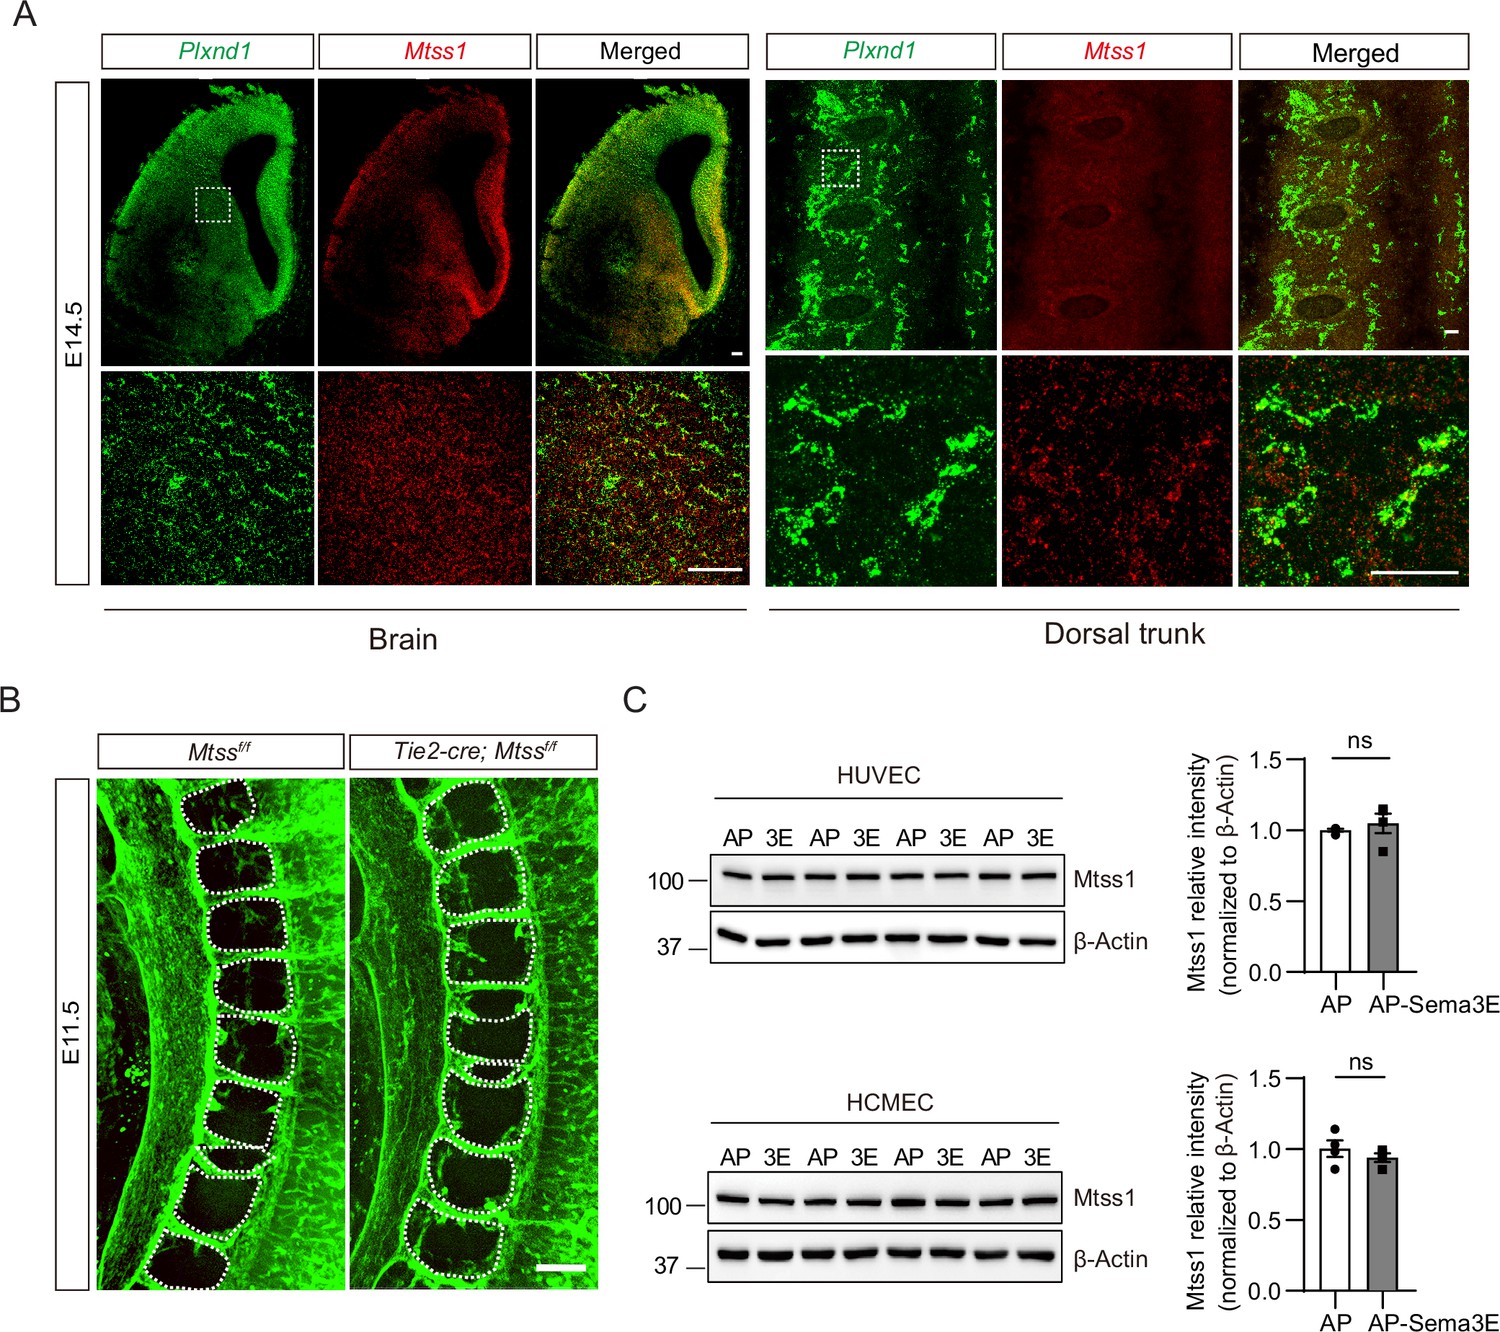
No Mtss1 was found in endothelial cells at E14.5, and no vascular defects were observed in Mtss1-conditional knockout (KO) mice.
(A) Fluorescence in situ hybridization for Plxnd1 mRNA (green) and Mtss1 mRNA (red) in the brain and dorsal trunk at E14.5. White dotted boxes are shown in the inset image on the bottom. Scale bars, 100 μm for brain, 50 μm for dorsal trunk. (B) 3D vascular reconstruction analysis images after CD31 immunostaining and tissue clearing obtained using multifunctional fast confocal microscopy Dragonfly 502w. (C) Western blotting to analyze Mtss1 expression after AP-Sema3E (2 nM) treatment in human umbilical vein endothelial cells (HUVECs) or human cortical microvessel endothelial cells (HCMEC/D3). Error bars, mean ± SEM; ns p>0.05 by Mann‒Whitney test; AP, n = 4, AP-Sema3E, n = 4 for HUVECs, ns p>0.05 by Student’s t-test; AP, n = 4, AP-Sema3E, n = 4 for HCMEC/D3s in four dependent experiments.
-
Figure 8—figure supplement 1—source data 1
Western blots shown in Figure 8—figure supplement 1C.
- https://cdn.elifesciences.org/articles/96891/elife-96891-fig8-figsupp1-data1-v2.zip
Figure 8—figure supplement 2
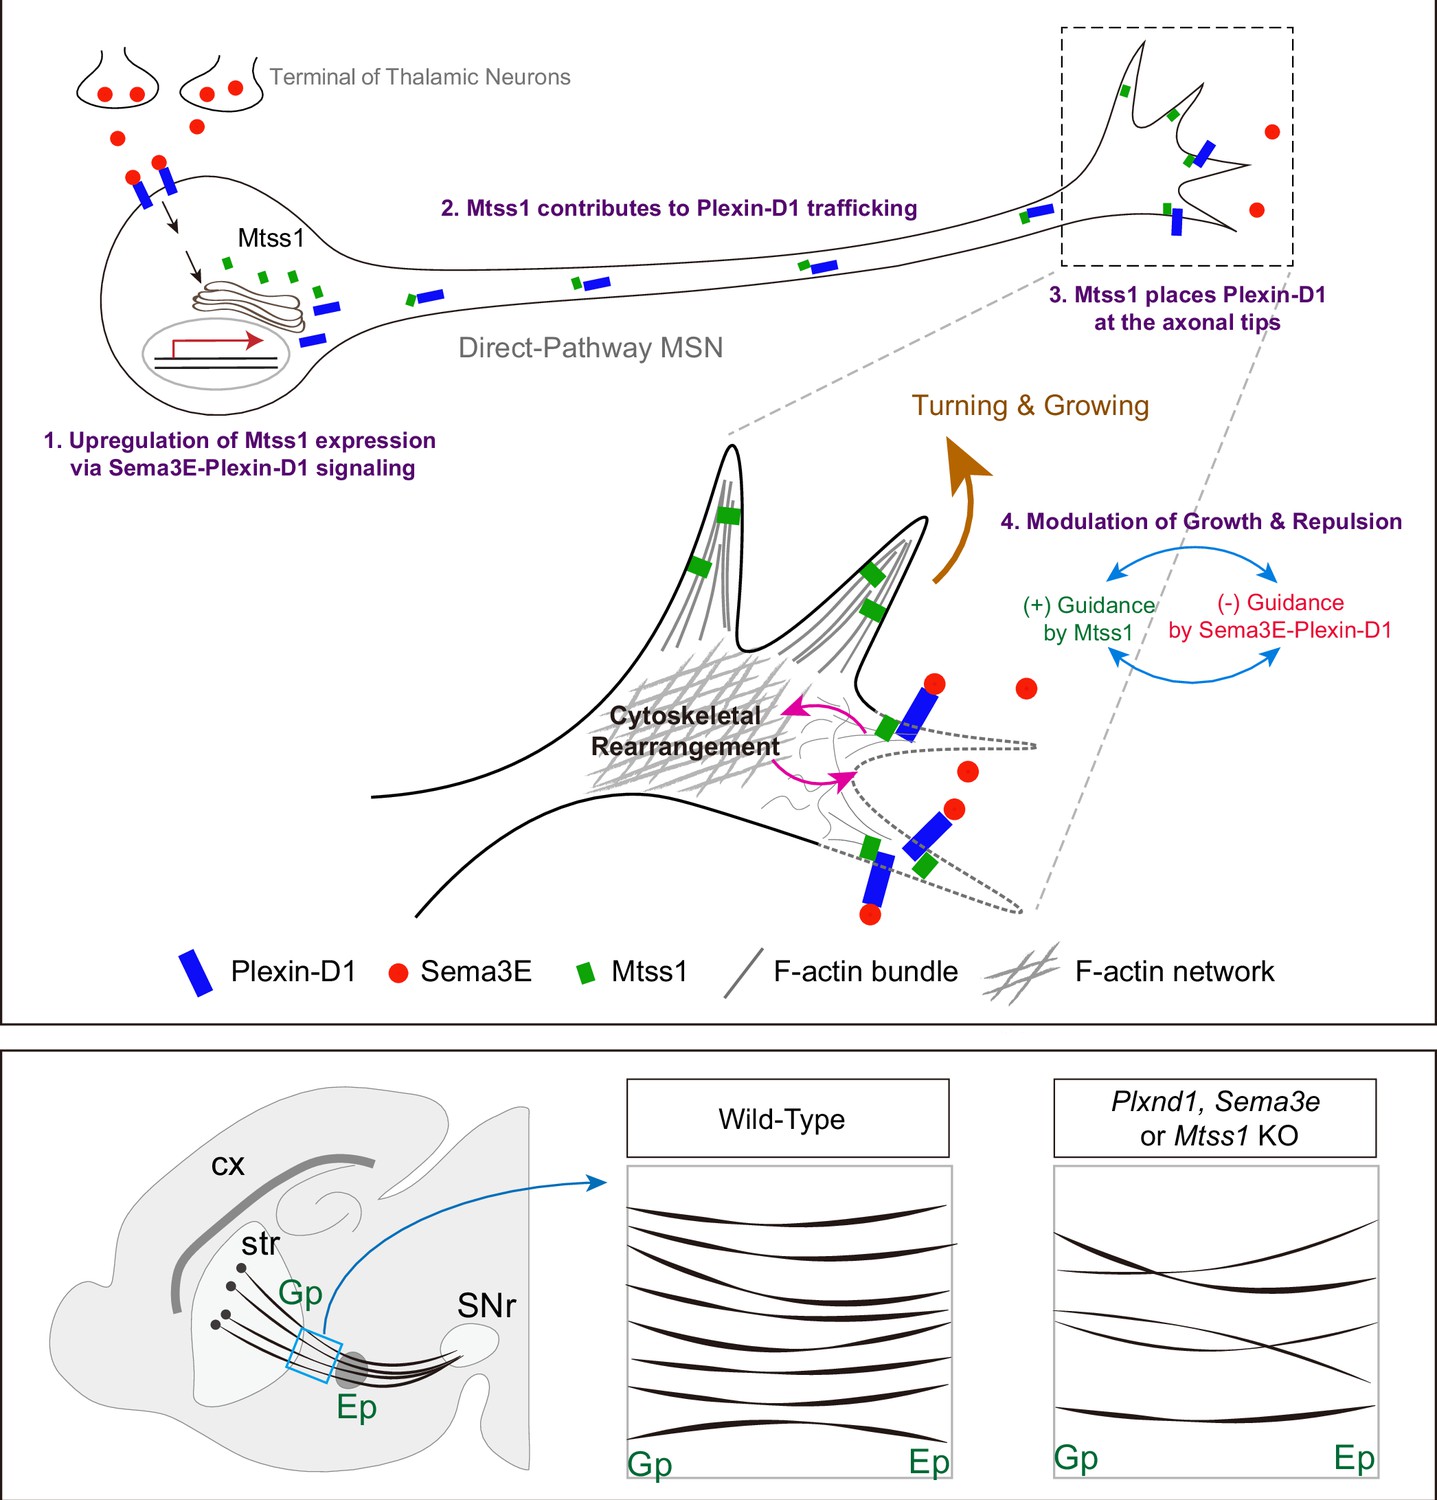
Schematic summary showing striatonigral projection development via a serial reciprocal interaction of the Sema3E-Plexin-D1-Mtss1 complex.
Videos
Video 1
Time-lapse live imaging of Plexin-D1-GFP-positive vesicles (green) from wild-type medium spiny neurons (MSNs) at DIV6_1.
Video 2
Time-lapse live imaging of Plexin-D1-GFP-positive vesicles (green) from wild-type medium spiny neurons (MSNs) at DIV6_2.
Video 3
Time-lapse live imaging of Plexin-D1-GFP-positive vesicles (green) from Mtss1 conditional knockout (cKO) medium spiny neurons (MSNs) at DIV6_1.
Video 4
Time-lapse live imaging of Plexin-D1-GFP-positive vesicles (green) from Mtss1 conditional knockout (cKO) medium spiny neurons (MSNs) at DIV6_2.
Tables
Appendix 1—key resources table
| Reagent type (species) or resource | Designation | Source or reference | Identifiers | Additional information |
|---|---|---|---|---|
| Antibody | Anti-Mtss1 (rabbit polyclonal) | Novus Biologicals | Cat# NBP2-24716; RRID:AB_2716709 | IHC (1:500) WB (1:500) |
| Antibody | Anti-Plexin-D1 (goat polyclonal) | R&D Systems | Cat# AF4160; RRID:AB_2237261 | IHC (1:500) |
| Antibody | Anti-Tau (goat polyclonal) | Santa Cruz | Cat# sc-1995; RRID:AB_632467 | ICC (1:500) |
| Antibody | Anti-Neurofilament (mouse) | Hybridoma Bank | Cat# 2H3; RRID:AB_ 531793 | IHC (1:500) |
| Antibody | Anti-β-actin/HRP (rabbit monoclonal) | Cell Signaling Technology | Cat# 5125S; RRID:AB_1903890 | WB (1:5000) |
| Antibody | Anti-Myc (mouse monoclonal) | Cell Signaling Technology | Cat# 2276; RRID:AB_331783 | WB (1:1000) |
| Antibody | Anti-Vsv (goat polyclonal) | Abcam | Cat# ab3861; RRID:AB_304118 | WB (1:1000) |
| Antibody | Anti-Sema3E (human polyclonal) | LSBio | Cat# LS-c353198 | WB (1:500) |
| Antibody | Anti-Phospho-Akt (rabbit polyclonal) | Cell Signaling Technology | Cat# 9271; RRID:AB_329825 | WB (1:1000) |
| Antibody | Anti-Akt (rabbit polyclonal) | Cell Signaling Technology | Cat# 9272; RRID:AB_ 329827 | WB (1:1000) |
| Antibody | Anti-RFP (rabbit polyclonal) | Abcam | Cat# ab62341; RRID:AB_945213 | IHC (1:1000) |
| Antibody | Anti-RFP (mouse monoclonal) | Thermo Fisher Scientific | Cat# MA5-15257; RRID:AB_10999796 | IHC (1:1000) |
| Antibody | Anti-alpha-tubulin (mouse monoclonal) | Sigma-Aldrich | Cat# T5168; RRID:AB_477579 | IHC (1:1000) |
| Antibody | Anti-cleaved caspase3 (rabbit polyclonal) | Cell Signaling Technology | Cat# 9661; RRID:AB_2341188 | IHC (1:1000) |
| Antibody | Anti-CD31 (rat monoclonal) | BD Bioscience | Cat# 553370; RRID:AB_394816 | IHC (1:500) |
| Antibody | Anti-digoxigenin-alkaline phosphatase (sheep polyclonal) | Roche | Cat# 11093274910; RRID:AB_2313640 | In situ (1:3000) |
| Antibody | Anti-mouse IgG/HRP (goat polyclonal) | Thermo Fisher Scientific | Cat# 31430; RRID:AB_228307 | WB (1:10,000) |
| Antibody | Donkey anti-rabbit IgG/HRP (rabbit polyclonal) | Jackson Immuno Research | Cat# 711-035-152; RRID:AB_10015282 | WB (1:10,000) |
| Antibody | Donkey anti-goat IgG/HRP (goat polyclonal) | Jackson Immuno Research | Cat# 705-035-147; RRID:AB_2313587 | WB (1:10,000) |
| Antibody | Donkey anti-rabbit IgG, Alexa Fluor 488 | Thermo Fisher Scientific | Cat# A-21206; RRID:AB_2535792 | ICC (1:1000) IHC (1:1000) |
| Antibody | Donkey anti-mouse IgG, Alexa Fluor 488 | Thermo Fisher Scientific | Cat# A-21202; RRID:AB_141607 | ICC (1:1000) IHC (1:1000) |
| Antibody | Donkey anti-goat IgG, Alexa Fluor 568 | Thermo Fisher Scientific | Cat# A-11057; RRID:AB_142581 | ICC (1:1000) IHC (1:1000) |
| Antibody | Donkey anti-rabbit IgG, Alexa Fluor 568 | Thermo Fisher Scientific | Cat# A-10042; RRID:AB_2534017 | ICC (1:1000) IHC (1:1000) |
| Antibody | Donkey anti-mouse IgG, Alexa Fluor 568 | Thermo Fisher Scientific | Cat# A-10037; RRID:AB_2757558 | ICC (1:1000) IHC (1:1000) |
| Antibody | Donkey anti-mouse IgG, Alexa Fluor 647 | Thermo Fisher Scientific | Cat# A-31571; RRID:AB_162542 | ICC (1:1000) IHC (1:1000) |
| Chemical compound, drug | MK2206 | SelleckChem | Cat# S1078 | |
| Chemical compound, drug | TRIzolTM Reagent | Thermo Fisher Scientific | Cat# 15596026 | |
| Chemical compound, drug | RNasin Ribonuclease Inhibitor | Promega | Cat# N2115 | |
| Chemical compound, drug | Halt Protease and Phosphatase Inhibitor Cocktail | Thermo Fisher Scientific | Cat# 78444 | |
| Chemical compound, drug | SuperSignal West Pico PLUS Chemiluminescent Substrate | Thermo Fisher Scientific | Cat# 34580 | |
| Chemical compound, drug | SuperSignal West Femto Maximum Sensitivity Substrate | Thermo Fisher Scientific | Cat# 34096 | |
| Chemical compound, drug | ProLong Diamond Antifade Mountant with DAPI | Thermo Fisher Scientific | Cat# P36962 | |
| Chemical compound, drug | Eukitt Quick-hardening mounting medium | Sigma-Aldrich | Cat# 03989 | |
| Chemical compound, drug | Alexa Fluor 488 Phalloidin | Thermo Fisher Scientific | Cat# A12379 | |
| Chemical compound, drug | Alexa Fluor 568 Phalloidin | Thermo Fisher Scientific | Cat# A12380 | |
| Chemical compound, drug | Alexa Fluor 647 Phalloidin | Thermo Fisher Scientific | Cat# A22287 | |
| Chemical compound, drug | Gibco DMEM, high glucose, pyruvate | Gibco | Cat# 11995-065 | |
| Chemical compound, drug | Penicillin-Streptomycin | HyClone | Cat# SV30010 | |
| Chemical compound, drug | Paraformaldehyde | Electron Microscopy Sciences | Cat# 19202 | |
| Chemical compound, drug | Poly-d-lysine hydrobromide | Sigma-Aldrich | Cat# P6407 | |
| Chemical compound, drug | Corning Laminin | Corning | Cat# 354232 | |
| Chemical compound, drug | NBT/BCIP Ready-to-Use Tablets | Roche | Cat# 11697471001 | |
| Chemical compound, drug | DiI (1.1-dioctadecyl-3,3,3,3-tetramethylindocarbocyanine perchlorate) | Sigma-Aldrich | Cat# 468495 | |
| Commercial assay or kit | QuantiTect Reverse Transcription kit | QIAGEN | Cat# 205313 | |
| Commercial assay or kit | Pierce BCA Protein Assay Kit | Thermo Fisher Scientific | Cat# 23225 | |
| Commercial assay or kit | Lipofectamine 2000 Transfection Reagent | Thermo Fisher Scientific | Cat# 11668019 | |
| Commercial assay or kit | Basic Nucleofector Kit | LONZA | Cat# VAPI-1003 | |
| Commercial assay or kit | FD Rapid GolgiStain Kit | FD Neurotechnologies Inc | Cat# PK401A | |
| Cell line (Homo sapiens) | HEK293T Kidney (embryo) | ATCC | CRL-3216; RRID:CVCL_0063 | |
| Cell line (Cercopithecus aethiops) | COS7 Kidney | Korean Cell Line Bank | Cat# 21651; RRID:CVCL_0224 | |
| Cell line (H. sapiens) | HUVEC Umbilical Vein Endothelial Cells | Lonza | CC-2935; RRID:CVCL_2959 | |
| Cell line (H. sapiens) | HCMEC/D3 Human temporal lobe microvessels | Millipore | SCC066; RRID:CVCL_U985 | |
| Strains | Mouse: C57BL/6J | The Jackson Laboratory | Stock# 000664; RRID:IMSR_JAX:000664 | |
| Strains | Mouse: Nestin-Cre | The Jackson Laboratory | Stock# 003771; RRID:IMSR_JAX:003771 | |
| Strains | Mouse: Tie2-Cre | The Jackson Laboratory | Stock# 008863; RRID:IMSR_JAX:008863 | |
| Strains | Mouse: Drd1a-tdTomato | The Jackson Laboratory | Stock# 016204; RRID:IMSR_JAX:016204 | |
| Strains | Mouse: Mtss1flox/+ | Center for Animal Resources and Development Database (CARD) under permission of Dr. Mineko Kengaku | Card ID#2760 | |
| Strains | Mouse: Plxnd1flox/flox | Obtained from Dr. Chenghua Gu | Kim et al., 2011 | |
| Strains | Mouse: Sema3e+/- | Obtained from Dr. Chenghua Gu | Chauvet et al., 2007 | |
| Software, algorithm | ImageJ | NIH | https://imagej.nih.gov/ij/ | |
| Software, algorithm | Prism 9 | GraphPad | https://www.graphpad.com/scientific-Software/prism/ | |
| Software, algorithm | Image Lab (v5.2.1) | Bio-Rad | https://www.bio-rad.com/ | |
| Software, algorithm | Fusion FX | Vilber | https://www.vilber.com/fusion-fx/ | |
| Software, algorithm | LightCycler480 (v1.5.1) | Roche | https://lifescience.roche.com/ | |
| Software, algorithm | Leica Application Suite X | Leica | https://www.leicamicrosystems.com/ | |
| Software, algorithm | NIS-Elements AR (v4.51.00) | Nickon | https://www.microscope.healthcare.nikon.com/ | |
| Software, algorithm | NIS-Elements (v4.50.00) | Nickon | https://www.microscope.healthcare.nikon.com/ | |
| Software, algorithm | AIVIA | Aivia, Inc | https://www.aivia-Software.com/ | |
| Other | Immobilon-P PVDF Membrane | Merck | Cat# IPVH00010 | |
| Other | RNA-seq (P5 mice, striatum) | Data and code availability section in this paper | GEO: GSE196558 |
Additional files
Download links
A two-part list of links to download the article, or parts of the article, in various formats.
Downloads (link to download the article as PDF)
Open citations (links to open the citations from this article in various online reference manager services)
Cite this article (links to download the citations from this article in formats compatible with various reference manager tools)
Repulsive Sema3E-Plexin-D1 signaling coordinates both axonal extension and steering via activating an autoregulatory factor, Mtss1
eLife 13:e96891.
https://doi.org/10.7554/eLife.96891


