Dysfunction of Calcyphosine-Like gene impairs retinal angiogenesis through the MYC axis and is associated with familial exudative vitreoretinopathy
- The Sichuan Provincial Key Laboratory for Human Disease Gene Study, Center for The Sichuan Provincial Key Laboratory for Human Disease Gene Study, Center for Medical Genetics, Sichuan Provincial People’s Hospital, University of Electronic Science and Technology of China, China
- Center for Natural Products Research, Chengdu Institute of Biology, Chinese Academy of Sciences, China
- Henan Branch of National Clinical Research Center for Ocular Diseases, Henan Eye Hospital, People's Hospital of Zhengzhou University, Henan Provincial People's Hospital, China
- Department of Ophthalmology, Xinhua Hospital Affiliated to Shanghai Jiao Tong University School of Medicine, China
- Jinfeng Laboratory, China
- Research Unit for Blindness Prevention of Chinese Academy of Medical Sciences (2019RU026), Sichuan Academy of Medical Sciences and Sichuan Provincial People’s Hospital, China
Figures
Figure 1 with 2 supplements
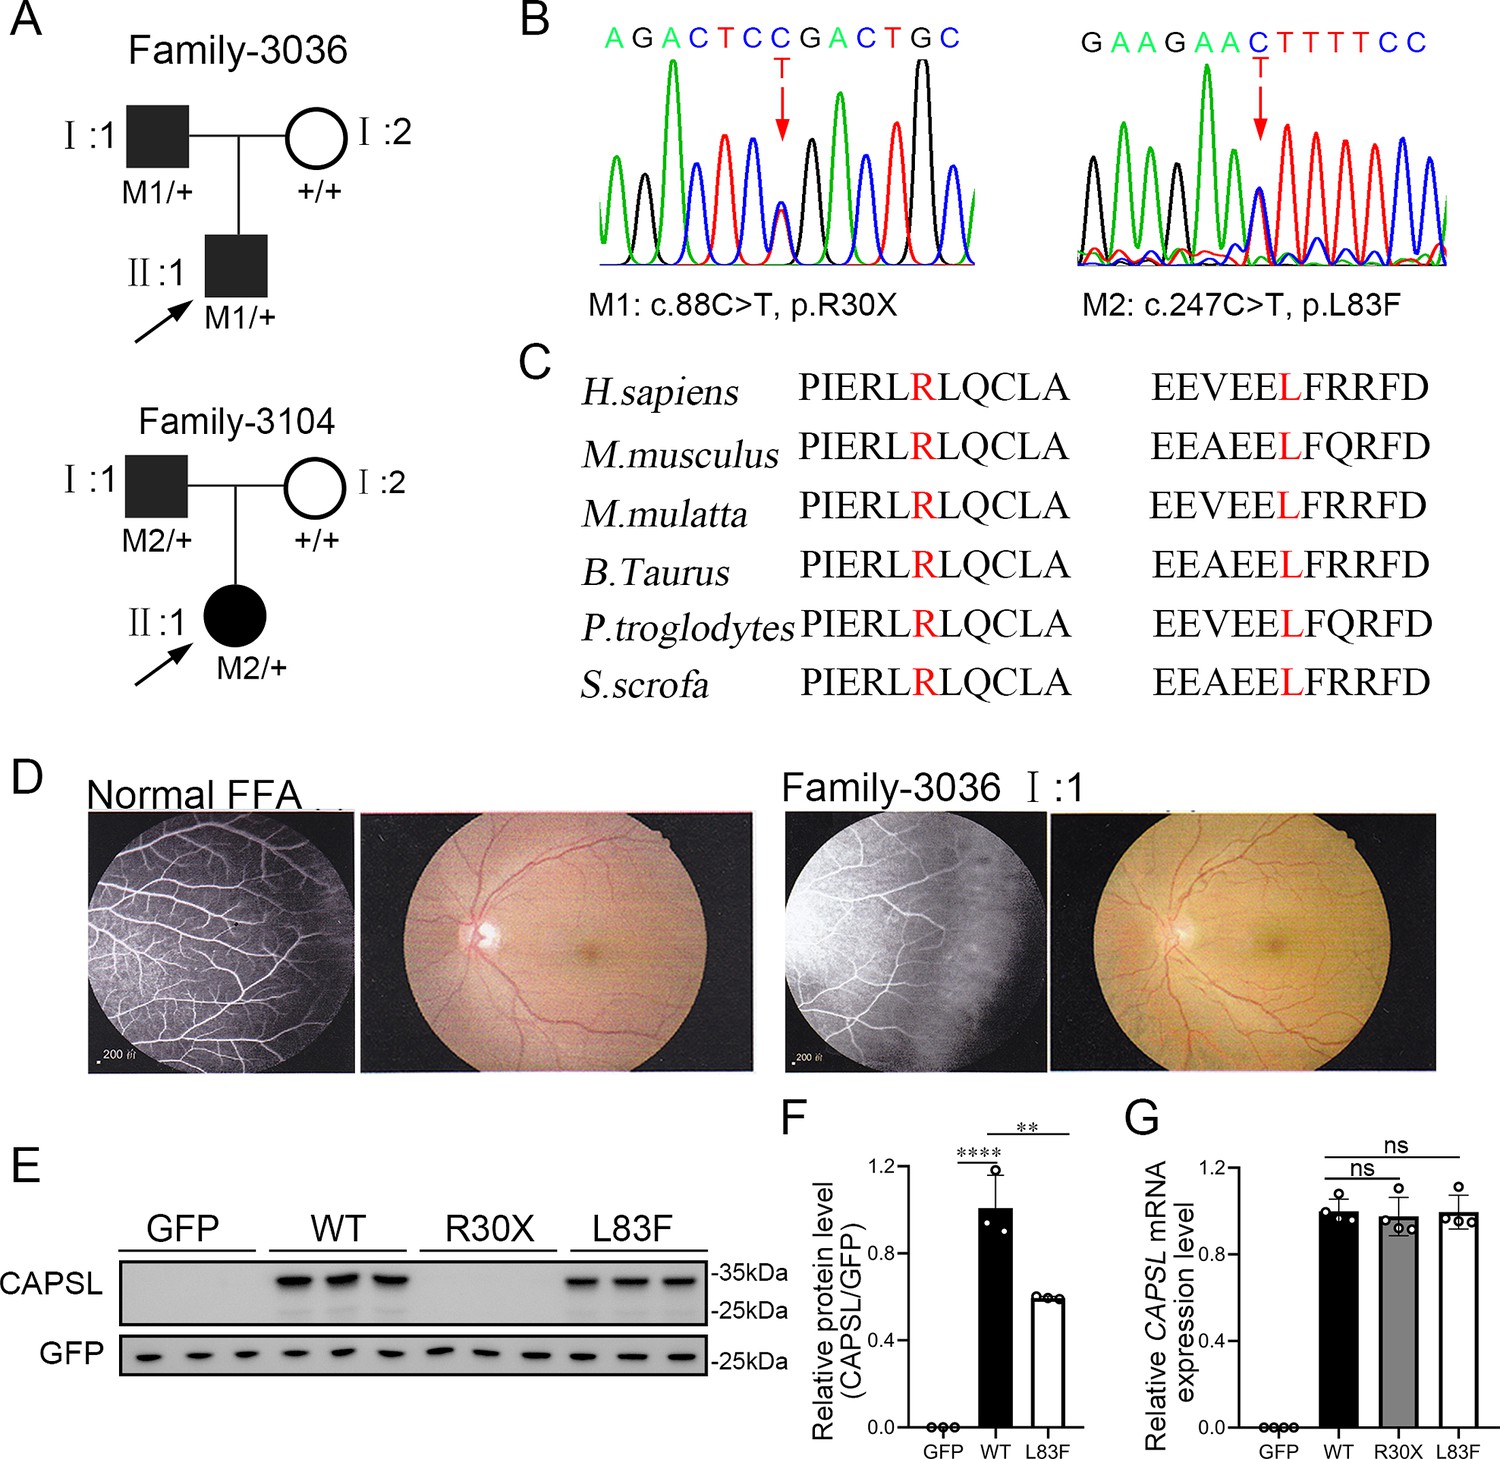
CAPSL point mutations in two families with familial exudative vitreoretinopathy (FEVR).
(A, B) FEVR pedigrees (patients are denoted with black symbols) and Sanger sequencing of two heterozygous mutations identified in two families. Black arrows indicate the proband of each family and red arrows indicate the changed nucleotides. (C) Alignment of amino sequences surrounding the CAPSL variants in different species and all mutated sites are highly conserved. Altered amino acid residues are highlighted in red. (D) Fundus fluorescein angiography (FFA) (left panel) and fundus photography (right panel) of a normal individual and FEVR-affected patient (I:1) in family 3036. Western blot (E, F) and quantitative real time polymerase chain reaction (RT-qPCR) analysis (G) of CAPSL expression of WT and mutant plasmids. An empty vector with GFP tag was used as a negative control. GFP was used as an internal reference. Error bars indicate the standard deviation (SD). **p < 0.01, ****p < 0.0001, ns: no significance, by Student’s t test (n = 3).
-
Figure 1—source data 1
Uncropped and labeled gels for Figure 1.
- https://cdn.elifesciences.org/articles/96907/elife-96907-fig1-data1-v1.zip
-
Figure 1—source data 2
Raw unedited gels for Figure 1.
- https://cdn.elifesciences.org/articles/96907/elife-96907-fig1-data2-v1.zip
Figure 1—figure supplement 1
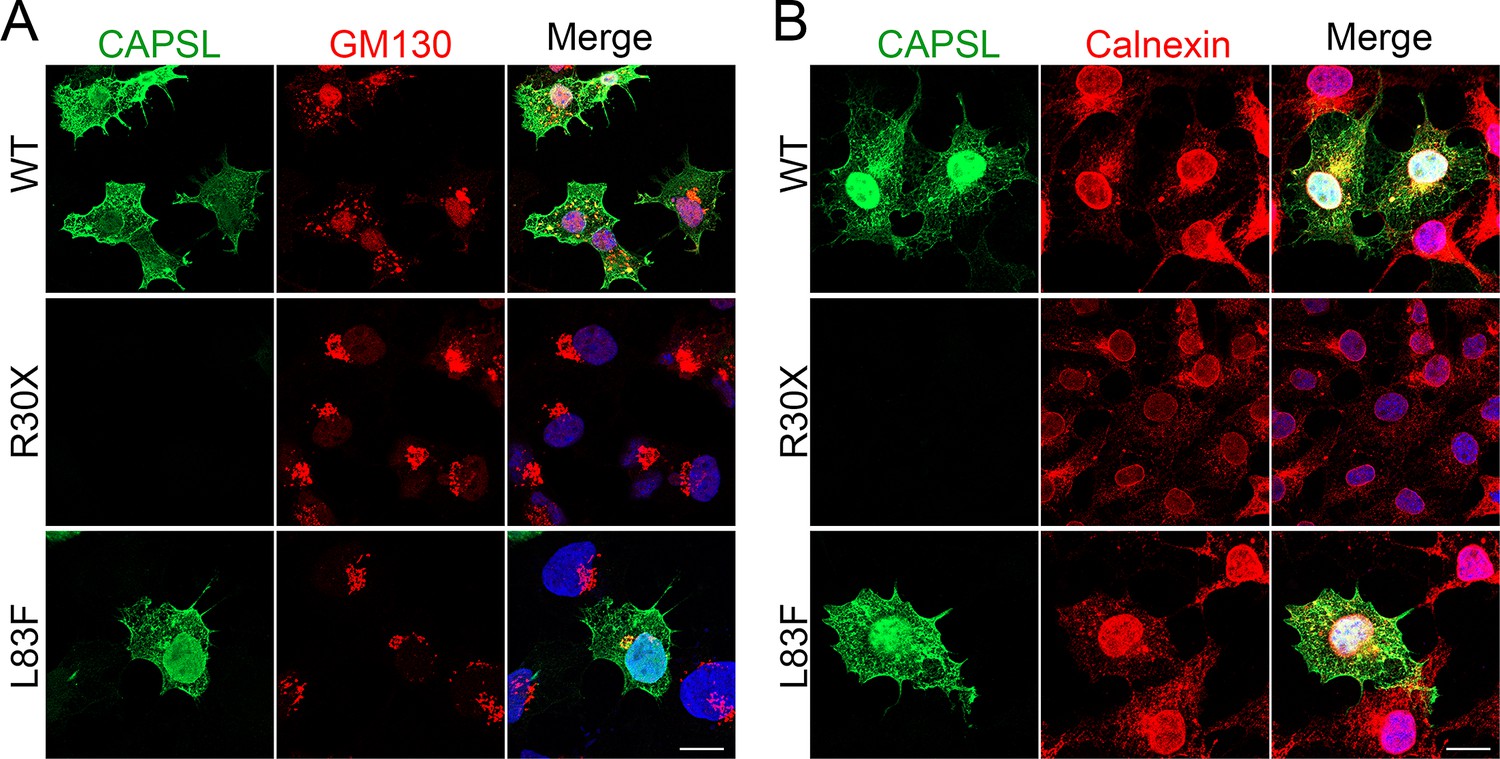
Subcellular localization of CAPSL variant proteins.
(A) Transfected 293T cells with wild-type CAPSL plasmid and variant plasmids were fixed and stained for CAPSL (green), GM130 (red, Golgi), and 4',6-diamidino-2-phenylindole (DAPI, blue, nucleus). Scale bar: 5 μm. (B) Transfected 293T cells with wild-type CAPSL plasmid and variant plasmids were stained for CAPSL (green) and Calnexin (red, endoplasmic reticulum). Scale bar: 5 μm.
Figure 1—figure supplement 2
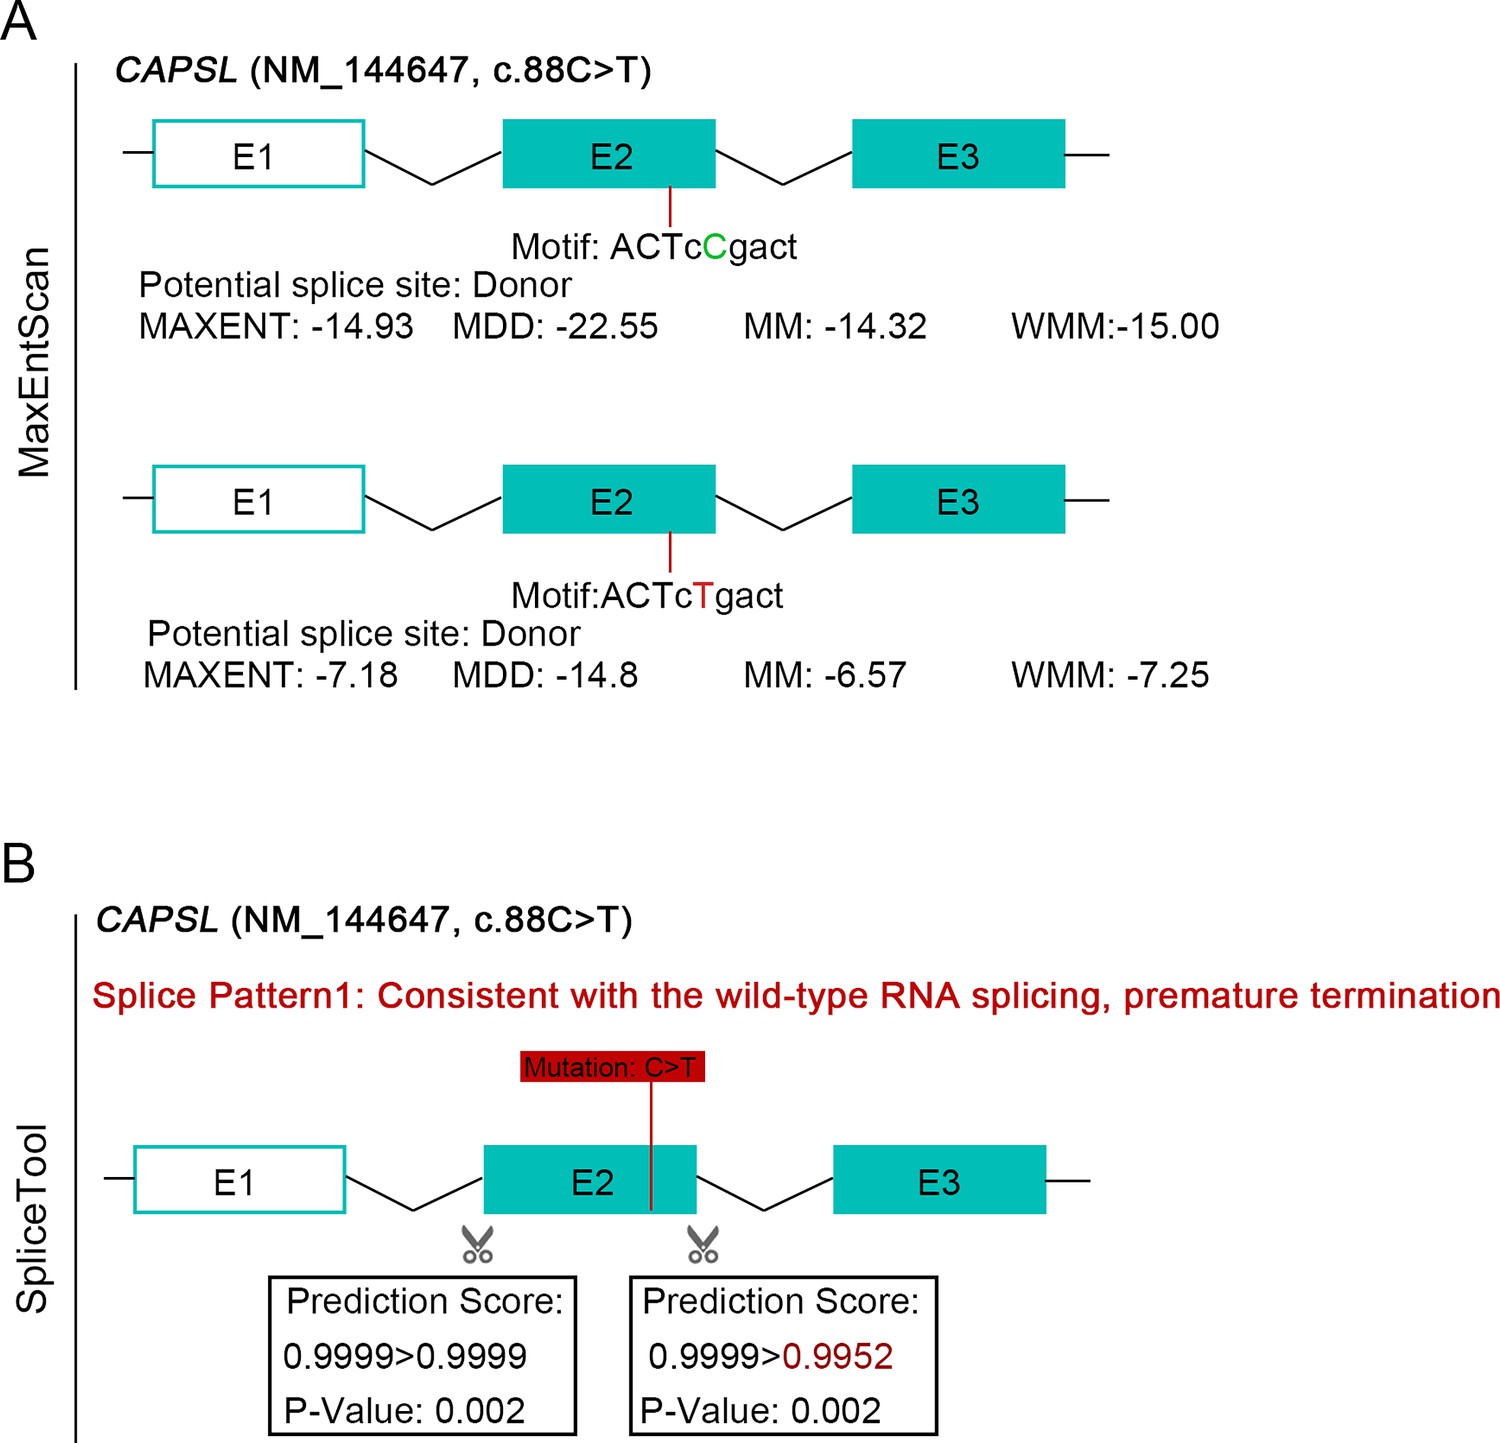
Bioinformatic prediction of an impact on splicing of the pathogenic variant c.88C>T in CAPSL.
(A) MaxEntScan was used to investigate the impact of the variant on the formation of a cryptic donor splice site. Four different models were used: MAXENT: Maximum Entropy Model; MDD: Maximum Dependence Decomposition; MM: First-order Markov Model; WMM: Weight Matrix Model. (B) SpliceTool predicts an impact on splicing for the variant c.88C>T.
Figure 2 with 3 supplements
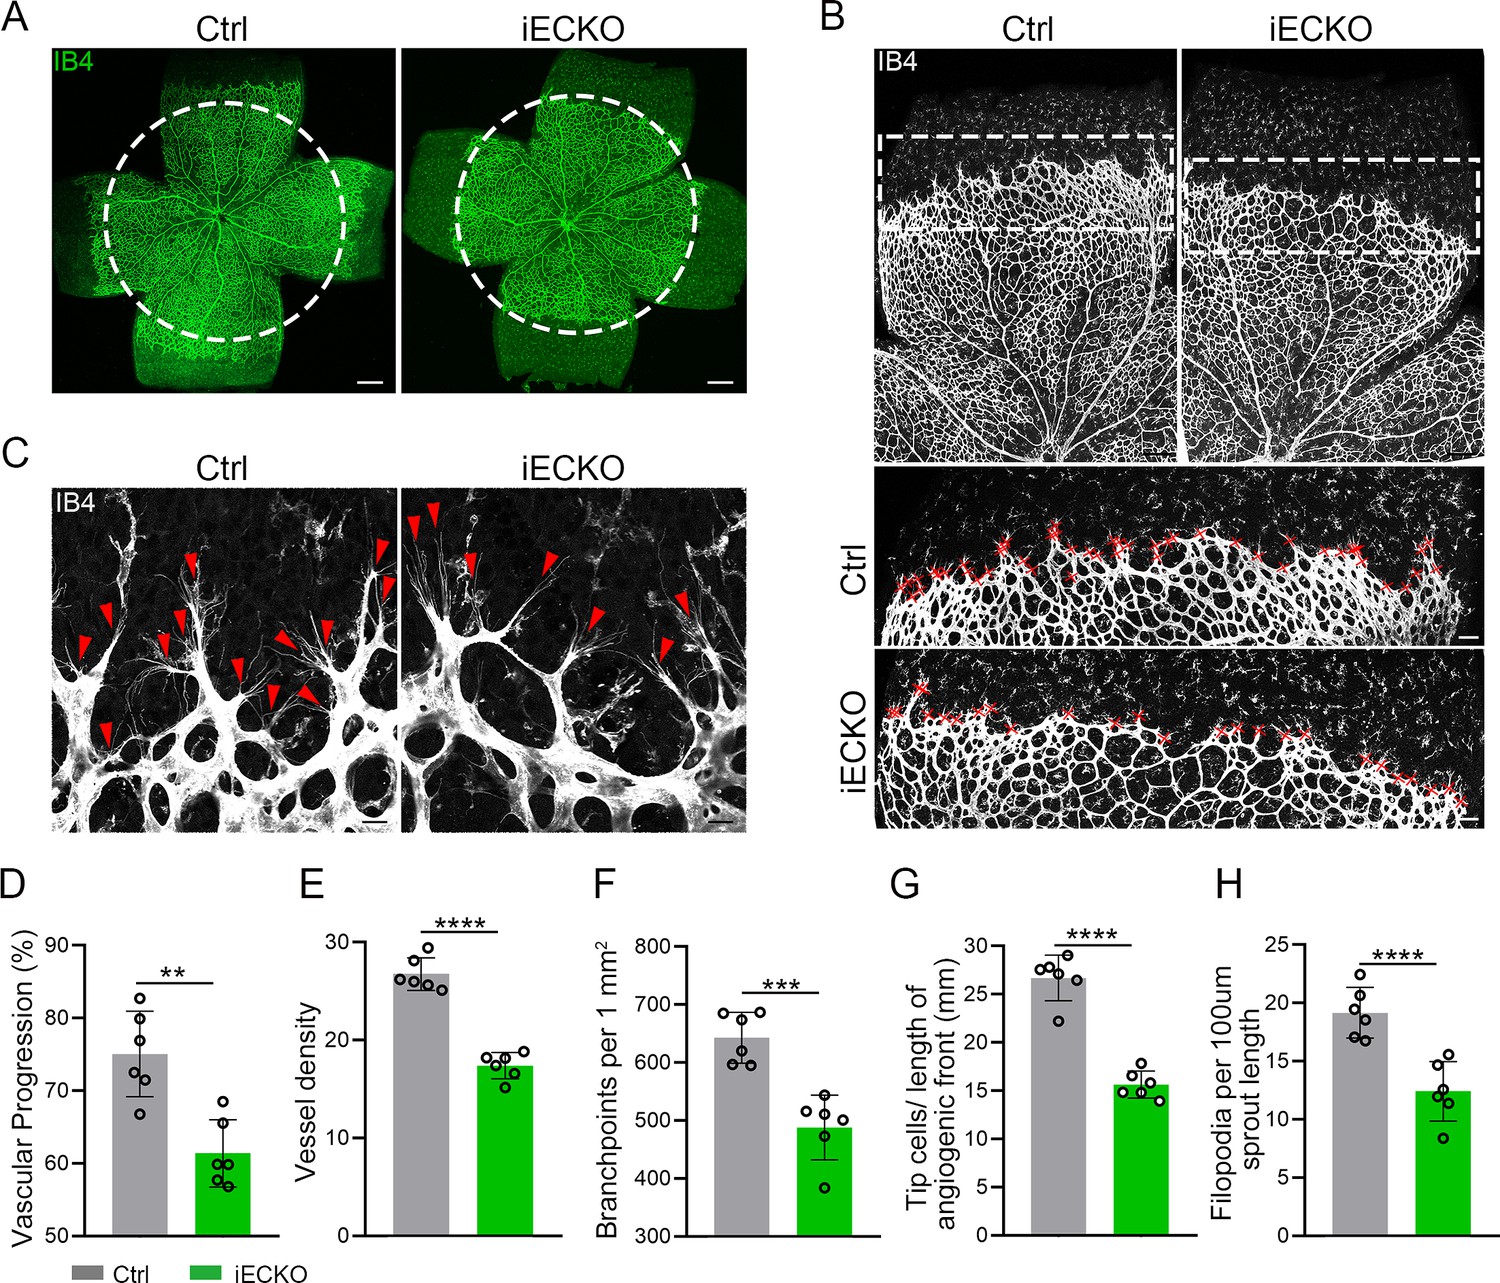
Endothelial cell (EC)-specific inactivation of Capsl impairs retina angiogenesis.
(A) Flat-mounted retinas obtained from P5 Ctrl and littermate iECKO mice were stained with Isolectin-B4 (IB4) to visualize blood vessel. Dashed circle mark the edge of the developing retina vessel in iECKO mice. Scale bar: 250 μm. (B) Low magnification images (top panels) and high magnification images (bottom panels) in boxed areas of IB4-stained angiogenic front of Ctrl and iECKO mice, respectively. Red cross mark tip cells at the angiogenic growth front. Scale bar: 100 μm (top panels), 25 μm (bottom panels). (C) High magnification images of filopodia-extending cells at the edge of retinal angiogenic growth front from Ctrl and iECKO mice. Red arrowheads indicate the sprouts at the angiogenic growth front. Scale bar: 50 μm. (D–H) Quantification of retinal vascular development parameters, including vascular progression, vessel density, branchpoints, number of tip cells, and number of filopodia. Error bars indicate the standard deviation (SD). **p < 0.01, ***p < 0.001, ****p < 0.0001, by Student’s t test (n = 6).
Figure 2—figure supplement 1
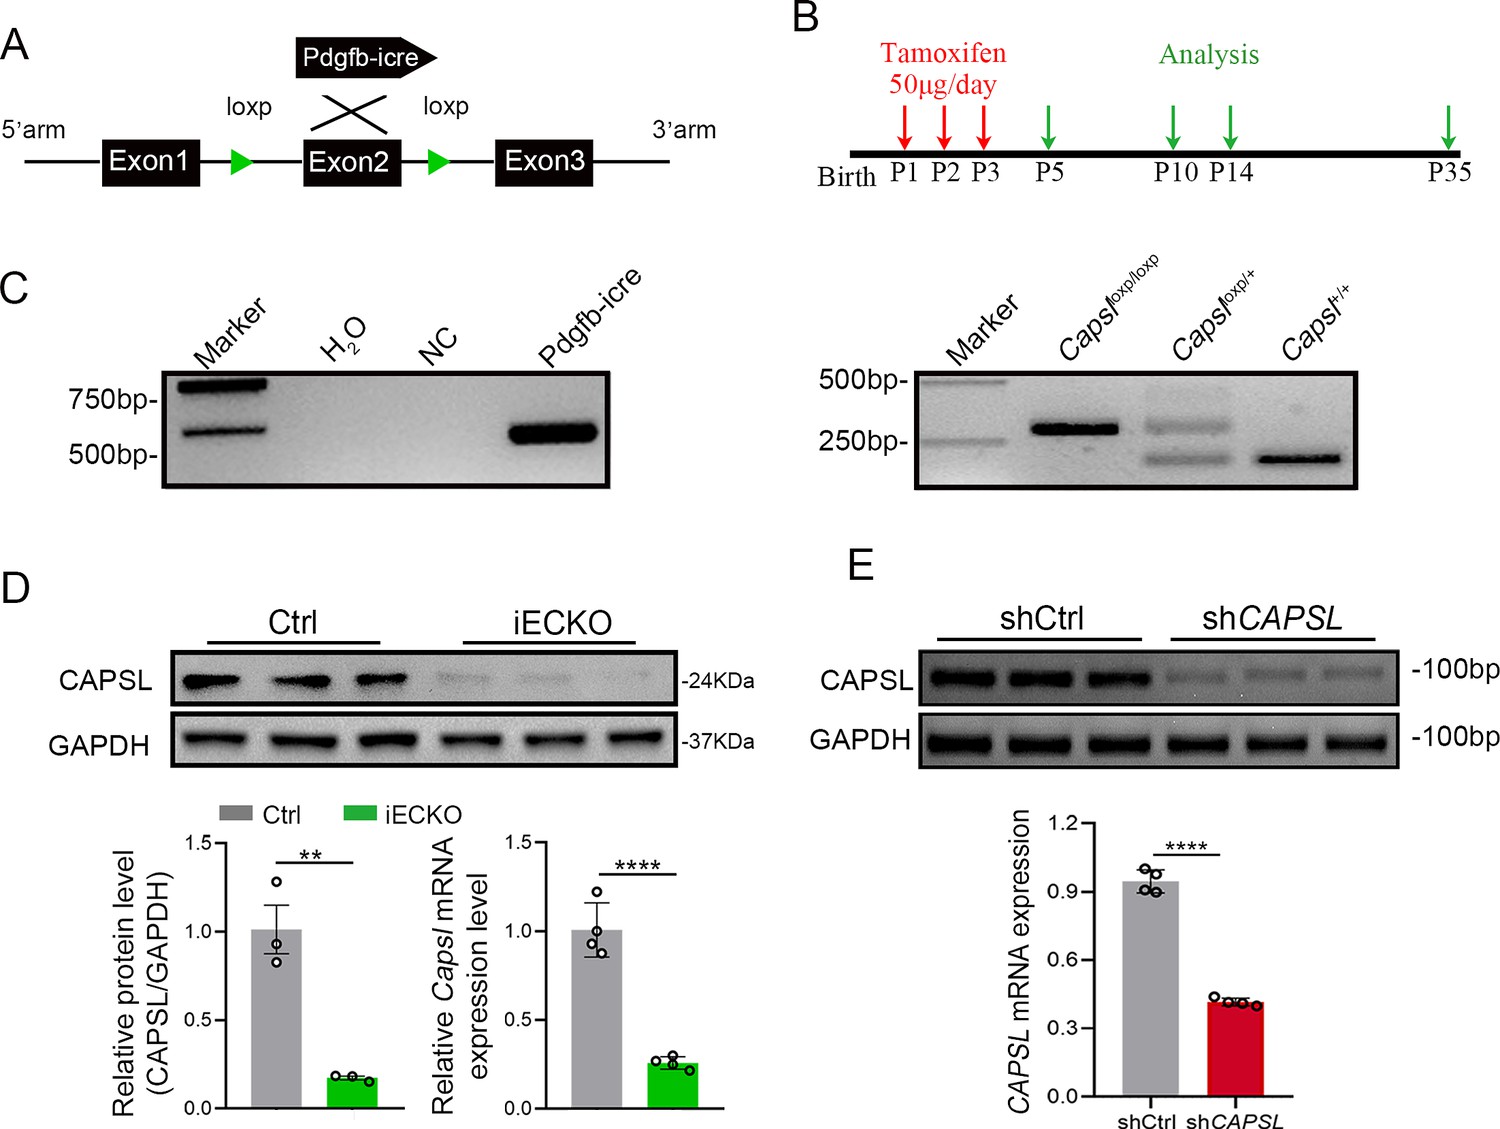
Construction of endothelial cell (EC)-specific Capsl-knockout mice model and CAPSL knockdown human retinal microvascular endothelial cells (HRECs) model.
(A) Strategy to generate a conditional Capsl allele in which exon 2 are knockout specifically in ECs. (B) Diagram depicting the tamoxifen injection and experiment schedule for EC-specific deletion of Capsl in retinal vessels from P1 to P3 and their analyses timeline. (C) Polymerase Chain Reaction (PCR) of genomic DNA from Ctrl and iECKO pups. Recombination of the floxed Capsl allel occurs only in tamoxifen-injected animals that are Pdgfb-iCreER-positive. (D) Immunoblot and quantification of CAPSL-knockout efficiency at both protein and mRNA level. Error bars indicate the standard deviation (SD). **p < 0.01, ****p < 0.0001, by Student’s t test (n = 3). (E) RT-PCR and RT-qPCR analysis of knockdown efficiency of lentivirus carrying shCAPSL. Error bars indicate the SD. ****p < 0.0001, by Student’s t test (n = 3).
-
Figure 2—figure supplement 1—source data 1
Uncropped and labeled gels for Figure 2—figure supplement 1.
- https://cdn.elifesciences.org/articles/96907/elife-96907-fig2-figsupp1-data1-v1.zip
-
Figure 2—figure supplement 1—source data 2
Raw unedited gels for Figure 2—figure supplement 1.
- https://cdn.elifesciences.org/articles/96907/elife-96907-fig2-figsupp1-data2-v1.zip
Figure 2—figure supplement 2
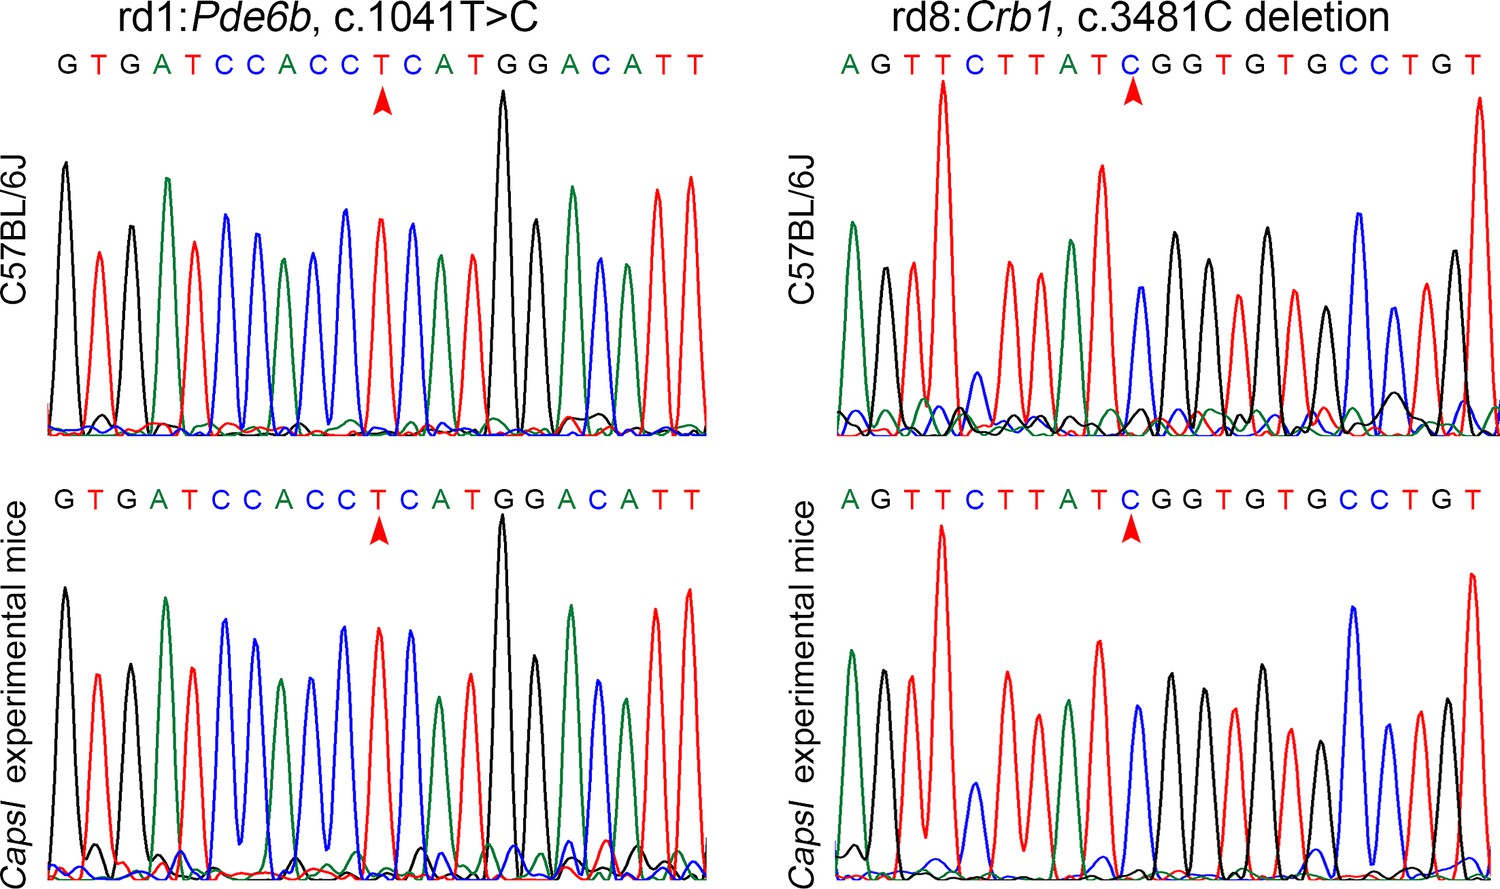
Experimental mice do not carry confounding rd1 and rd8 mutations.
(A) Sanger sequencing was performed to verify the Pde6b c.1041T>C in rd1 mice and experimental mice. (B) Sanger sequencing was performed to verify the Crb1 c.3481C deletion in rd8 mice and experimental mice.
Figure 2—figure supplement 3
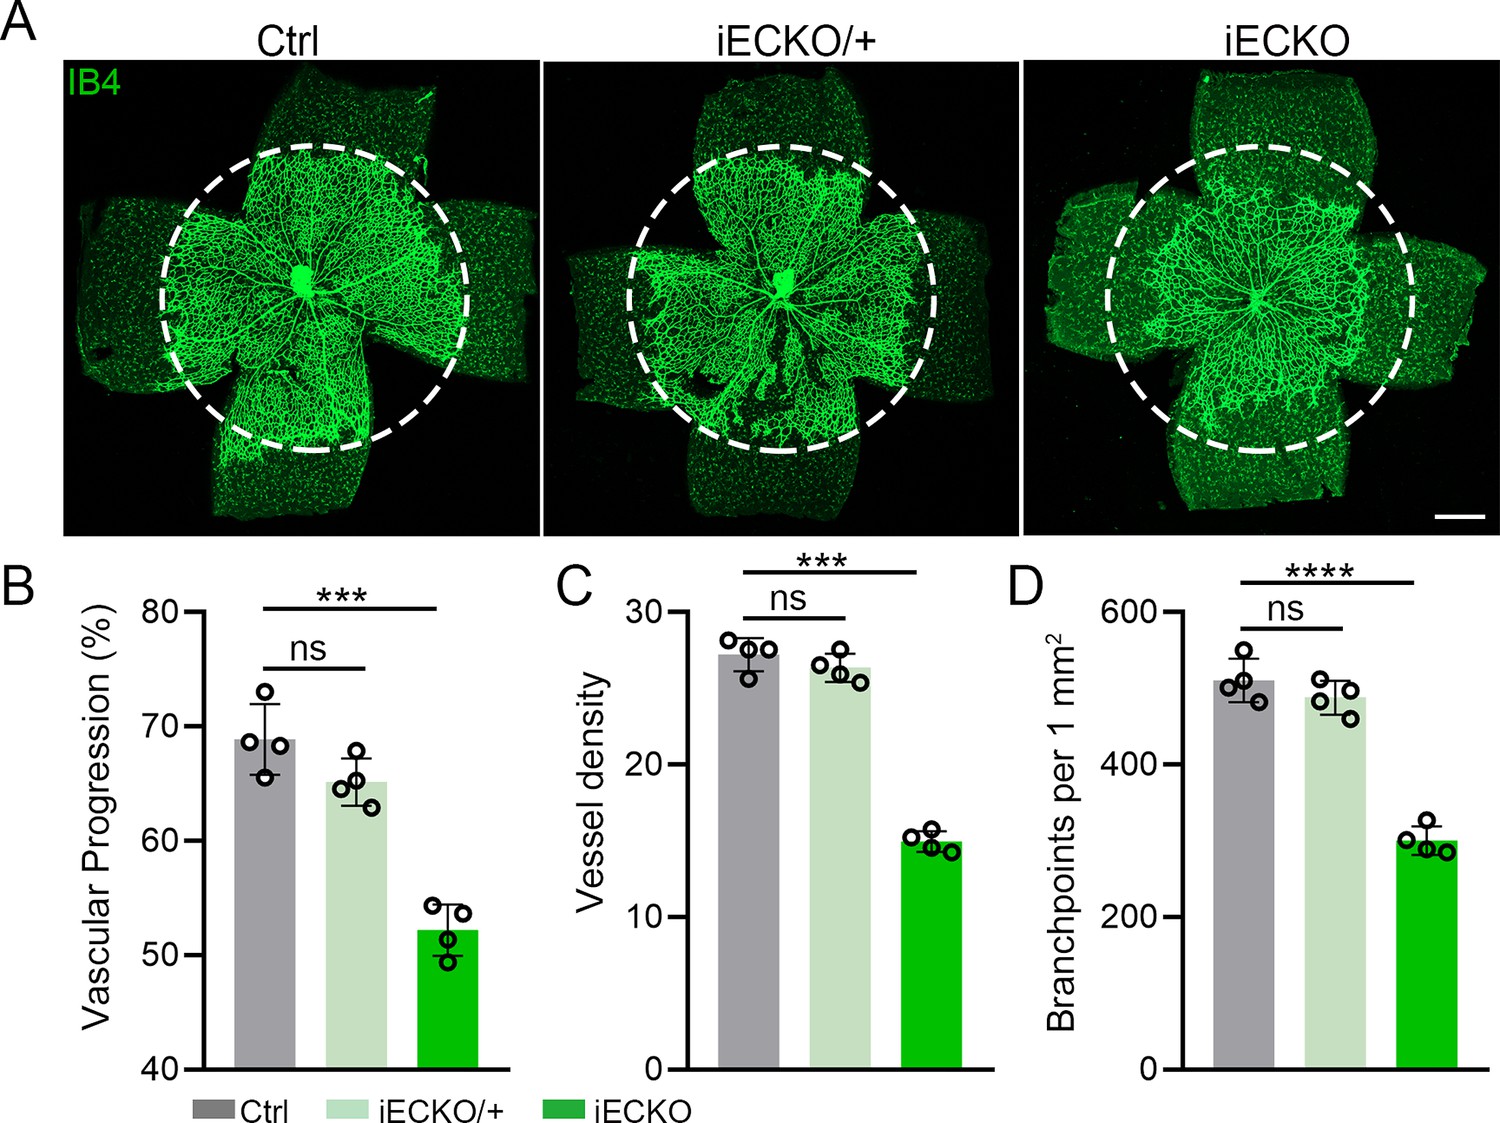
Capsl heterozygous mice exhibited no significant defect in angiogenesis.
(A) Flat-mounted retinas obtained from P5 iECKO/+, iECKO, and littermate Ctrl mice were stained with Isolectin-B4 (IB4) to visualize blood vessel. Dashed circle mark the edge of the developing retina vessel in Ctrl mice. Scale bar: 250 μm. (B–D) Quantification of retinal vascular development parameters, including vascular progression, vessel density, and branchpoints. Error bars indicate the standard deviation (SD). ***p < 0.001, ****p < 0.0001, by Student’s t test (n = 4).
Figure 3 with 1 supplement
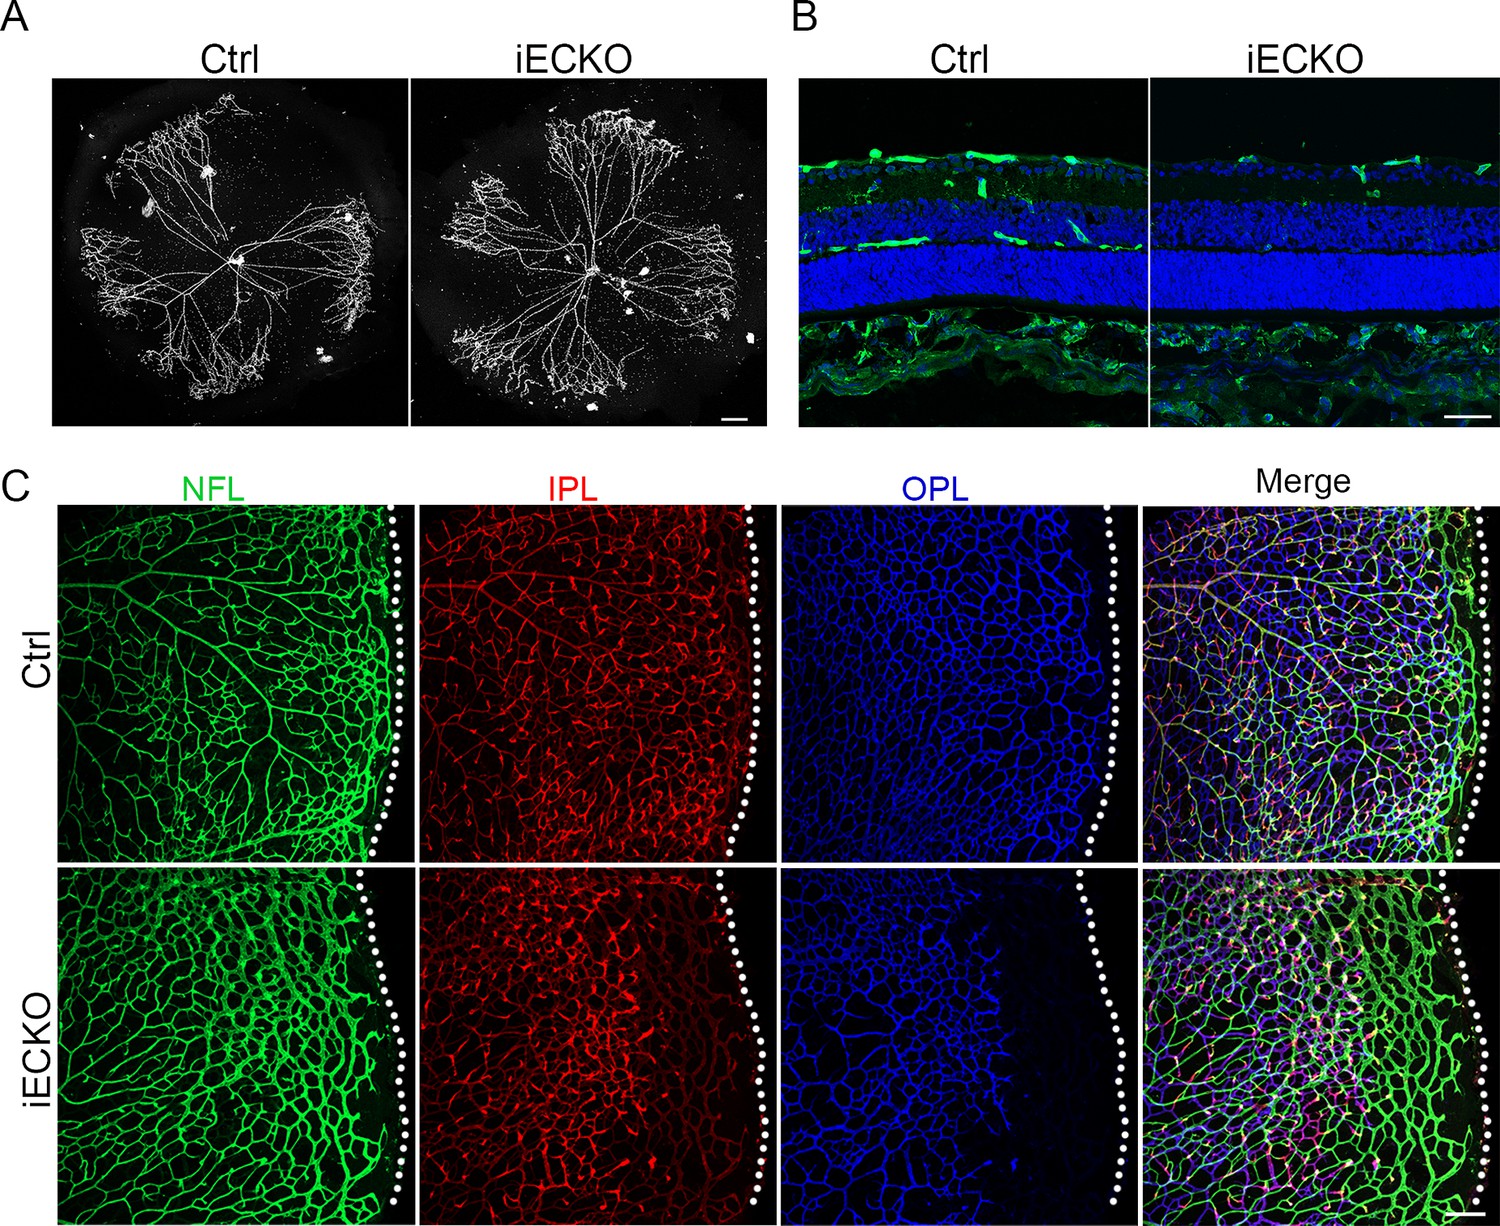
Loss of Capsl results in delayed hyaloid regression and deep retinal blood vessel growth.
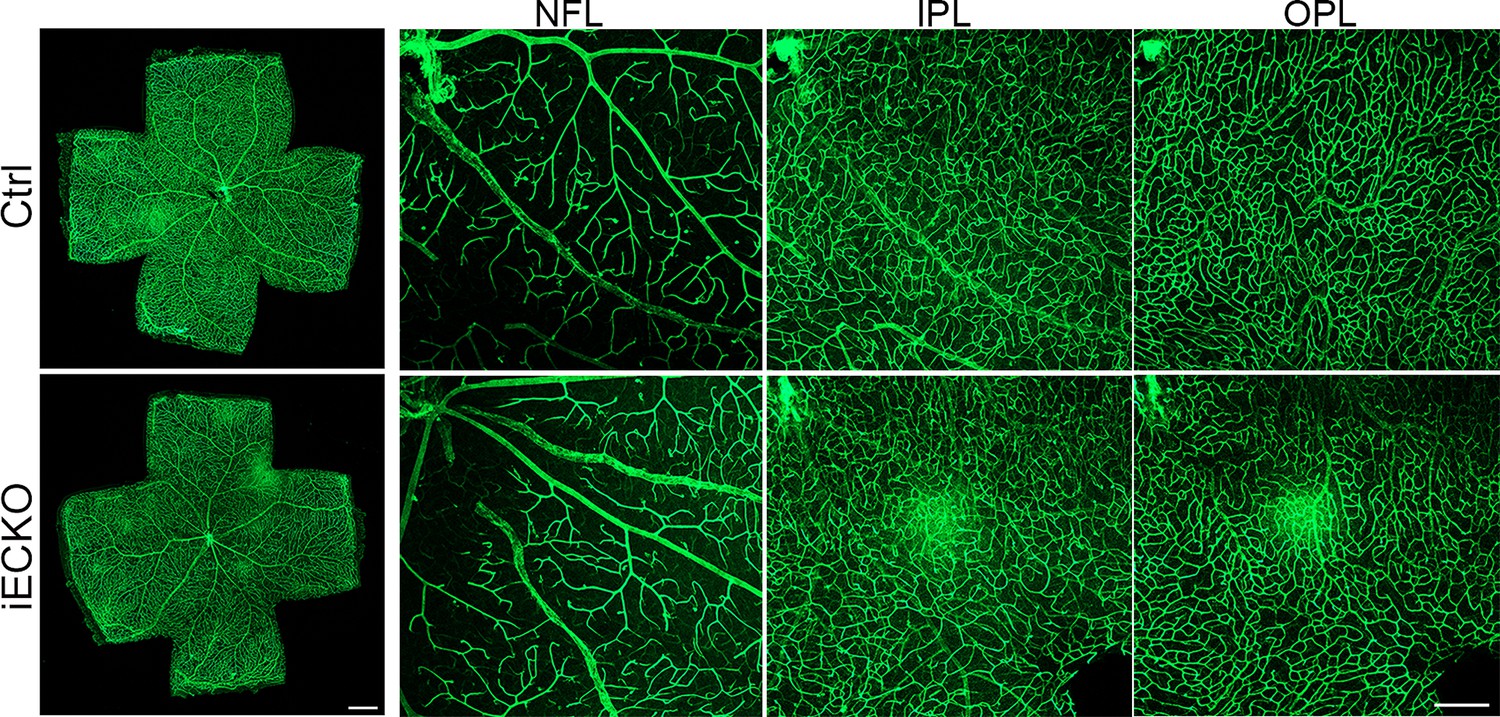
(A) Hyaloid vessels stained with DAPI in the eyes of Ctrl and iECKO mice at P10. Scale bar: 250 μm. (B) Retina sections from P10 Ctrl and iECKO mice were co-stained with Isolectin-B4 (IB4) (greed) and DAPI (blue). Scale bar: 100 μm. (C) Flat-mounted retains stained with IB4 at P14 Ctrl and iECKO mice. Optical sections of z-stacked confocal images were divided to represent the nerve fiber layer (NFL), inner plexiform layer (IPL), and outer plexiform layer (OPL). Dashed lines mark the edge of the developing retina. Scale bar: 100 μm.
Figure 3—figure supplement 1
Capsl deletion does not affect vessel maturation.
Flat-mounted retinas stained with Isolectin-B4 (IB4) at P21 Ctrl and iECKO. Optical sections of z-stacked confocal images were divided to represent the nerve fiber layer (NFL), inner plexiform layer (IPL), and outer plexiform layer (OPL). Scale bar: 250 μm (left panel) and 100 μm (right panel).
Figure 4 with 1 supplement
Deletion of Capsl impairs endothelial cell (EC) proliferation and migration.
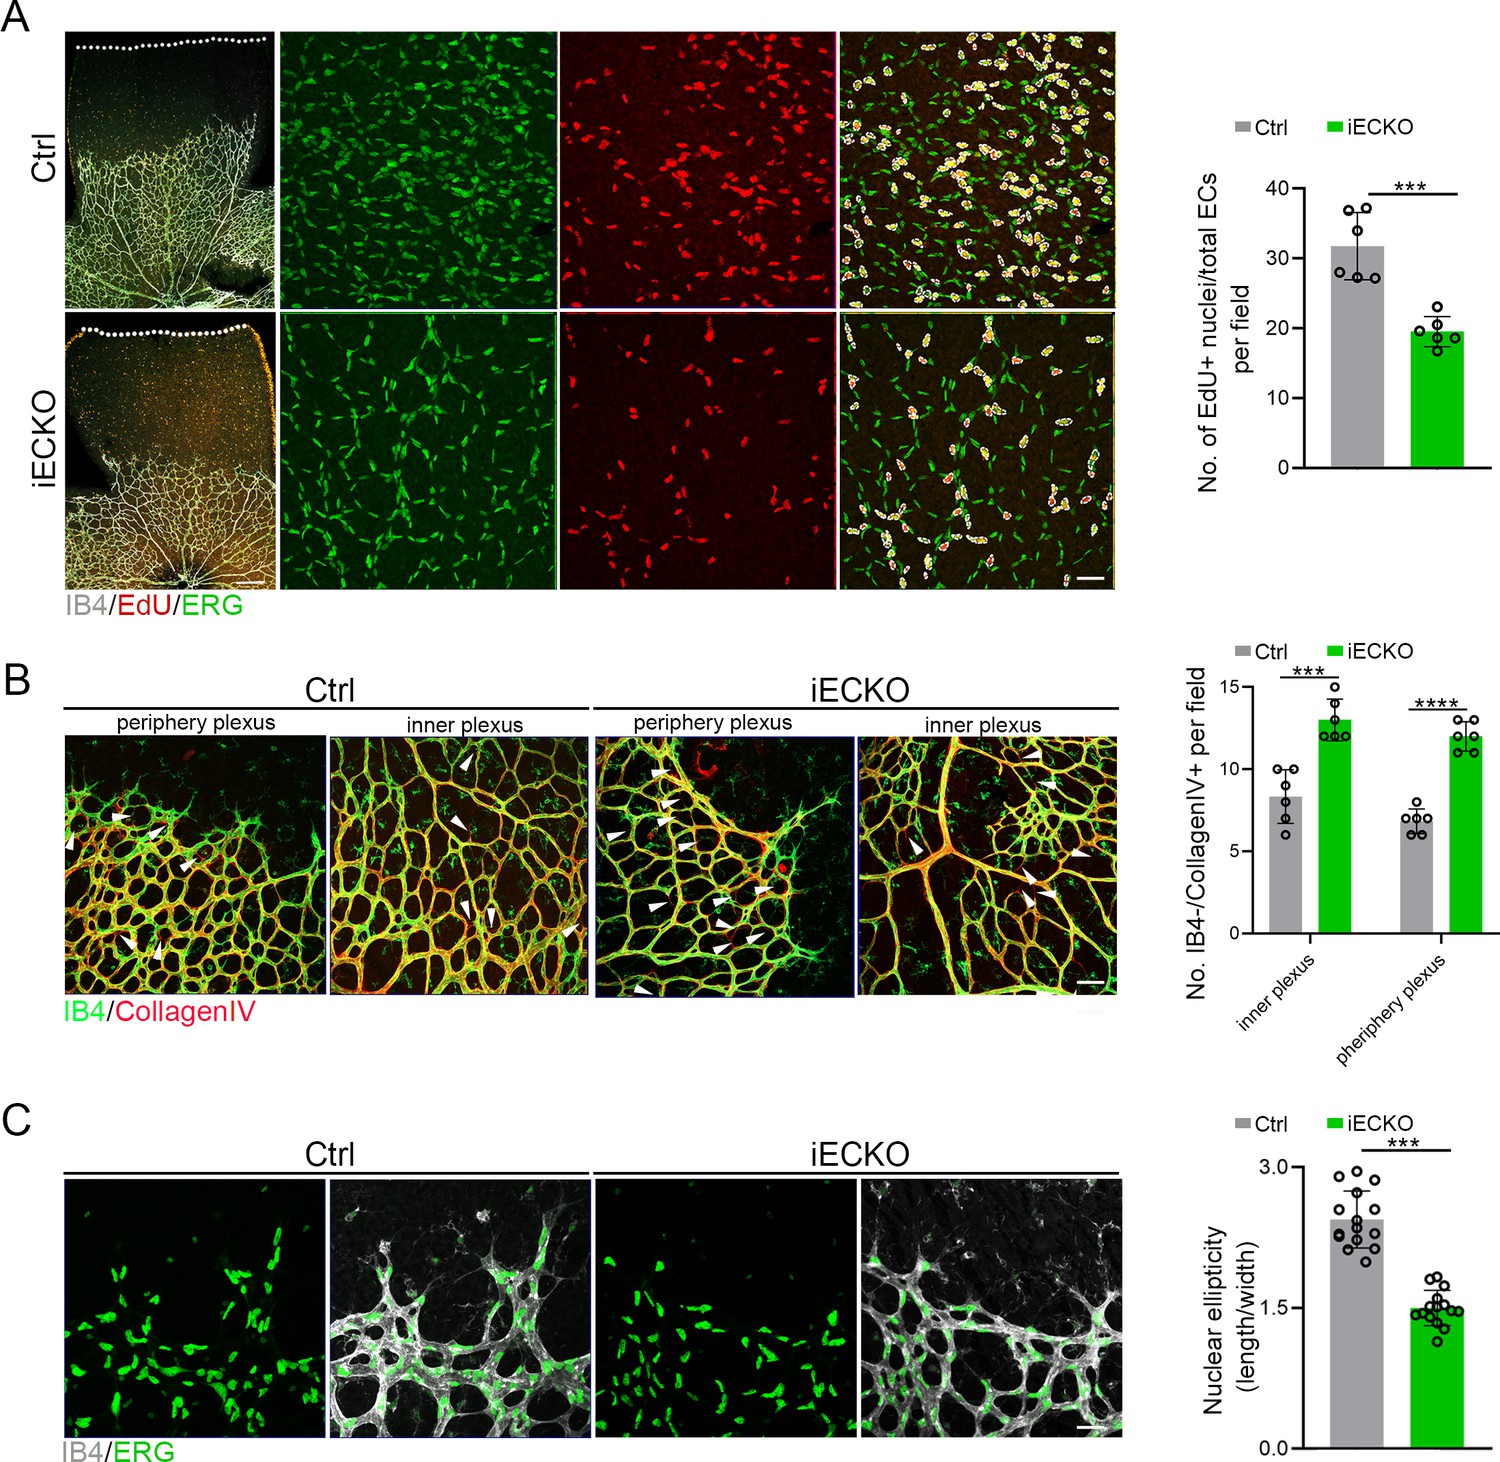
(A) Retina EC proliferation of Ctrl and iECKO mice at the vitreal surface was measured with EdU and ERG labeling at P5. Images captured at higher magnification are shown at right. Dashed lines mark the edge of the developing retina, and dashed circles represent both EdU+ and ERG+ cells. EC proliferation ability was measured by the ration of EdU+ and ERG+ cells per vascular area. Scale bar: 200 and 50 μm (enlarged insets). Error bars indicate the standard deviation (SD). ***p < 0.001, by Student’s t test (n = 6). (B) Representative images of retinal vessels at the periphery plexus and inner plexus of Ctrl and iECKO mice at P5 co-stained with Isolectin-B4 (IB4) (green) and Collagen IV (red). Arrowhead point to empty Collagen IV sleeves. And quantification of ratio of Collagen IV-positive vessel segments to IB4 labeling-negative vessel segments. Scale bar: 50 μm. Error bars indicate the standard deviation (SD). ***p < 0.001, ****p < 0.0001, by Student’s t test (n = 6). (C) Magnified images of IB4+ vessels and ERG+ nuclei of ECs at angiogenic front of Ctrl and iECKO mice at P5. Quantification of tip cell nuclear ellipticity at the angiogenic growth front. Scale bar: 50 μm. Error bars indicate the standard deviation (SD). ***p < 0.001, by Student’s t test (n = 14).
Figure 4—figure supplement 1
Normal state of other cell types and extracellular matrix (ECM) deposition in Capsl-knockout mice retina.
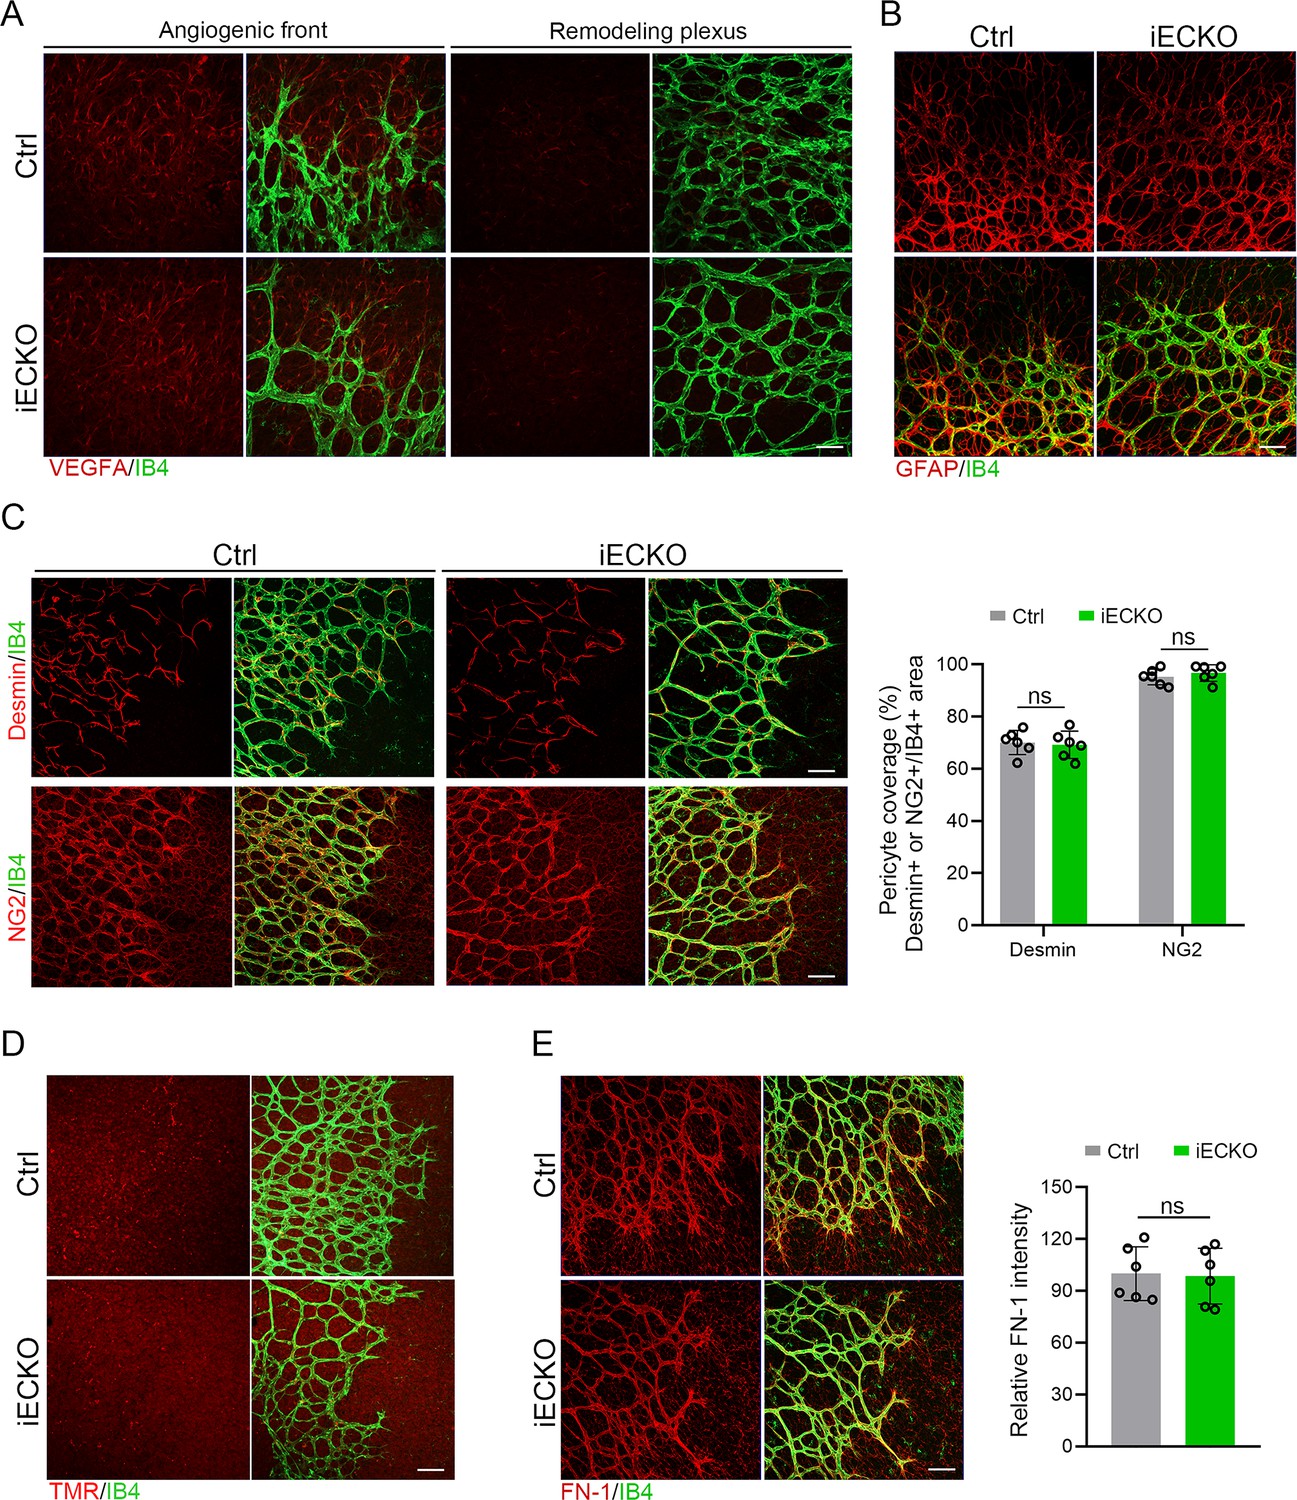
(A) Co-staining of VEGFA (red) and Isolectin-B4 (IB4) (green) at angiogenic front and remodeling plexus in P5 retinas of Ctrl and iECKO mice. Scale bar: 50 μm. (B) Co-staining of Collagen IV (red) and IB4 (green) in P5 retinas of Ctrl and iECKO mice. Scale bar: 50 μm. (C) Maximum intensity projections and quantification of pericyte coverage of the superficial vascular plexus in P5 retinas of Ctrl and iECKO mice stained with Desmin/NG2 (red) and IB4 (green). Scale bar: 50 μm. Error bars indicate the standard deviation (SD). ns: no significance, by Student’s t test (n = 6). (D) Representative confocal images of biocytin-TMR (red) and IB4 (green) in the retinal flat mounts from P5 Ctrl and iECKO mice. Scale bar: 50 μm. (E) Immunofluorescence staining and quantitative analysis of FN-1 (red) stained ECM deposition in retinas form P5 Ctrl and iECKO mice. Scale bar: 50 μm. Error bars indicate the standard deviation (SD). ns: no significance, by Student’s t test (n = 6).
Figure 5
Depletion of CAPSL in human retinal microvascular endothelial cells (HRECs) compromises in vitro endothelial cell (EC) proliferation and migration.
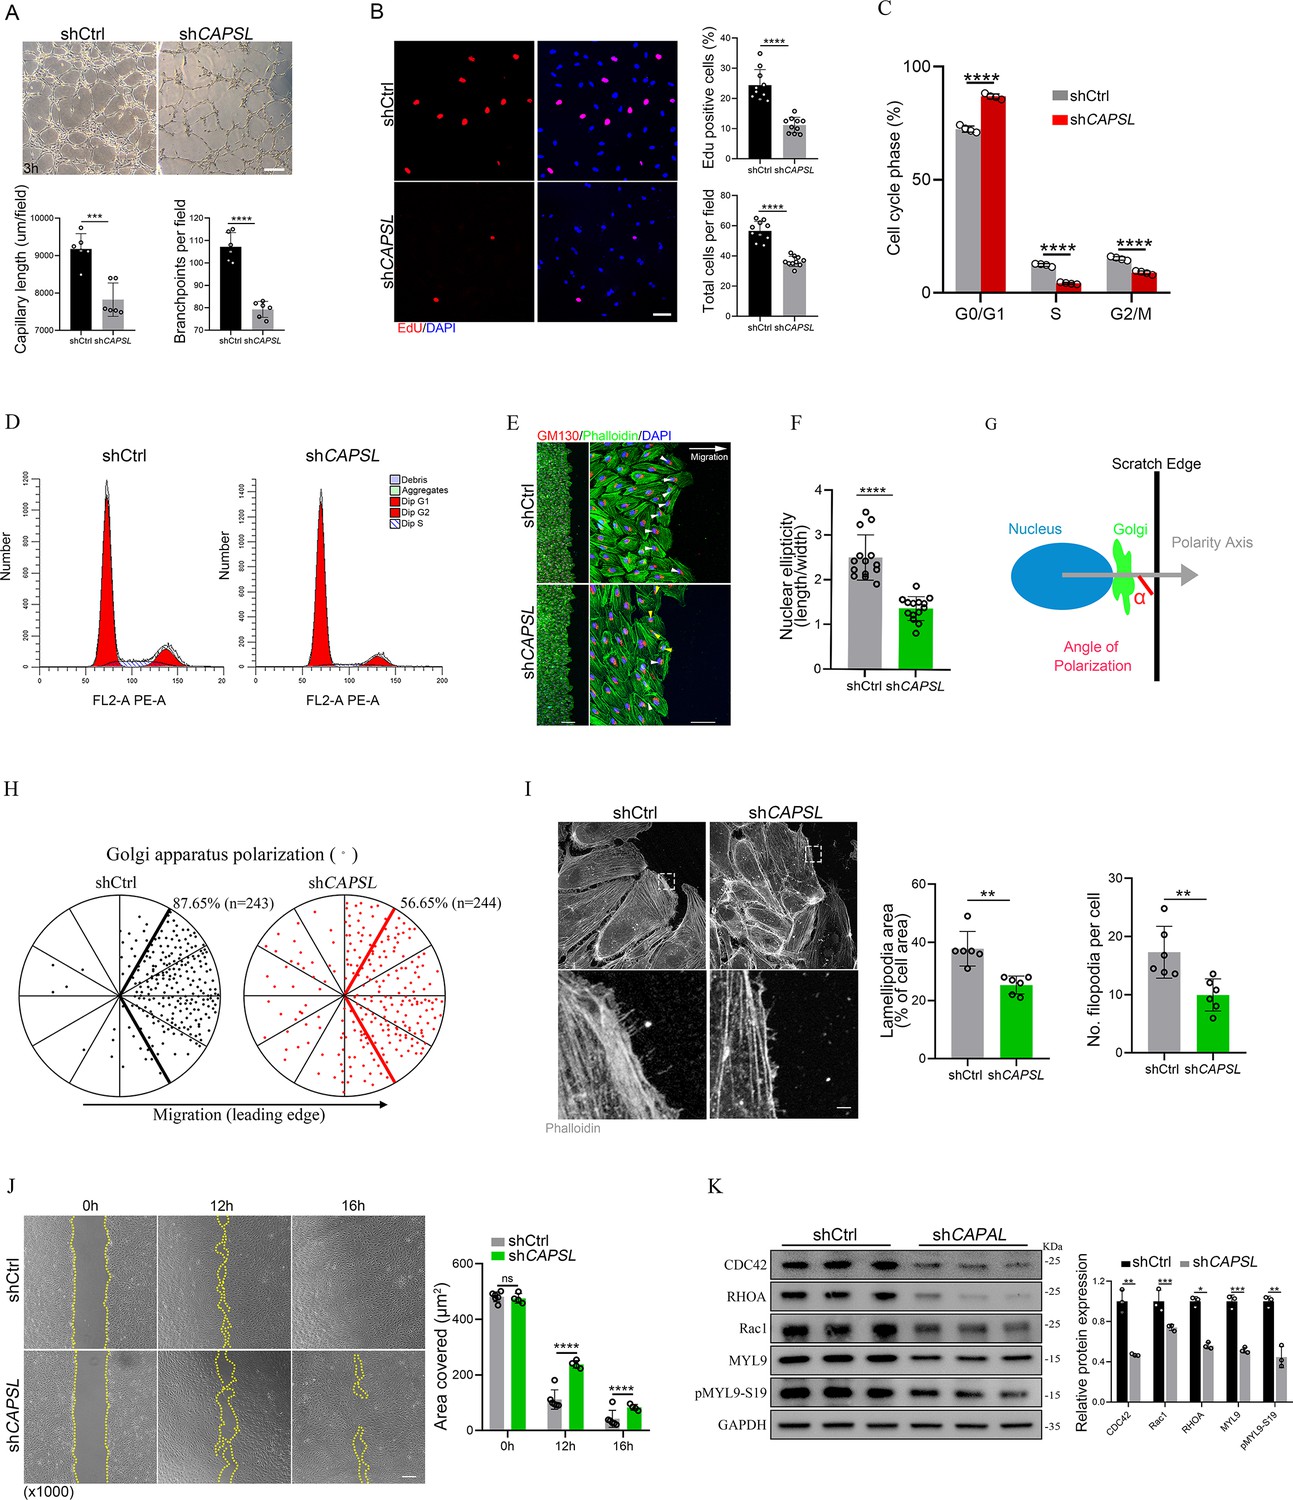
(A) Representative images of in vitro tube formation after transfection of HRECs with shRNA. Scale bar: 200 μm. Error bars indicate the standard deviation (SD). ***p < 0.001, ****p < 0.0001, by Student’s t test (n = 6). (B) Incorporation of EdU in shRNA transfected HRECs. Representative confocal images and quantification of proliferating HRECs both in number per field and proportion of EdU-positive cells. Scale bar: 50 μm. Error bars indicate the standard deviation (SD). ****p < 0.0001, by Student’s t test (n = 10). (C, D) Cell cycle analysis of shCtrl-ECs and shCAPSL-ECs by flow cytometry. Error bars indicate the standard deviation (SD). ****p < 0.0001, by Student’s t test (n = 4). (E) Representative images of phalloidin actin cytoskeleton (green) and GM130 (red) showing polarity angles of shCtrl-ECs and shCAPSL-ECs at the edge of scratch wound. The arrow points toward the wound. Colored arrowheads represent different migration state. Scale bar: 200 μm (left panel), 50 μm (right panel). (F) Quantification of nuclear ellipticity of HRECs at the margin of wound scratch. Error bars indicate the standard deviation (SD). ****p < 0.0001, by Student’s t test (n = 14). (G) Schematic pictures showing the define of polarity axis of each cell. Polarity axis was measured with the angle (α) between the scratch edge and the vector drawn from the center of nucleus to the center of the Golgi apparatus. (H) Polar plots showing Golgi apparatus polarization. The bold lines represent 120° region centered on the vector, which is perpendicular to the wound scratch. The dots represent the angle (α) of each cell and the numbers indicate the frequency of dots within the 120° region of the bold line of shCtrl-ECs (n = 243) and shCAPSL-ECs (n = 244). (I) Images of phalloidin-stained actin cytoskeleton and comparisons of indicated parameters in shCtrl-ECs and shCAPSL-ECs at the edge of scratch wound. The dashed boxed region is shown at higher magnification at the bottom panel. Scale bar: 50 μm (top panels), 25 μm (bottom panels). Error bars indicate the standard deviation (SD). **p < 0.01, by Student’s t test (n = 6). (J) Representative images of wound scratch assay at 0, 12, and 16 hr after wound was made. And the quantification of covered area at different time point. The dashed line indicates the gap of the wound after wound scratch at different time point. Scale bar: 200 μm. Error bars indicate the standard deviation (SD). ****p < 0.0001, ns:no significance, by Student’s t test (n = 6). (K) Immunoblot and quantification analysis of expression of small GTPase proteins and a key regulator of contractile force MYL9 in shCtrl-ECs and shCAPSL-ECs. Error bars indicate the standard deviation (SD). *p < 0.05, **p < 0.01, ***p < 0.001, by Student’s t test (n = 3).
-
Figure 5—source data 1
Uncropped and labeled gels for Figure 5.
- https://cdn.elifesciences.org/articles/96907/elife-96907-fig5-data1-v1.zip
-
Figure 5—source data 2
Raw unedited gels for Figure 5.
- https://cdn.elifesciences.org/articles/96907/elife-96907-fig5-data2-v1.zip
Figure 6 with 2 supplements
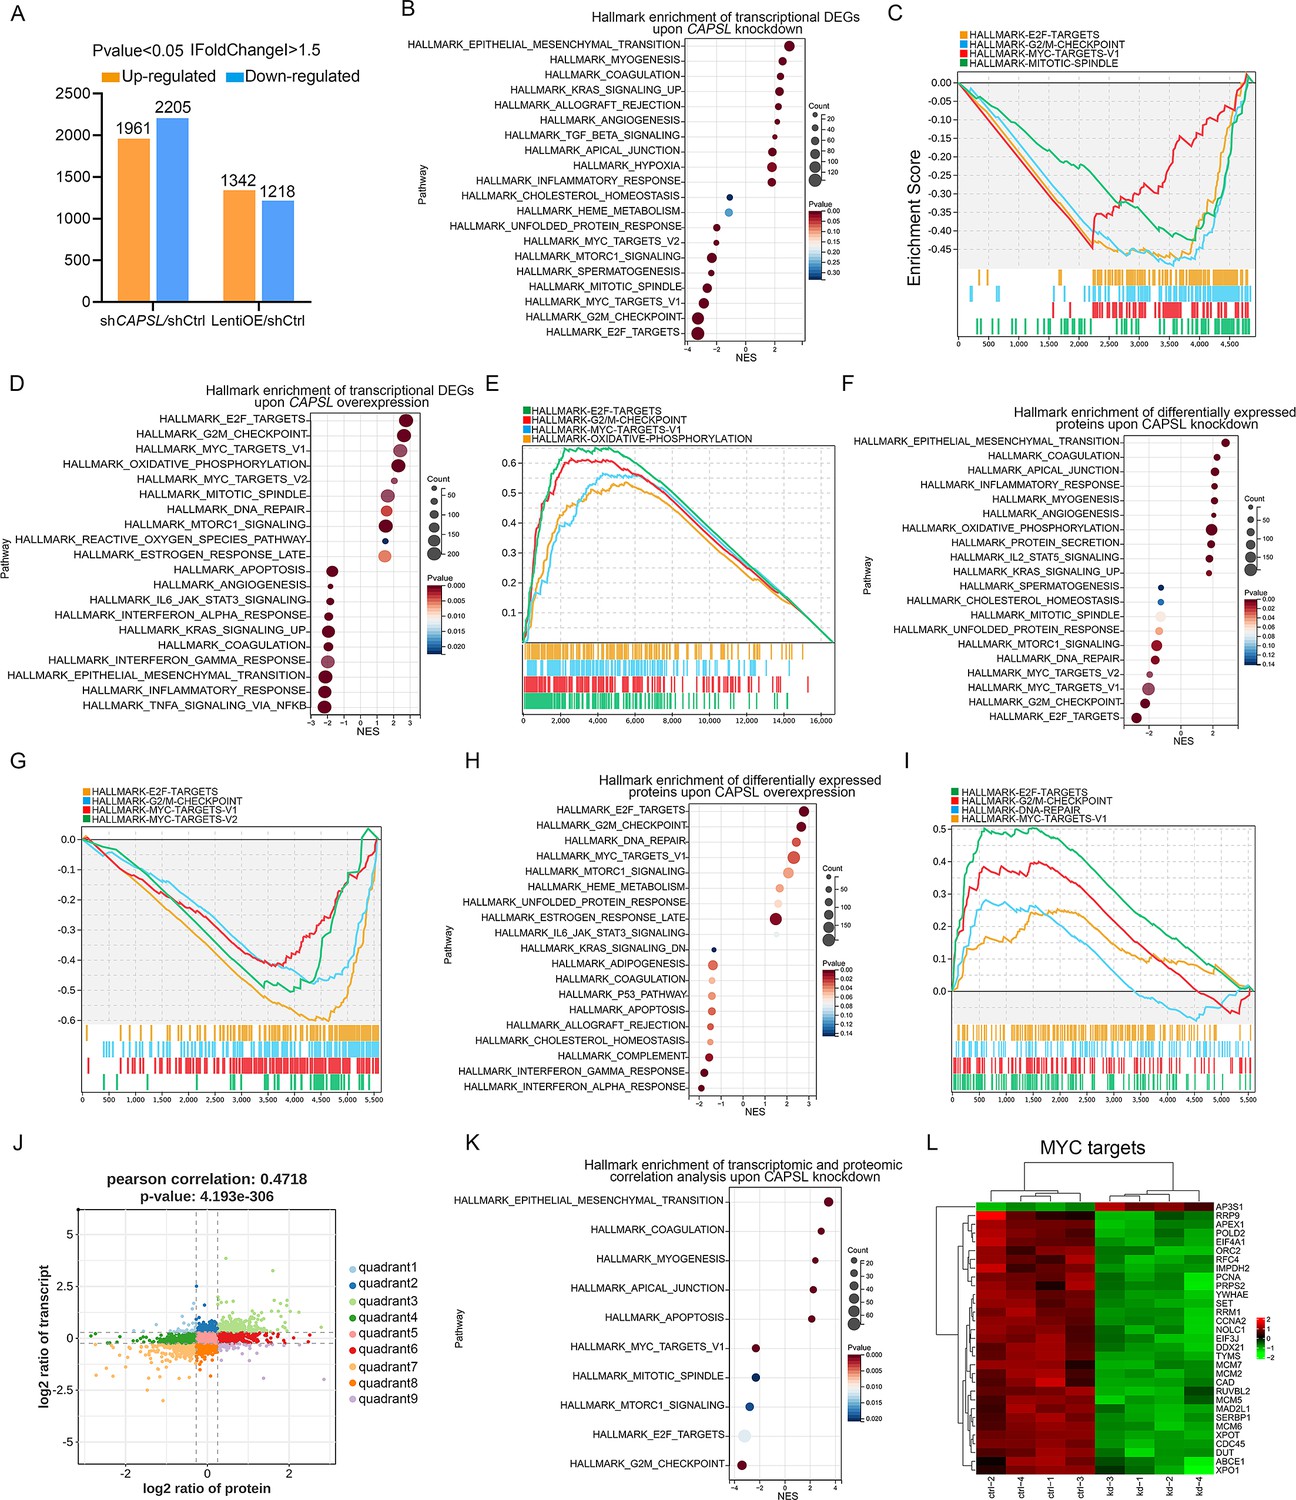
CAPSL suppresses MYC signaling axis.
(A) Differential gene expression information of shCAPSL-ECs versus shCtrl-ECs group and LentiOE-ECs versus shCtrl-ECs group. (B–E) Gene set enrichment analysis (GSEA) on the RNA sequencing data of human retinal microvascular endothelial cells (HRECs). Top 10 ranked up- or down-regulated signaling axis was listed (B) and top 4 down-regulated gene sets were listed (C) in comparison of shCtrl-ECs versus shCAPSL-ECs. Top 10 ranked up- or down-regulated signaling axis was listed (D) and top 4 up-regulated gene sets were listed (E) in comparison of LentiOE-ECs versus shCtrl-ECs. (F–I) GSEA on the proteomic profiling data of HRECs. Top 10 ranked up- or down-regulated signaling axis was listed (F) and top 4 down-regulated gene sets were listed (G) in comparison of shCtrl-ECs versus shCAPSL-ECs. Top 10 ranked up- or down-regulated signaling axis was listed (H) and top 4 up-regulated gene sets were listed (I) in comparison of LentiOE-ECs versus shCtrl-ECs. (J) Correlated RNAs and proteins enriched in nine quadrants of shCtrl-ECs versus shCAPSL-ECs. (K) GSEA on the genes/proteins in quadrants 3 and 7, and top 5 ranked up- or down-regulated signaling axis was listed. (L) Clustered heatmap of the expression fold changes of several MYC signature genes of in both RNA profiling and proteomic profiling of shCtrl-ECs and shCAPSL-ECs.
Figure 6—figure supplement 1
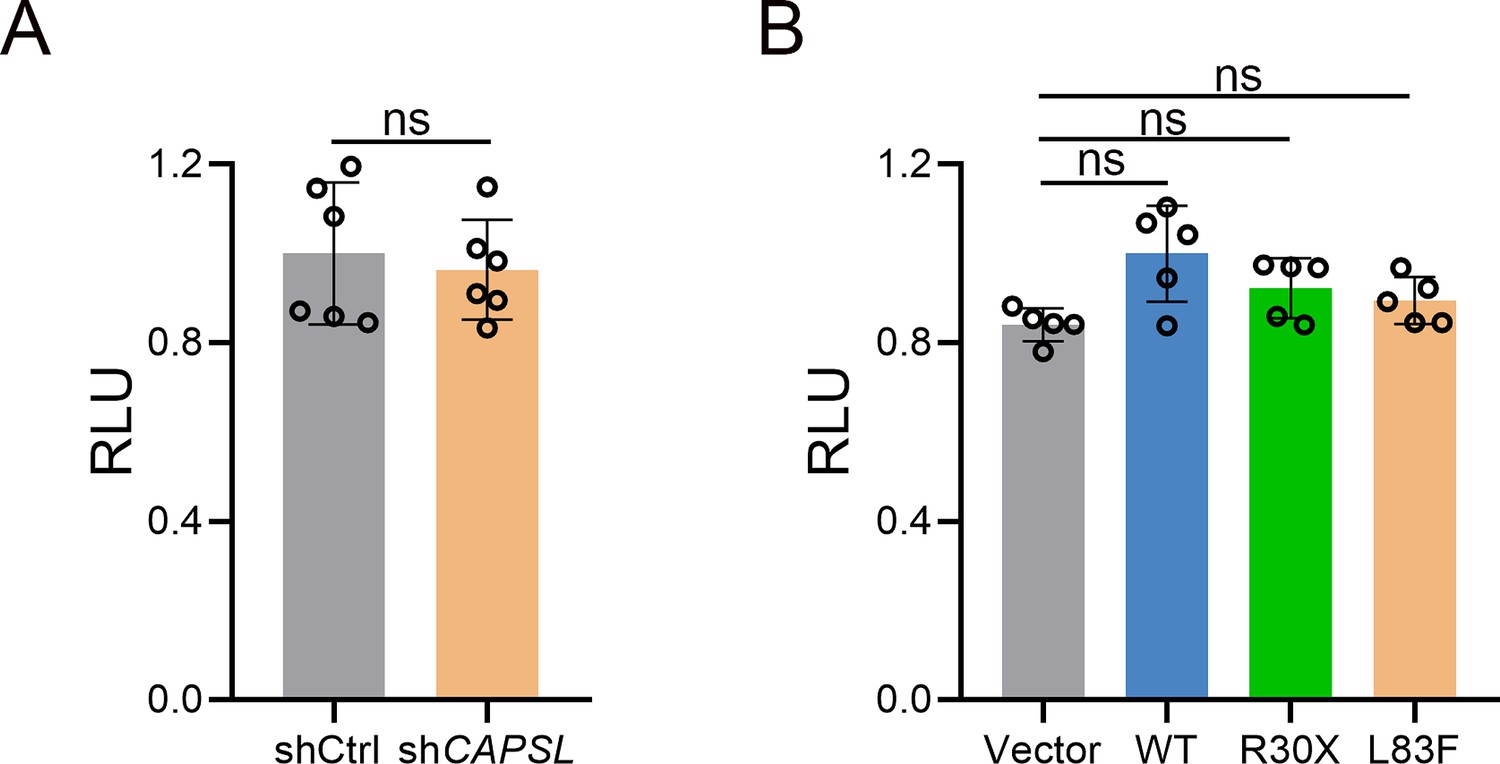
CAPSL is not involve in Norrin/β-catenin signaling pathway.
(A) Results of luciferase reporter assay of shCtrl-293STF cells and shCAPSL-293STF cells. Error bars indicate the standard deviation (SD). ns: no significance, by Student’s t test (n = 6). (B) Results of luciferase reporter assay of shCAPSL-293STF cells were transfected with plasmids containing CAPSL (WT, R30X, or L83F) or empty vector. Error bars indicate the standard deviation (SD). ns: no significance, by Student’s t test (n = 5).
Figure 6—figure supplement 2
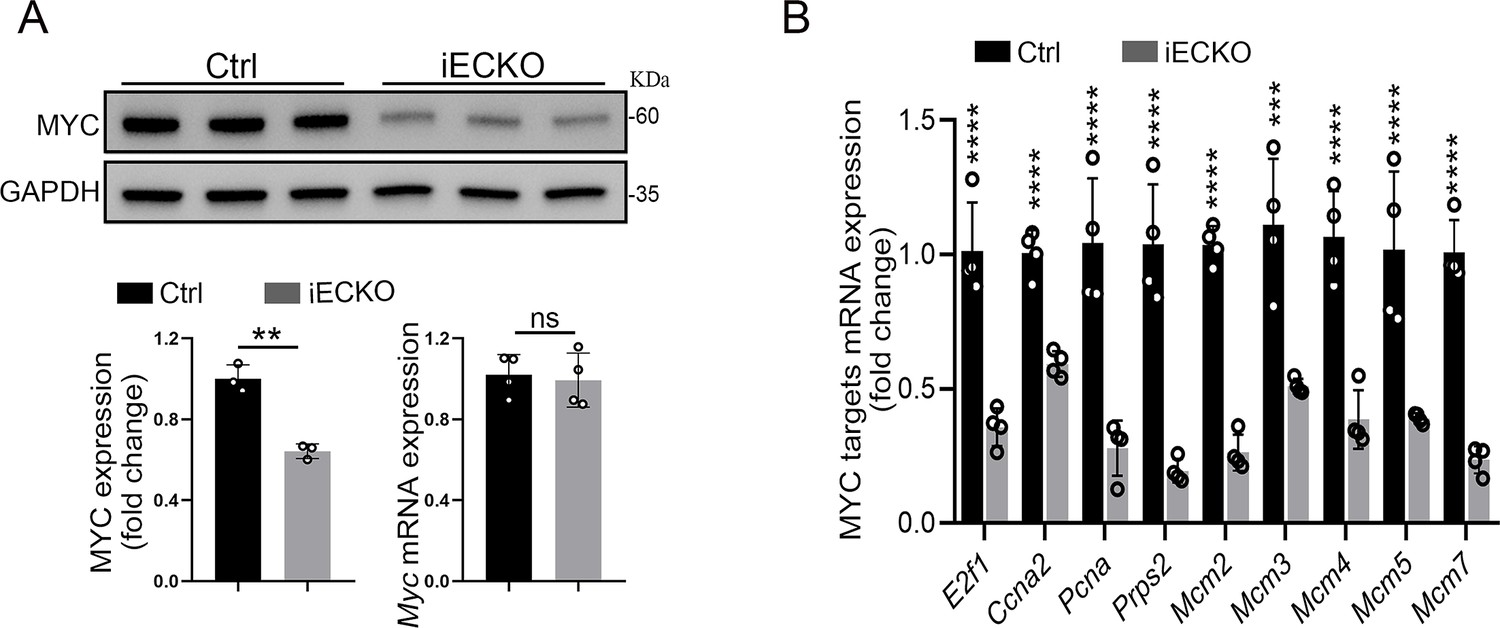
Capsl depletion resulted in downregulation of MYC targets.
(A) MYC expression level of P40 Ctrl and iECKO mice lung tissue was quantified by western blot and RT-qPCR. Error bars indicate the standard deviation (SD). **p < 0.01, ns: no significance by Student’s t test (n = 3). (B) Relative mRNA expression of MYC targets of P35 Ctrl and iECKO mice lung tissue. Error bars indicate the standard deviation (SD). ***p < 0.001, ****p < 0.0001, by Student’s t test (n = 4).
-
Figure 6—figure supplement 2—source data 1
Uncropped and labeled gels for Figure 6—figure supplement 2.
- https://cdn.elifesciences.org/articles/96907/elife-96907-fig6-figsupp2-data1-v1.zip
-
Figure 6—figure supplement 2—source data 2
Raw unedited gels for Figure 6—figure supplement 2.
- https://cdn.elifesciences.org/articles/96907/elife-96907-fig6-figsupp2-data2-v1.zip
Figure 7
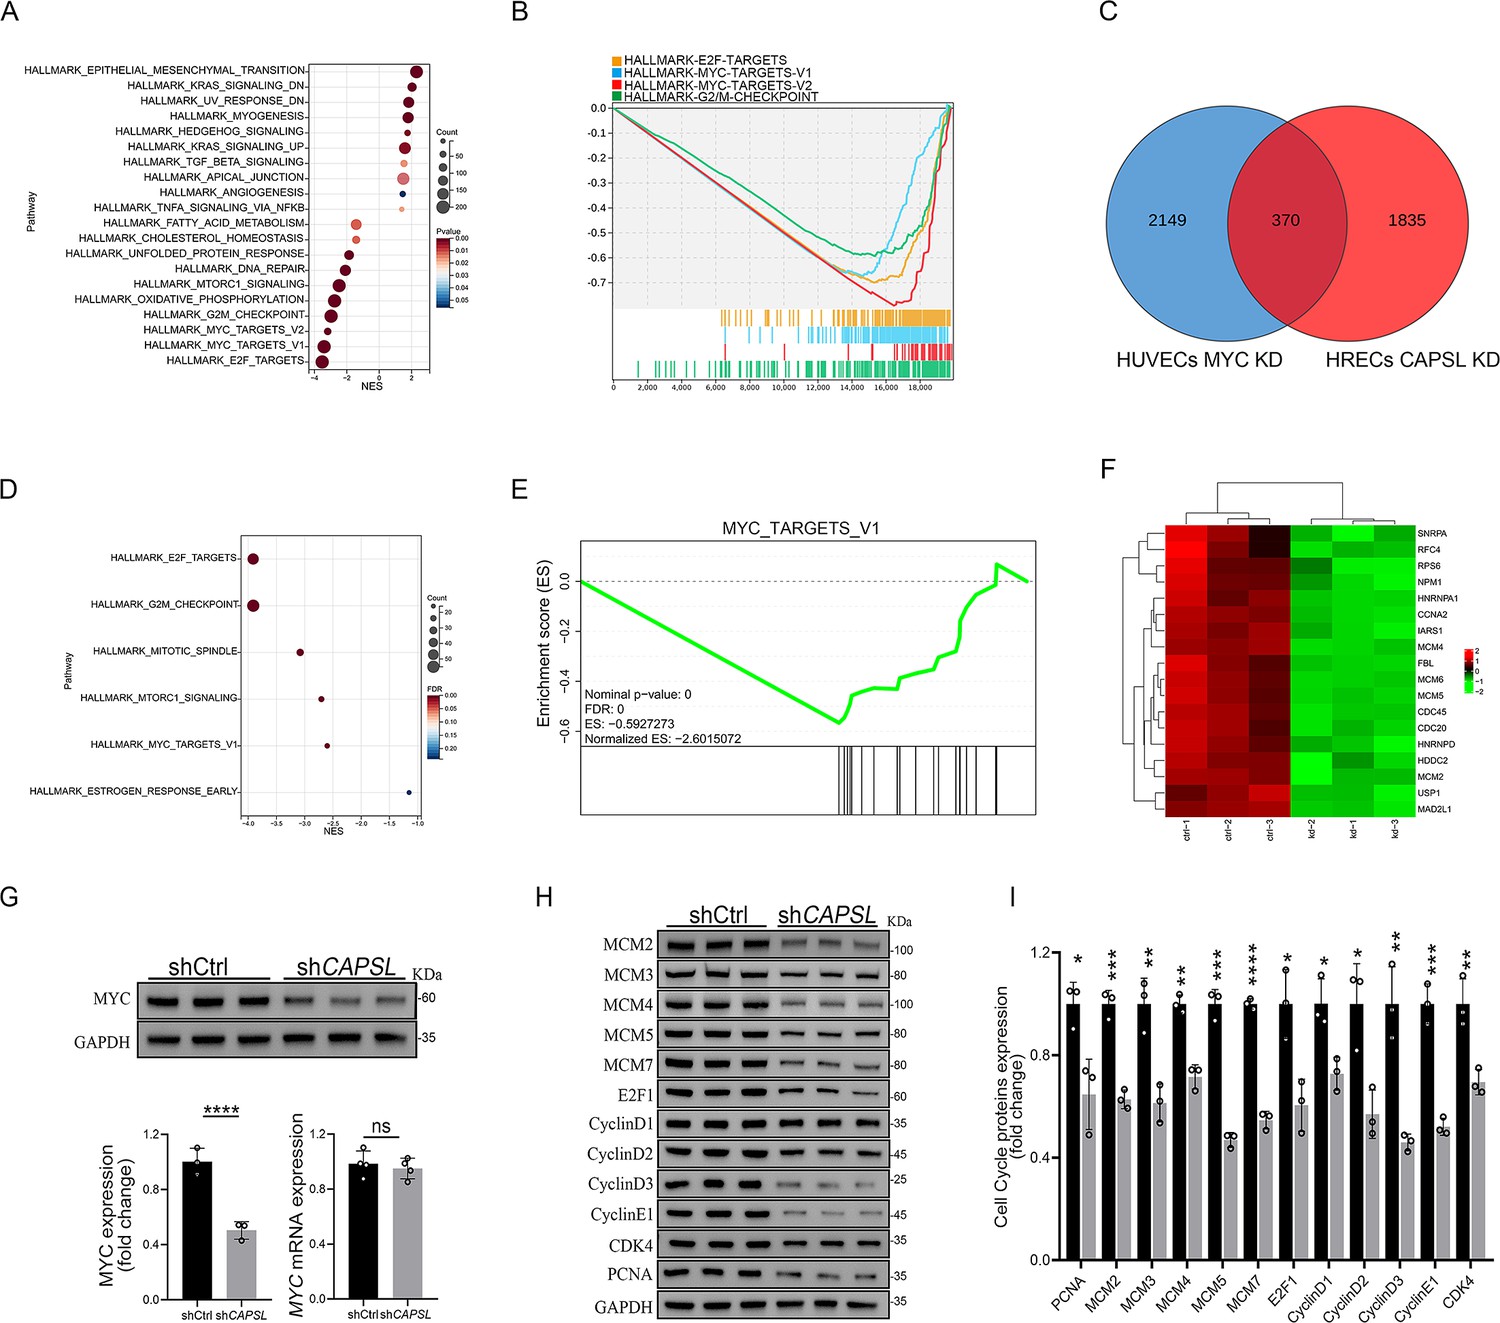
Loss of CAPSL led to similar transcriptional regulatory patterns to the loss of MYC in human umbilical vein endothelial cells (HUVECs).
(A, B) Gene set enrichment analysis (GSEA) on the RNA sequencing data in comparison of shCtrl-HUVECs versus shMYC-HUVECs. Top 10 ranked up- or down-regulated signaling axis was listed (A) and top 4 down-regulated gene sets were listed (B). (C) Venn diagram analysis of down-regulated genes in CAPSL-depleted human retinal microvascular endothelial cells (HRECs) and cMYC-depleted HUVECs. (D, E) GSEA on the shared down-regulated genes in CAPSL-depleted HRECs and MYC-depleted HUVECs. (F) Heatmap of MYC signature genes of shared genes based on Venn analysis. (G) MYC expression level in shCtrl-ECs and shCAPSL-ECs was quantified by western blot and RT-qPCR. Error bars indicate the standard deviation (SD). ****p < 0.0001, ns: no significance by Student’s t test (n = 3). (H) Western blot analysis of expression of MYC targets. (I) Quantification analysis of MYC targets. Error bars indicate the standard deviation (SD). *p < 0.05, **p < 0.01, ***p < 0.001, ****p < 0.0001, by Student’s t test (n = 3).
-
Figure 7—source data 1
Uncropped and labeled gels for Figure 7.
- https://cdn.elifesciences.org/articles/96907/elife-96907-fig7-data1-v1.zip
-
Figure 7—source data 2
Raw unedited gels for Figure 7.
- https://cdn.elifesciences.org/articles/96907/elife-96907-fig7-data2-v1.zip
Additional files
-
Supplementary file 1
The results of pathological prediction of CAPSL variants.
- https://cdn.elifesciences.org/articles/96907/elife-96907-supp1-v1.xlsx
-
Supplementary file 2
The differentially regulated genes in shCtrl-ECs and shCAPSL-ECs.
- https://cdn.elifesciences.org/articles/96907/elife-96907-supp2-v1.xlsx
-
Supplementary file 3
Down-regulated genes shared in CAPSL-depleted HRECs and MYC-depleted HUVECs.
- https://cdn.elifesciences.org/articles/96907/elife-96907-supp3-v1.xlsx
-
Supplementary file 4
List of the antibodies used in this study.
- https://cdn.elifesciences.org/articles/96907/elife-96907-supp4-v1.xlsx
-
Supplementary file 5
List of the PCR primers used in this study.
- https://cdn.elifesciences.org/articles/96907/elife-96907-supp5-v1.xlsx
-
MDAR checklist
- https://cdn.elifesciences.org/articles/96907/elife-96907-mdarchecklist1-v1.docx
Download links
A two-part list of links to download the article, or parts of the article, in various formats.
Downloads (link to download the article as PDF)
Open citations (links to open the citations from this article in various online reference manager services)
Cite this article (links to download the citations from this article in formats compatible with various reference manager tools)
Dysfunction of Calcyphosine-Like gene impairs retinal angiogenesis through the MYC axis and is associated with familial exudative vitreoretinopathy
eLife 13:RP96907.
https://doi.org/10.7554/eLife.96907.3


