Pectin methylesterase activity is required for RALF1 peptide signalling output
- Institute of Biology II, Molecular Plant Physiology (MoPP), University of Freiburg, Germany
- Center for Integrative Biological Signalling Studies (CIBSS), University of Freiburg, Germany
- Institute of Molecular Plant Biology (IMPB), Department of Applied Genetics and Cell Biology, University of Natural Resources and Life Sciences (BOKU), Austria
- Core Facility Signalling Factory & Robotics, University of Freiburg, Germany
- Centre for Biological Signalling Studies (BIOSS), University of Freiburg, Germany
- Institute of Biology II, Cell Biology, University of Freiburg, Germany
Figures
Figure 1
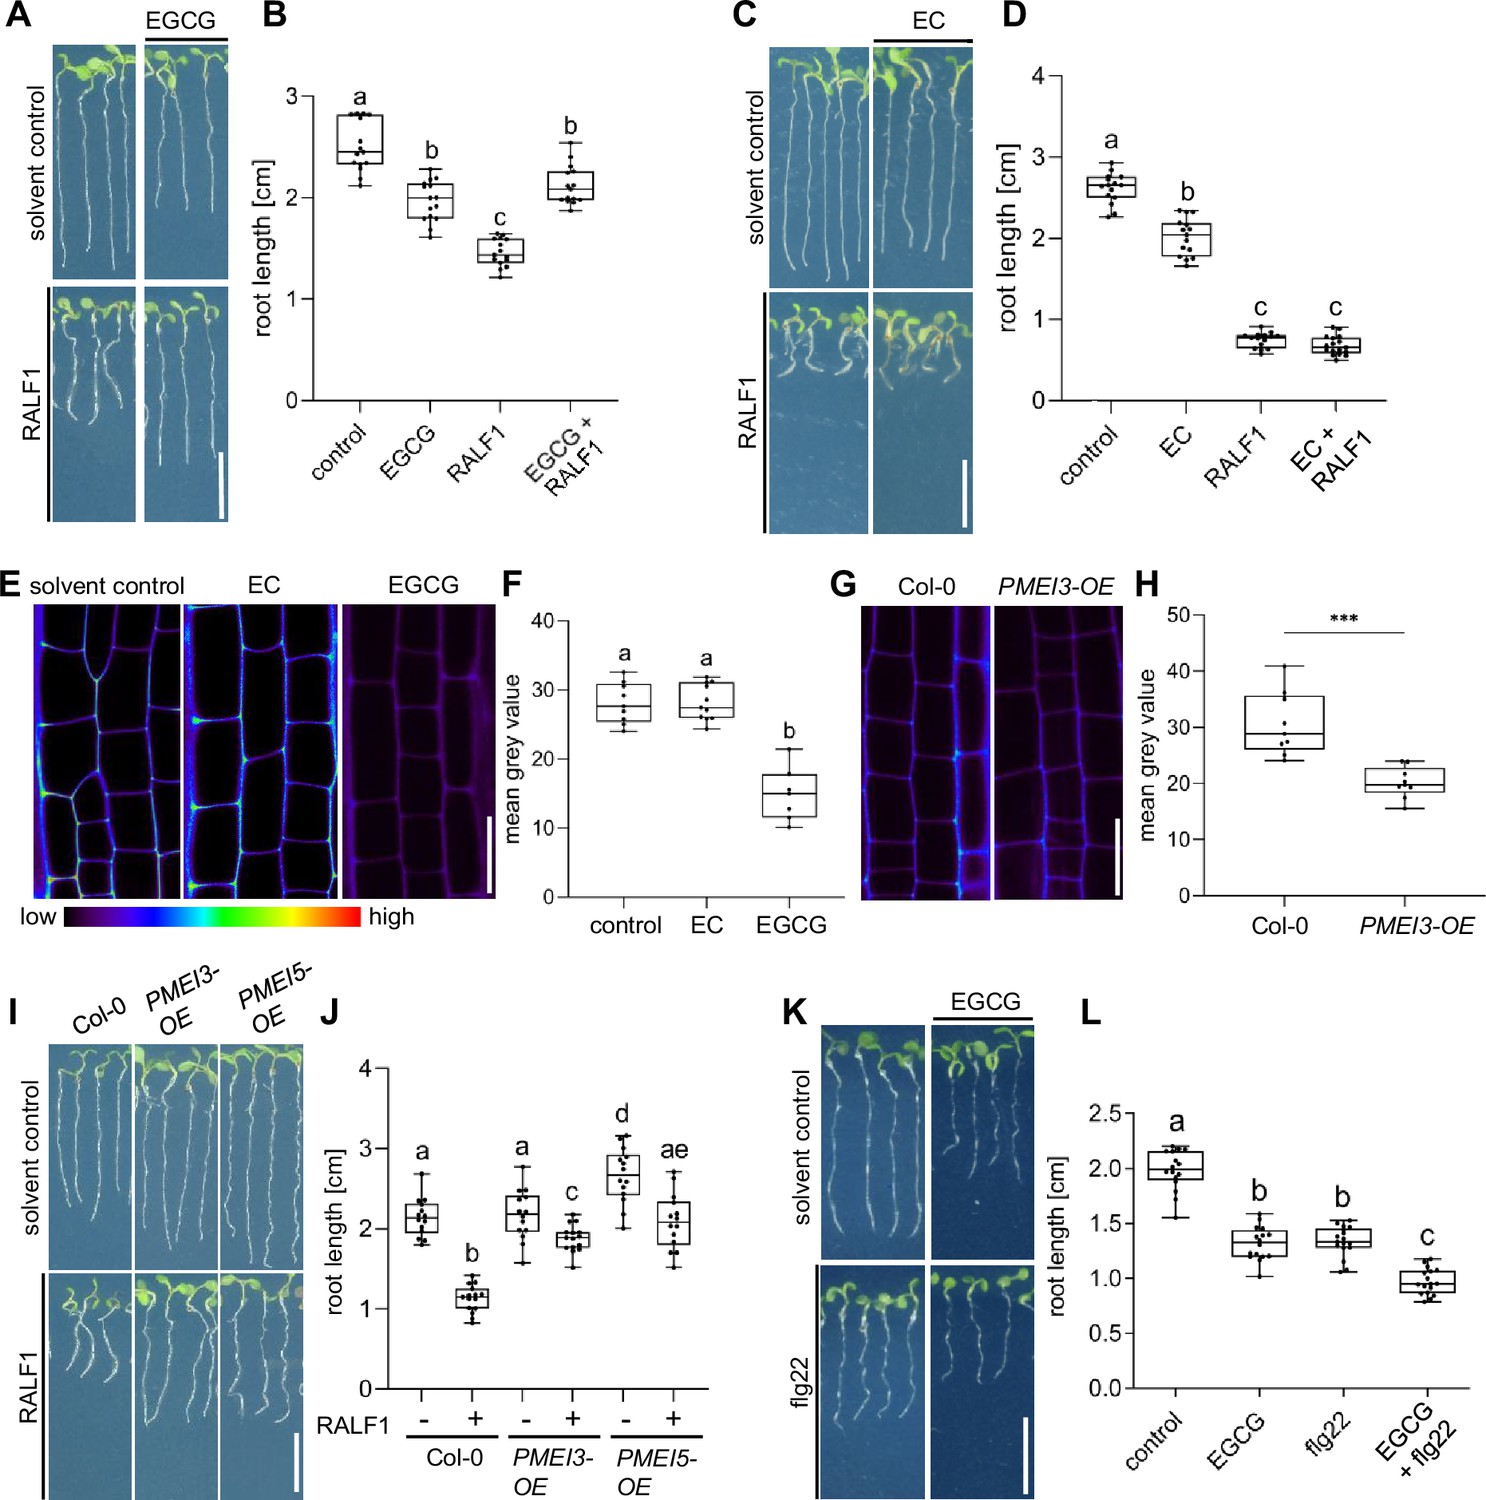
Pectin methyl esterase (PME) activity is required for rapid alkalinisation factor1 (RALF1)-induced root growth repression.
(A, B) Three-day-old wild-type seedlings were subjected for 3 days to 1 µM RALF1 and/or 2.5 µM epigallocatechin gallate (EGCG) (A). (B) Boxplots depict the root length of wild-type seedlings under different treatments shown in (A). (C, D) Three-day-old wild-type seedlings were transferred for 3 days to solvent control, 1 µM RALF1 and/or 15 µM epicatechin (EC) (C). (D) Boxplots depict the root length of wild-type seedlings under different treatments shown in (C). (E, F) Confocal microscopy images of the root epidermal cells of 6-day-old wild-type seedlings after 3 hr treatment in liquid medium with 50 µM EC/EGCG or solvent control. Seedlings were stained with COS488 to visualize de-methylesterified pectin. (F) Boxplots displaying the probe staining signal intensity are shown in (E). Scale bar = 25 µm, n=8–10 roots per treatment with a total number of 79–96 quantified cells. (G, H) Confocal microscopy images of the root epidermal cells of 6-day-old wild-type and PMEI3-OE seedlings, stained with COS488 to visualize de-methylesterified pectin. (H) Boxplots displaying the probe staining signal intensity are shown in (G). Scale bar = 25 µm, n=9–11 roots per treatment with 71–77 quantified cells. (I–J) Three-day-old wild-type, PMEI3-OE, and PMEI5-OE seedlings were exposed for three days to 1 µM RALF1 or solvent control (I). (J) Boxplots depict the root length of wild-type compared to PMEI3-OE seedlings of the treatments shown in (I). (K, L) Three-day-old wild-type seedlings were exposed for three days with 0.5 µM flg22 and 15 µM EGCG or solvent control (K). (L) Boxplots depict the root length of wild-type seedlings under different treatments shown in (K). Statistical significance was determined by a one-way ANOVA with a Tukey Post Hoc multiple comparisons test (p<0.05, letters indicate significance categories) (B, D, F, J, and L) and a student´s t-test (***p=0.0001) (H). Boxplots: Box limits represent the 25th and 75th percentile, and the horizontal line represents the median. Whiskers display min. to max. values. Representative experiments are shown. (A, C, I, and K) Scale bar = 1 cm, n=11–13 roots per treatment/line.
-
Figure 1—source data 1
Data for Figure 1A, B.
- https://cdn.elifesciences.org/articles/96943/elife-96943-fig1-data1-v1.xlsx
-
Figure 1—source data 2
Data for Figure 1C, D.
- https://cdn.elifesciences.org/articles/96943/elife-96943-fig1-data2-v1.xlsx
-
Figure 1—source data 3
Data for Figure 1E, F.
- https://cdn.elifesciences.org/articles/96943/elife-96943-fig1-data3-v1.xlsx
-
Figure 1—source data 4
Data for Figure 1G, H.
- https://cdn.elifesciences.org/articles/96943/elife-96943-fig1-data4-v1.xlsx
-
Figure 1—source data 5
Data for Figure 1I, J.
- https://cdn.elifesciences.org/articles/96943/elife-96943-fig1-data5-v1.xlsx
-
Figure 1—source data 6
Data for Figure 1K, L.
- https://cdn.elifesciences.org/articles/96943/elife-96943-fig1-data6-v1.xlsx
Figure 2 with 1 supplement
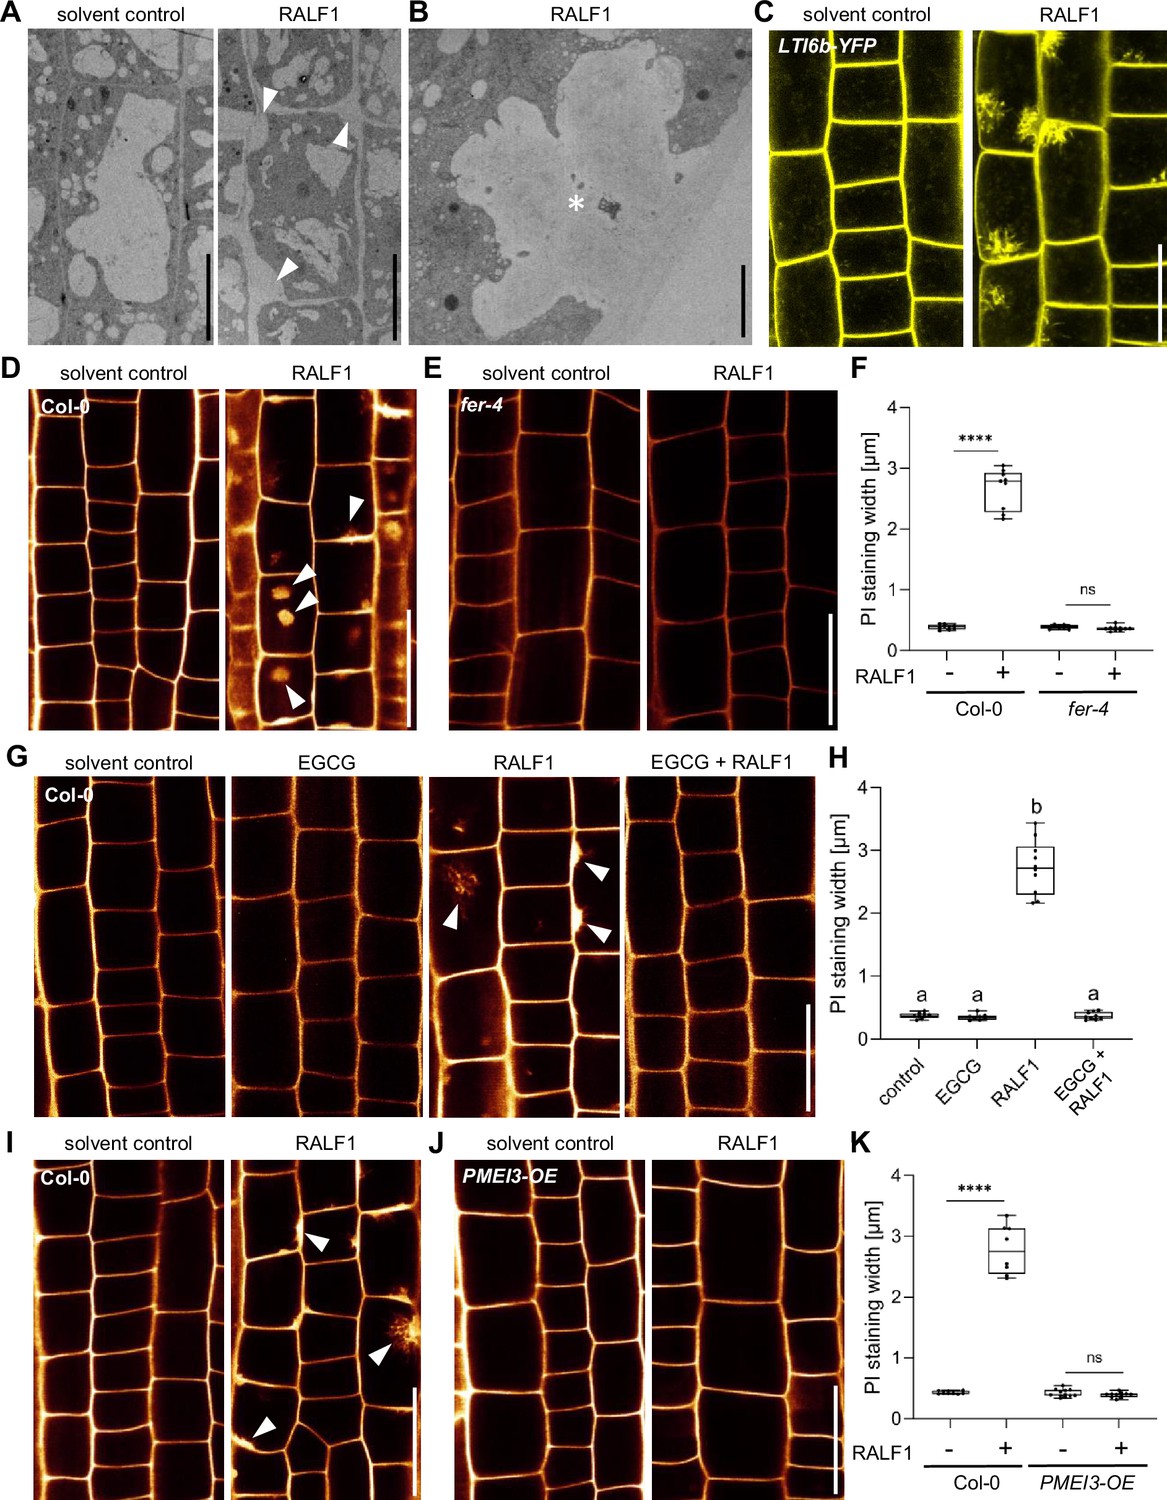
Rapid alkalinisation factor1 (RALF1) requires pectin methyl esterase (PME) activity to affect cell wall integrity.
(A, B) Representative transmission electron microscopy (TEM) images of epidermal root cells treated for 3 hr with solvent control and 1µM RALF1, respectively. Arrowheads indicate RALF1-induced plasma membrane invaginations. Scale bar = 10 µm. Panel (B) shows details, Scale bar = 2 µm. (C) Confocal microscopy images of the root epidermal cells of 6-day-old LTI6b-YFP expressing seedlings, treated for 3 hr with solvent control or 1µM RALF1. Scale bar = 25 µm. (D–F) Confocal microscopy images of the root epidermal cells of 6-day-old wild-type (D) and fer-4 mutant (E) seedlings, treated for 3 hr with 1 µM RALF1 or solvent control. Seedlings were mounted in propidium iodide to visualize the cell walls. Arrowheads indicate RALF1-induced alterations of the cell wall stain. (F) Graphs represent the width of propidium iodide (PI) signal per root under different treatments shown in (D, E). Scale bar = 25 µm, n=9–11 roots per treatment with a total number of 49–51 quantified cells. (G, H) Confocal microscopy images (G) and quantification (H) of 6-day-old roots of wild-type seedlings, treated in liquid medium with 1 µM RALF1 and/or 50 µM epigallocatechin gallate (EGCG) as well as solvent control for 3 hr. Seedlings were mounted in propidium iodide to visualize the cell walls. Arrowheads indicate cell wall invaginations. Scale bar = 25 µm, n=8–10 roots per treatment with a total number of 44–49 quantified cells. (I–K) Confocal microscopy images (I, J) and quantification (K) of 6-day-old wild-type (I) and PMEI3-OE (J) roots, treated in liquid medium with 1 µM RALF1 or solvent control for 3 hr. Seedlings were mounted in propidium iodide to visualize the cell walls. Arrowheads indicate cell wall invaginations. Scale bar = 25 µm, n=8–12 roots per treatment with a total number of 46–53 quantified cells. Statistical significance was determined by a one-way ANOVA with a Tukey Post Hoc multiple comparisons test (p<0.05, letters indicate significance categories) (H) or a two-way ANOVA with Bonferroni Post Hoc test (****p<0.0001) (F, K). Boxplots: Box limits represent the 25th and 75th percentile, and the horizontal line represents the median. Whiskers display min. to max. values.
-
Figure 2—source data 1
Data for Figure 2F.
- https://cdn.elifesciences.org/articles/96943/elife-96943-fig2-data1-v1.xlsx
-
Figure 2—source data 2
Data for Figure 2H.
- https://cdn.elifesciences.org/articles/96943/elife-96943-fig2-data2-v1.xlsx
-
Figure 2—source data 3
Data for Figure 2K.
- https://cdn.elifesciences.org/articles/96943/elife-96943-fig2-data3-v1.xlsx
Figure 2—figure supplement 1
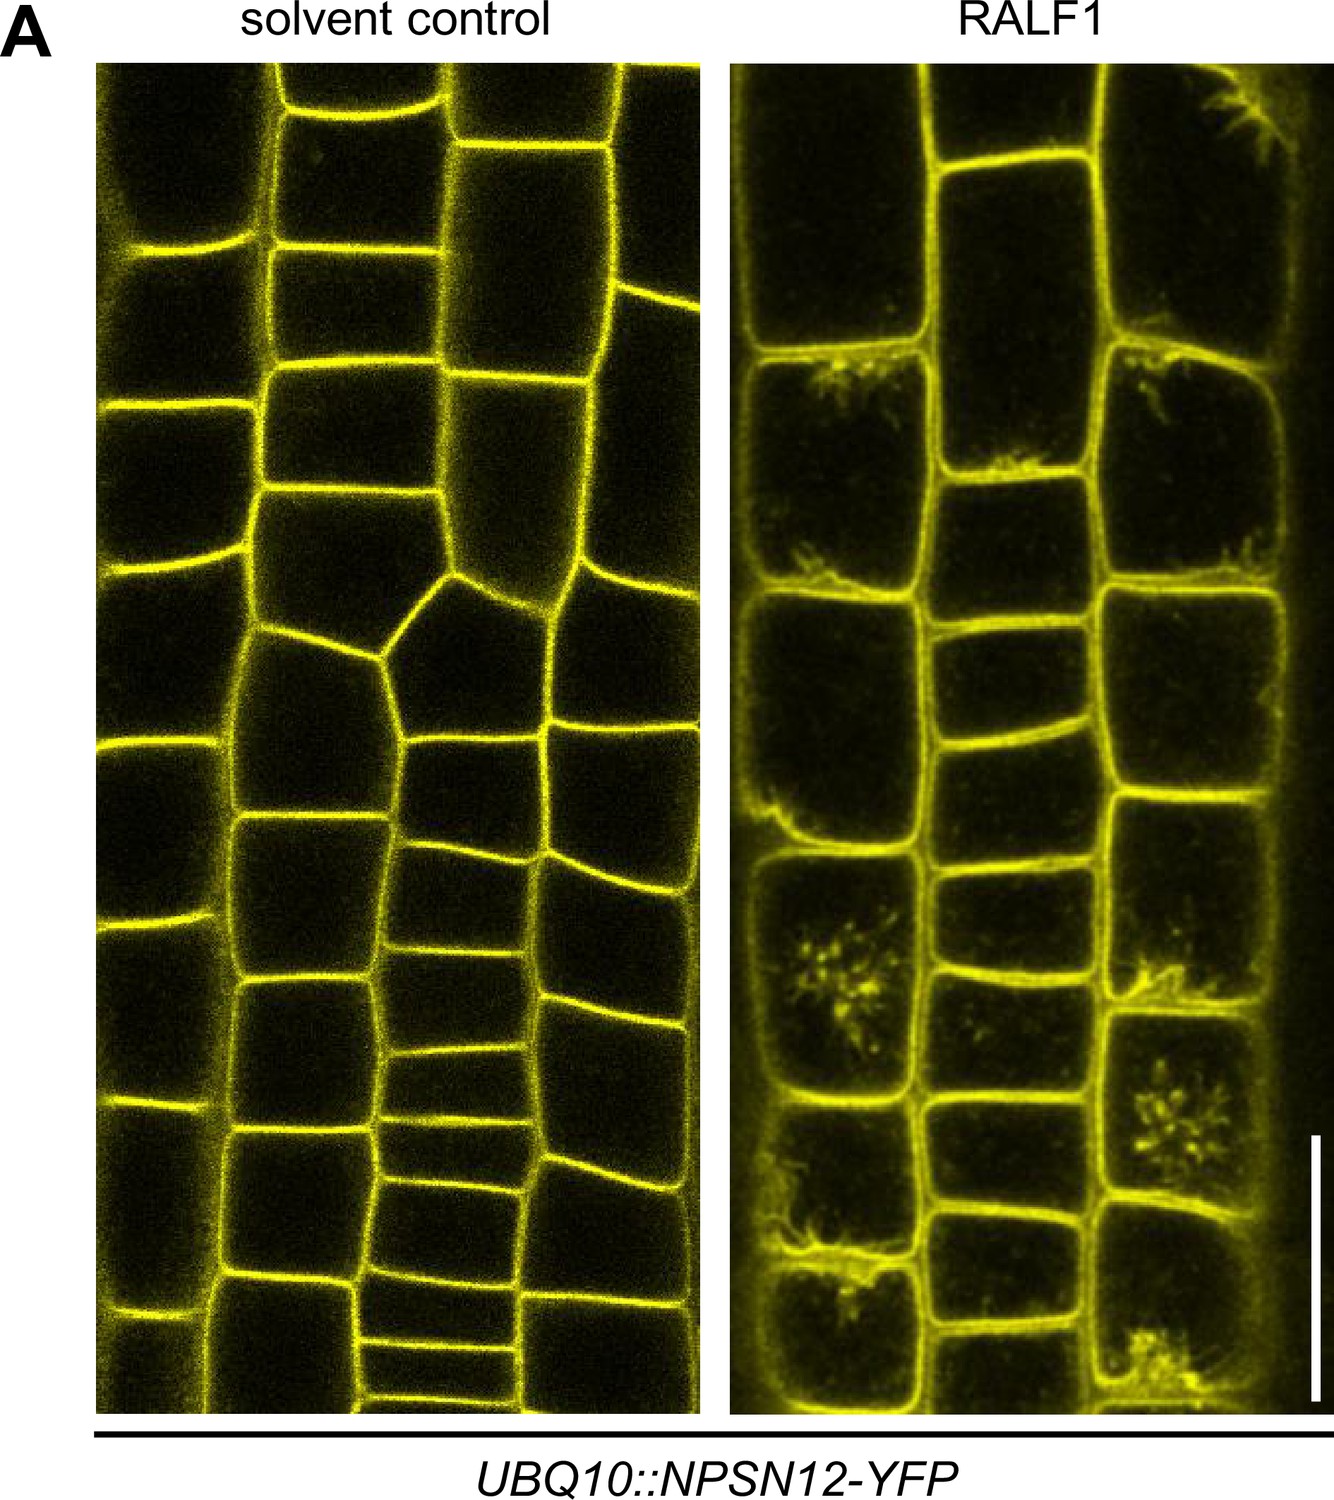
Cell wall invaginations after rapid alkalinisation factor1 (RALF1) treatment in a plasma membrane marker.
(A) Confocal images of epidermal cells in 6-day-old roots of the plasma membrane marker UBQ10::NPSN12-YFP after 3 hr treatment in liquid medium with solvent control or 1 µM RALF1. Scale bar = 25 µm, n=10–13.
Figure 3 with 1 supplement
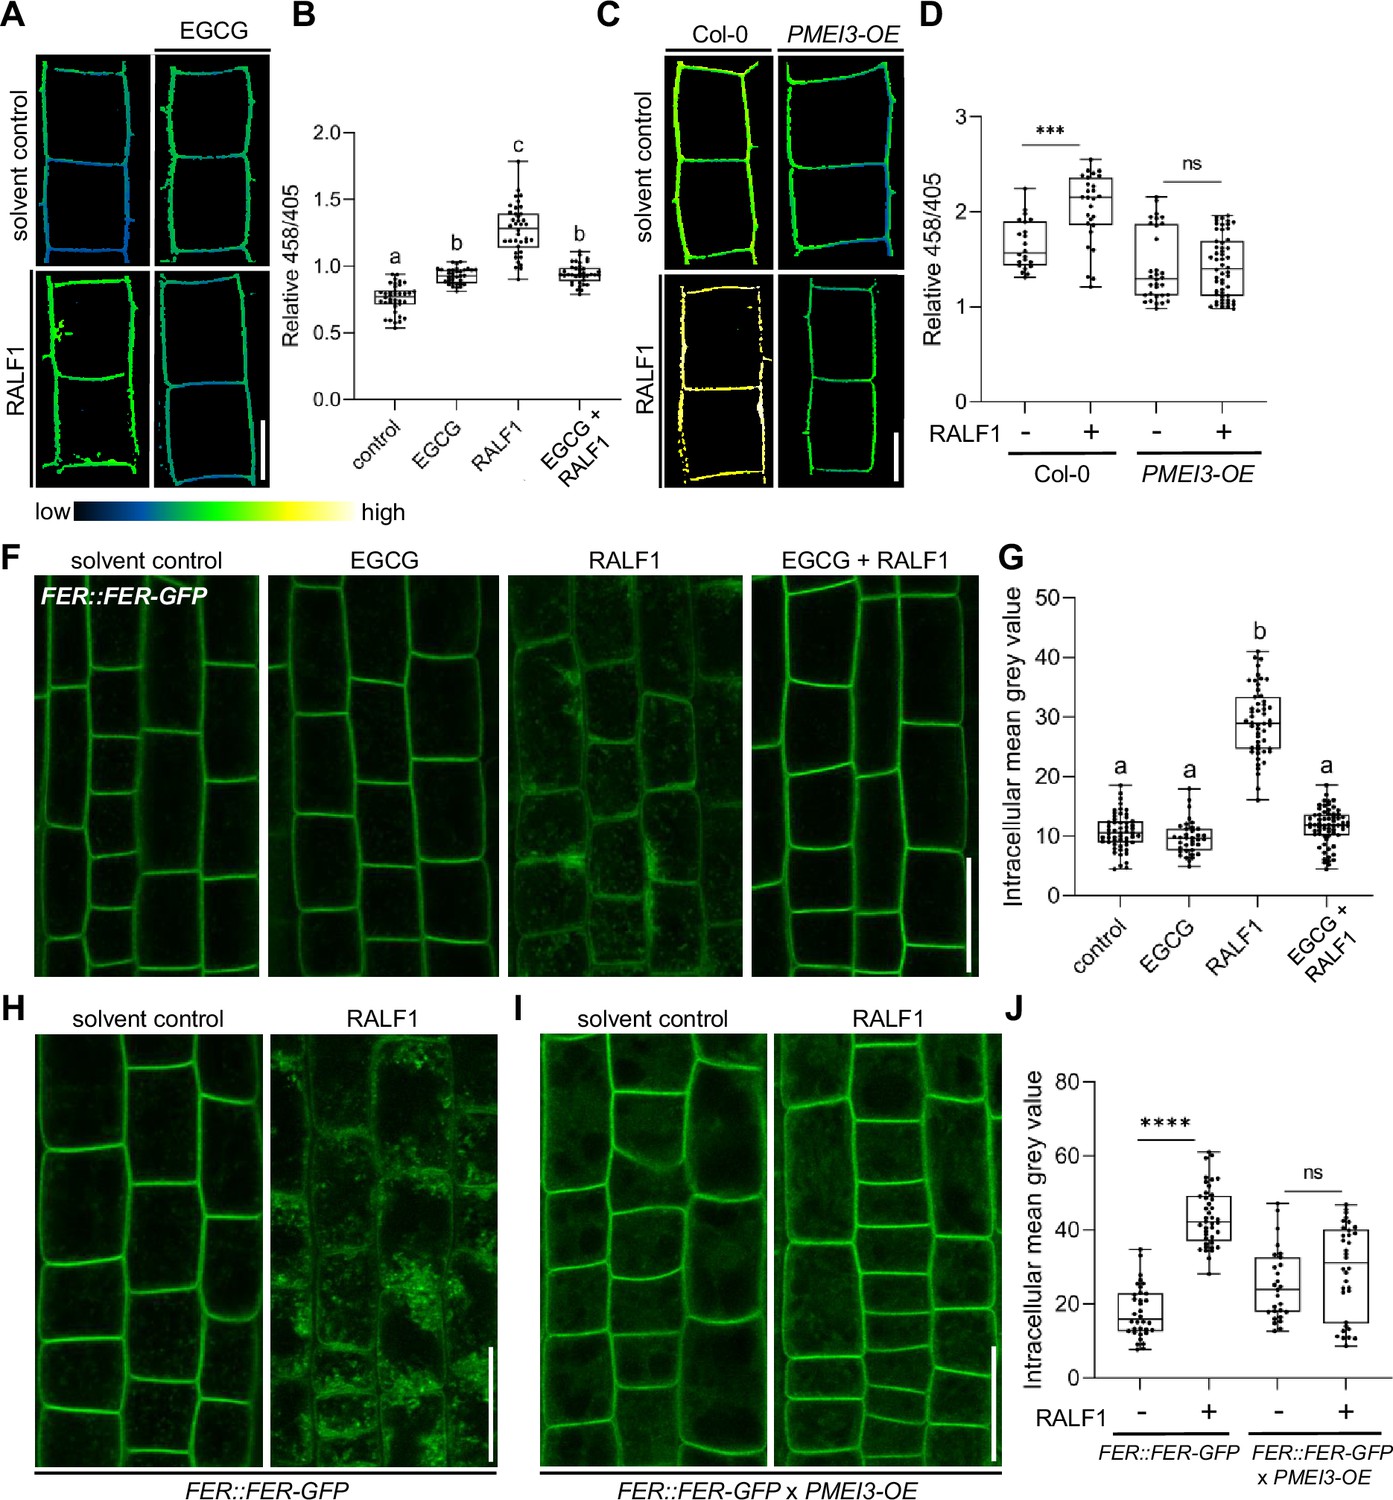
Pectin methyl esterase (PME) activity is required for rapid alkalinisation factor1 (RALF1) signalling output.
(A, B) 8-hydroxypyrene-1,3,6-trisulfonic acid trisodium salt (HPTS)-based (458/405 ratio) pH assessment of late meristematic root cells of wild-type seedlings treated for 3 hr with 1 µM RALF1, 50 µM epigallocatechin gallate (ECGC), or both compared to solvent control. Representative confocal images (A) are shown. Scale bar = 10 µm. (B) Boxplots depict mean HPTS 458/405 intensities shown in (A), n=9–11. (C, D) HPTS-based (458/405 ratio) pH assessment of late meristematic cells in wild-type and PMEI3-OE seedlings treated for 3 hr with 1 µM RALF1 compared to solvent control. Scale bar = 10 µm. (D) Boxplots depict mean HPTS 458/405 intensities shown in (C), n=10–12. (F, G) RALF1-induced internalisation of FER::FER-GFP in late meristematic epidermal root cells of seedlings treated for 3 hr with 1 µM RALF1, 50 µM ECGC, or both compared to solvent control. Scale bar = 25 µm. (G) Boxplots displaying the mean intracellular GFP signal intensity are shown in (F), n=9–12. (H–J) RALF1-induced internalisation of feronia (FER) in late meristematic epidermal root cells in FER::FER-GFP (H) and in FER::FER-GFP crossed with PMEI3-OE (I) seedlings treated for 3 hr with 1µM RALF1 compared to solvent control. Scale bar = 25 µm. (J) Boxplots displaying the intracellular GFP signal intensity are shown in (H, I). Statistical significance was determined by a one-way ANOVA with a Tukey Post Hoc multiple comparisons test (p<0.05, letters indicate significance categories) (B, G) or a two-way ANOVA with Bonferroni Post Hoc test (****p<0.0001) (D, J). Boxplots: Box limits represent the 25th and 75th percentile, and the horizontal line represents the median. Whiskers display min. to max. values.
-
Figure 3—source data 1
Data for Figure 3B.
- https://cdn.elifesciences.org/articles/96943/elife-96943-fig3-data1-v1.xlsx
-
Figure 3—source data 2
Data for Figure 3D.
- https://cdn.elifesciences.org/articles/96943/elife-96943-fig3-data2-v1.xlsx
-
Figure 3—source data 3
Data for Figure 3G.
- https://cdn.elifesciences.org/articles/96943/elife-96943-fig3-data3-v1.xlsx
-
Figure 3—source data 4
Data for Figure 3J.
- https://cdn.elifesciences.org/articles/96943/elife-96943-fig3-data4-v1.xlsx
Figure 3—figure supplement 1
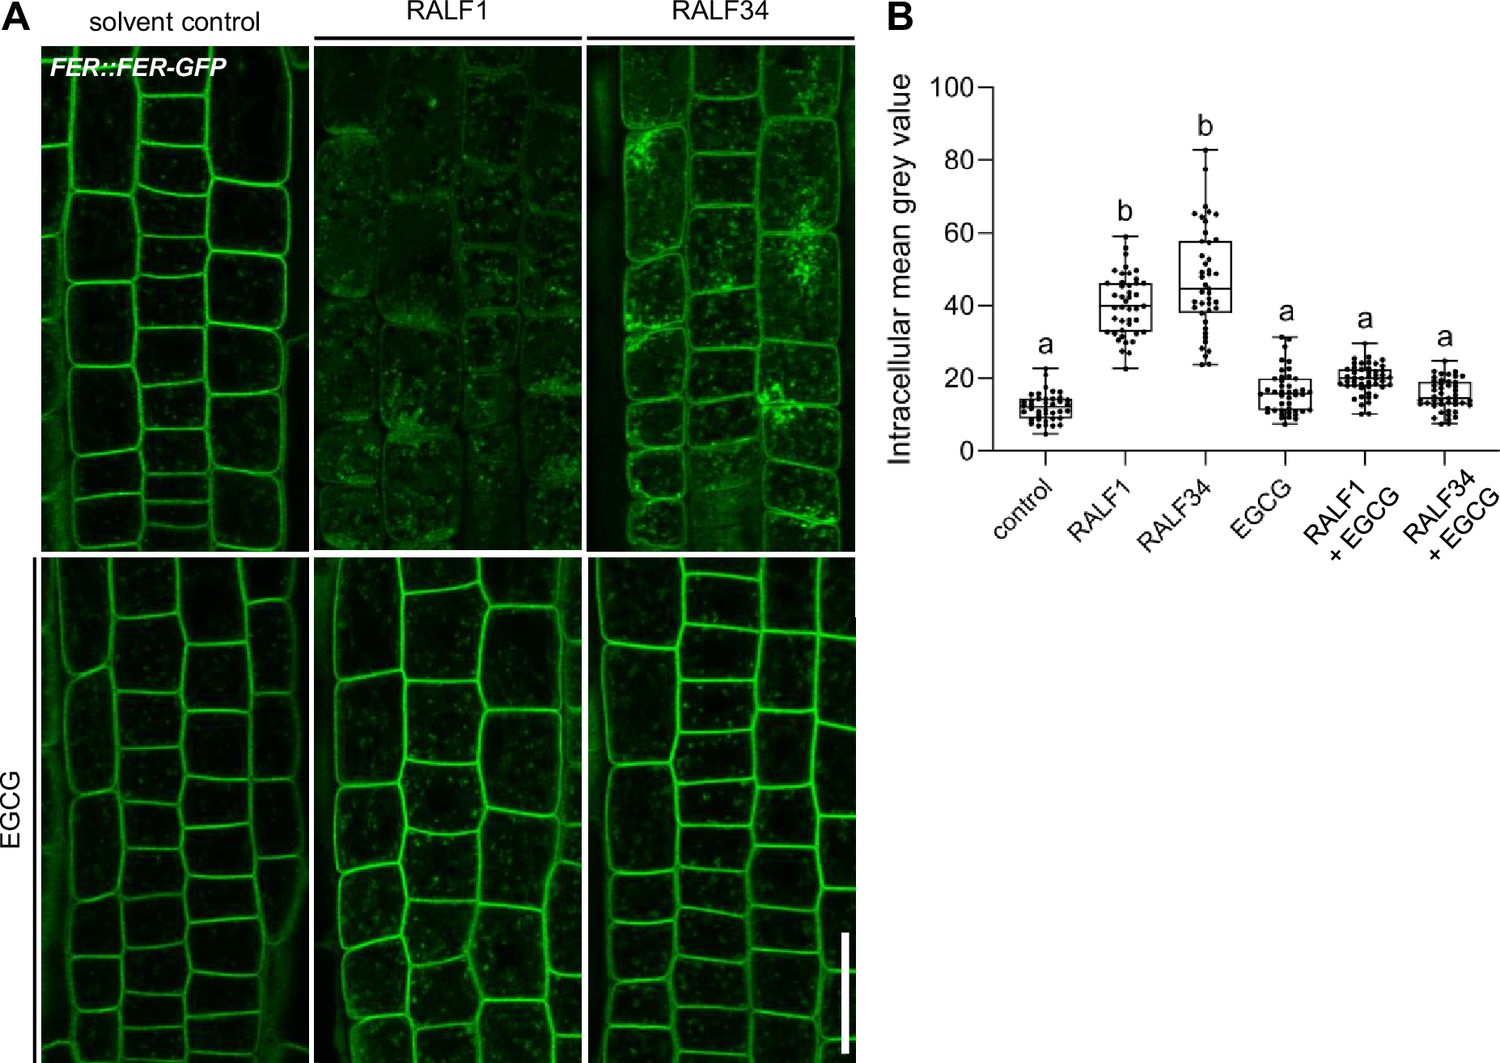
Activity of RALF34 requires pectin methyl esterase (PME) activity.
RALF34 function is similar to rapid alkalinisation factor1 (RALF1) in initiating ligand-induced endocytosis in feronia (FER) (A, B) Internalisation of FER::FER-GFP in late meristematic epidermal root cells of 6-day-old seedlings treated for 3 hr with 1 µM RALF1, 1 µM RALF34, and/or 50 µM epigallocatechin gallate (EGCG) compared to solvent control. (B) Boxplots displaying the mean intracellular GFP signal intensity are shown in (A). Scale bar = 25 µm, n=10–12 roots per treatment with a total number of 41–46 quantified cells. Statistical significance was determined by a one-way ANOVA with a Tukey Post Hoc multiple comparisons test (p<0.05, letters indicate significance categories) (B). Boxplots: Box limits represent the 25th and 75th percentile, and the horizontal line represents the median. Whiskers display min. to max. values. Representative experiments are shown.
-
Figure 3—figure supplement 1—source data 1
Data for Figure 3—figure supplement 1B.
- https://cdn.elifesciences.org/articles/96943/elife-96943-fig3-figsupp1-data1-v1.xlsx
Figure 4 with 2 supplements
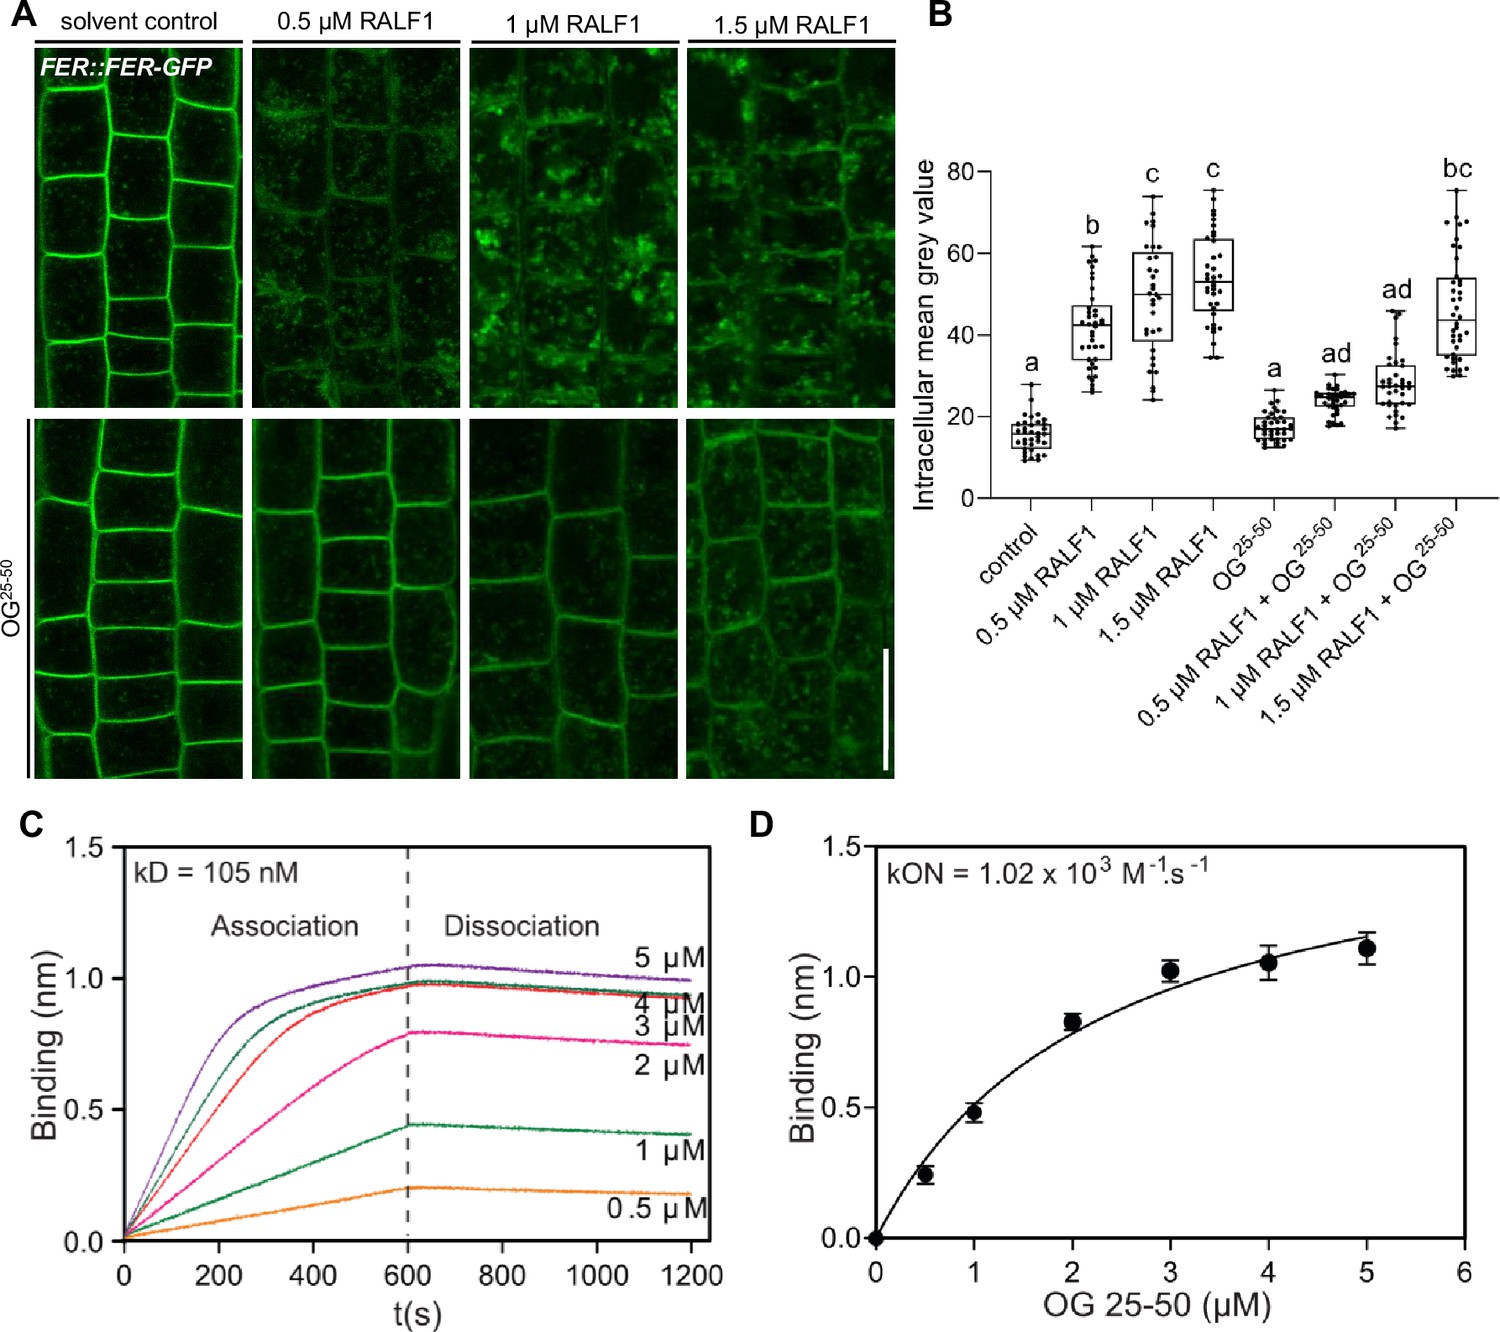
Rapid alkalinisation factor (RALF) peptides associate with de-methylesterified oligogalacturonides.
(A, B) RALF1-induced internalisation of FER::FER-GFP in late meristematic epidermal root cells of 6-day-old seedlings treated for 3 hr with a concentration series of 0.5, 1, and 1.5 µM RALF1 compared to solvent control and co-treated with oligogalacturonides (OGs) with a chain length of 25–50 (OG25-50; 50 mg/mL). (B) Boxplots displaying the mean intracellular GFP signal intensity are shown in (A). Scale bar = 25 µm, n=9–12. (C, D) Biolayer interferometry assays showed the binding between RALF1 and OG25-50 with an Equilibrium dissociation constant (Kd) of 105 nM (C). The association and dissociation constants (kON = 1.02 × 10³ M-1 s-1, kOFF _=1.07 × 10⁻⁴ s-1) imply high avidity binding (D). Statistical significance was determined by a one-way ANOVA with a Tukey Post Hoc multiple comparisons test (p<0.05, letters indicate significance categories) (B). Boxplots: Box limits represent the 25th and 75th percentile, and the horizontal line represents the median. Whiskers display min. to max. values.
-
Figure 4—source data 1
Data for Figure 4B.
- https://cdn.elifesciences.org/articles/96943/elife-96943-fig4-data1-v1.xlsx
Figure 4—figure supplement 1
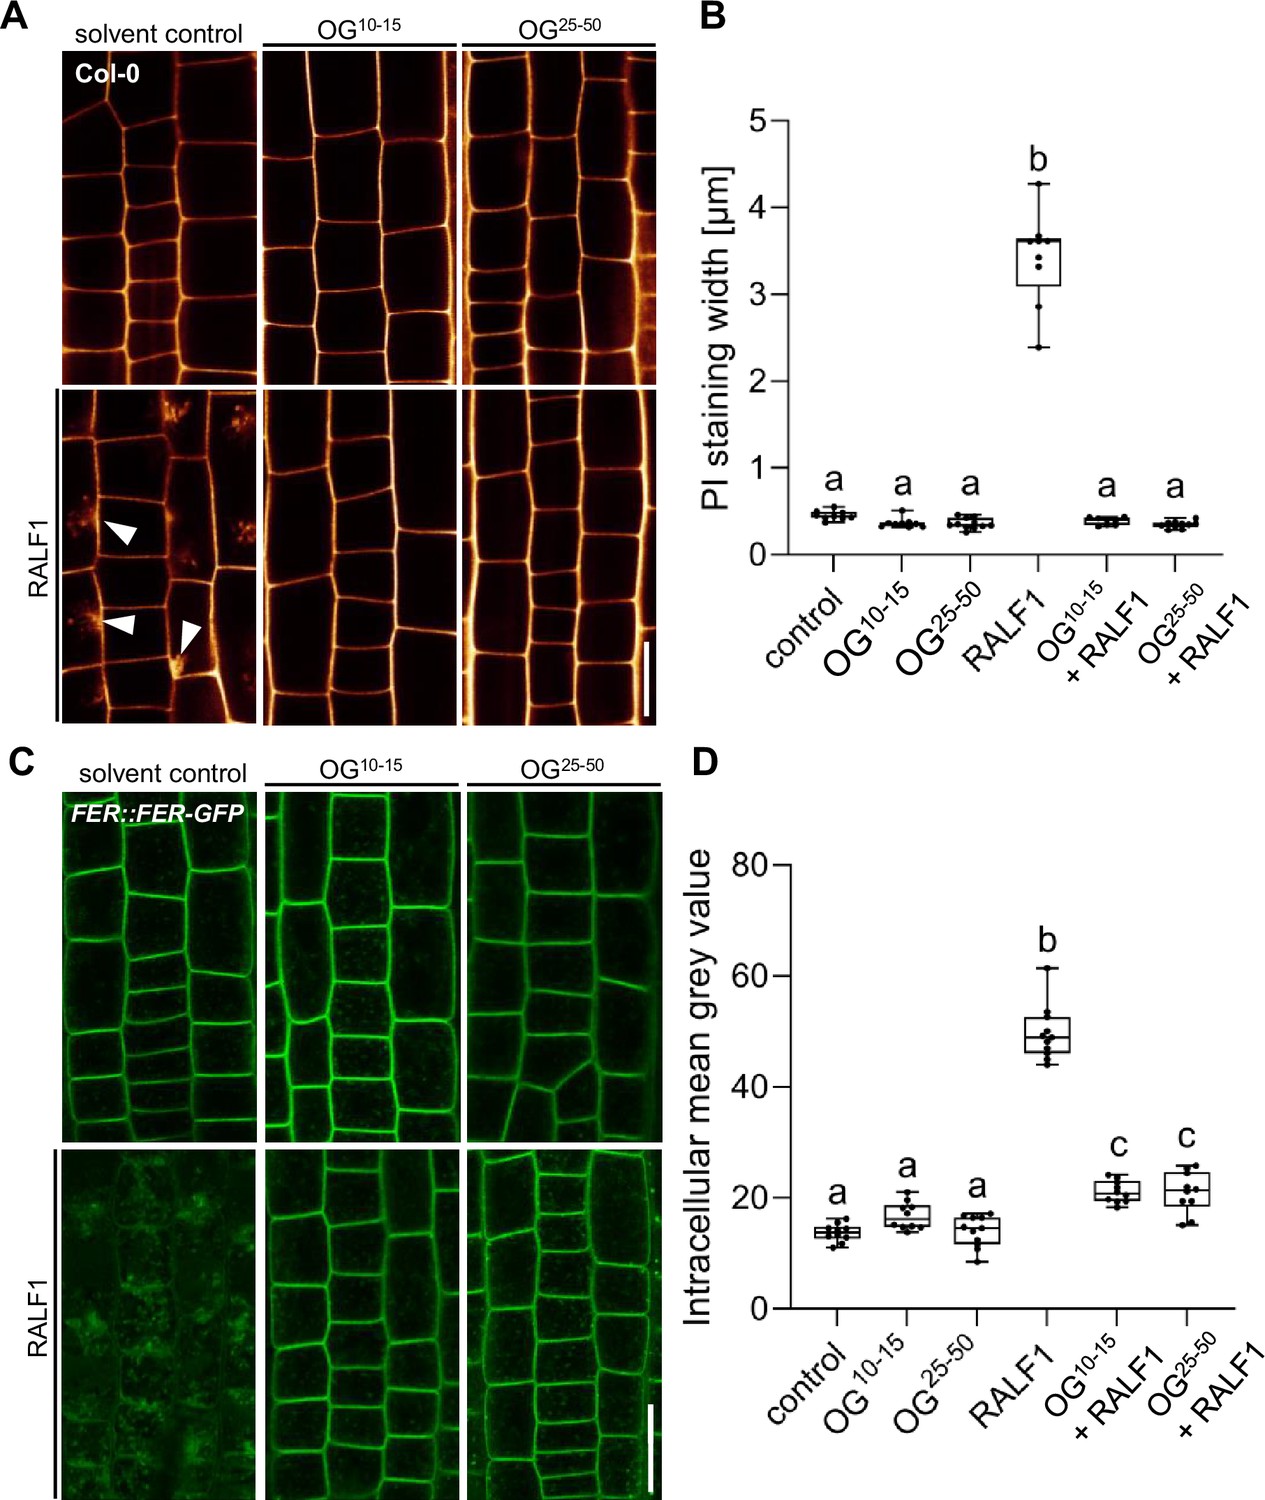
Application of free de-methylesterified oligogalacturonides disrupts rapid alkalinisation factor1 (RALF1) activity at the cell surface.
(A, B) Confocal images of 6-day-old wild-type roots after 3 hr treatment in liquid medium with solvent control, 50 mg/mL OG10-15, 50 mg/mL OG25-50 and 1 µM RALF1, respectively (A). Seedlings were mounted in propidium iodide to visualize the cell walls. Arrowheads indicate cell wall invaginations. (B) Graphs represent the average cell wall width per root under different treatments shown in (A). Scale bar = 25 µm, n=8–11 roots per treatment with a total number of 46–52 quantified cells. (C, D) RALF1-induced internalisation of FER::FER-GFP in late meristematic epidermal root cells of 6-day-old seedlings treated for 3 hr with solvent control, 50 mg/mL OG10-15, 50 mg/mL OG25-50, and 1 µM RALF1, respectively. (D) Boxplots display the intracellular feronia (FER)-GFP signal intensities. Scale bar = 25 µm, n=10–11. Statistical significance was determined by a one-way ANOVA with a Tukey Post Hoc multiple comparisons test (p<0.05, letters indicate significance categories) (B, D). Boxplots: Box limits represent 25th and 75th percentile, and the horizontal line represents the median. Whiskers display min. to max. values. Representative experiments are shown.
-
Figure 4—figure supplement 1—source data 1
Data for Figure 4—figure supplement 1B.
- https://cdn.elifesciences.org/articles/96943/elife-96943-fig4-figsupp1-data1-v1.xlsx
-
Figure 4—figure supplement 1—source data 2
Data for Figure 4—figure supplement 1D.
- https://cdn.elifesciences.org/articles/96943/elife-96943-fig4-figsupp1-data2-v1.xlsx
Figure 4—figure supplement 2
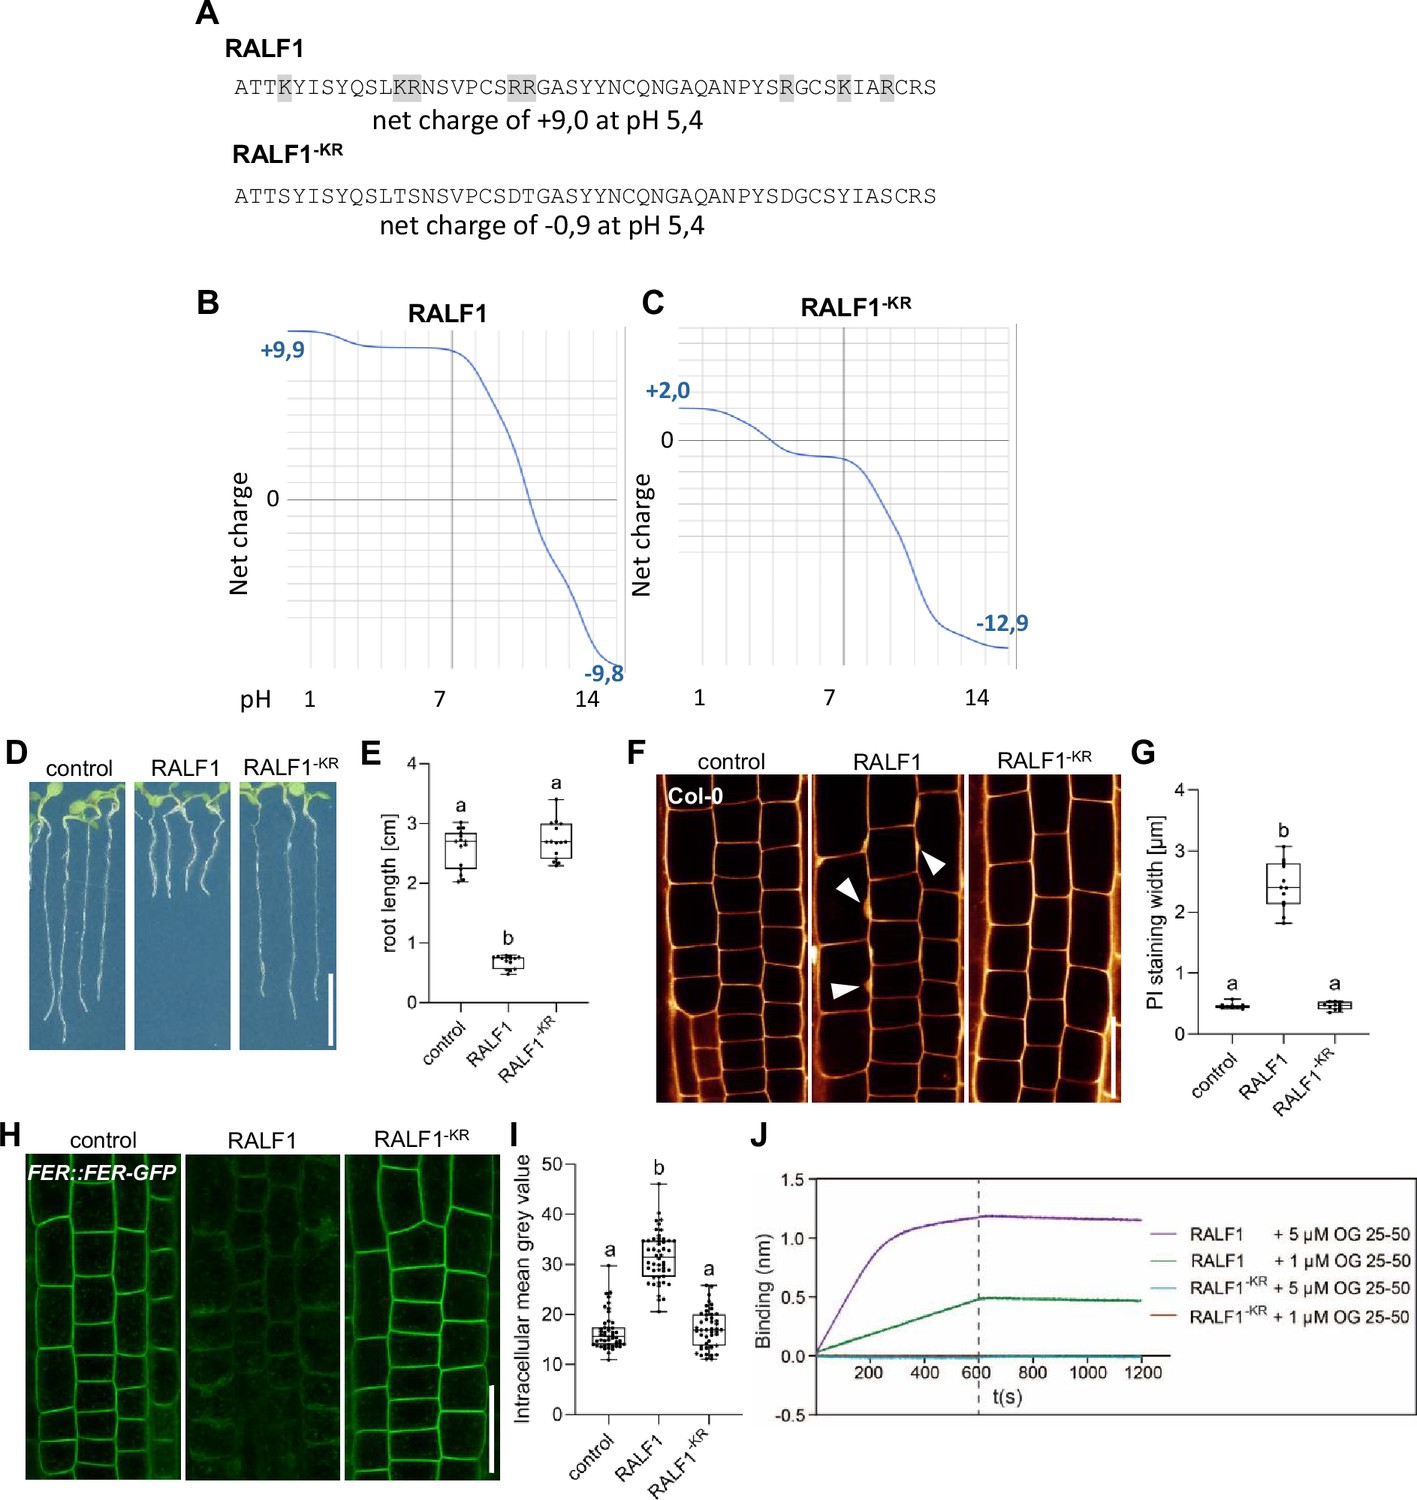
Positive charges in rapid alkalinisation factor1 (RALF1) are required for its bioactivity.
(A–C) Amino acid composition of RALF1 and non-charged RALF1-KR peptides and its respective pH-dependent net charge (B, C). (D, E) Three-day-old wild-type seedlings were exposed for three days to 1 µM RALF1 or RALF1-KR or solvent control (D). (E) Boxplots display the root length of seedlings under different treatments shown in (D). Scale bar = 1 cm, n=14–15. (F, G) Representative confocal images of 6-day-old wild-type roots after 3 hr treatment in liquid medium with 1 µM RALF1 or RALF1-KR or solvent control. Seedlings were mounted in propidium iodide to visualize the cell walls. Arrowheads indicate cell wall invaginations (F). (G) Graphs represent the average cell wall width per root under different treatments shown in (F). Scale bar = 25 µm, n=9–12. (H, I) RALF1-induced internalisation of FER::FER-GFP in late meristematic epidermal root cells of 6-day-old seedlings treated for 3 hr with solvent control, 1 µM RALF1 or RALF1-KR. Representative confocal images (H) are shown. (I) Boxplots display the intracellular GFP signal intensity. Scale bar = 25 µm, n=11–12 roots per treatment with a total number of 50–56 quantified cells. (J) Biolayer interferometry assays showed the absence of binding between RALF1-KR and OG25-50. RALF1 was used as a positive control, exhibiting the binding as appeared in the previous measurements (see Figure 4D). Statistical significance was determined by a one-way ANOVA with a Tukey Post Hoc multiple comparisons test (p<0.05, letters indicate significance categories) (E, G, and I). Boxplots: Box limits represent the 25th and 75th percentile, and the horizontal line represents the median. Whiskers display min. to max. values. Representative experiments are shown.
-
Figure 4—figure supplement 2—source data 1
Data for Figure 4—figure supplement 2E.
- https://cdn.elifesciences.org/articles/96943/elife-96943-fig4-figsupp2-data1-v1.xlsx
-
Figure 4—figure supplement 2—source data 2
Data for Figure 4—figure supplement 2G.
- https://cdn.elifesciences.org/articles/96943/elife-96943-fig4-figsupp2-data2-v1.xlsx
-
Figure 4—figure supplement 2—source data 3
Data for Figure 4—figure supplement 2I.
- https://cdn.elifesciences.org/articles/96943/elife-96943-fig4-figsupp2-data3-v1.xlsx
Figure 5
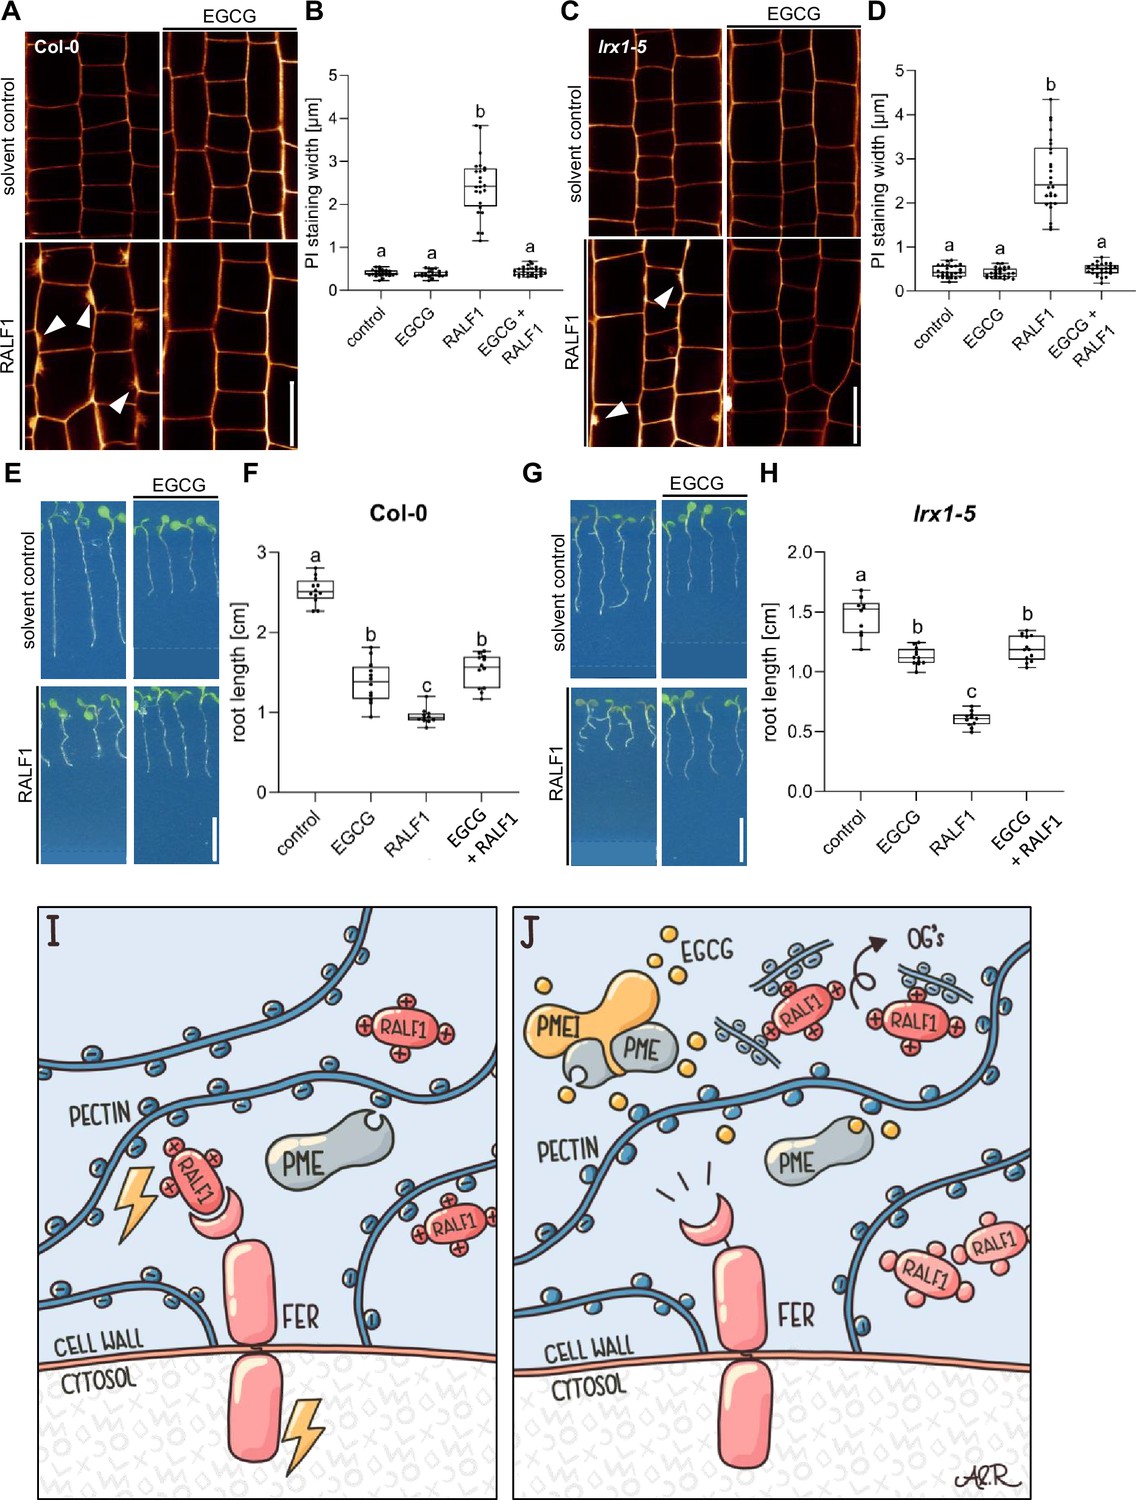
Leucine-rich repeat extensin (LRX) proteins are not essential for the pectin methyl esterase (PME)-dependent activity of rapid alkalinisation factor1 (RALF1).
(A, B) Confocal microscopy images (A) and quantification (B) representing the average cell wall width per root under different treatments shown in (A), of 6-day-old roots of wild-type seedlings, treated in a liquid medium with 1 µM RALF1 and/or 50 µM EGCG as well as solvent control for 3 hr. Seedlings were mounted in propidium iodide to visualise the cell walls. Arrowheads indicate cell wall invaginations. Scale bar = 25 µm, n=10–12 roots per treatment with a total number of 44–52 quantified cells. (C, D) Confocal microscopy images (C) and quantification (D) representing the average cell wall width per root under different treatments shown in (C), of 6-day-old roots of lrx1/lrx2/lrx3/lrx4/lrx5 quintuple mutant seedlings, treated in liquid medium with 1 µM RALF1 and/or 50 µM EGCG as well as solvent control for 3 hr. Seedlings were mounted in propidium iodide to visualize the cell walls. Arrowheads indicate cell wall invaginations. Scale bar = 25 µm, n=11–12 roots per treatment with a total number of 46–53 quantified cells. (E–H) Three-day-old wild-type (E) or lrx1/lrx2/lrx3/lrx4/lrx5 quintuple mutant (G) seedlings transferred for three days in liquid growth medium supplemented with solvent control, 1 µM RALF1 and/or 15 µM epigallocatechin gallate (EGCG). Seedlings were transferred to a solid growth medium just before imaging. (F, H) Boxplots display root length of seedlings under different treatments shown in (E, G). Scale bar = 1 cm, n=14–16 roots per treatment/line. (I, J) De-methylesterified and hence negatively charged pectin is crucial for the signalling output of positively charged RALF peptides (I). Interference with PME activity, application of free de-methylesterified OGs, or removal of positive charges in RALF leads to abolished RALF1 output signalling (J). Statistical significance was determined by a one-way ANOVA with a Tukey Post Hoc multiple comparisons test (p<0.05, letters indicate significance categories) (B, D, F, and H). Boxplots: Box limits represent the 25th and 75th percentile, and the horizontal line represents the median. Whiskers display min. to max. values. Representative experiments are shown.
-
Figure 5—source data 1
Data for Figure 5F.
- https://cdn.elifesciences.org/articles/96943/elife-96943-fig5-data1-v1.xlsx
-
Figure 5—source data 2
Data for Figure 5H.
- https://cdn.elifesciences.org/articles/96943/elife-96943-fig5-data2-v1.xlsx
Additional files
Download links
A two-part list of links to download the article, or parts of the article, in various formats.
Downloads (link to download the article as PDF)
Open citations (links to open the citations from this article in various online reference manager services)
Cite this article (links to download the citations from this article in formats compatible with various reference manager tools)
Pectin methylesterase activity is required for RALF1 peptide signalling output
eLife 13:RP96943.
https://doi.org/10.7554/eLife.96943.3


