Unraveling the impact of congenital deafness on individual brain organization
- Department of Neuroscience, Georgetown University Medical Center, United States
- State Key Laboratory of Cognitive Neuroscience and Learning and IDG/McGovern Institute for Brain Research, Beijing Normal University, China
- Beijing Key Laboratory of Brain Imaging and Connectomics, Beijing Normal University, China
- Chinese Institute for Brain Research, China
Figures
Figure 1 with 1 supplement
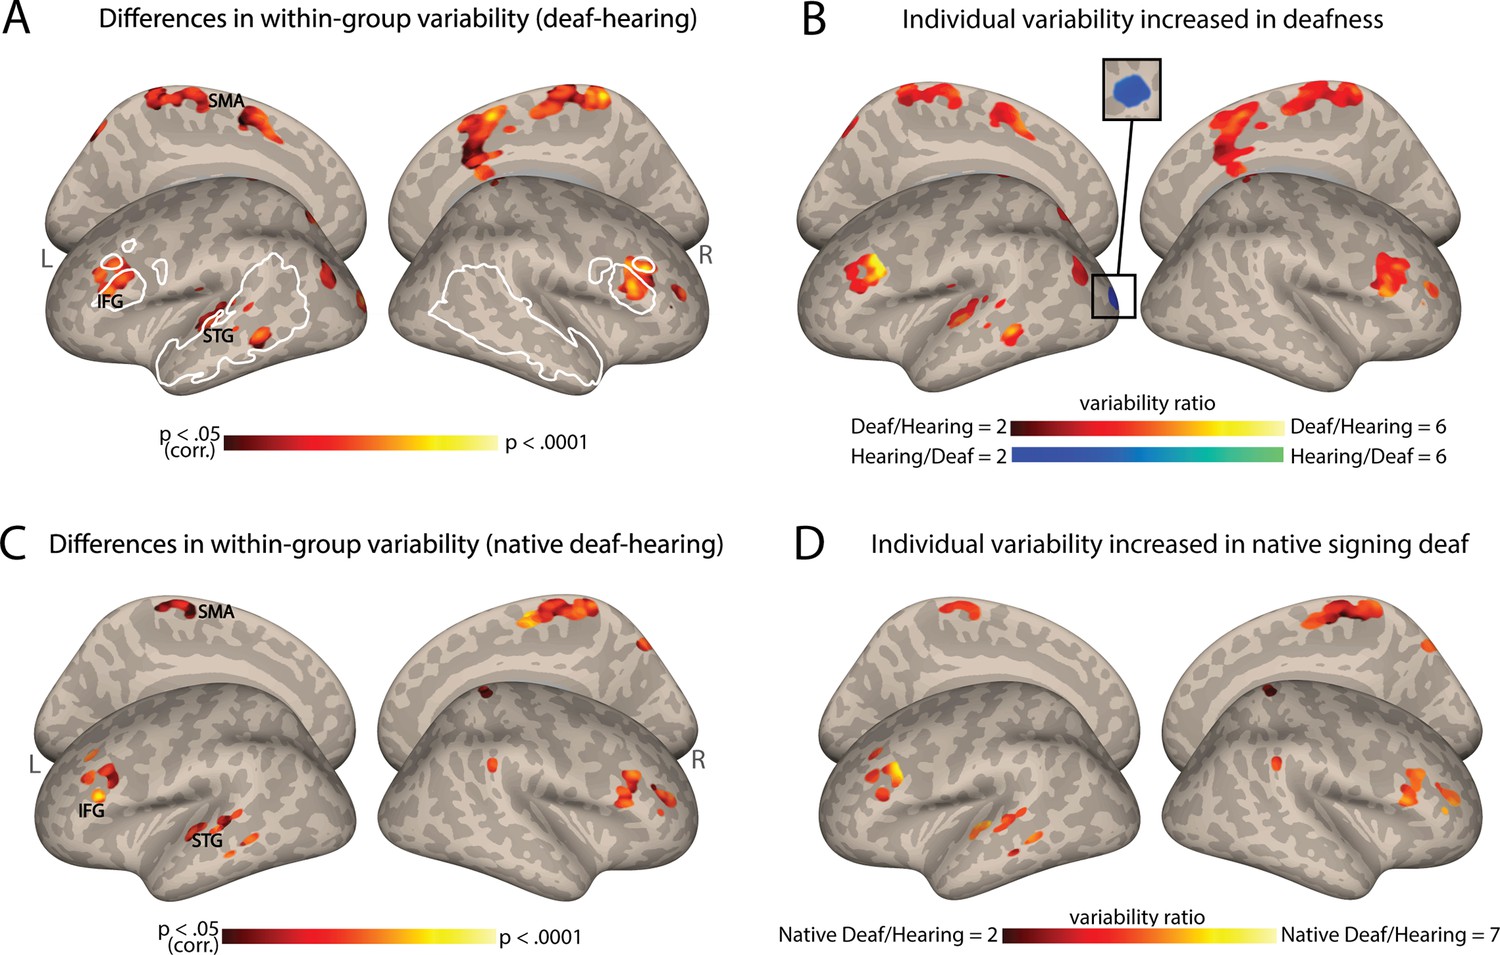
Individual differences in functional connectivity (FC) from the auditory cortex (AC) increase in deafness.
(A) Significant differences in the interindividual variability of the AC-FC values between deaf and hearing groups (p<0.05, cluster-corrected for multiple comparisons) are presented on inflated cortical hemispheres. These are found in the left STG (including the auditory association cortex), bilateral IFG (including part of Broca’s area), paracentral lobule, along with the dorsal visual stream. (B) The ratio of the within-group variability of AC-FC between the deaf and hearing groups is presented (within areas showing variability between the groups). Most areas showing a change in variability between the groups display larger individual differences in deafness, including the left auditory association cortex and Broca’s area. (C) Differences in native signing deaf subgroup and hearing group in their interindividual variability of the AC-FC values (p<0.05, cluster-corrected for multiple comparisons) replicate the effect of the mixed deaf group (A). (D) The ratio of the variability of AC-FC between the native signing deaf and hearing (within areas showing variability difference between the groups). No area showed increased individual differences for the hearing group. Native signing deaf participants have higher individual differences, despite having no delay in language acquisition. Anatomical marks: SMA = supplementary motor area; IFG = inferior frontal gyrus; STG = superior temporal gyrus. The regions outlined in white show some of the language-sensitive regions identified by Fedorenko et al., 2010, including the IFG, the anterior and the posterior temporal parcellations.
Figure 1—figure supplement 1
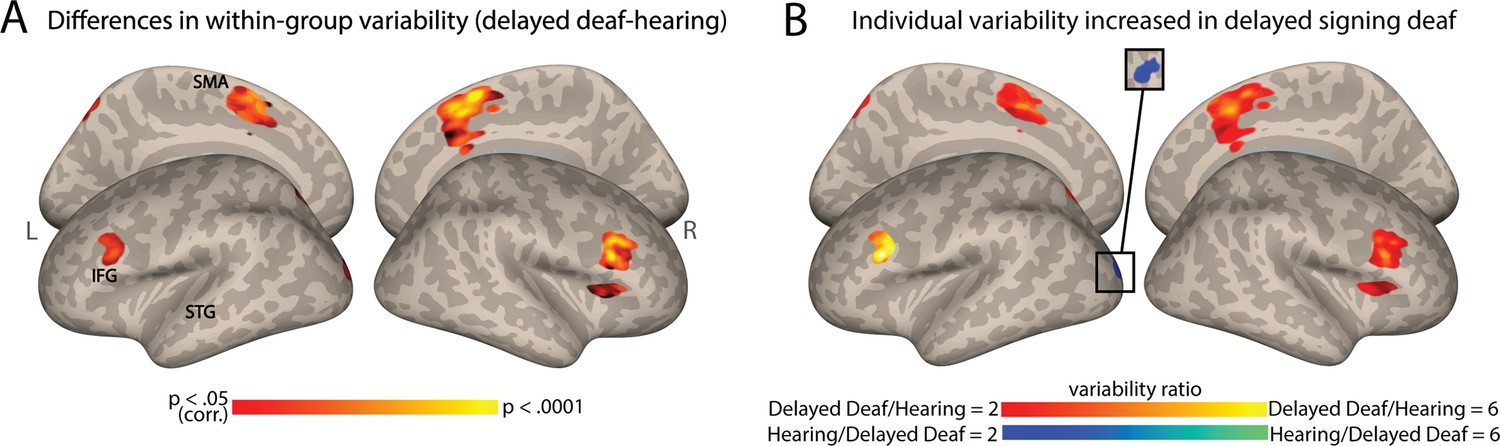
Auditory cortex functional connectivity (AC-FC) variability difference between delayed signing deaf and hearing individuals.
(A) Differences in delayed signing deaf subgroup and hearing group in their interindividual variability of the AC-FC values (p<0.05, cluster-corrected for multiple comparisons). (B) The ratio of the variability of AC-FC between the delayed signing deaf and hearing (within areas showing variability difference between the groups) replicates the effects seen when comparing the hearing and mixed deaf group. Anatomical marks: SMA = supplementary motor area; IFG = inferior frontal gyrus; STG = superior temporal gyrus.
Figure 2
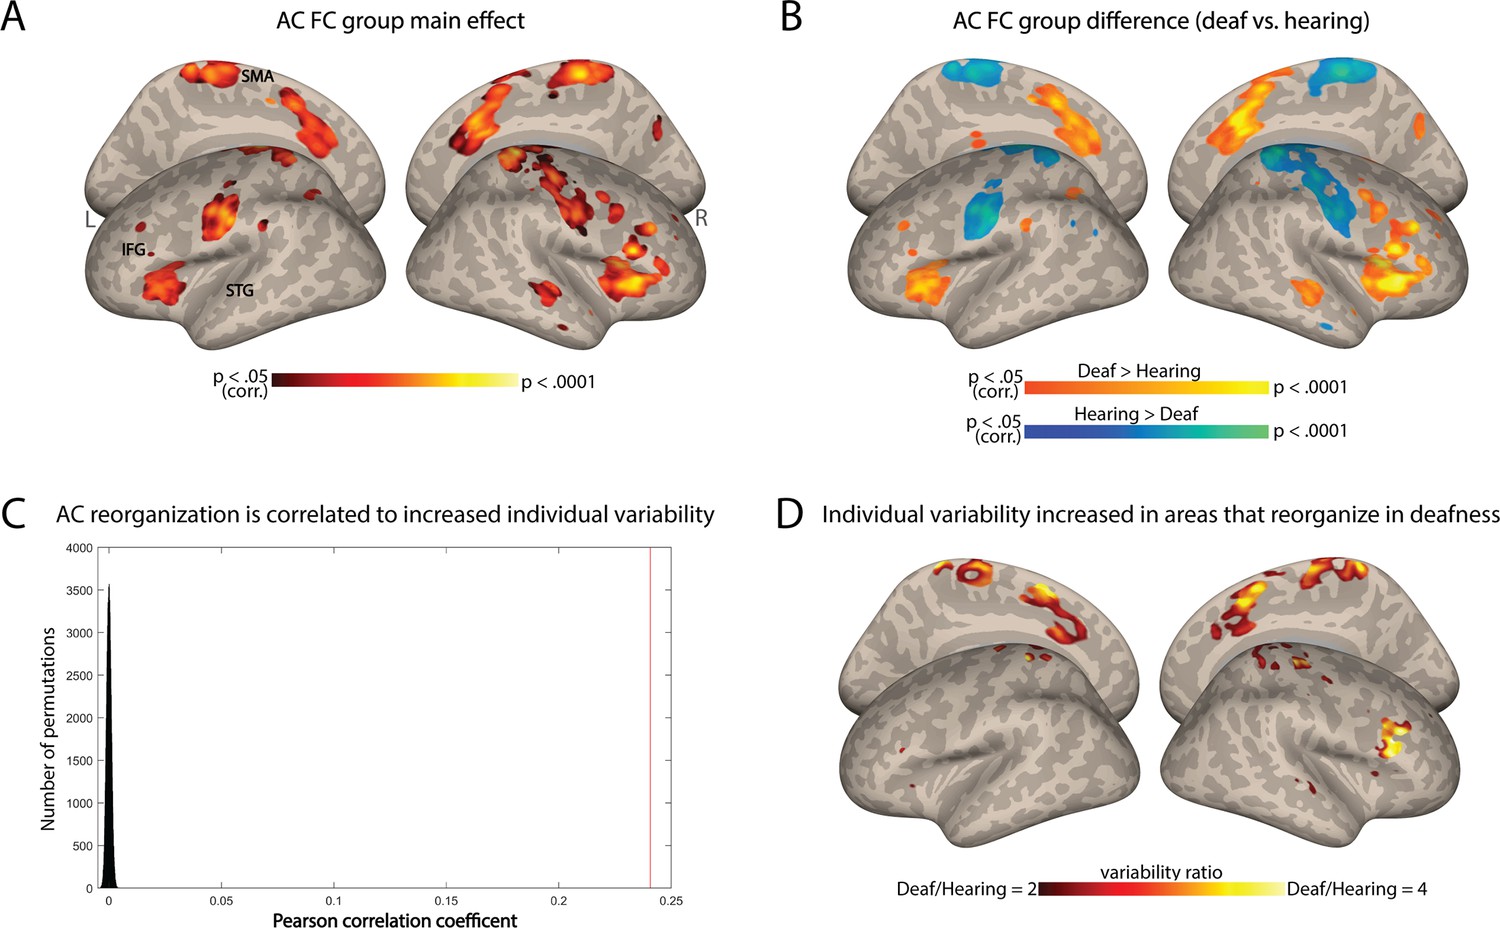
Individual variability in deafness is related to brain plasticity.
(A) ANOVA main effect showing which regions are reorganized in deafness (group difference between the deaf and hearing in auditory cortex functional connectivity [AC-FC]) (p<0.05, cluster-corrected for multiple comparisons). (B) Direct comparison of AC-FC between deaf and hearing groups (p<0.05, cluster-corrected for multiple comparisons) broadly replicated previous findings, showing broad reorganization in deafness. (C) Correlation between regions that show increased individual differences (Figure 1A) with the regions that show reorganization in deafness (A) is shown as a red line (r=0.24) compared with a spatial permutation test (distribution in black); the brain patterns of FC reorganization and that of increased individual differences are correlated, suggesting increased individual differences characterizes plasticity in deafness. (D) The ratio of the intragroup variability of AC-FC between the deaf and hearing groups is shown within areas showing reorganization group-level changes to FC. No area showed increased individual differences for the hearing group. Among the areas showing a change in AC-FC in deafness, individual differences are overall increased (red-orange) or stable (uncolored). Anatomical marks: SMA = supplementary motor area; IFG = inferior frontal gyrus; STG = superior temporal gyrus.
Figure 3
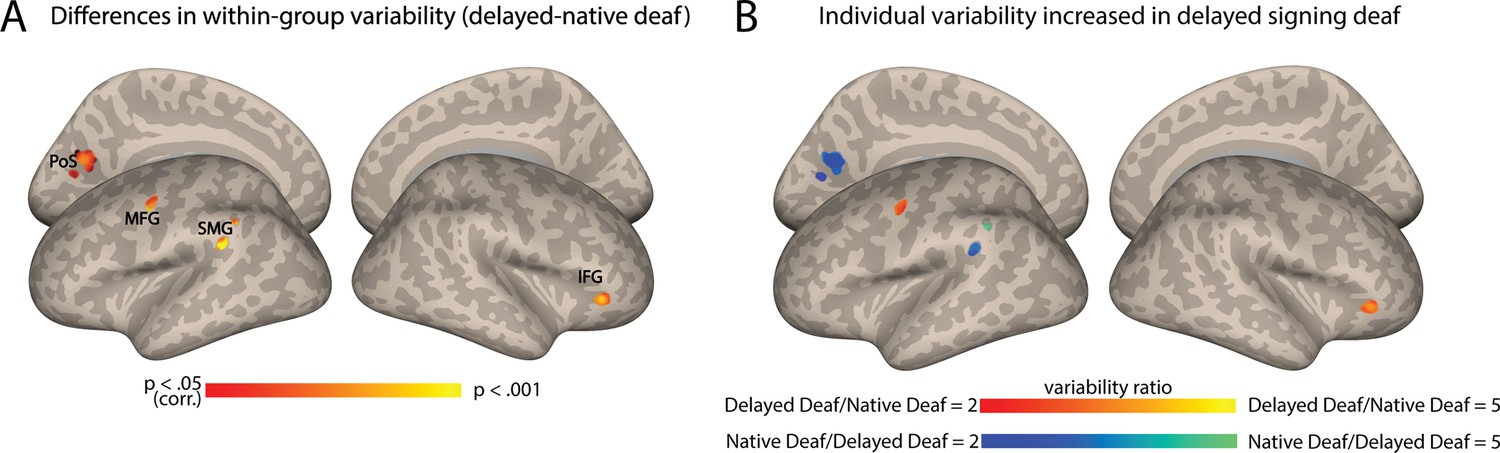
Auditory cortex functional connectivity (AC-FC) variability is influenced by language exposure.
(A) Differences between delayed and native signing deaf subgroups in their interindividual variability of the AC-FC values (p<0.05, cluster-corrected for multiple comparisons) show changes to individual differences in four specific clusters. (B) The ratio of the variability of AC-FC between the delayed signing and native signing deaf (within areas showing variability between the subgroups) shows that individual differences increase due to delayed language acquisition in the left MFG and right anterior IFG, but that early-onset sign language exposure increases variability in the connectivity between the AC and the left SMG and left dorsal medial visual cortex (cuneus and precuneus). Anatomical marks: PoS = parietooccipital sulcus; IFG = inferior frontal gyrus; SMG = supramarginal gyrus; MFG = middle frontal gyrus.
Appendix 1—figure 1

To test if increased variability in deafness was unique to the auditory system, we calculated inter-individual variability using all regions from the Harvard-Oxford Atlas, excluding auditory and language regions, as control seed regions for the functional connectivity (FC) analysis.
FC variability from the seed areas to the whole brain was calculated for the Auditory Cortex (AC) and control regions. The plot shows the number of voxels with a significant Brown-Forsythe effect (change in variability) for the AC region (purple bar) and the average number of significant voxels using the control regions (blue bar). The black dots represent the number of significant voxels for each individual control region. The connectivity variability from the AC is uniquely increased compared to these control regions (X2 = 2303.18, p < .0001).
Appendix 1—figure 2
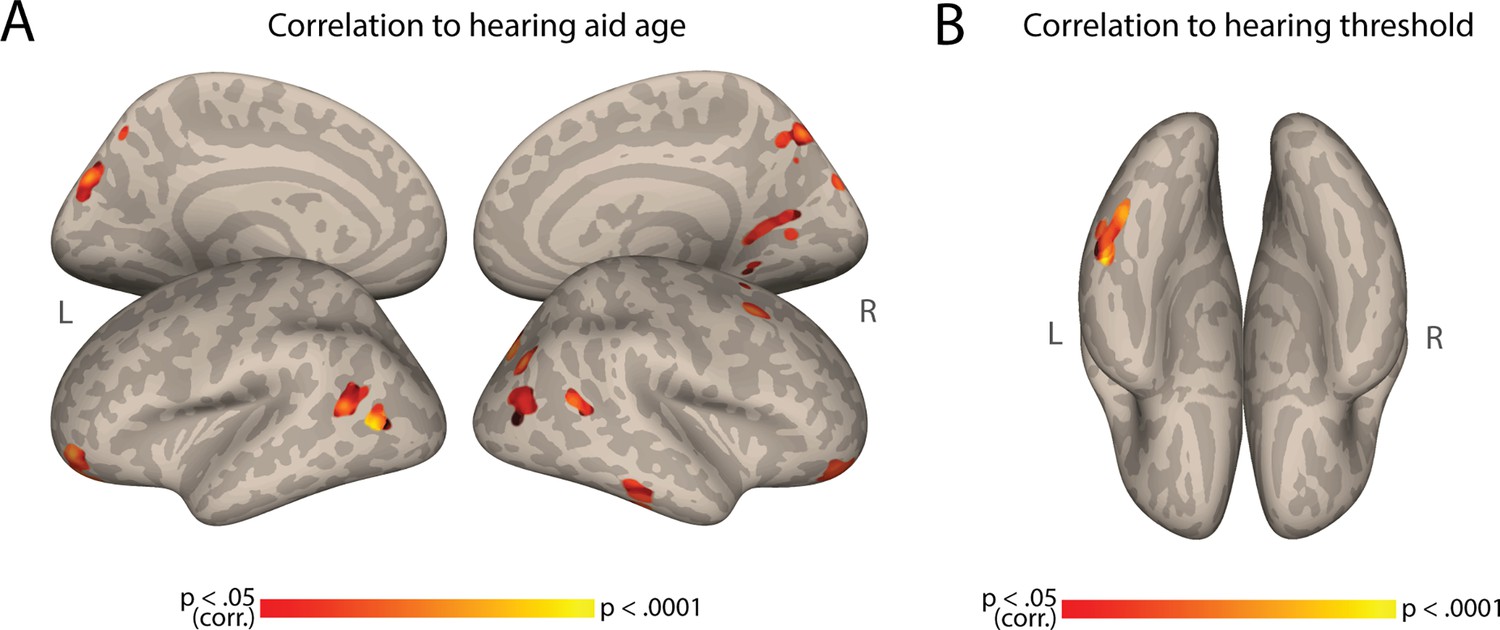
Correlation to hearing aid age and hearing threshold.
(A) Auditory Cortex Functional Connectivity (AC-FC) to different regions is positively correlated to the age of deaf participants started using hearing aids (N=28). (B) AC-FC to the fusiform gyrus is positively correlated to the hearing threshold of deaf participants (N = 23). Both maps are cluster-corrected for multiple comparisons, p < .05.
Appendix 1—figure 3
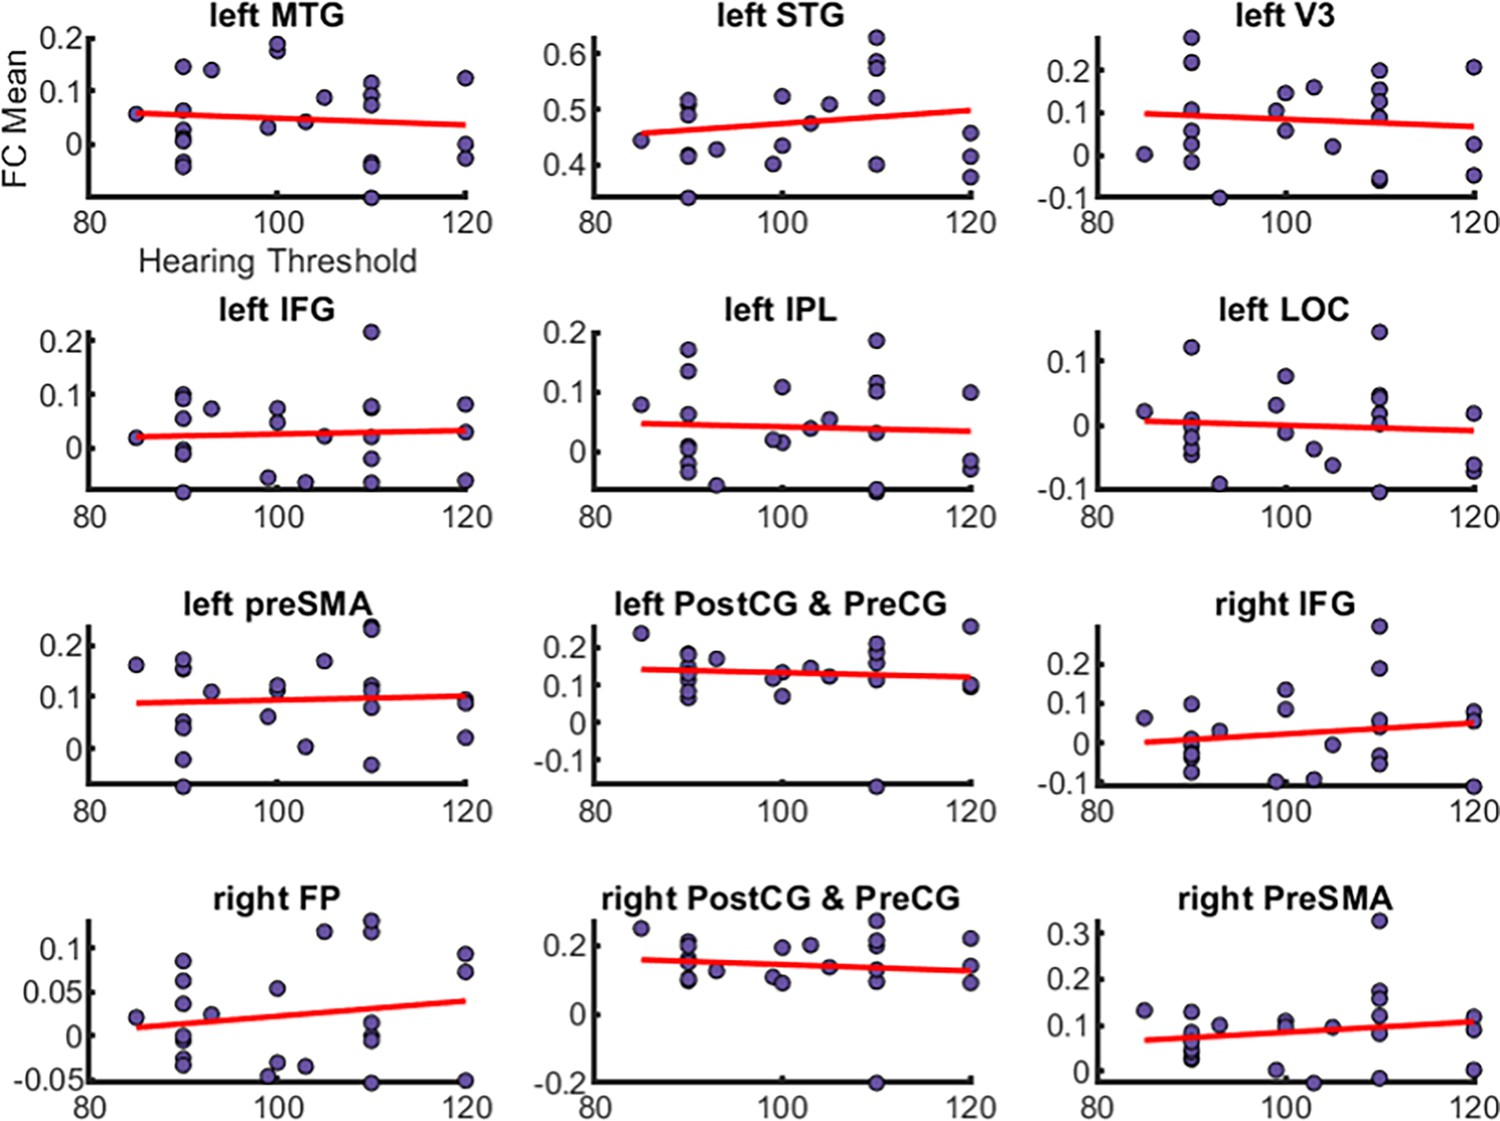
Scatter plots depicting the correlation between auditory cortex functional connectivity (AC-FC) mean values and hearing thresholds across various brain regions in deaf participants.
The x-axis represents the hearing threshold (in decibels), while the y-axis represents the AC-FC mean value for the cluster. Each purple dot indicates individual participant data points, and the red line represents the trend line (linear regression) for each region. No significant correlations were found between FC mean and hearing threshold (all p > .05). MTG = middle temporal gyrus, STG = superior temporal gyrus, V3 = visual area 3, IFG = inferior frontal gyrus, IPL = inferior parietal lobe, LOC = lateral occipital cortex, preSMA = pre supplementary motor area, postCG = postcentral gyrus, preCG = precental gyrus, FP = frontal pole.
Appendix 1—figure 4
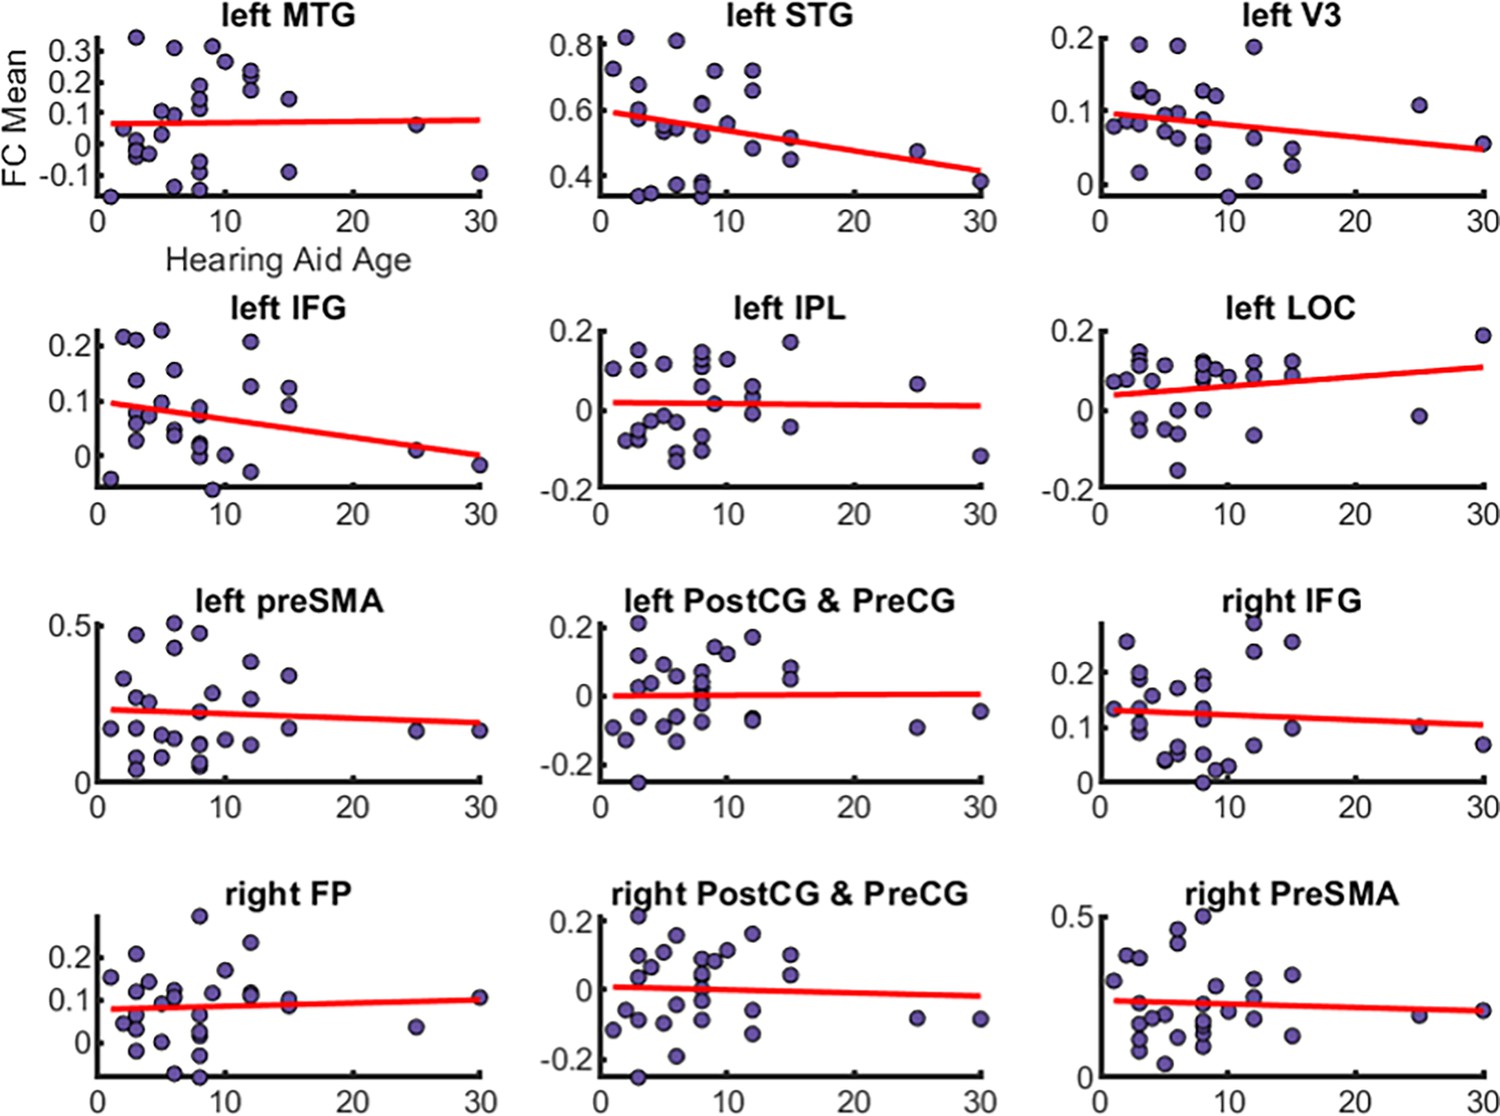
Scatter plots depicting the correlation between auditory cortex functional connectivity (AC-FC) mean values and age at which hearing aids were first used across various brain regions in deaf participants.
The x-axis represents the hearing aids age in years while the y-axis represents the AC-FC mean value for the cluster. Each purple dot indicates individual participant data points, and the red line represents the trend line (linear regression) for each region. No significant correlations were found between FC mean and hearing aids age (all p > .05). MTG = middle temporal gyrus, STG = superior temporal gyrus, V3 = visual area 3, IFG = inferior frontal gyrus, IPL = inferior parietal lobe, LOC = lateral occipital cortex, preSMA = pre supplementary motor area, postCG = postcentral gyrus, preCG = precental gyrus, FP = frontal pole.
Appendix 1—figure 5
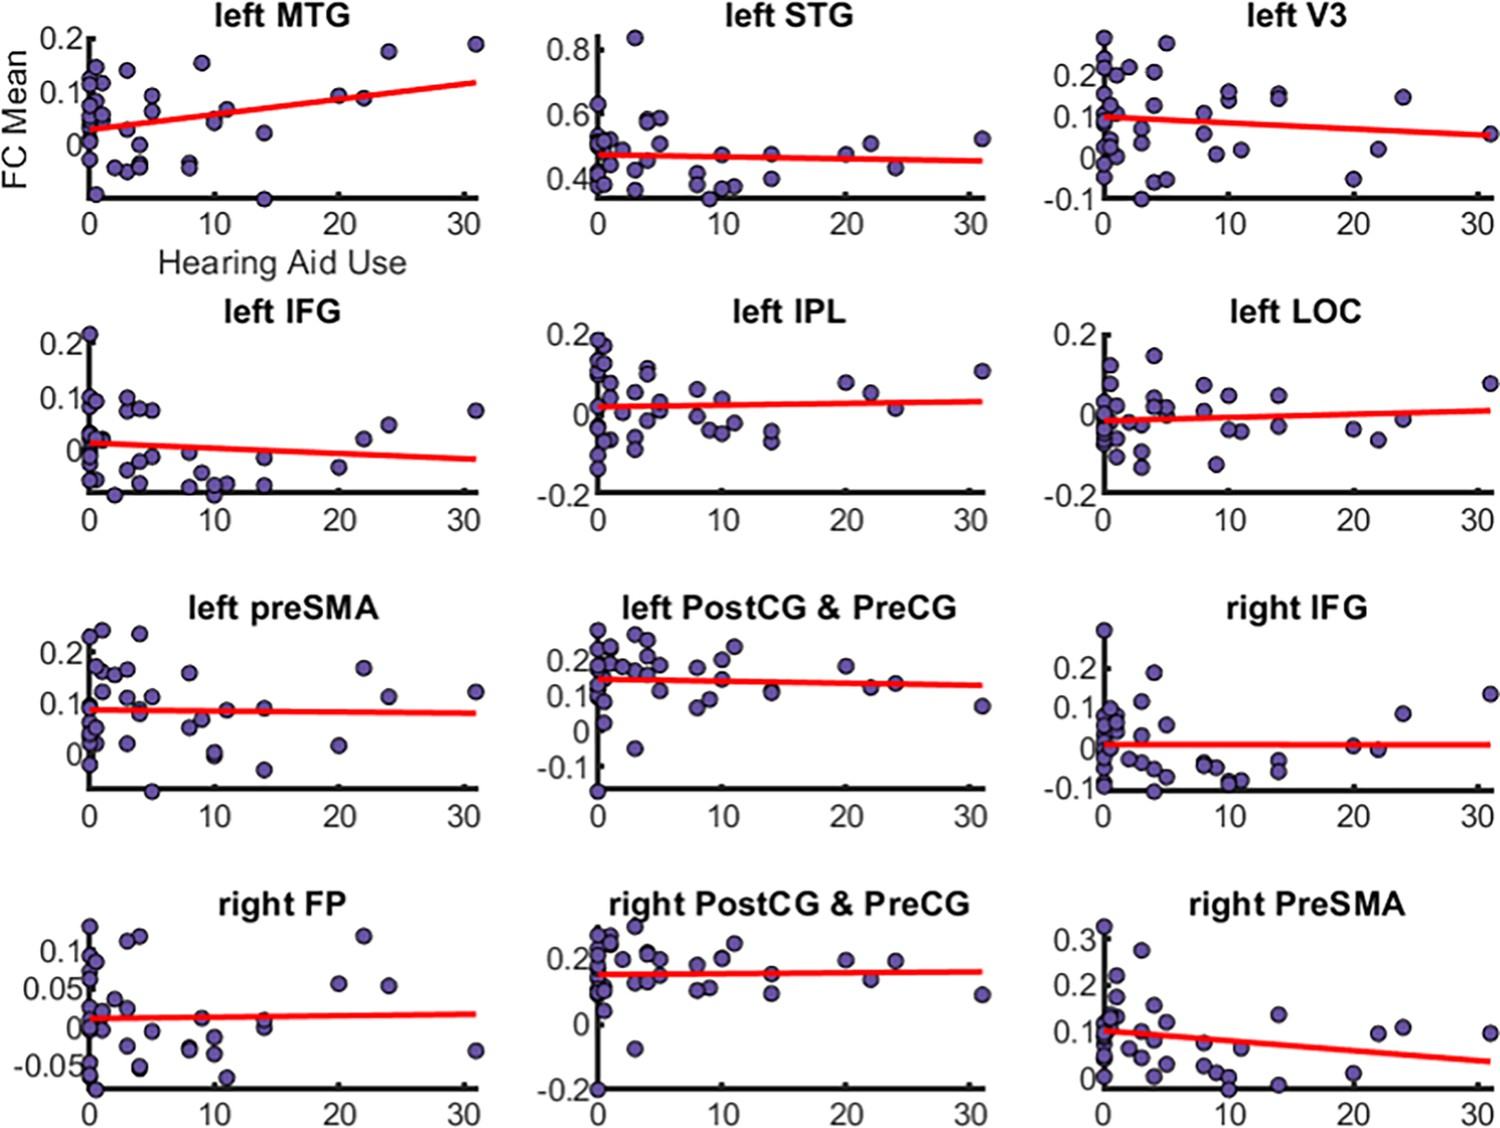
Scatter plots depicting the correlation between auditory cortex functional connectivity (AC-FC) mean values and duration of hearing aids use across various brain regions in deaf participants.
The x-axis represents the duration of hearing aids use (in years), while the y-axis represents the AC-FC mean value for the cluster. Each purple dot indicates individual participant data points, and the red line represents the trend line (linear regression) for each region. No significant correlations were found between FC mean and hearing aids use (all p > .05). MTG = middle temporal gyrus, STG = superior temporal gyrus, V3 = visual area 3, IFG = inferior frontal gyrus, IPL = inferior parietal lobe, LOC = lateral occipital cortex, preSMA = pre supplementary motor area, postCG = postcentral gyrus, preCG = precental gyrus, FP = frontal pole.
Tables
Table 1
Participants’ demographic information.
| Native deaf signers (N=16) | Delayed deaf signers (N=23) | Hearing nonsigners (N=33) | |
|---|---|---|---|
| Age of sign language acquisition | 0±0 | 6.91±1.62 | N/A |
| Age | 28.50±7.13 | 27.09±5.87 | 21.97±2.54 |
| Years of education | 14.13±2.31 | 15.09±1.41 | 15.03±1.93 |
| Gender | 11 M, 5 F | 12 M, 11 F | 15 M, 18 F |
Additional files
-
Supplementary file 1
MNI coordinates (x, y, z) for the functional connectivity (FC) variability analyses.
- https://cdn.elifesciences.org/articles/96944/elife-96944-supp1-v1.docx
-
Supplementary file 2
Additional characteristics of deaf participants.
- https://cdn.elifesciences.org/articles/96944/elife-96944-supp2-v1.docx
-
MDAR checklist
- https://cdn.elifesciences.org/articles/96944/elife-96944-mdarchecklist1-v1.docx
Download links
A two-part list of links to download the article, or parts of the article, in various formats.
Downloads (link to download the article as PDF)
Open citations (links to open the citations from this article in various online reference manager services)
Cite this article (links to download the citations from this article in formats compatible with various reference manager tools)
Unraveling the impact of congenital deafness on individual brain organization
eLife 13:RP96944.
https://doi.org/10.7554/eLife.96944.4


