Increased inflammatory signature in myeloid cells of non-small cell lung cancer patients with high clonal hematopoiesis burden
- Department of Biomedical Sciences, Seoul National University College of Medicine, Republic of Korea
- Samsung Genome Institute, Samsung Medical Center, Republic of Korea
- Research Institute for Veterinary Science, College of Veterinary Medicine, Seoul National University, Republic of Korea
- Samsung Genome Institute, Division of Hematology-Oncology, Department of Medicine, Samsung Medical Center, Sungkyunkwan University School of Medicine, Republic of Korea
- Department of Health Sciences and Technology, Samsung Advanced Institute for Health Science & Technology (SAIHST), Sungkyunkwan University, Republic of Korea
Figures
Figure 1 with 3 supplements
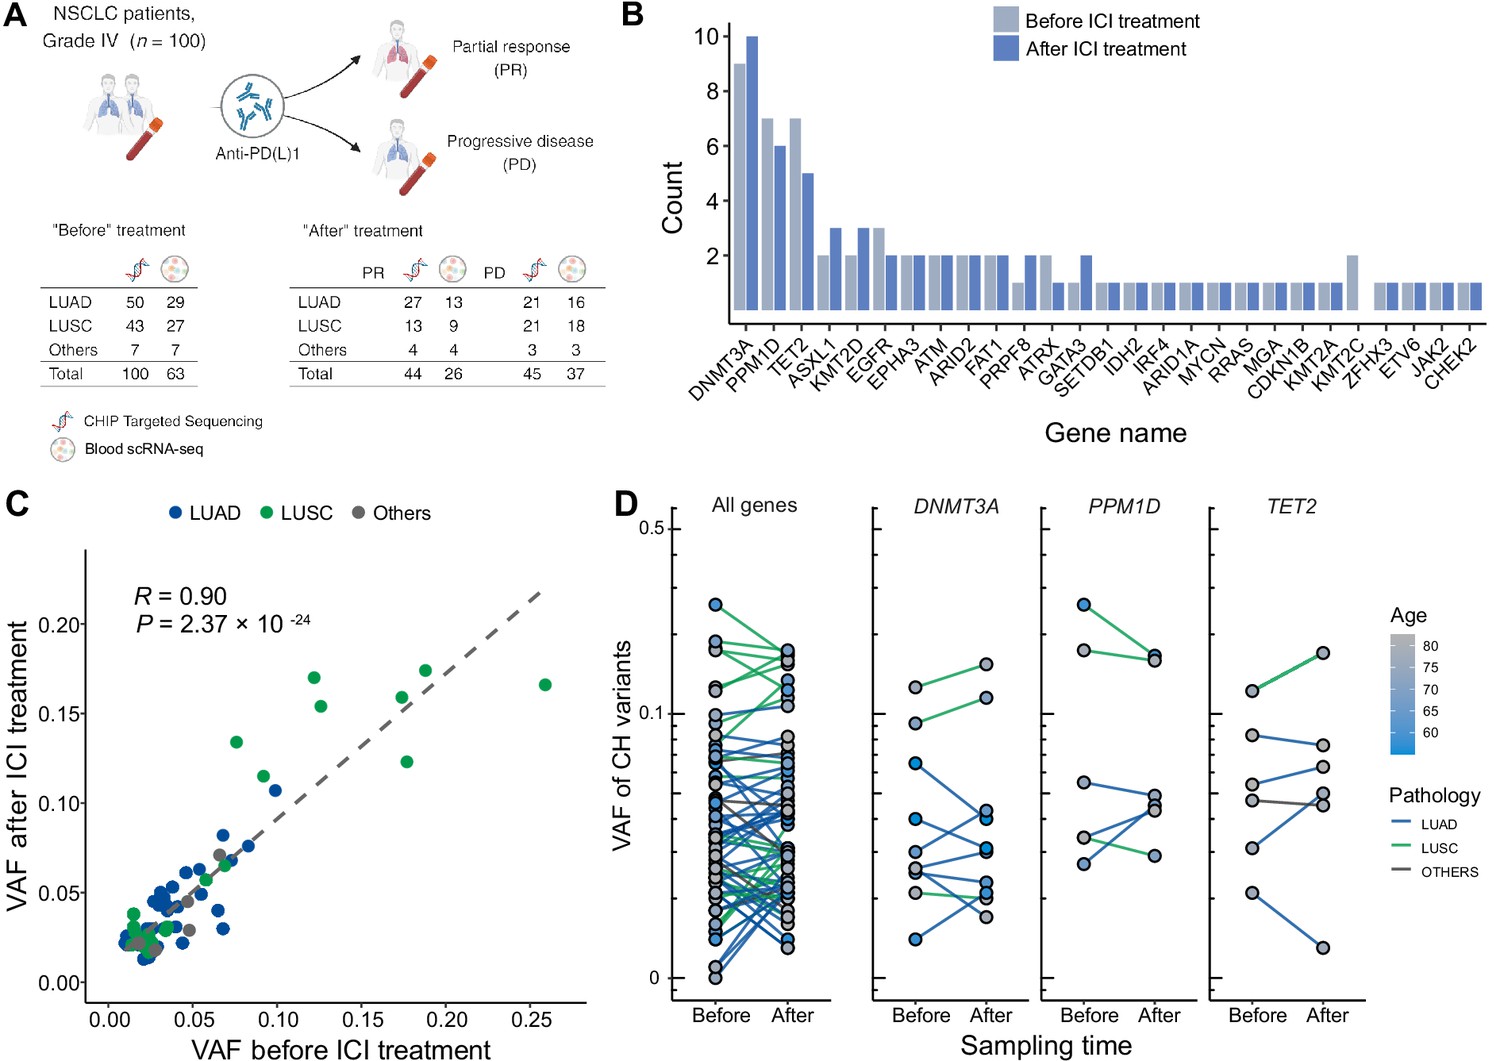
Profile of CH in non-small cell lung cancer (NSCLC) patients treated with immune checkpoint inhibitor (ICI).
(A) Overall study design. The numbers indicate sample counts in each group. (B) Frequency of CH variant detection in each gene in NSCLC samples before (light blue) and after (blue) ICI treatment. (C) Comparison of variant allele frequency before and after ICI treatment, divided by pathology type (lung adenocarcinoma [LUAD], lung squamous cell carcinoma [LUSC], other). (D) Effect of ICI treatment on the clonal landscape of all genes (left) and frequently detected CH genes.
Figure 1—figure supplement 1
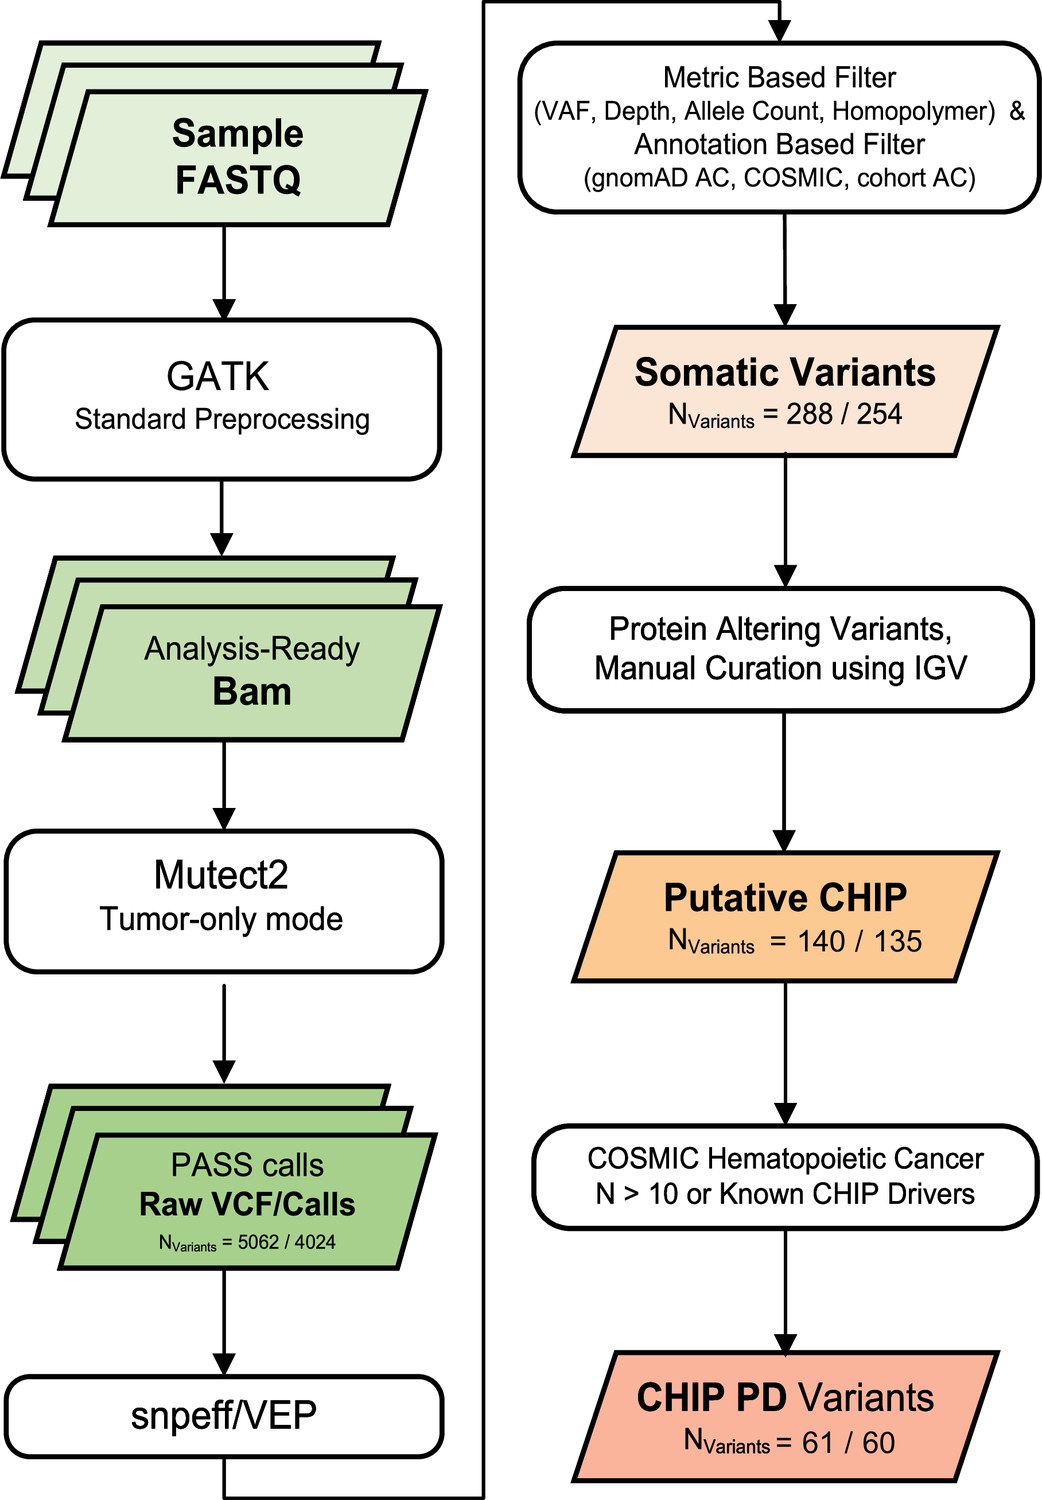
Variant calling and filtering scheme.
We collected numbers indicate count of variants after each variant filtering scheme (all samples/excluding controls).
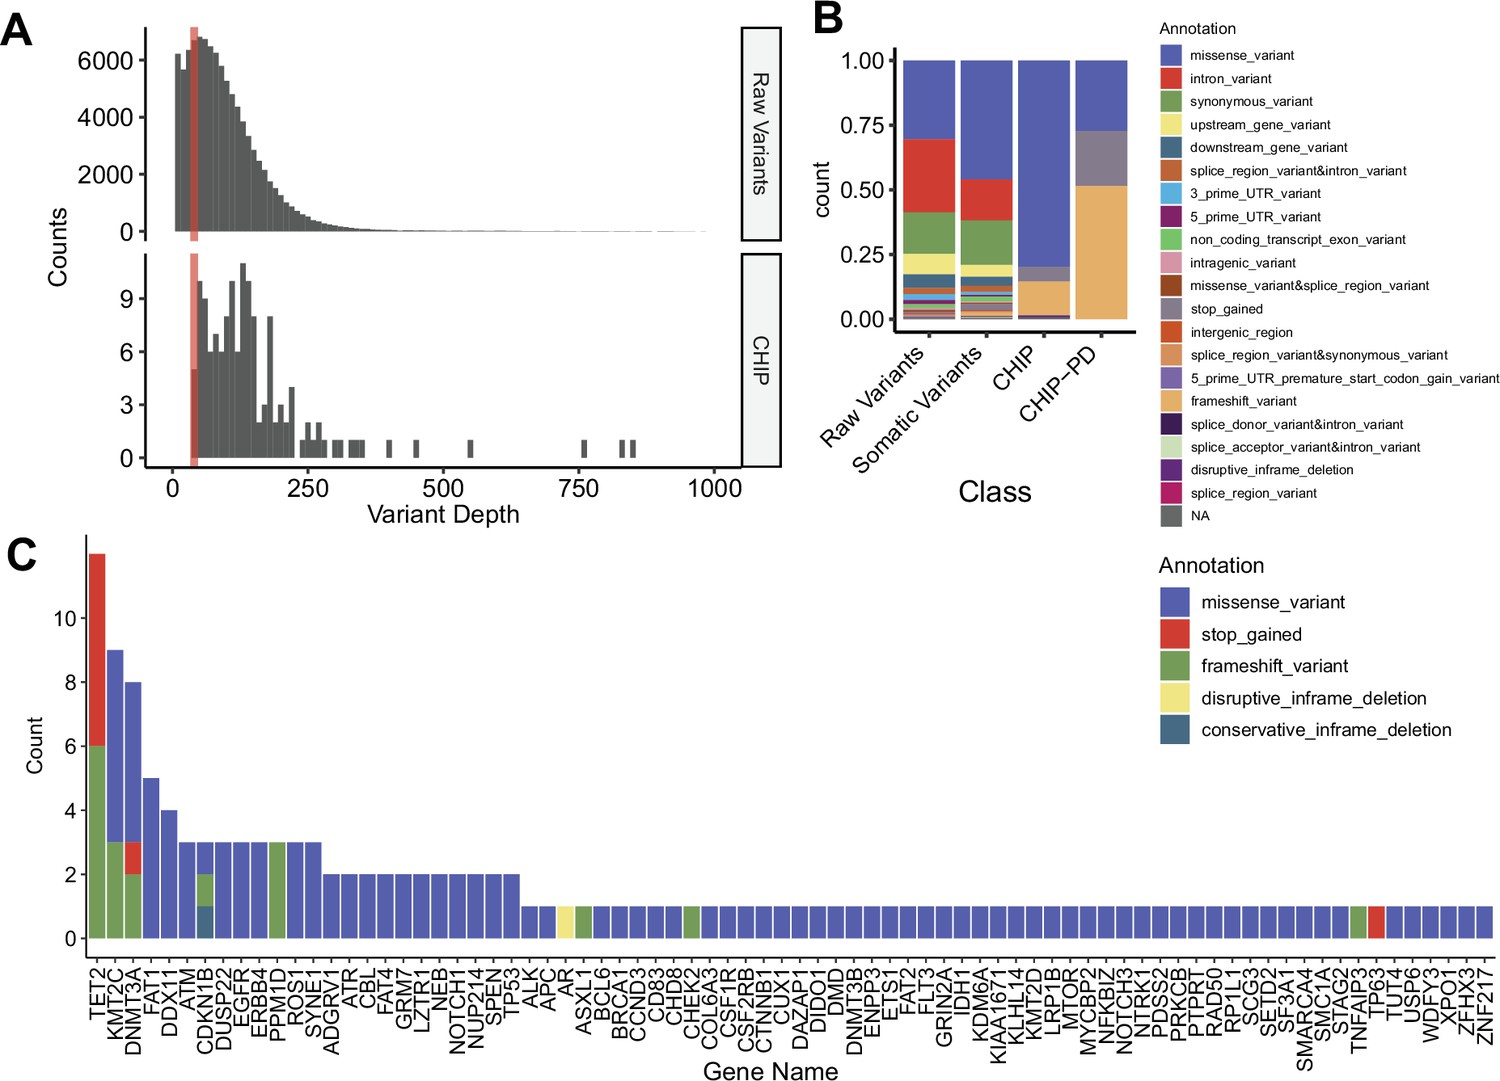
Figure 1—figure supplement 2
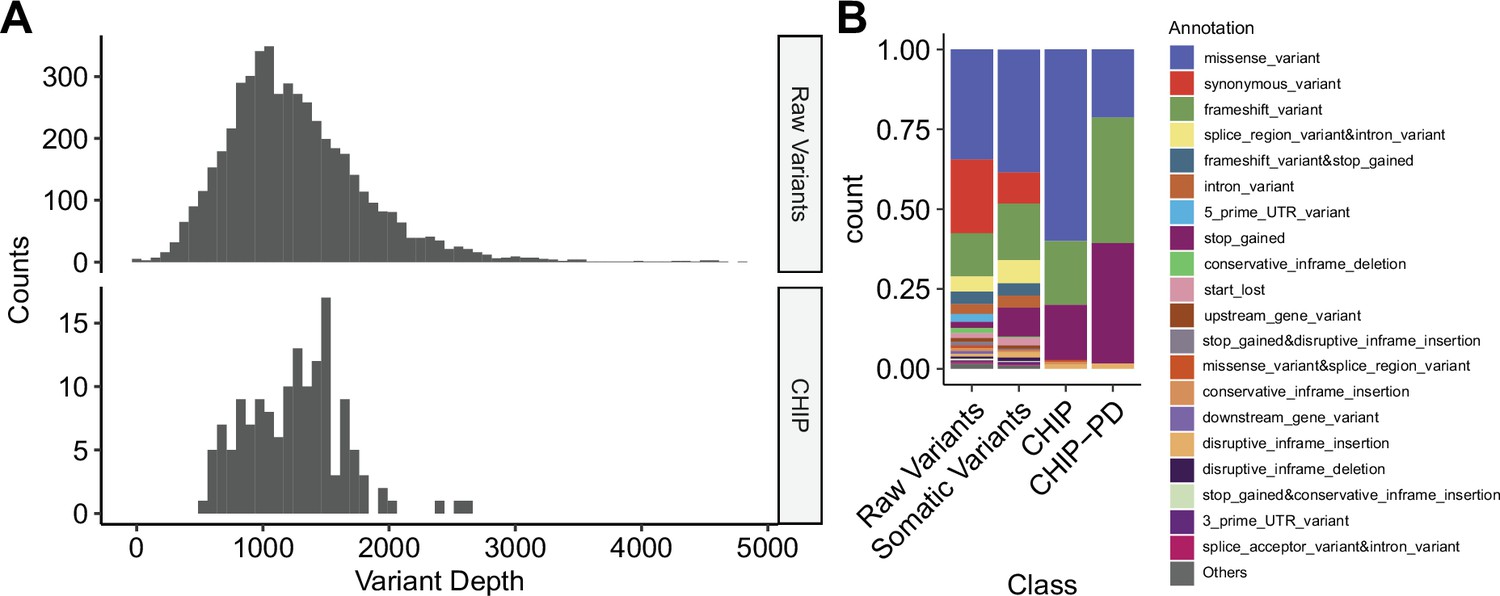
Depth and annotation distributions from variants filtering scheme.
(A) Variant depth distributions from raw calls and putative clonal hematopoiesis of indeterminate potential (CHIP) variants. (B) Distribution of variant annotation from each variant filtering step.
Figure 1—figure supplement 3

Clonal hematopoiesis of indeterminate potential (CHIP) profiles from discovery cohort with panel sequencing (sample n = 100/91 for before treatment and after treatment).
(A) Gene distribution in before and after immune checkpoint inhibitor (ICI) treatment. Color indicates variant annotation. (B) Waterfall plot showing CHIP mutations from baseline, cohort samples.
Figure 2 with 3 supplements
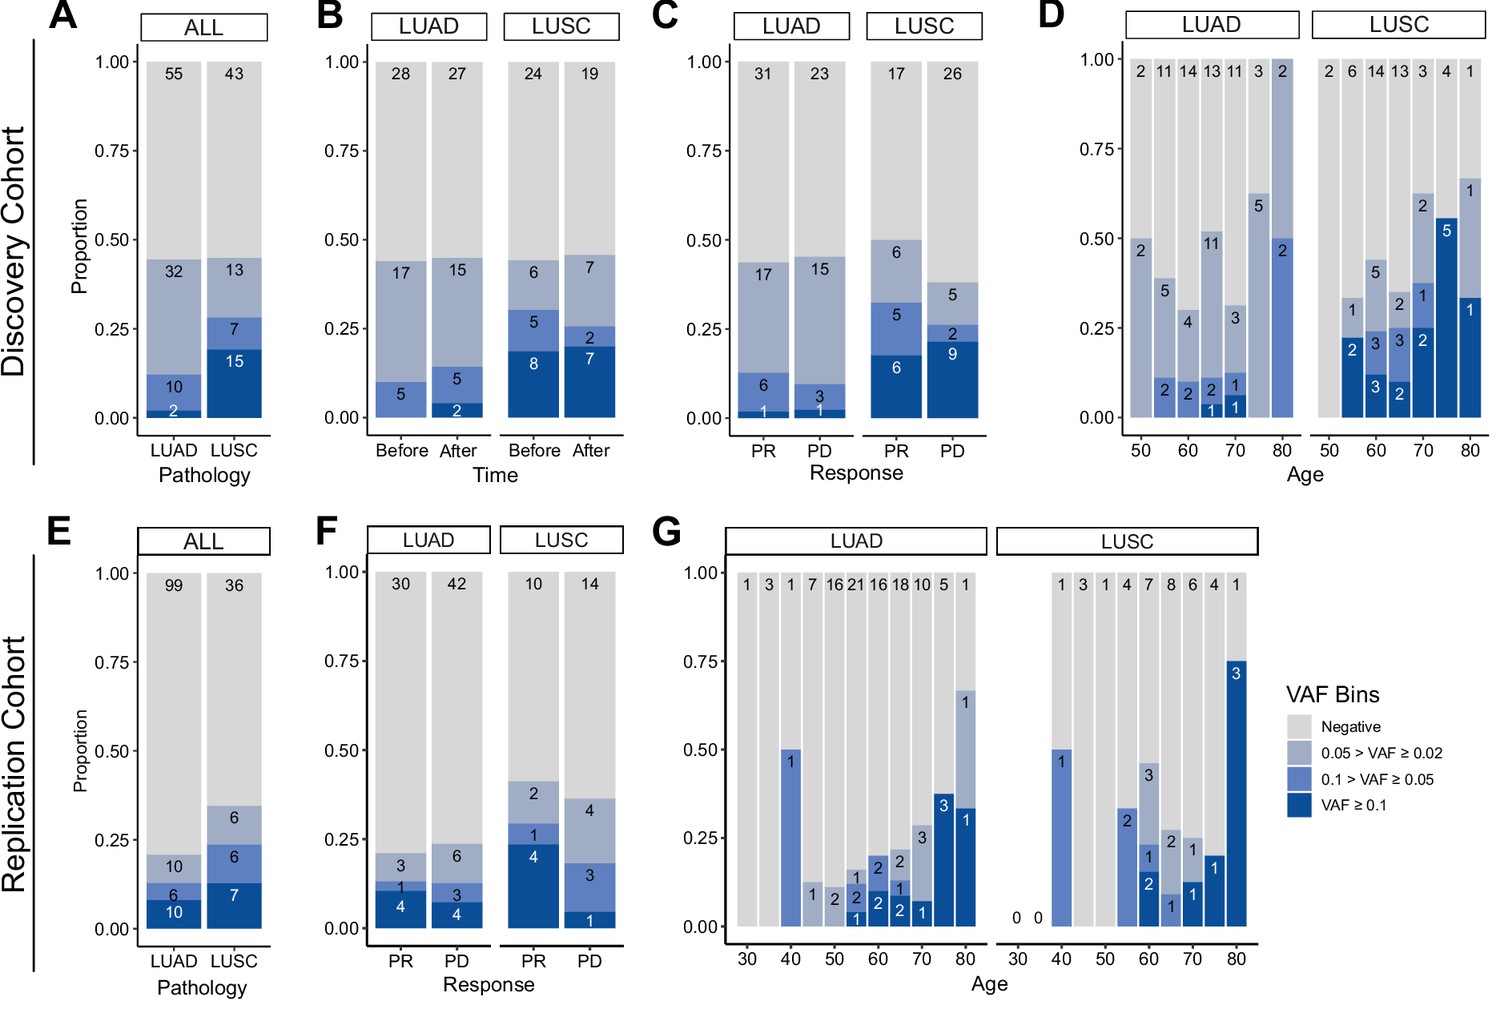
Prevalence of CH in relation to various parameters.
(A–D) Discovery cohort (n = 100), (E–G) replication cohort (n = 180; see Methods for description). (A, E) CH prevalence by pathology (lung squamous cell carcinoma [LUSC] and lung adenocarcinoma [LUAD]). (B) Effect of immune checkpoint inhibitor (ICI) treatment on CH. (C, F) Effect of post-ICI prognosis to ICI on CH. (D, G) Age distribution of the cohort, stratified by clonal hematopoiesis of indeterminate potential (CHIP) allele frequency and pathology status.
Figure 2—figure supplement 1

Clonal hematopoiesis of indeterminate potential (CHIP) profiles, by stratified smoking status.
CHIP status was displayed using (A) binned variant allele frequency (VAF) and (B) variant count per patient. Colors indicate binned VAF and variants count.
Figure 2—figure supplement 2
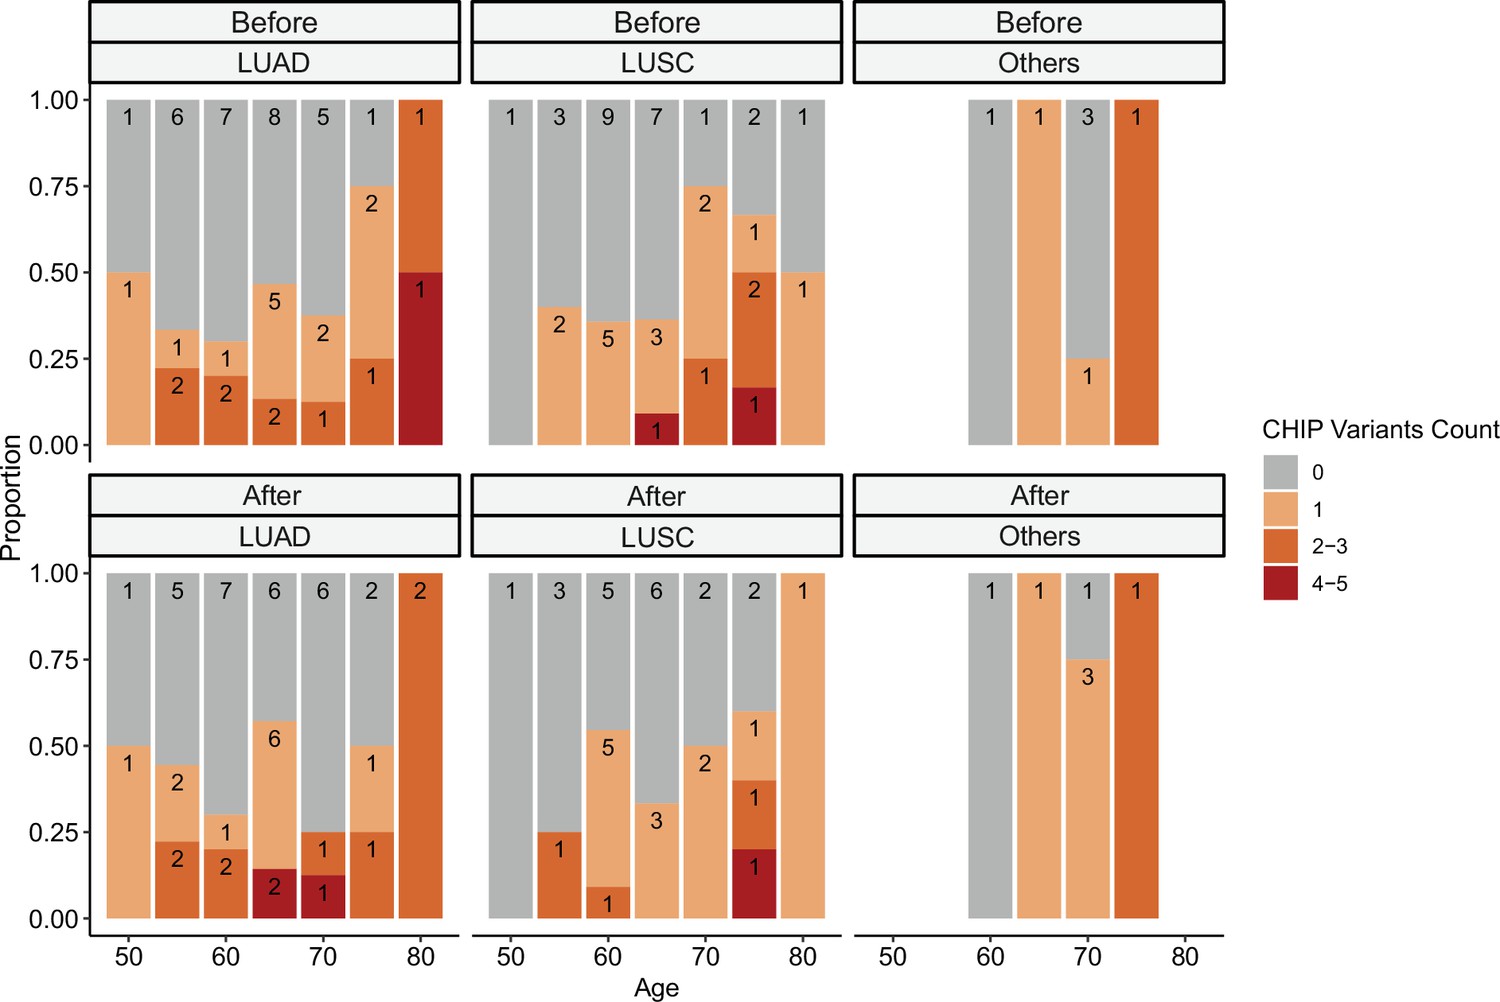
Relationship between clonal hematopoiesis of indeterminate potential (CHIP) variant counts and clinical parameters.
CHIP variant counts and major clinical parameters were presented. Color indicates the binned number of CHIP variants.
Figure 2—figure supplement 3
Clonal hematopoiesis of indeterminate potential (CHIP) profiles from replicative cohort with peripheral blood mononuclear cell (PBMC) whole exome sequencing (WES) (n = 180).
(A) Variant depth distribution from raw and CHIP variant. Colored bar indicates variants cutoff, with depth = 40. (B) Distribution of variant annotation from each variant filtering step. (C) All genes from CHIP variants. Colors denote variant annotation.
Figure 3 with 9 supplements
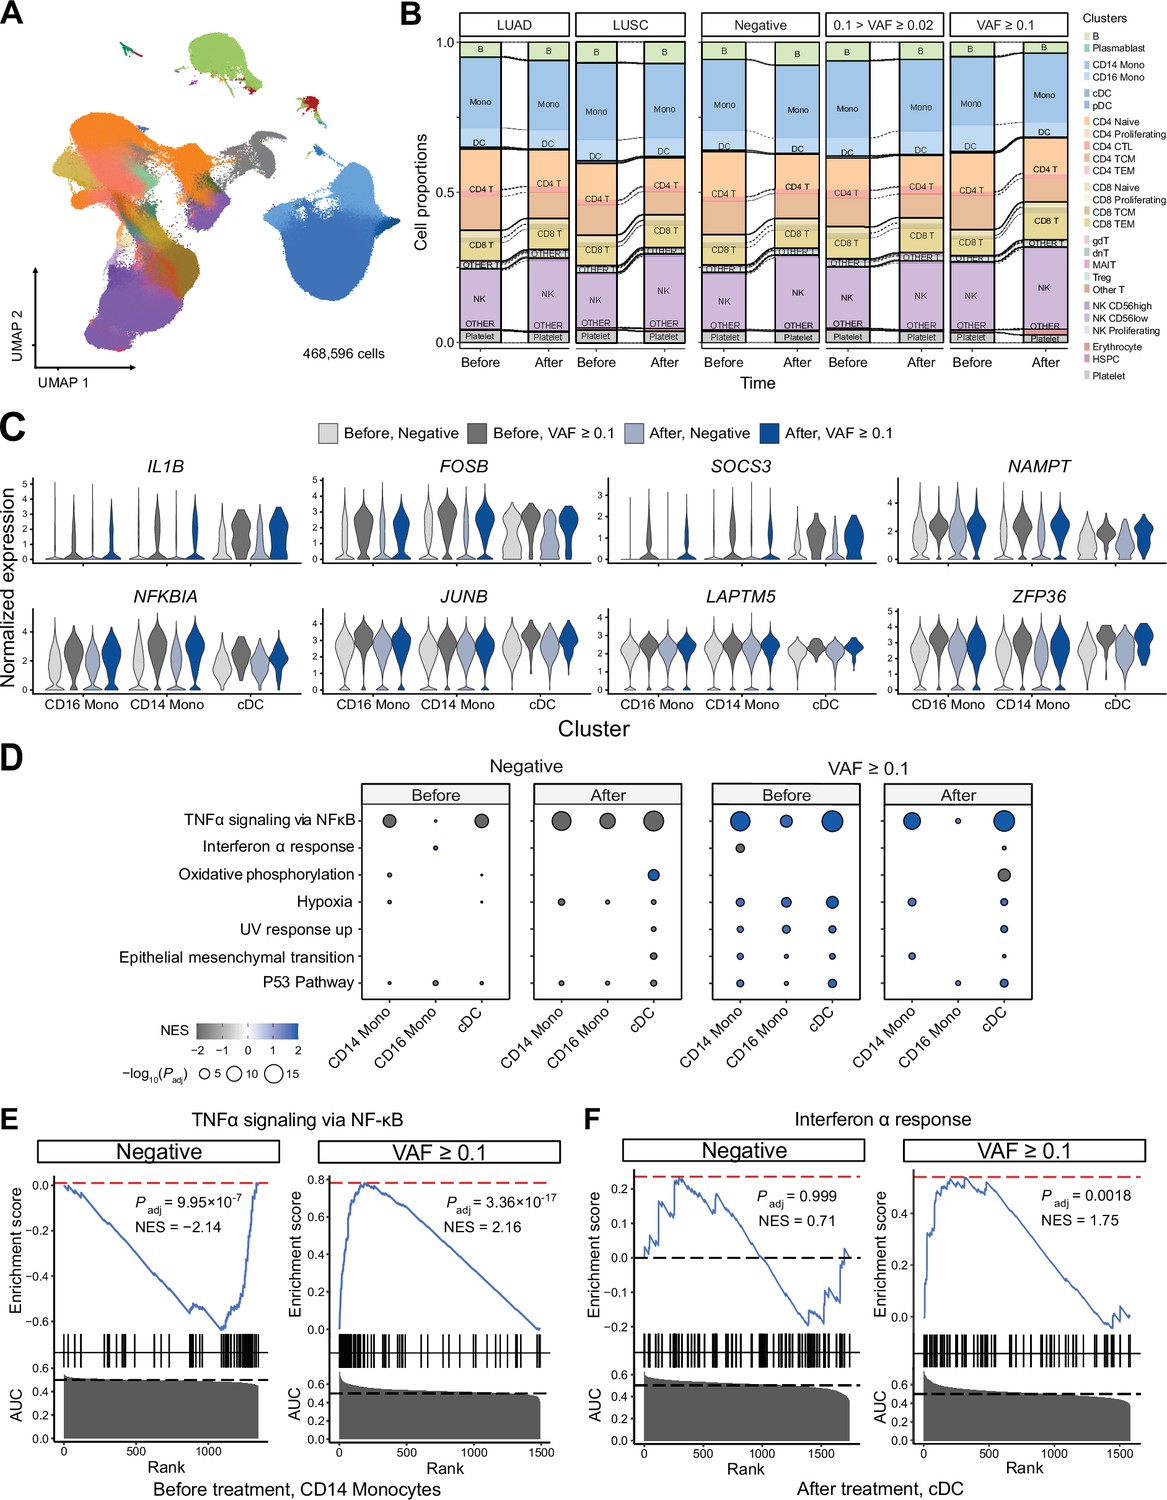
Single-cell RNA sequencing (scRNA-seq) analysis detected myeloid-specific inflammatory signatures in patients with high CH burden.
(A) Uniform manifold approximation and projection (UMAP) plot of scRNA-seq data from the discovery cohort (n = 63). (B) Effect of pathology (left) and variant allele frequency (VAF) (right) on cell composition. (C) Expression of selected genes in the NF-ĸB pathway from the scRNA-seq data. (D) Gene set enrichment analysis (GSEA) of DEGs from myeloid populations. Color represents normalized effect score (NES), and dot size represents adjusted p-values. (E) and (F) GSEA plots of selected pathways from (C).
Figure 3—figure supplement 1

Single-cell RNA sequencing (scRNA-seq) profile of immune checkpoint inhibitor (ICI)-treated, non-small cell lung cancer (NSCLC) patients.
(A) UMAP plot of scRNA-seq data, with CH variant allele frequency (VAF) bins. (B) Cell-type-specific marker gene expression from each cluster. (C) Cell composition plot from each sample.
Figure 3—figure supplement 2

Gene expression of selected pathways for (A) IL-10 and (B) IL-1B.
Figure 3—figure supplement 3

Gene set enrichment analysis (GSEA) results from all annotated clusters.
Color represents normalized effect score (NES), and dot size represents adjusted p-values.
Figure 3—figure supplement 4

Gene set enrichment analysis (GSEA) results and representative gene expression patterns, associated with immune checkpoint inhibitor (ICI) response and clonal hematopoiesis of indeterminate potential (CHIP) variant allele frequency (VAF) bin.
(A) Results of GSEA analysis in response to ICI and CHIP VAF bins, from before treatment samples. Color represents normalized effect score (NES), and dot size represents adjusted p-values. (B) Representative gene expression is displayed using same panels as Figure 3B. Colors indicate groups based on CHIP VAF bin and ICI response status.
Figure 3—figure supplement 5

Single-cell RNA sequencing (scRNA-seq) weighted correlation network analysis (WGCNA) using hdWGCNA.
(A) WGCNA dendrogram, derived from myeloid gene expressions. (B) Cluster-wise ‘black’ module score distribution. (C) Gene ontology (GO) enrichment analysis of the black module genes. The colored bar indicates inflammatory pathway-related GO terms with significant enrichment. (D) Gene set enrichment analysis (GSEA) of black module genes. Colored dots indicate significant gene set enrichment.
Figure 3—figure supplement 6
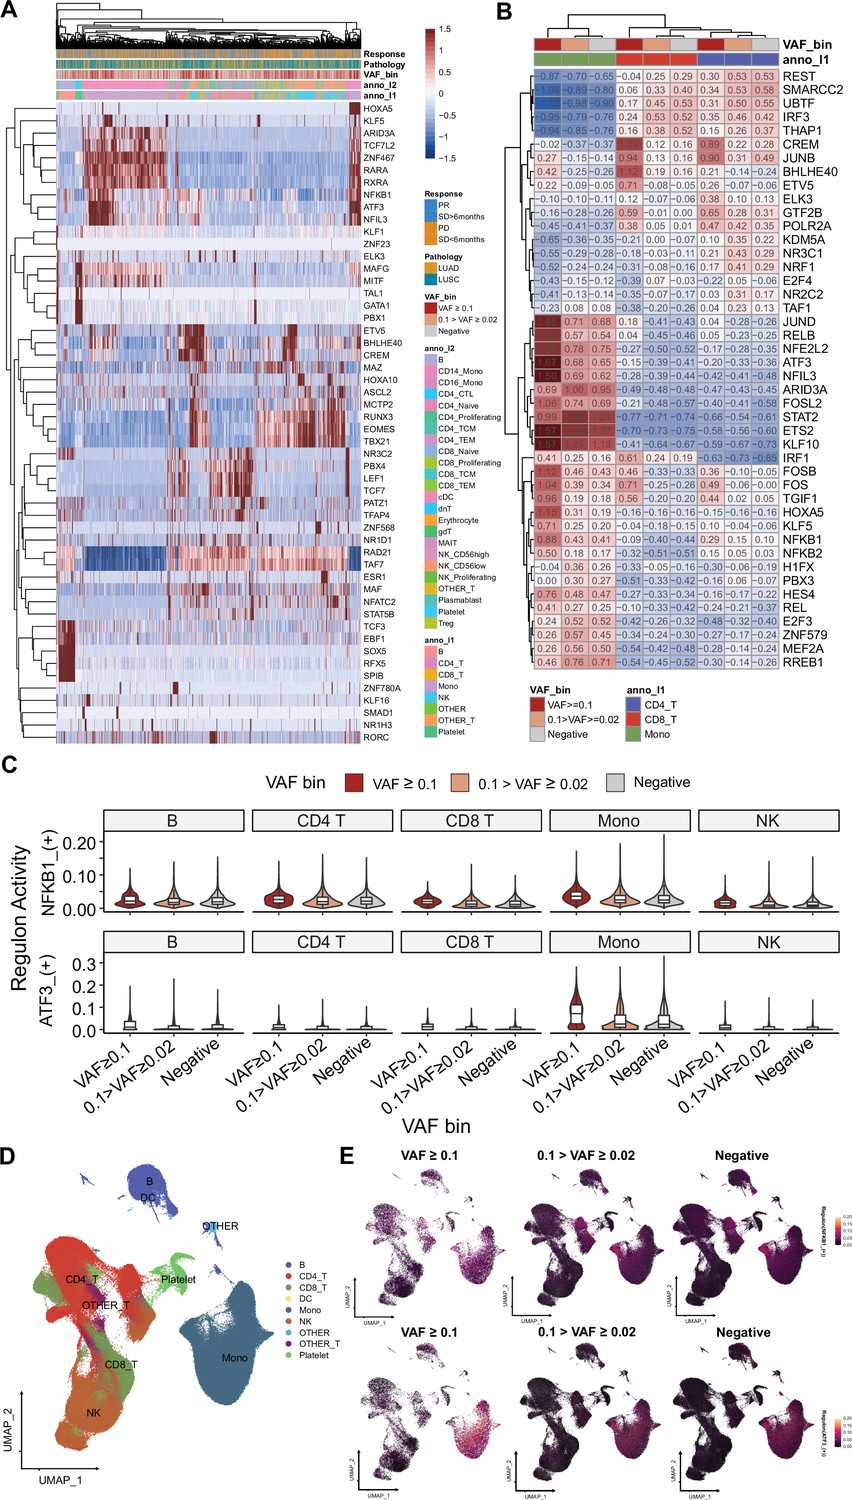
SCENIC analysis for gene regulatory networks (GRNs) on single-cell RNA sequencing (scRNA-seq).
(A) Clustered, representative GRNs from scRNA-seq dataset. 1500 cells from each variant allele frequency (VAF) bin were presented for this visualization. Color represents GRN AUC scores. (B) Aggregated GRN scores from cluster and VAF bins. (C) NFKB1 and ATF3 regulon scores in major cell clusters, stratified by VAF bins. (D) UMAP plot for clusters, used in SCENIC analysis. (E) Regulon expression distribution, using Seurat’s featureplot.
Figure 3—figure supplement 7

Cell–cell interaction analysis using CellphoneDB.
Heatmap illustrating the numbers of cell–cell interactions using (A) high variant allele frequency (VAF) clonal hematopoiesis of indeterminate potential (CHIP) and (B) CHIP negative samples. (C) Selected interaction pathways related to myeloid cells are displayed. Dot sizes represent interaction p-values, and colors indicate the magnitude of interactions. In row names, the order of names is presented as sender | receiver.
Figure 3—figure supplement 8

Survival plot from this cohort.
Survival curve using progression-free survival in clonal hematopoiesis of indeterminate potential (CHIP) negative (N = 71) and high-burden CHIP (N = 11), using survplot in R.
Figure 3—figure supplement 9
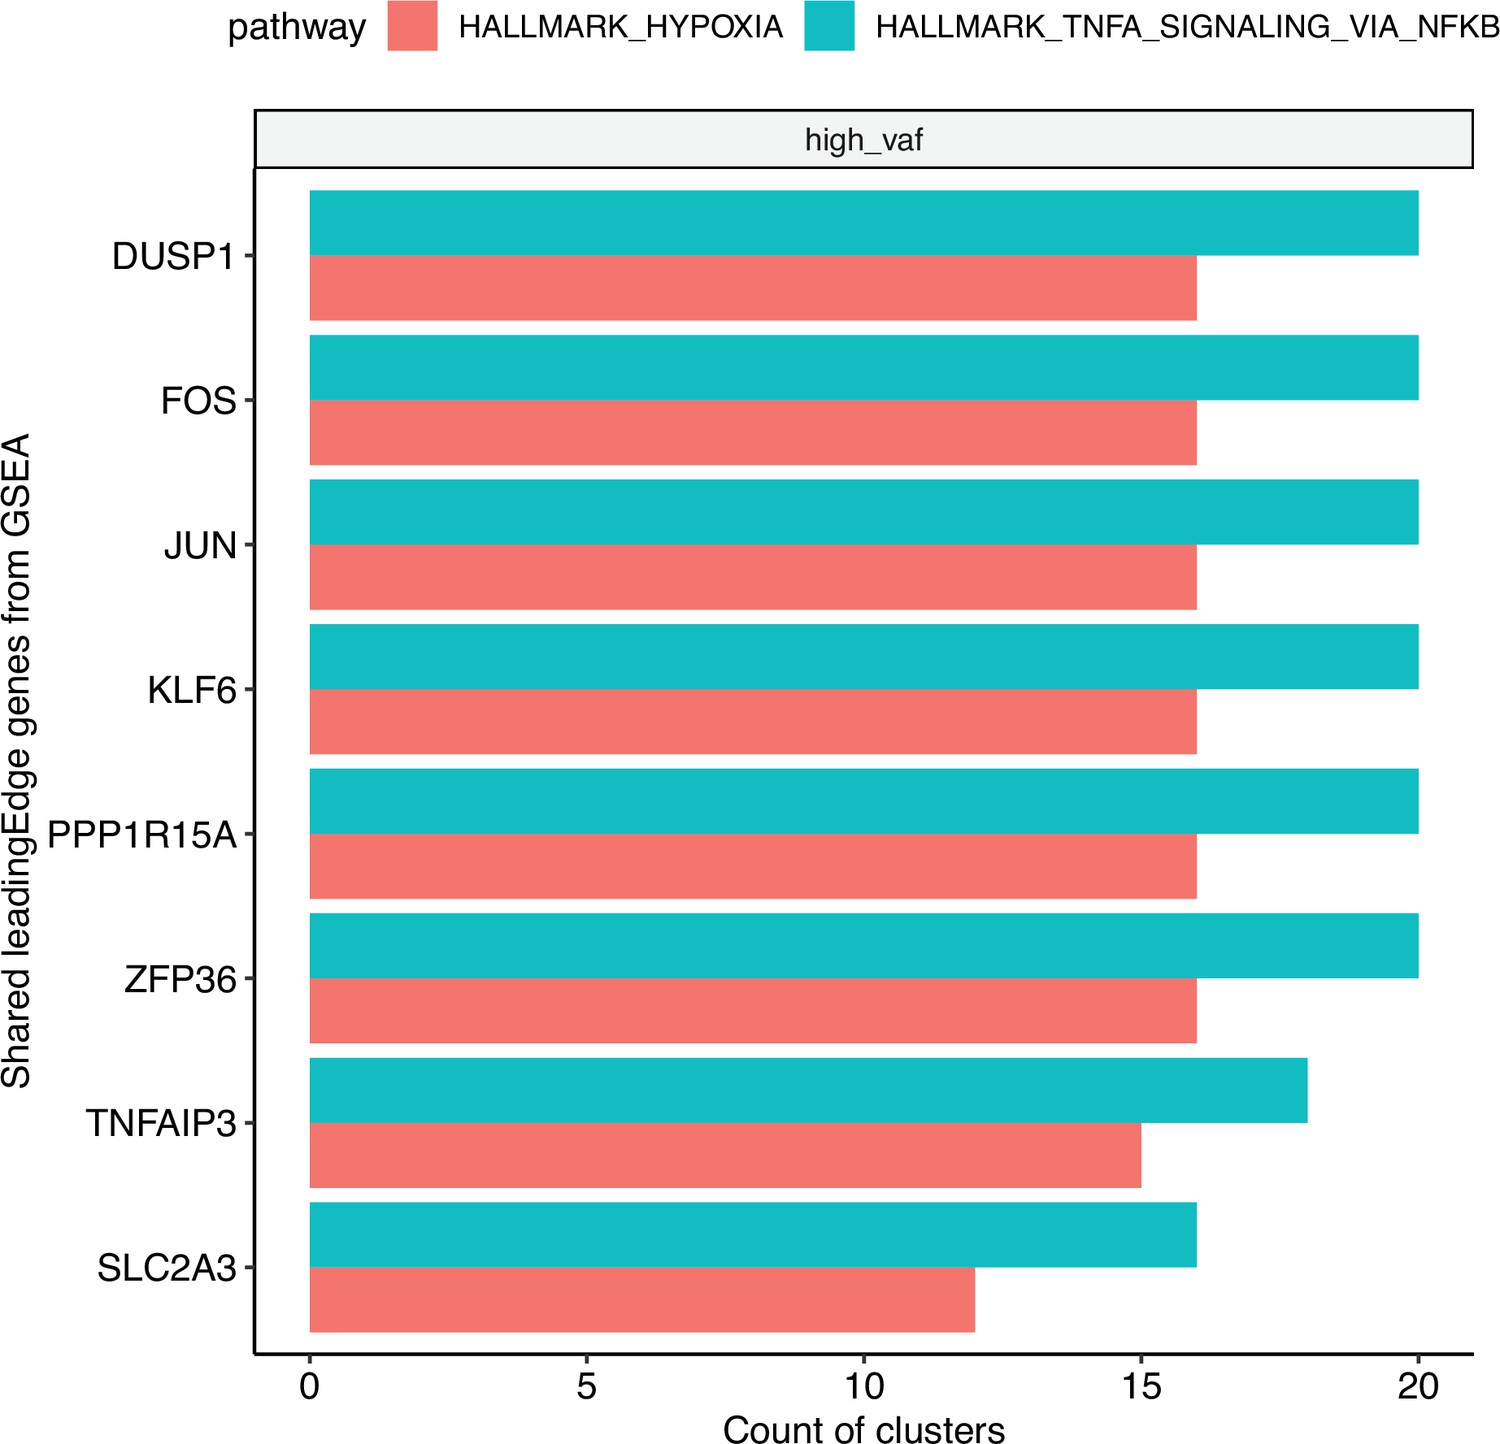
Bar plot of the top shared gene set enrichment analysis (GSEA) leading edge genes, using significantly enriched (adjusted p < 0.05 for each cluster).
Hypoxia and TNF-ɑ signaling pathways across clusters. The bars represent the count of clusters in which each gene is included in the leading edge.
Additional files
-
Supplementary file 1
Supplementary tables provided in an excel file.
(a) Clinical information of non-small cell lung cancer (NSCLC) cohort with immune checkpoint inhibitor (ICI) treatment. (b) Information of control samples. (c) List of clonal hematopoiesis of indeterminate potential (CHIP) variants detected from targeted sequencing. (d) List of CHIP variants detected from whole exome sequencing (WES). (e) Identified DEGs from annotated clusters of single-cell RNA sequencing (scRNA-seq). (f) Gene set enrichment analysis (GSEA) results related to myeloid lineage, related to Figure 3C. (g) Identified DEGs from each cluster by variant allele frequency (VAF) bin. (h) Gene-module annotation from weighted correlation network analysis (WGCNA).
- https://cdn.elifesciences.org/articles/96951/elife-96951-supp1-v1.xlsx
-
MDAR checklist
- https://cdn.elifesciences.org/articles/96951/elife-96951-mdarchecklist1-v1.docx
Download links
A two-part list of links to download the article, or parts of the article, in various formats.
Downloads (link to download the article as PDF)
Open citations (links to open the citations from this article in various online reference manager services)
Cite this article (links to download the citations from this article in formats compatible with various reference manager tools)
Increased inflammatory signature in myeloid cells of non-small cell lung cancer patients with high clonal hematopoiesis burden
eLife 13:RP96951.
https://doi.org/10.7554/eLife.96951.3


