TMEM16 and OSCA/TMEM63 proteins share a conserved potential to permeate ions and phospholipids
- Department of Biochemistry, Duke University School of Medicine, United States
- Institute of Molecular Physiology, Shenzhen Bay Laboratory, China
- Department of Biology, Duke University, United States
- Department of Neurobiology, Duke University School of Medicine, United States
Figures
Figure 1 with 2 supplements
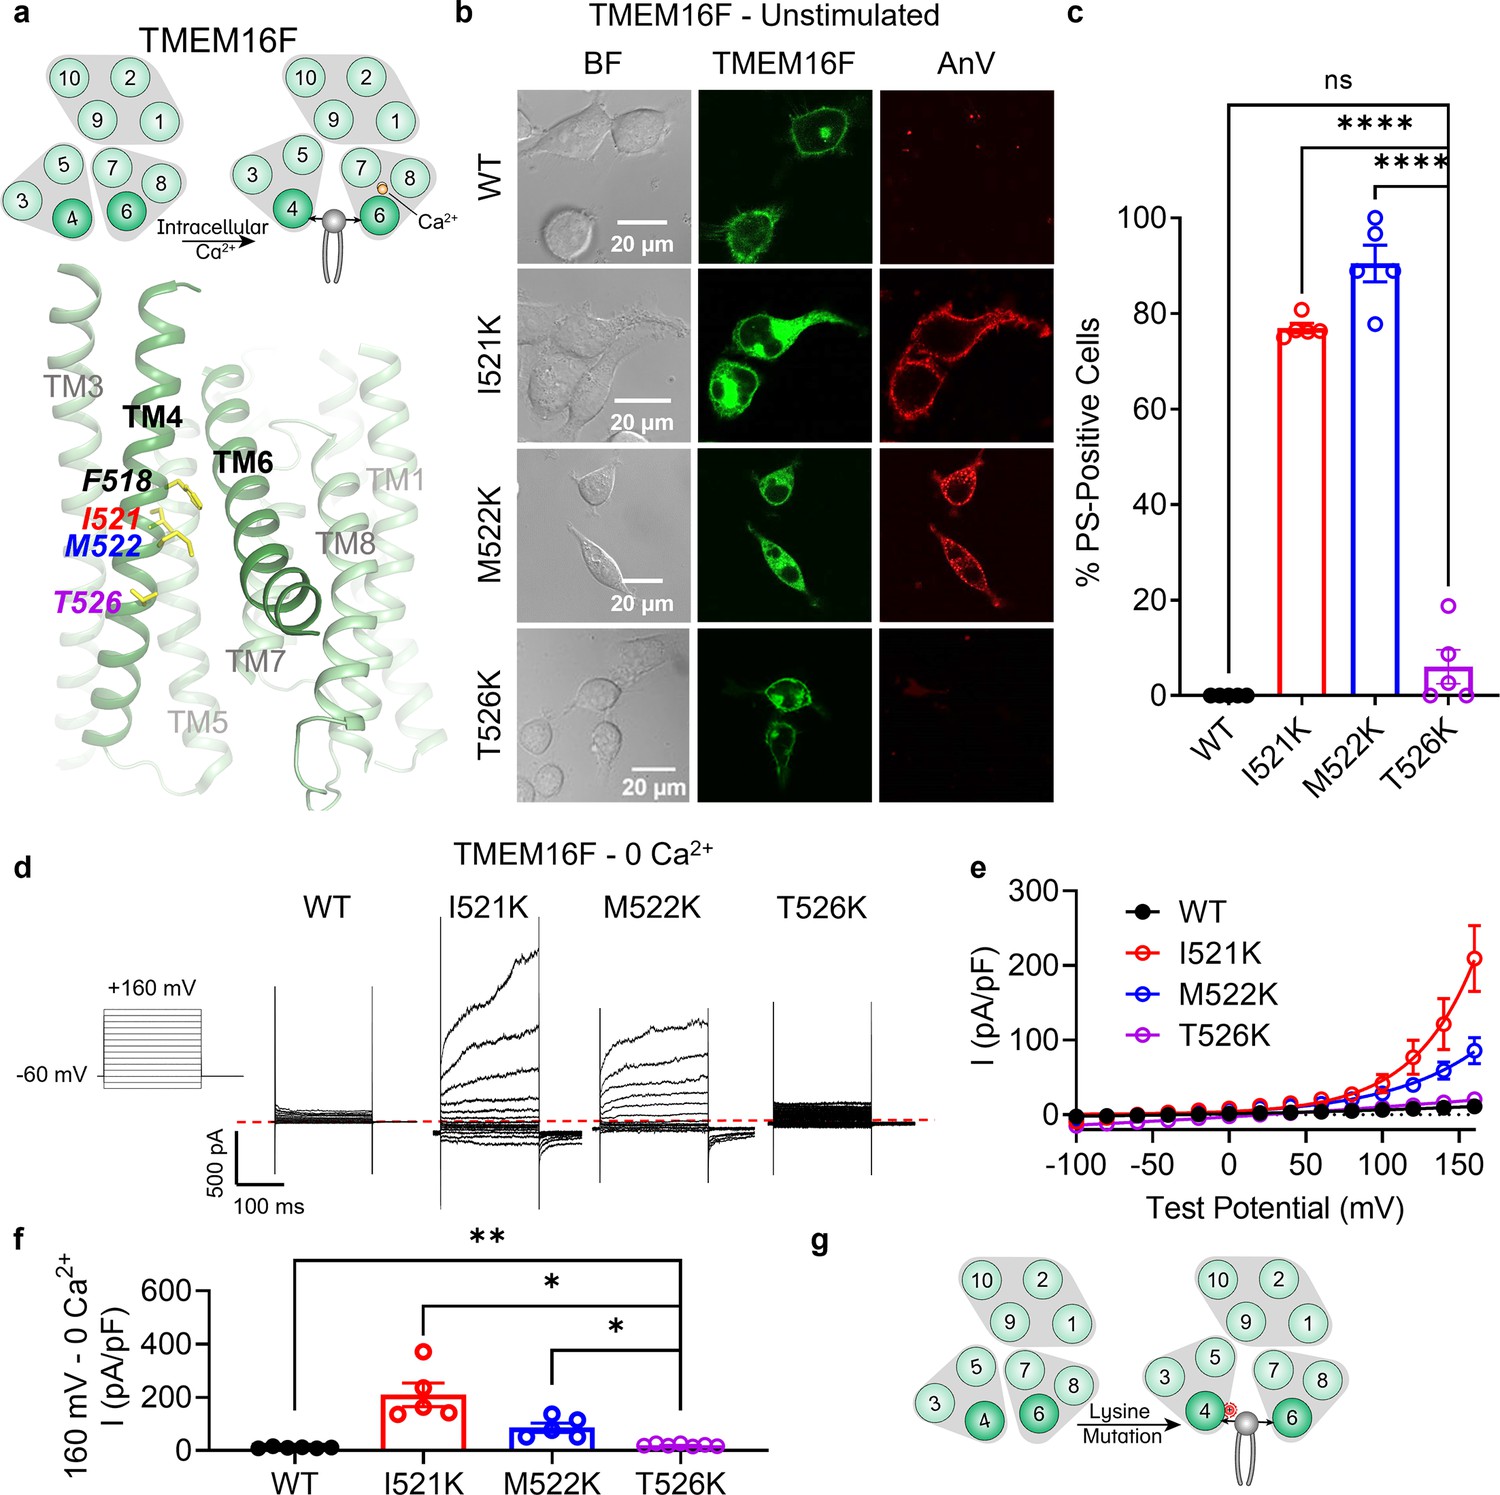
Lysine mutations along TM 4 enable TMEM16F channel and scramblase activities in the absence of calcium stimulation.
(a) Top: TMEM16F is a calcium-activated phospholipid scramblase. Bottom: TM 4 mutant locations mapped on TMEM16F CaPLSase structure with side chains shown as yellow sticks (PDB 6QPB). (b) Representative images of TMEM16F knockout (KO) HEK293T cells expressing eGFP-tagged TMEM16F wildtype (WT), I521K, M522K, and T526K (center column). CF 594-conjugated Annexin V (AnV, right column) labeled phosphatidylserine (PS) exposing cells. BF denotes bright field images (left column). (c) Quantification of the percentage of cells with AnV labeling for TMEM16F WT (n = 5), I521K (n = 5), M522K (n = 5), and T526K (n = 5) transfected cells (Figure 1—source data 1). Values were derived from images of biological replicates. Statistical comparisons to T526K were done using unpaired t-tests with Welch’s correction (ns: p > 0.05, ****p < 0.0001). (d) Representative current recordings and (e) current–voltage (I–V) relationships (Figure 1—source data 1) of whole-cell patches from TMEM16F KO HEK293T cells expressing eGFP-tagged TMEM16F WT (n = 6), I521K (n = 5), M522K (n = 5), and T526K (n = 7). Currents were elicited by the voltage protocol shown with the pipette solution containing 5 mM EGTA(Ethylene glycol tetraacetic acid). Dotted line denotes zero current. (f) Quantification of current at +160 mV (Figure 1—source data 1). Currents in (e) and (f) were normalized to cell capacitance. Statistical comparisons to T526K were done using unpaired t-tests with Welch’s correction (*p < 0.05, **p <0 .01). (g) Lysine mutations along TM 4 in TMEM16F enable spontaneous phospholipid permeation in the absence of calcium. All error bars represent standard error of the mean (SEM) calculated from replicate images or independent patches.
-
Figure 1—source data 1
Results from the lysine mutations on TM 4 of TMEM16F.
- https://cdn.elifesciences.org/articles/96957/elife-96957-fig1-data1-v1.xlsx
Figure 1—figure supplement 1
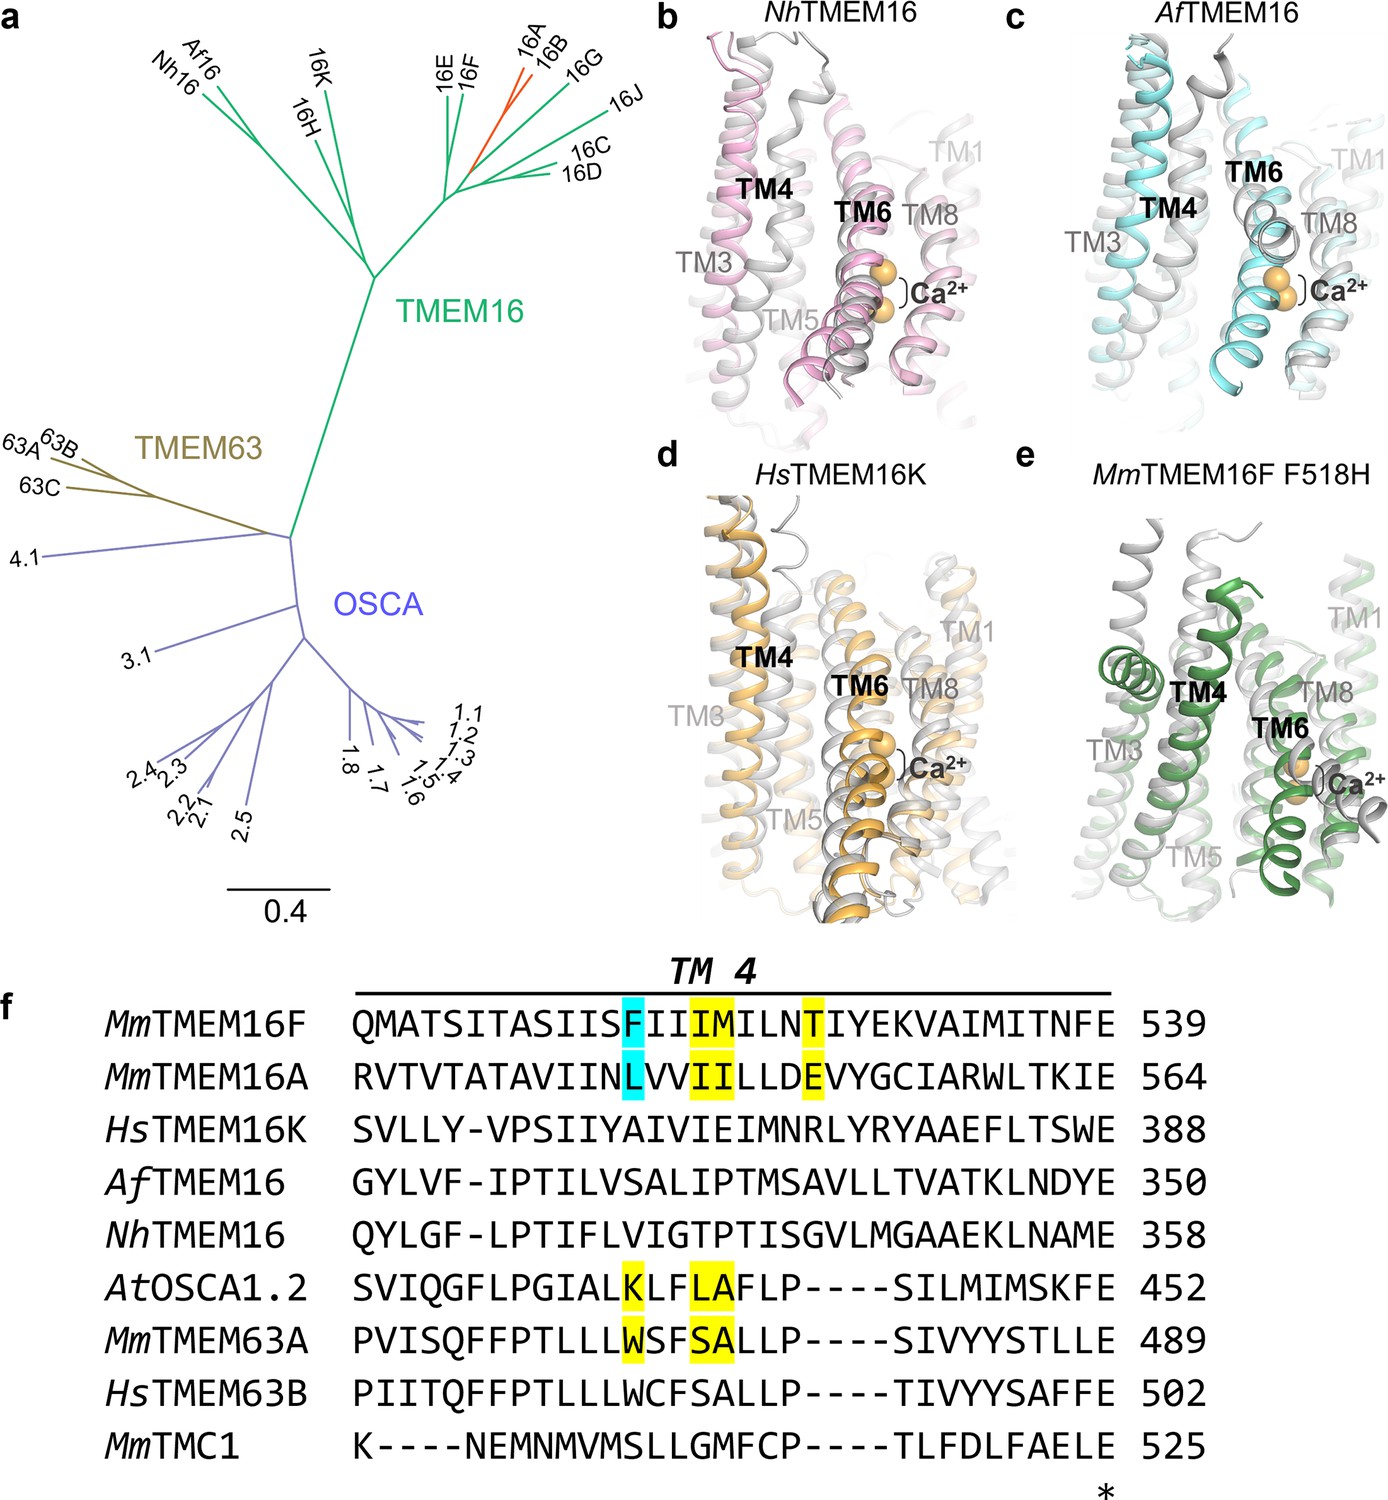
Conformational changes in transmembrane helices (TMs) 4 and 6 are associated with TMEM16 scramblase activities.
(a) Phylogenetic tree of TMEM16 (calcium-activated chloride channel [CaCC], red; putative and validated CaPLSase, green), OSCA (purple), and TMEM63 (gold) families. Structure alignments of (b) fungal NhTMEM16 in calcium-bound open (PDB 6QM9, pink) and calcium-bound closed (PDB 6QMB, gray), (c) fungal AfTMEM16 in calcium-bound open (PDB 6E0H, cyan) and calcium-free closed (PDB 6DZ7, gray), (d) human TMEM16K in calcium-bound open (PDB 5OC9, orange) and calcium-bound closed (PDB 6R7X, gray), and (e) mouse TMEM16F F518H in calcium-bound open (PDB 8B8J, green) and calcium-free closed (PDB 8B8G, gray) conformations. (f) Sequence alignment of TM 4 region for mouse TMEM16F, mouse TMEM16A, human TMEM16K, fungal AfTMEM16, fungal NhTMEM16, thale cress OSCA1.2, mouse TMEM63A, human TMEM63B, and mouse TMC1. Yellow and cyan highlighting denotes residues identified in this work and hydrophobic gate residues previously identified, respectively.
Figure 1—figure supplement 2
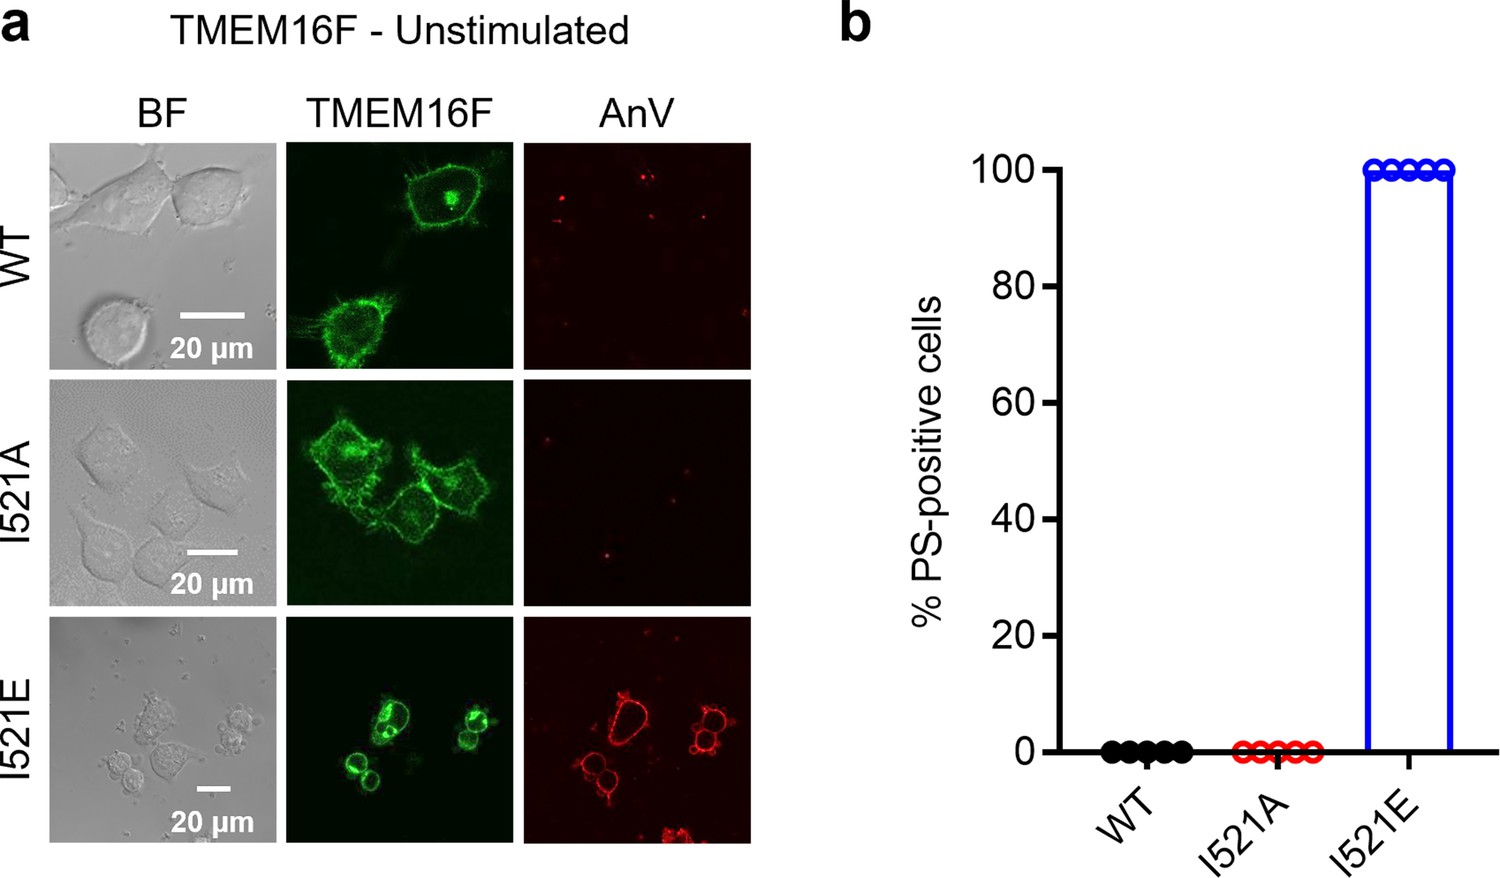
Alternative side chains at I521 cause differential phosphatidylserine (PS) exposure.
(a) Representative images of TMEM16F knockout (KO) HEK293T cells expressing eGFP-tagged TMEM16F wildtype (WT), I521A, and I521E (center column). CF 594-conjugated Annexin V (AnV, right column) labeled PS exposing cells. BF denotes bright field images (left column). (b) Quantification of the percentage of cells with AnV labeling for TMEM16F WT (n = 5), I521A (n = 5), and I521E (n = 5) transfected cells (Figure 1—figure supplement 2—source data 1). Values were derived from images of biological replicates. Statistical comparisons were not conducted due to zero variance within each group.
-
Figure 1—figure supplement 2—source data 1
Results from I521A and I521E of TMEM16F.
- https://cdn.elifesciences.org/articles/96957/elife-96957-fig1-figsupp2-data1-v1.xlsx
Figure 2
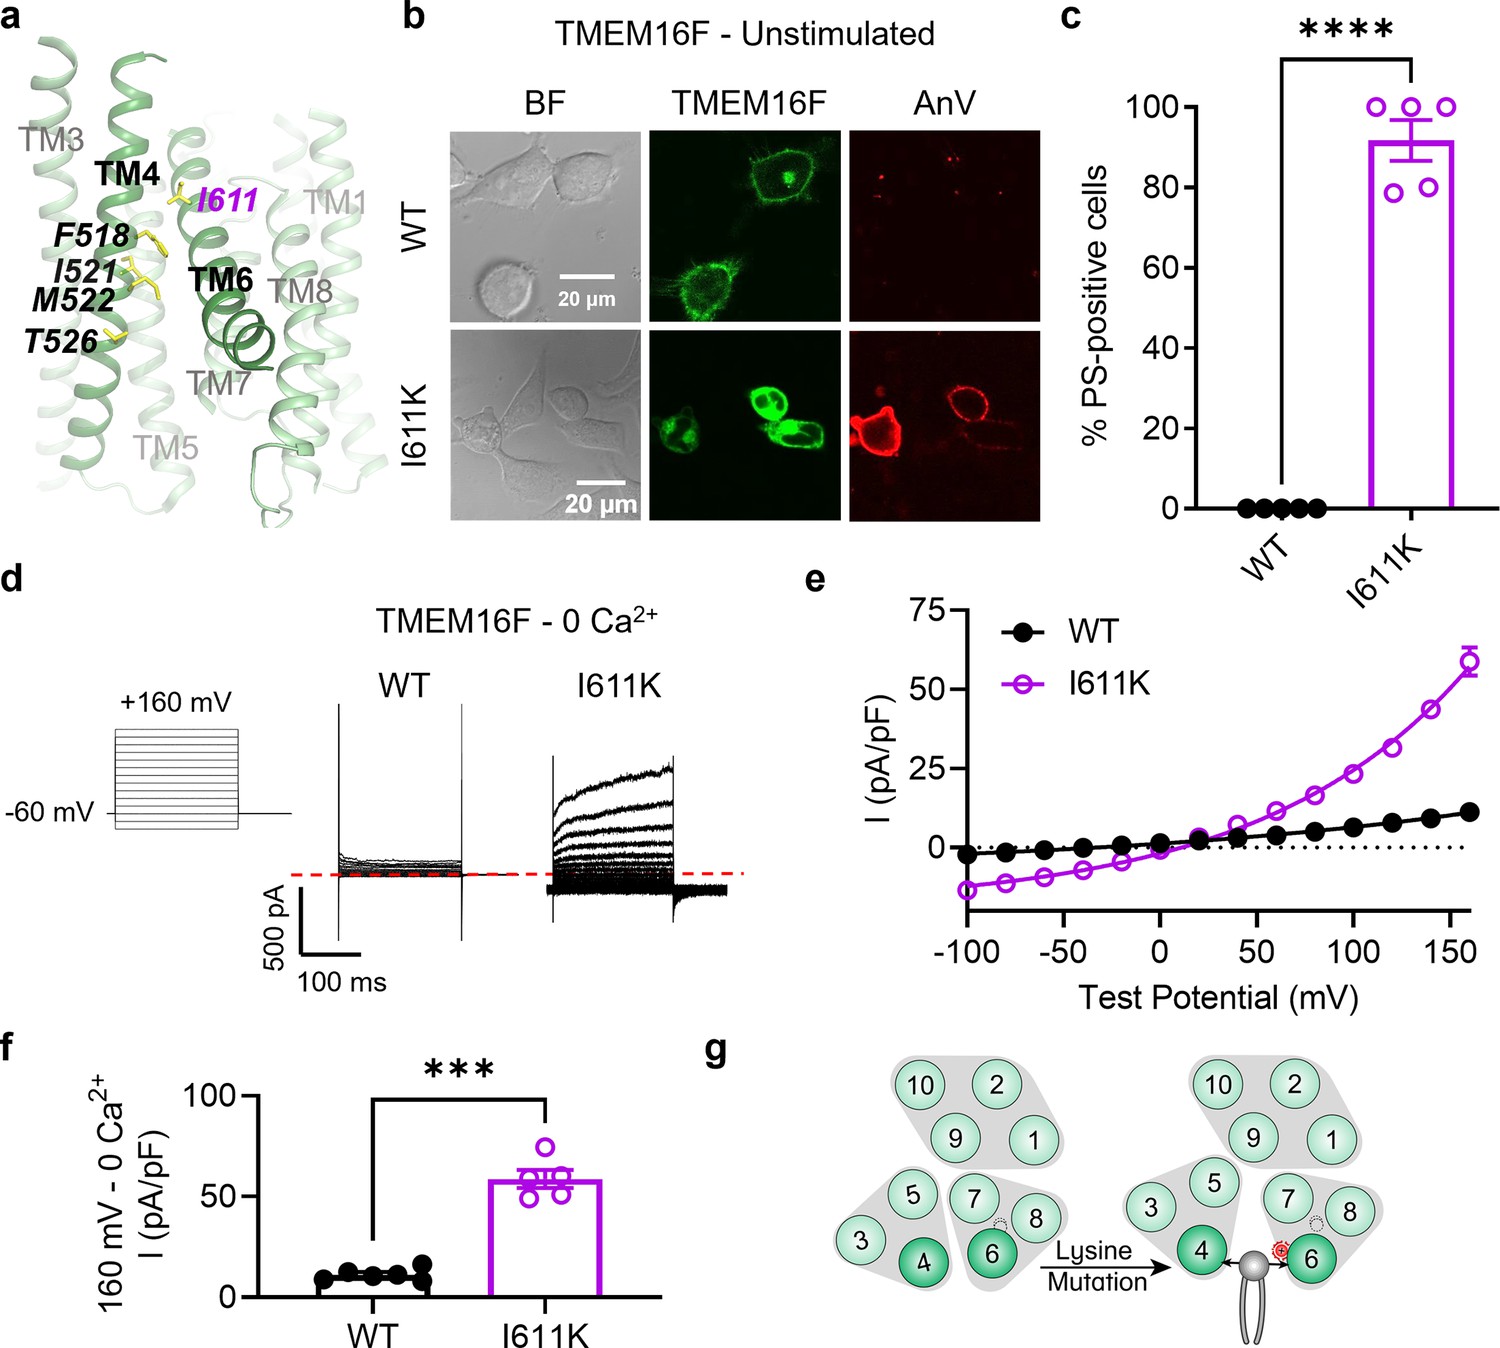
I611K on TM 6 enables TMEM16F channel and scramblase activities in the absence of calcium stimulation.
(a) I611 highlighted on the TMEM16F CaPLSase structure with side chains shown as yellow sticks (PDB 6QPB). (b) Representative images of TMEM16F knockout (KO) HEK293T cells expressing eGFP-tagged TMEM16F wildtype (WT) and I611K (center column). CF 594-conjugated Annexin V (AnV, right column) labeled phosphatidylserine (PS) exposing cells. BF denotes bright field images (left column). (c) Quantification of the percentage of cells with AnV labeling for TMEM16F WT (n = 5) and I611K (n = 5) transfected cells (Figure 2—source data 1). Values were derived from images of biological replicates. Statistical comparison was done using an unpaired t-test with Welch’s correction (****p < 0.0001). (d) Representative current recordings and (e) current–voltage (I–V) relationships (Figure 2—source data 1) of whole-cell patches from TMEM16F KO HEK293T cells expressing eGFP-tagged TMEM16F WT (n = 6) and I611K (n = 5). Currents were elicited by the voltage protocol shown with the pipette solution containing 5 mM EGTA. Dotted line denotes zero current. (f) Quantification of current at +160 mV (Figure 2—source data 1). Currents in (e) and (f) were normalized to cell capacitance. Statistical comparison was done using an unpaired t-test with Welch’s correction (***p < 0.001). (g) A lysine mutation on TM 6 in TMEM16F enables spontaneous phospholipid permeation in the absence of calcium. All error bars represent standard error of the mean (SEM) calculated from replicate images or independent patches.
-
Figure 2—source data 1
Results from I611K on TM 6 of TMEM16F.
- https://cdn.elifesciences.org/articles/96957/elife-96957-fig2-data1-v1.xlsx
Figure 3 with 1 supplement
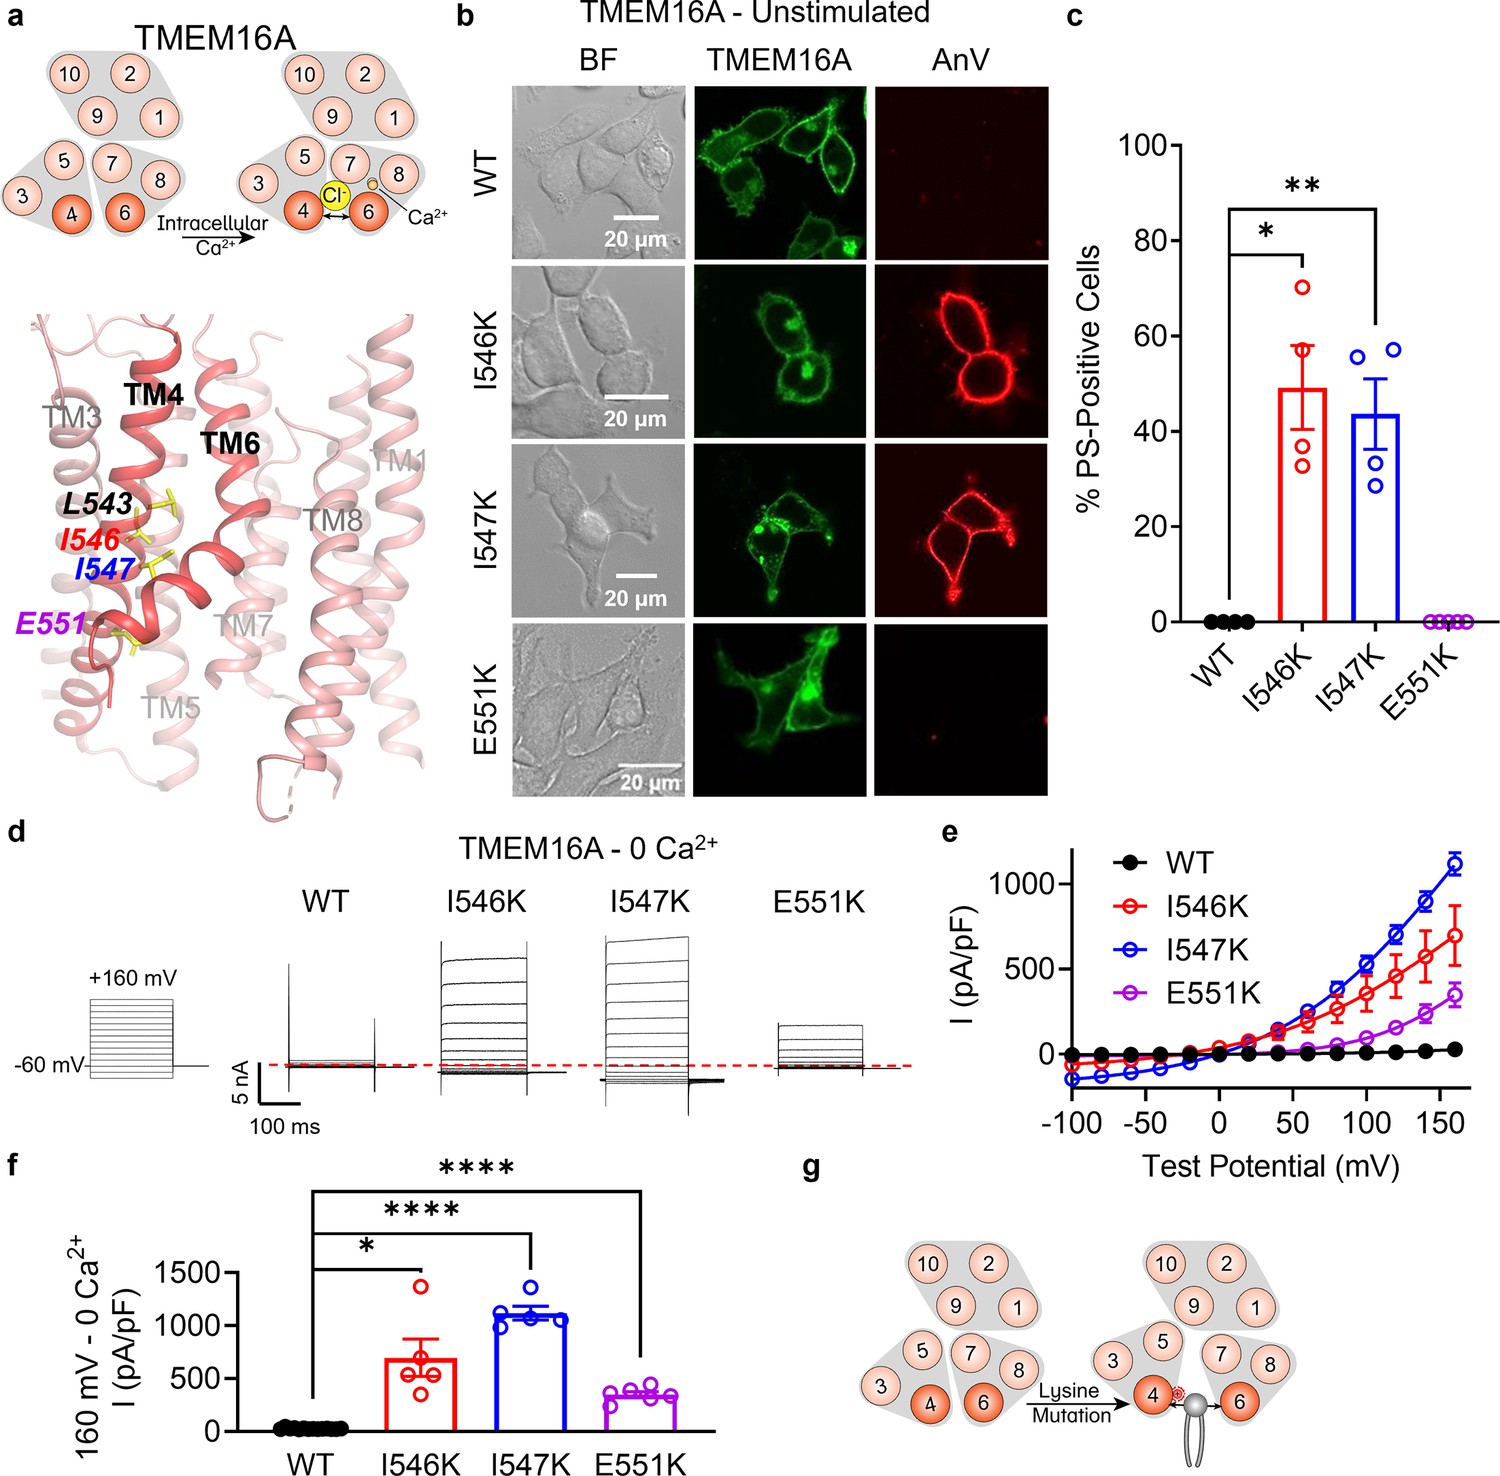
Lysine mutations along TM 4 enable TMEM16A channel and scramblase activities in the absence of calcium stimulation.
(a) Top: TMEM16A is a calcium-activated chloride channel (CaCC). Bottom: TM 4 mutant locations mapped on TMEM16A CaCC structure with side chains shown as yellow sticks (PDB 5OYG). (b) Representative images of TMEM16F knockout (KO) HEK293T cells expressing eGFP-tagged TMEM16A wildtype (WT), I546K, I547K, and E551K (center column). CF 594-conjugated Annexin V (AnV, right column) labeled phosphatidylserine (PS) exposing cells. BF denotes bright field images (left column). (c) Quantification of the percentage of cells with AnV labeling for TMEM16A WT (n = 4), I546K (n = 4), I547K (n = 4), and E551K (n = 5) transfected cells (Figure 3—source data 1). Values were derived from images of biological replicates. Statistical comparisons were done using unpaired t-tests with Welch’s correction (*p < 0.05, **p < 0.01). (d) Representative whole-cell current recordings and (e) current–voltage (I–V) relationships (Figure 3—source data 1) of whole-cell patches from TMEM16F KO HEK293T cells expressing eGFP-tagged TMEM16A WT (n = 14), I546K (n = 5), I547K (n = 5), and E551K (n = 6). Currents were elicited by the voltage protocol shown with the pipette containing 5 mM EGTA. Dotted line denotes zero current. (f) Quantification of current at +160 mV (Figure 3—source data 1). Currents in (e) and (f) were normalized to cell capacitance with the mean ± SEM calculated from independent patches. Statistical comparisons were done using unpaired t-tests with Welch’s correction (*p < 0.05, ****p < 0.0001). (g) Lysine mutations along TM 4 in TMEM16A enable spontaneous phospholipid permeation in the absence of calcium. All error bars represent standard error of the mean (SEM) calculated from replicate images or independent patches.
-
Figure 3—source data 1
Results from the lysine mutations on TM 4 of TMEM16A.
- https://cdn.elifesciences.org/articles/96957/elife-96957-fig3-data1-v1.xlsx
Figure 3—figure supplement 1
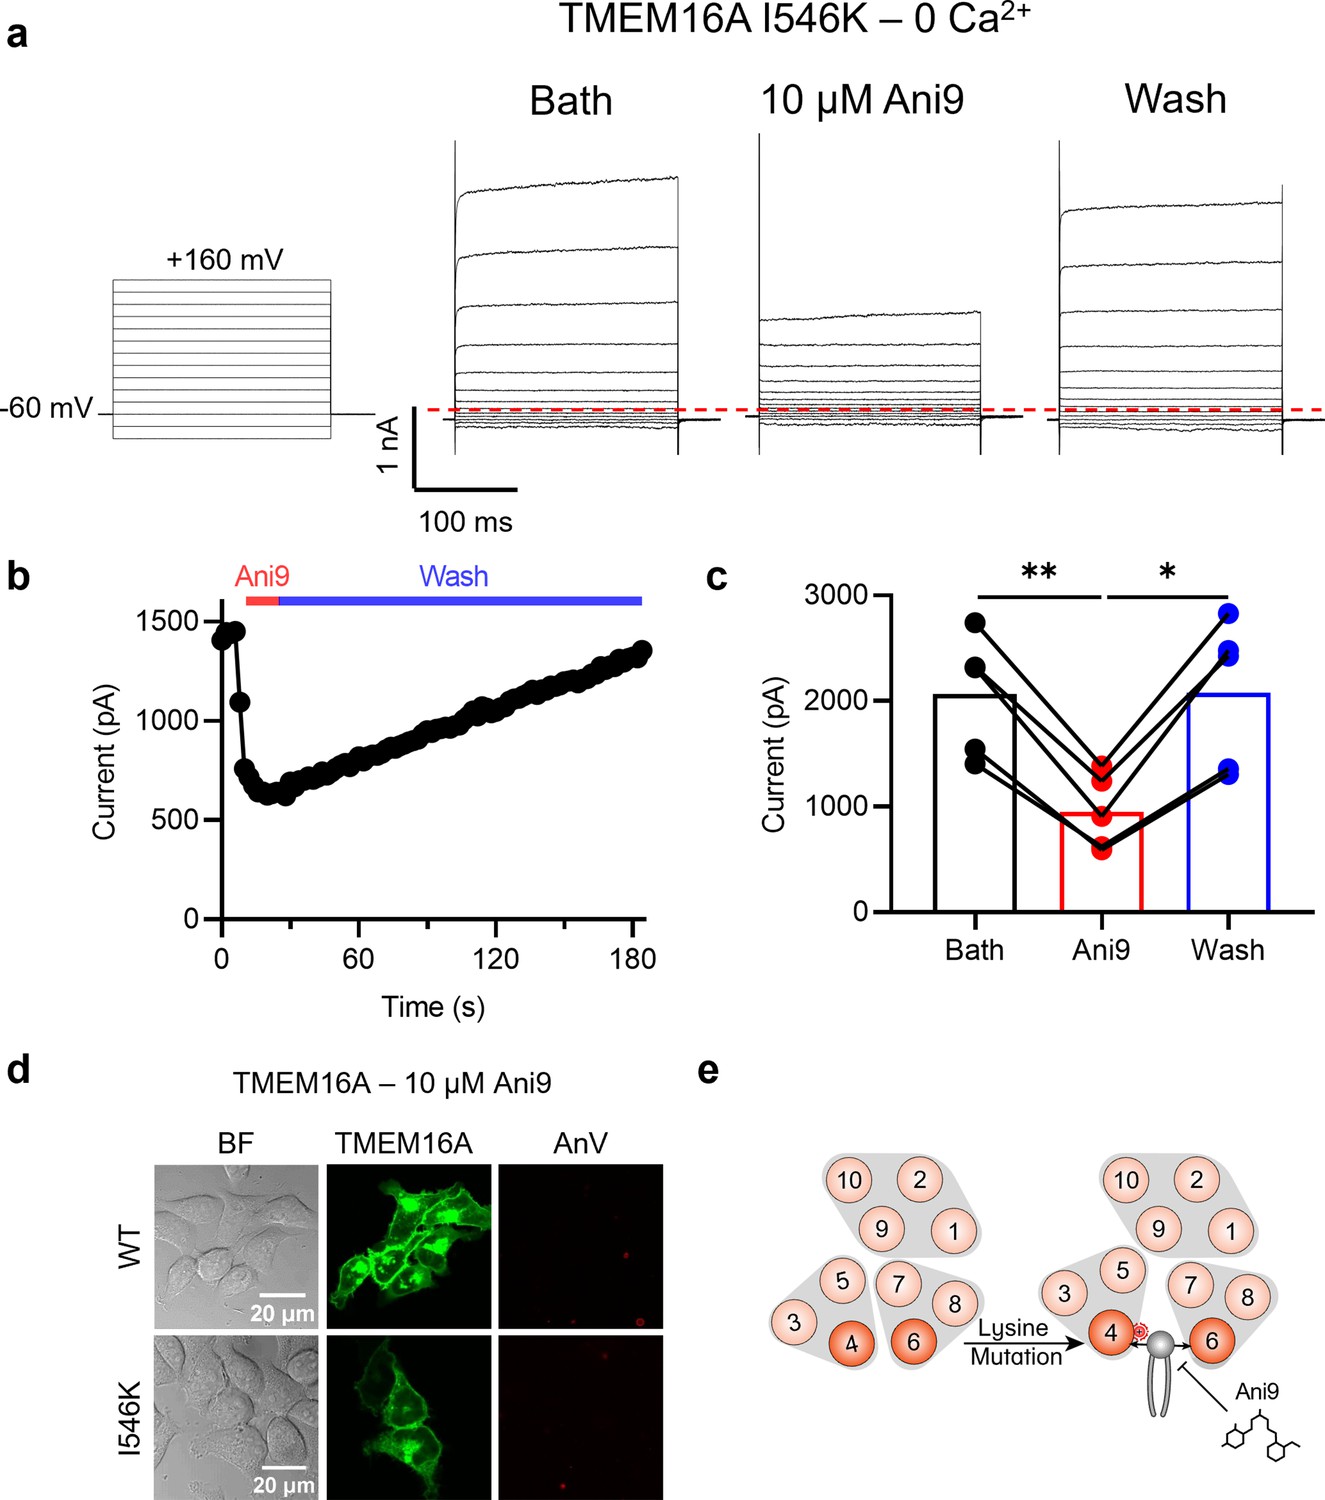
Ani9 attenuates ion channel and phospholipid scramblase activities of TMEM16A I546K.
(a) Representative whole-cell current recordings elicited by the voltage protocol shown (left) for TMEM16A I546K before, during, and after application of 10 µM Ani9. (b) Representative time-course of Ani9 application and wash-off (Figure 3—figure supplement 1—source data 1). (c) Quantification of peak current from (b) before (bath), during (Ani9), and after (wash) Ani9 application (n = 5) (Figure 3—figure supplement 1—source data 1). Statistical comparisons were done using unpaired t-tests with Welch’s correction (*p < 0.05, **p < 0.01). (d) Representative images of TMEM16F knockout (KO) HEK293T cells expressing eGFP-tagged TMEM16A wildtype (WT) or I546K (center columns). CF 594-conjugated Annexin V (AnV) (right columns) failed to label any phosphatidylserine (PS) exposing cells (n = 4). BF denotes bright field images (left columns). (e) Ani9 attenuates mutant-induced phospholipid permeability.
-
Figure 3—figure supplement 1—source data 1
Results from Ani9 effects on TMEM16A I546K.
- https://cdn.elifesciences.org/articles/96957/elife-96957-fig3-figsupp1-data1-v1.xlsx
Figure 4 with 3 supplements
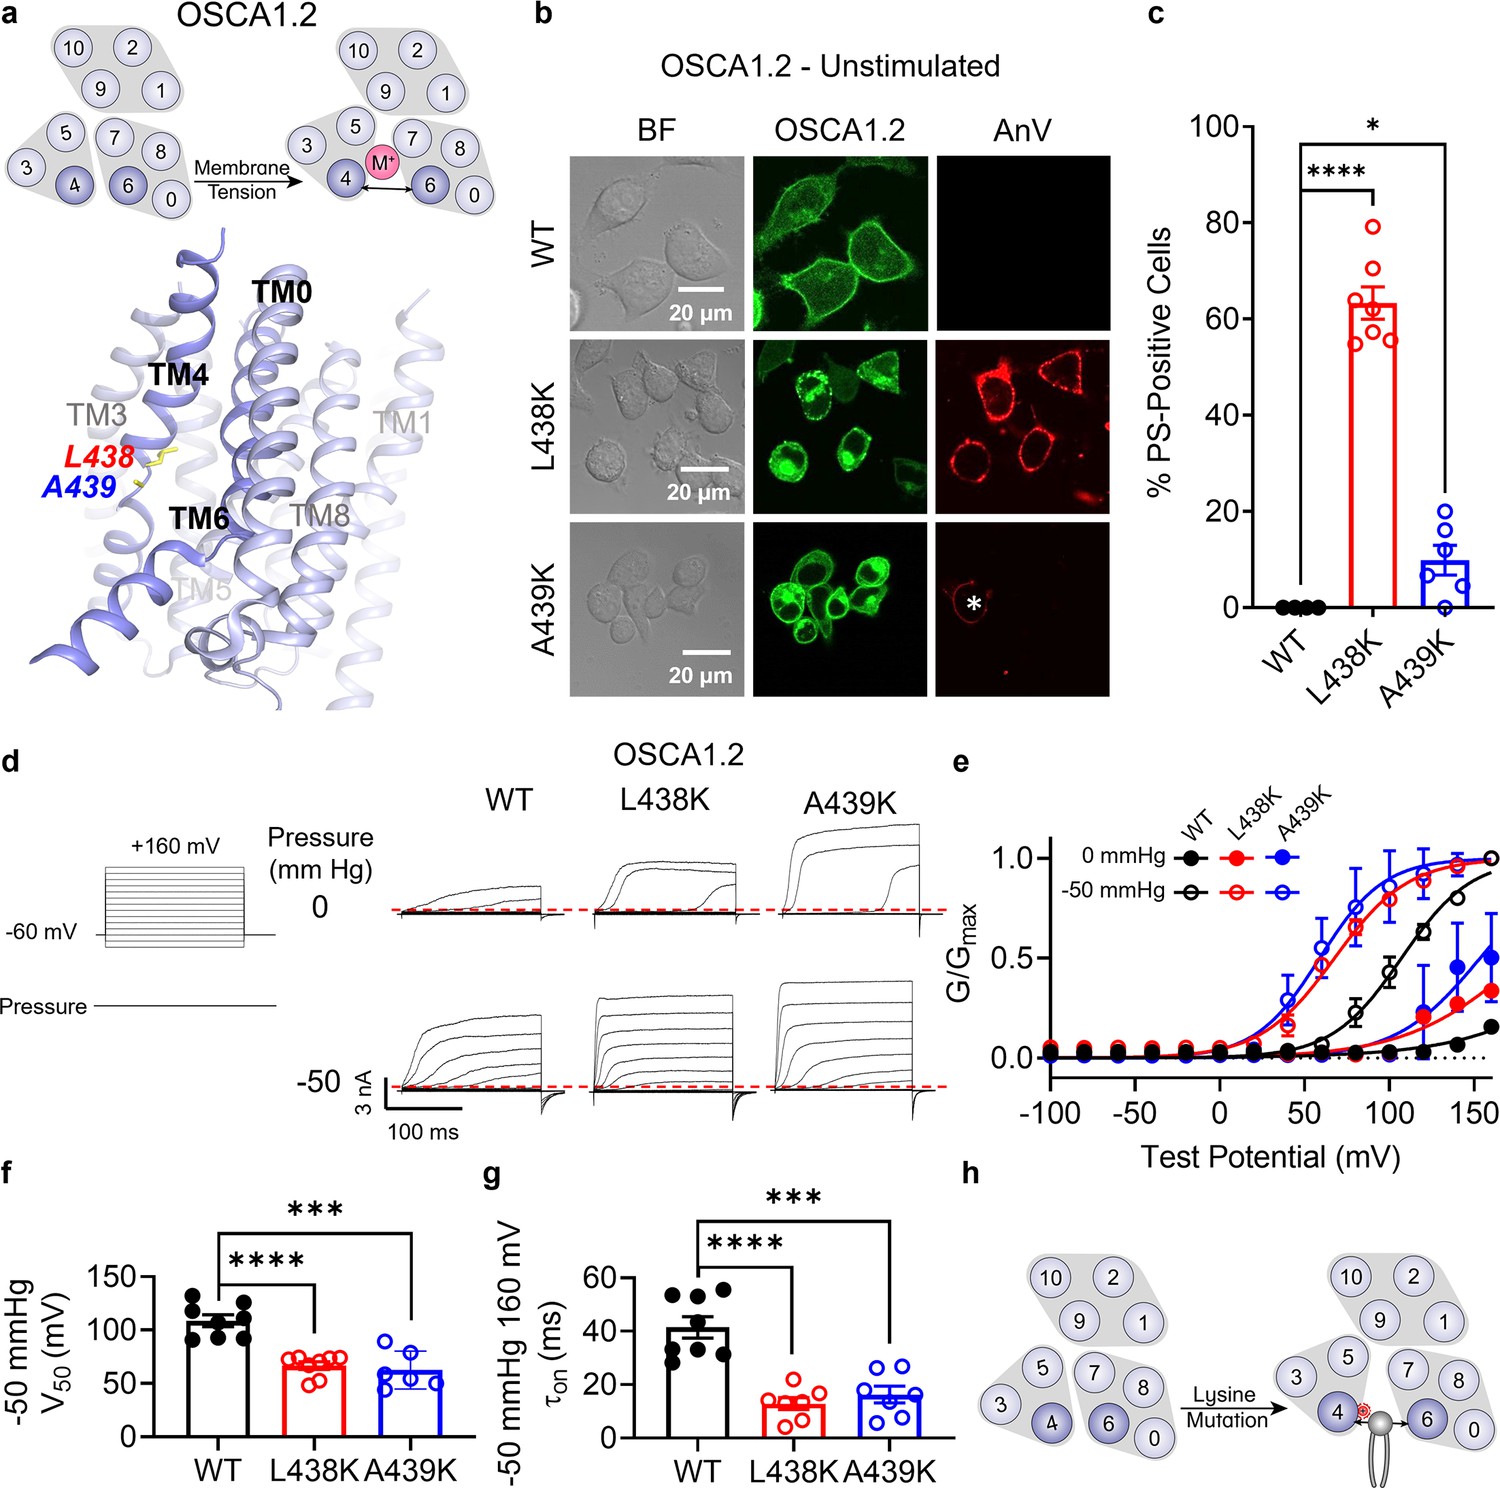
Lysine mutations along TM 4 enable OSCA1.2 channel and scramblase activities.
(a) Top: OSCA1.2 is a cation non-selective ion channel gated by membrane tension. Bottom: TM 4 mutant locations mapped onto the TM 4/6 interface of OSCA1.2 (PDB 6MGV) with key residues shown as yellow sticks. (b) Representative images of TMEM16F knockout (KO) HEK293T cells expressing eGFP-tagged OSCA1.2 wildtype (WT), L438K, or A439K mutants (center column). CF 594-conjugated Annexin V (AnV) (right column) labeled phosphatidylserine (PS) exposing cells. BF denotes bright field images (left column). Asterisk highlights a PS-positive cell for the A439K mutant. (c) Quantification of the percentage of cells with AnV labeling for OSCA1.2 WT (n = 4), L438K (n = 7), and A439K-transfected cells (n = 6) (Figure 4—source data 1). Statistical comparisons were conducted with unpaired t-tests with Welch’s correction (*p < 0.05, ****p < 0.0001). (d) Representative current recordings and (e) normalized conductance–voltage (G–V) relationships of inside-out patches from TMEM16F KO HEK293T cells expressing eGFP-tagged OSCA1.2 WT (n = 8), L438K (n = 8), and A439K (n = 6) (Figure 4—source data 1). Currents were elicited by the voltage protocol shown next to the listed pressures. Dotted lines denote zero current. (f) Quantification of half-maximal voltage at −50 mmHg for WT (109 mV), L438K (67 mV), and A439K (63 mV) (Figure 4—source data 1). Statistical comparison was conducted with unpaired t-tests with Welch’s correction (***p < 0.001, ****p < 0.0001). (g) Quantification of activation on at −50 mmHg and 160 mV for WT (41 ms), L438K (13 ms), and A439K (16 ms) (Figure 4—source data 1). Statistical comparison was conducted with unpaired t-tests with Welch’s correction (***p < 0.001, ****p < 0.0001). (h) A lysine mutation along TM 4 converts the OSCA1.2 channel into a phospholipid scramblase with spontaneous phospholipid permeability. All error bars represent standard error of the mean (SEM) calculated from replicate images or independent patches.
-
Figure 4—source data 1
Results from the lysine mutations on TM 4 of OSCA1.2.
- https://cdn.elifesciences.org/articles/96957/elife-96957-fig4-data1-v1.xlsx
Figure 4—figure supplement 1
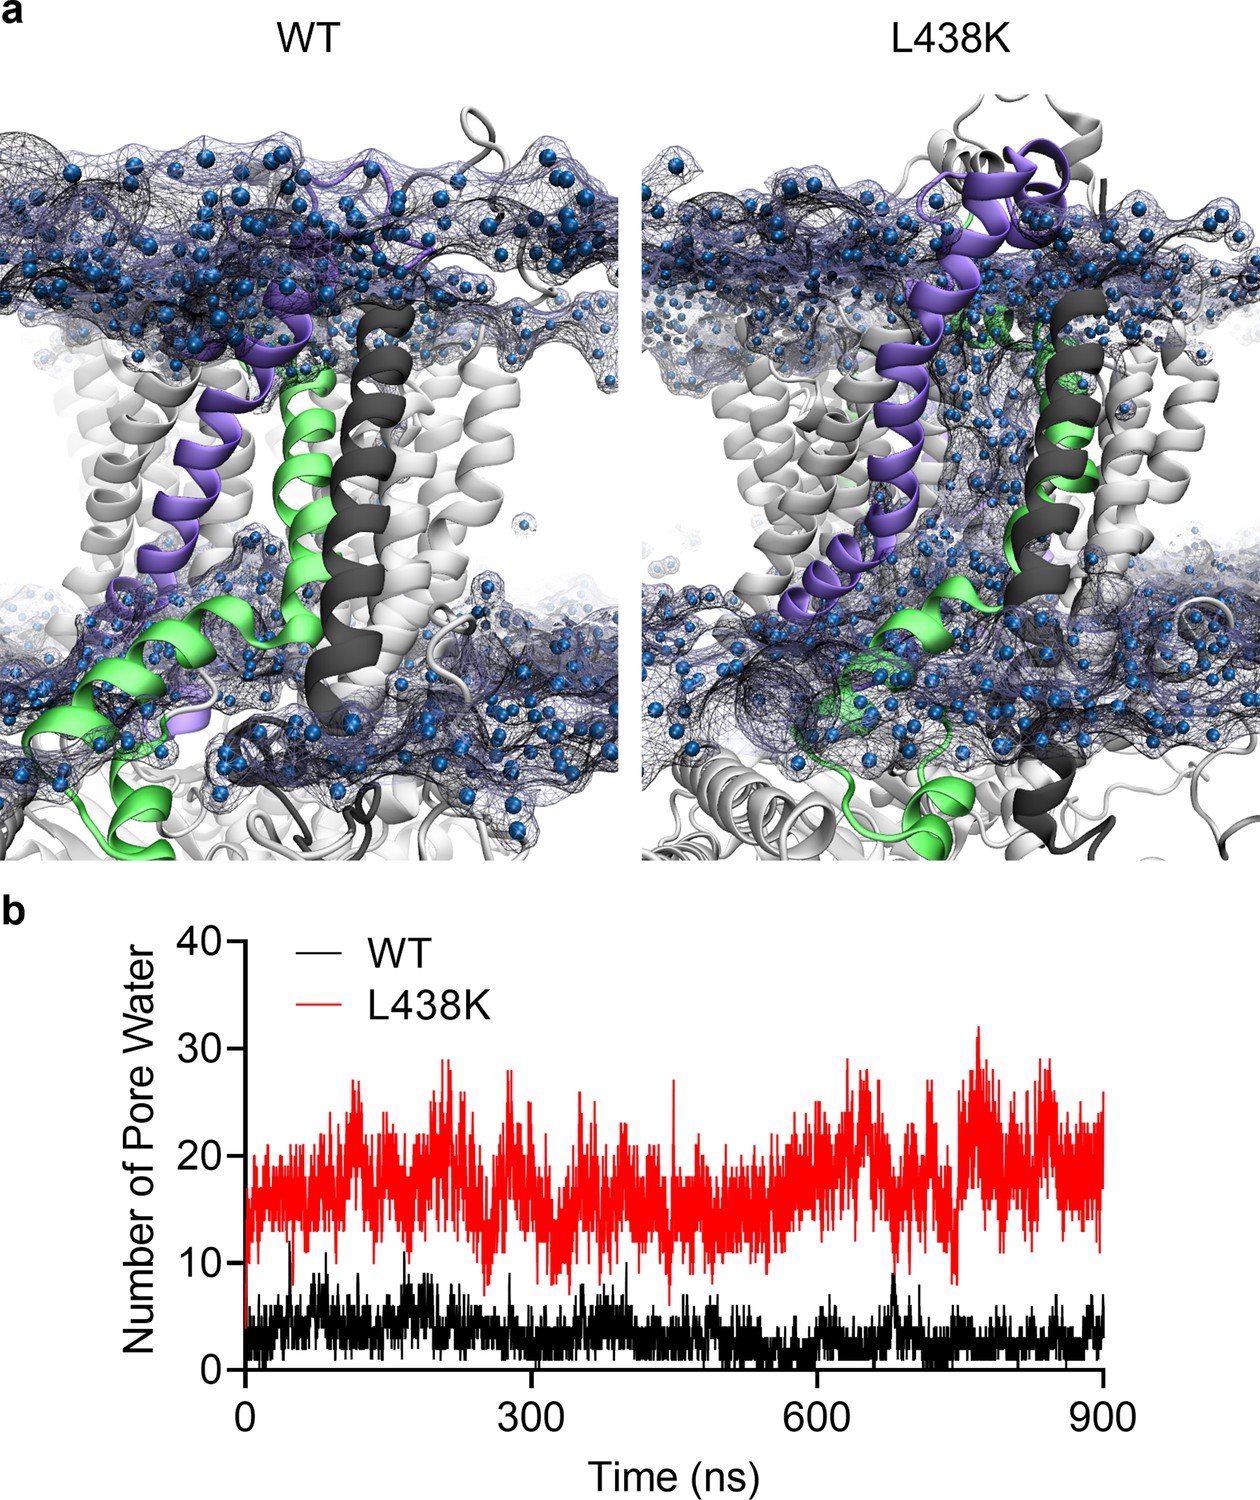
Atomistic molecular dynamics (MD) simulations of OSCA1.2 wildtype (WT) and L438K exhibit differential hydration of the pore region.
(a) Representative timepoints (900 ns) for OSCA1.2 WT (left) and L438K (right). (b) Quantification of water occupancy in the pore region for WT (black) and L438K (red) over the duration of the simulation (Figure 4—figure supplement 1—source data 1). The pore region was defined as within 7 Å of I432, which is centrally positioned in the upper pore.
-
Figure 4—figure supplement 1—source data 1
Results from molecular dynamics (MD) simulation of OSCA1.2.
- https://cdn.elifesciences.org/articles/96957/elife-96957-fig4-figsupp1-data1-v1.xlsx
Figure 4—figure supplement 2
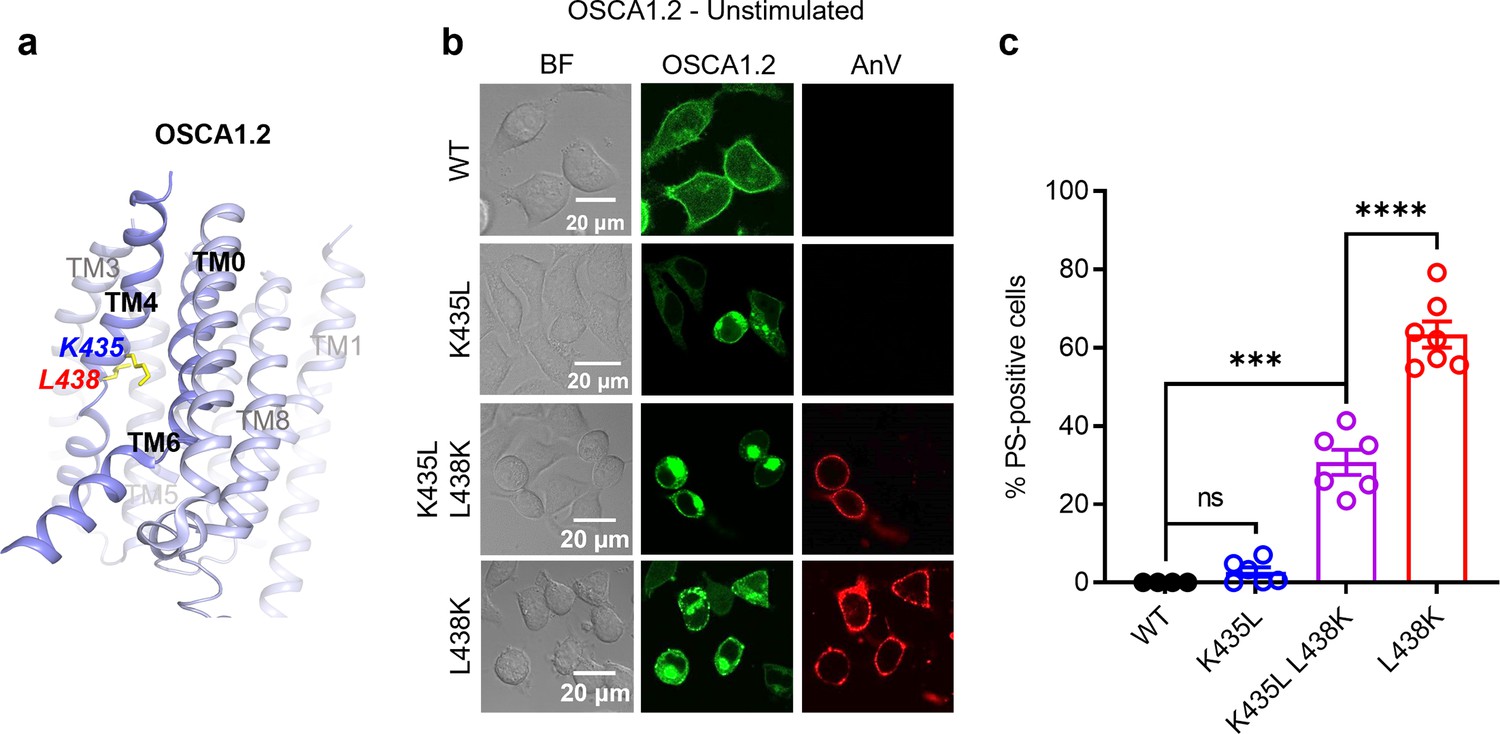
Role of K435 in OSCA1.2 mutant phospholipid permeability.
(a) TM 4 mutant locations mapped onto the TM 4/6 interface of OSCA1.2 (PDB 6MGV) with key residues shown as yellow sticks. (b) Representative images of TMEM16F knockout (KO) HEK293T cells expressing eGFP-tagged OSCA1.2 wildtype (WT), K435L, K435L/L438K, or L438K mutants (center column). CF 594-conjugated Annexin V (AnV) (right column) labeled phosphatidylserine (PS) exposing cells. BF denotes bright field images (left column). (c) Quantification of the percentage of cells with AnV labeling for OSCA1.2 WT (n = 4), K435L (n = 6), K435L/L438K (n = 6), and L438K-transfected cells (n = 7) (Figure 4—figure supplement 2—source data 1). Statistical comparisons were conducted with unpaired t-tests with Welch’s correction (ns: p > 0.05, ***p < 0.001, ****p < 0.0001). Error bars represent standard error of the mean (SEM) calculated from replicate images.
-
Figure 4—figure supplement 2—source data 1
Results from OSCA1.2 K435 and L438 mutations.
- https://cdn.elifesciences.org/articles/96957/elife-96957-fig4-figsupp2-data1-v1.xlsx
Figure 4—figure supplement 3
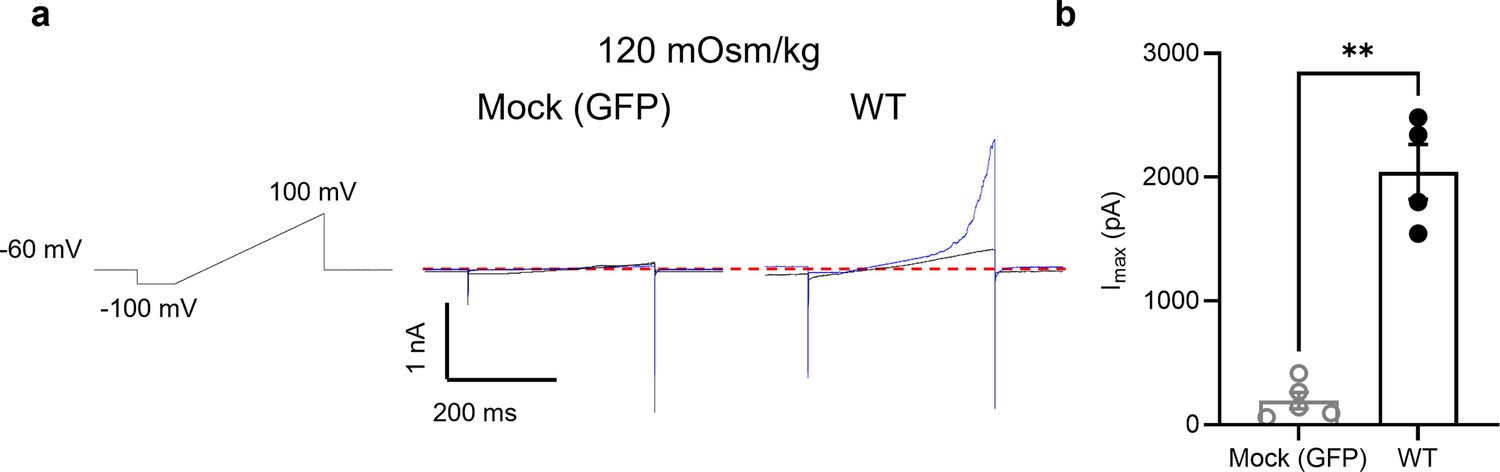
Hypotonic stimulation activates the OSCA1.2 ion channel.
(a) Representative current recordings elicited by the voltage protocol shown for mock (GFP) and OSCA1.2 wildtype (WT)-transfected cells before (black) and after (blue) reduction of bath osmolarity from 310 to 120 mOsm/kg. (b) Quantification of peak currents from (a) for mock (n = 5) and WT (n = 4) after reduction of bath osmolarity (Figure 4—figure supplement 2—source data 1). Statistical comparison was conducted with an unpaired t-test with Welch’s correction (**p < 0.01). Error bars represent standard error of the mean (SEM) calculated from independent patches.
-
Figure 4—figure supplement 3—source data 1
Results from hypotonic stimulation of OSCA1.2.
- https://cdn.elifesciences.org/articles/96957/elife-96957-fig4-figsupp3-data1-v1.xlsx
Figure 5
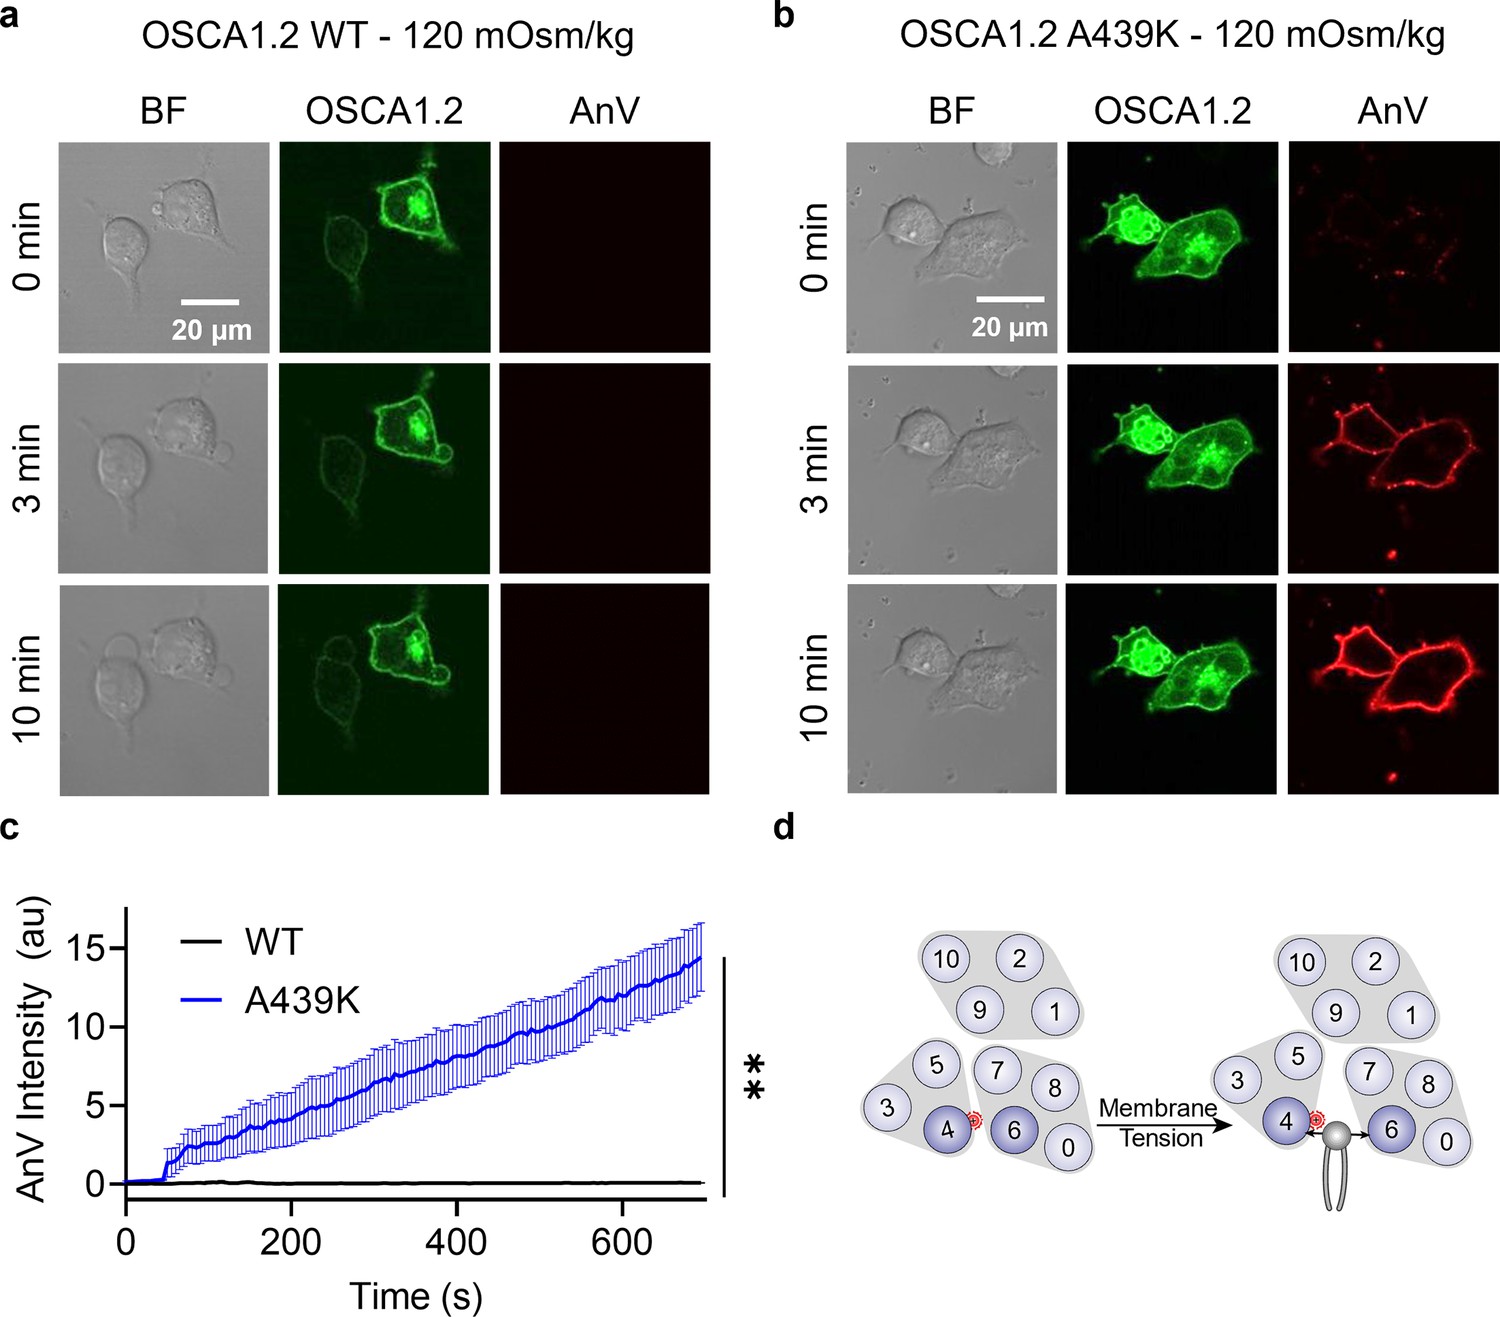
OSCA1.2 A439K is an osmolarity-activated scramblase.
Representative images of hypotonic osmolarity stimulation of TMEM16F knockout (KO) HEK293T cells expressing eGFP-tagged OSCA1.2 (a) wildtype (WT) or (b) the A439K mutant (center columns). CF 594-conjugated Annexin V (AnV) (right columns) labeled phosphatidylserine (PS) exposing cells. BF denotes bright field images (left columns). Each row of representative images corresponds to the indicated time after hypo-osmotic stimulation. (c) Quantification of AnV intensity for OSCA1.2 WT (n = 5) and A439K (n = 5) after hypo-osmotic stimulation (Figure 5—source data 1). Statistical comparison was conducted with an unpaired t-test with Welch’s correction (**p < 0.01). (d) The A439K mutation converts OSCA1.2 to an osmolarity-activated phospholipid scramblase. Error bars represent standard error of the mean (SEM).
-
Figure 5—source data 1
Results from osmolarity activation of OSCA1.2 A439K scramblase.
- https://cdn.elifesciences.org/articles/96957/elife-96957-fig5-data1-v1.xlsx
Figure 6 with 1 supplement
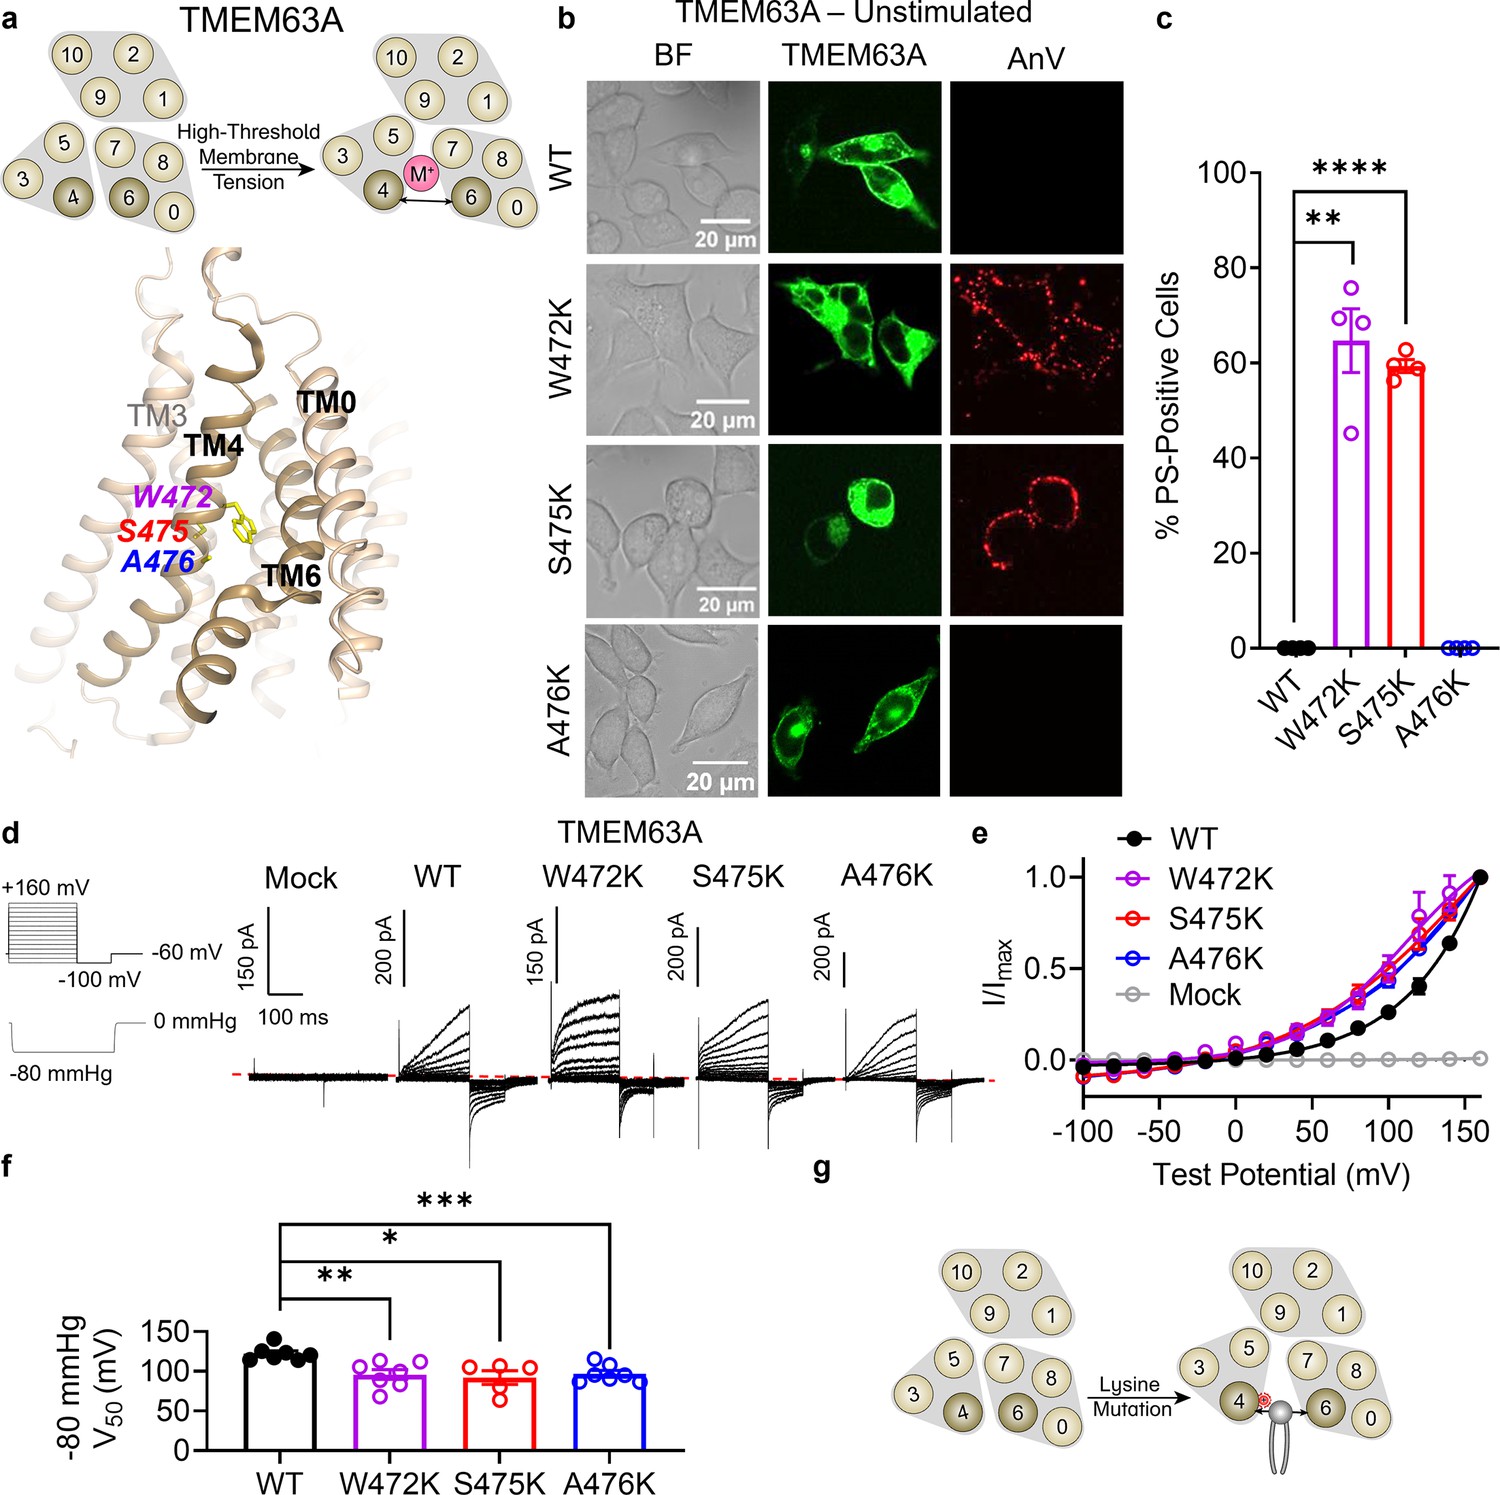
Lysine mutations along TM 4 enable TMEM63A channel and scramblase activities.
(a) Top: TMEM63A is an ion channel gated by high-threshold membrane tension. Bottom: the TM 4/6 interface of HsTMEM63A (PDB 8GRS) with key residues shown as yellow sticks using amino acid numbering corresponding to the mouse ortholog. (b) Representative images of TMEM16F knockout (KO) HEK293T cells expressing eGFP-tagged TMEM63A wildtype (WT), W472K, S475K, and A476K (center column). CF 594-conjugated Annexin V (AnV) (right column) labeled phosphatidylserine (PS) exposing cells. BF denotes bright field images (left column). (c) Quantification of the percentage of cells with AnV labeling for TMEM63A WT (n = 4), W472K (n = 4), S475K (n = 4), and A476K-transfected cells (n = 4) (Figure 6—source data 1). Statistical comparisons were conducted with unpaired t-tests with Welch’s correction (**p < 0.01, ****p < 0.0001). (d) Representative current recordings and (e) normalized conductance–voltage (I–V) relationships of cell-attached patches from TMEM16F KO HEK293T cells expressing either eGFP mock-transfected (n = 7) or eGFP-tagged TMEM63A WT (n = 7), W472K (n = 7), S475K (n = 5), or A476K (n = 7) (Figure 6—source data 1). Currents represent the subtraction of voltage alone from currents elicited by the voltage and pressure protocols shown. Dotted line denotes zero current. Note that the mock control was normalized to the mean maximal current elicited from WT-transfected cells. (f) Quantification of half-maximal voltage at −80 mmHg for WT (122 mV), W472K (96 mV), S475K (92 mV), and A476K (97 mV) (Figure 6—source data 1). Statistical comparison was conducted with unpaired t-tests with Welch’s correction (*p < 0.05, **p < 0.01, ***p < 0.001). (g) Lysine mutations along TM 4 in TMEM63A enable spontaneous phospholipid permeability. All error bars represent standard error of the mean (SEM) calculated from replicate images or independent patches.
-
Figure 6—source data 1
Results from the lysine mutations on TM 4 of TMEM63A.
- https://cdn.elifesciences.org/articles/96957/elife-96957-fig6-data1-v1.xlsx
Figure 6—figure supplement 1
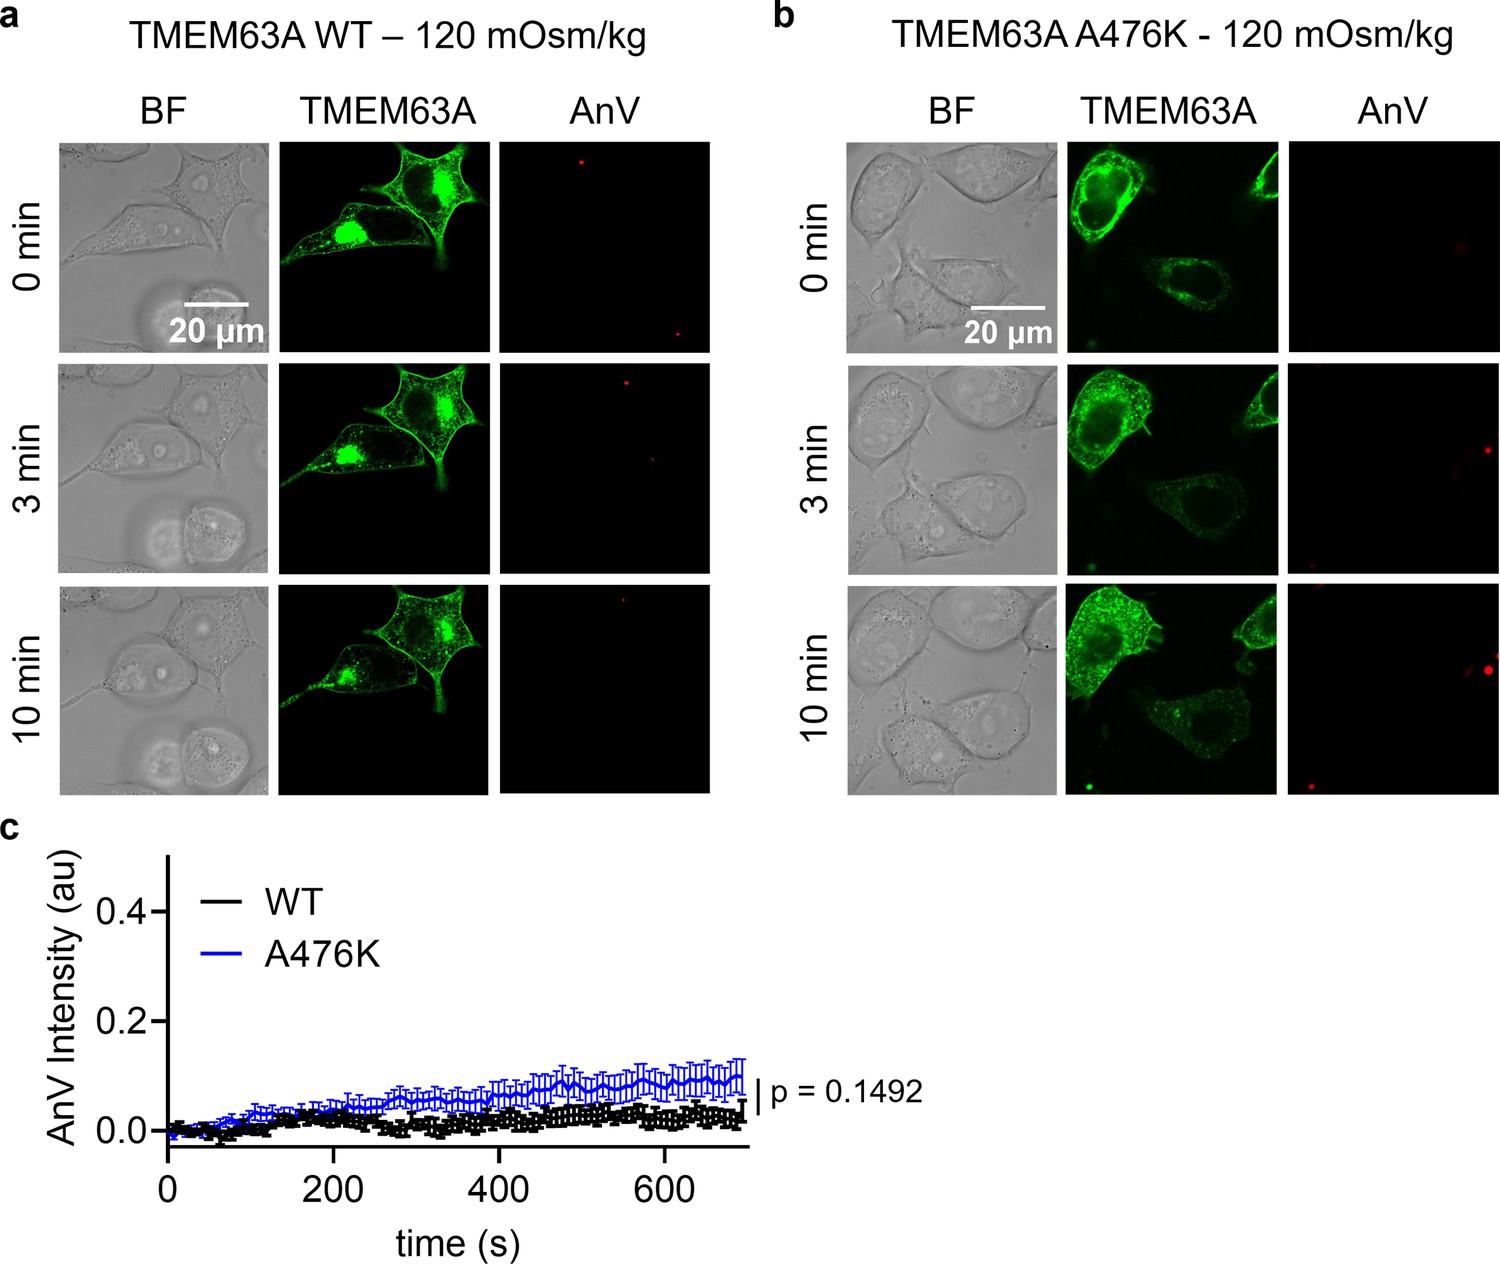
TMEM63A hypotonic stimulation.
Representative images of hypotonic osmolarity stimulation of TMEM16F knockout (KO) HEK293T cells expressing eGFP-tagged TMEM63A (a) wildtype (WT) or (b) the A476K mutant (middle columns). CF 594-conjugated Annexin V (AnV) (right columns) labeled phosphatidylserine (PS) exposing cells. BF denotes bright field images (left columns). Each row of representative images corresponds to the indicated time after hypo-osmotic stimulation. (c) Quantification of AnV intensity for TMEM63A WT (n = 3) and A476K (n = 5) after hypo-osmotic stimulation (Figure 6—figure supplement 1—source data 1). Statistical comparison was conducted with an unpaired t-test with Welch’s correction. Error bars represent standard error of the mean (SEM).
-
Figure 6—figure supplement 1—source data 1
Results from TMEM63A hypotonic stimulation.
- https://cdn.elifesciences.org/articles/96957/elife-96957-fig6-figsupp1-data1-v1.xlsx
Author response image 1

Representative inside-out currents for mock (GFP)- and OSCA1.
2 WT-transfected cells. OSCA1.2 is responsible for nA currents elicited by the pressure and voltage protocols shown.
Author response image 2

Voltage-dependent rectification of OSCA1.2 current.
a. Representative OSCA1.2 trace (bottom) elicited by a voltage-ramp under -50 mmHg (top). b. The difference in inward and outward current amplitudes.
Author response image 3

Trans-bilayer lipid flipping rates (kflip) accelerate with increasing side chain hydropathy for a residue placed in the center of a model transmembrane helical peptide.
Author response image 4

Model of gating (and regulatory) mechanisms in the TMEM16 family.
(B) Overall architecture and proposed modules. (C) Pore-dilation gating model for CaCCs. (D) Clamshell gating model for CaPLSases.
Author response image 5

200 µM Gd3+ext fails to inhibit OSCA1.2 currents in cell-attached patches.
Pressure-elicited peak currents (n=6 each). Statistical test is an unpaired Student’s t-test.
Author response image 6
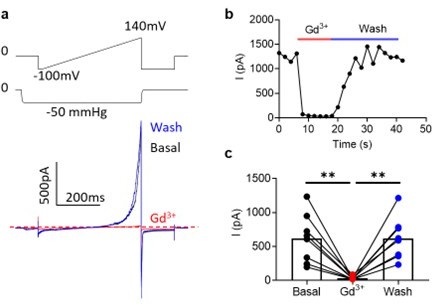
200 µM Gd3+int completely inhibits OSCA1.2 currents in inside-out patches.
(a) Representative traces in before (black), during (red), and after (blue) Gd3+ application. (b) Representative application timecourse. (c) Quantification of peak currents (n=8 each). Statistical test is one-way ANOVA.
Author response image 7

AnV intensities of WT- and A439K-transfected cells after 10 minutes of hypotonic stimulation at the listed osmolarities.
Tables
Key resources table
| Reagent type (species) or resource | Designation | Source or reference | Identifiers | Additional information |
|---|---|---|---|---|
| Gene (Mus musculus) | MmTMEM16F | NCBI | NP_780553.2 | Contains a three amino acid N-terminal truncation (MQM) |
| Gene (M. musculus) | MmTMEM16A | NCBI | NP_001229278 | |
| Gene (Arabidopsis thaliana) | AtOSCA1.2 | GeneBank | AIU34614.1 | |
| Gene (M. musculus) | MmTMEM63A | NCBI | NP_001404481.1 | |
| Commercial assay or kit | In-Fusion Snap Assembly | Takara | 638947 | |
| Recombinant DNA reagent | peGFP-N1 | Addgene: Vector Database—pEGFP-N1 | ||
| Recombinant DNA reagent | peGFP-N1_MmTMEM16F | Le et al., 2019a | ||
| Recombinant DNA reagent | peGFP-N1_MmTMEM16A | Le et al., 2019c | ||
| Recombinant DNA reagent | peGFP-N1_AtOSCA1_2 | This paper | Subcloned with In-fusion (IF) primers | |
| Recombinant DNA reagent | peGFP-N1_MmTMEM63A | This paper | Subcloned with In-fusion (IF) primers | |
| Sequence-based reagent | eGFP-N1_678–679_F | This paper | PCR primers | ATGGTGAGCAAGGGCGAGG |
| Sequence-based reagent | eGFP-N1_678–679_R | This paper | PCR primers | GGTGGCGACCGGTGGATCC |
| Sequence-based reagent | IFpeGFP-N1_OSCA1_2-eGFP_F | This paper | PCR primers | CCACCGGTCGCCACCATGGC GACACTTCAGGAT |
| Sequence-based reagent | IFpeGFP-N1_OSCA1_2-eGFP_R | This paper | PCR primers | GCCCTTGCTCACCATGACTAG TTTACCACTAAAGGGC |
| Sequence-based reagent | IFpeGFP-N1_MmTMEM63A-eGFP_F | This paper | PCR primers | CCACCGGTCGCCACCATGACC AGCTCCCCGTTCC |
| Sequence-based reagent | IFpeGFP-N1_MmTMEM63A-eGFP_R | This paper | PCR primers | GCCCTTGCTCACCATGGATTC CTGGTAGGCATAAGC |
| Sequence-based reagent | MmTMEM16F_I521K_F | This paper | PCR primers | TTCATCATCAAGATG ATCCTCAACACG |
| Sequence-based reagent | MmTMEM16F_I521K_R | This paper | PCR primers | GAGGATCATCTTGA TGATGAAGCTGATG |
| Sequence-based reagent | MmTMEM16F_I521A_F | This paper | PCR primers | CTTCATCATCGCC ATGATCCTCAACAC |
| Sequence-based reagent | MmTMEM16F_I521A_R | This paper | PCR primers | GAGGATCATGGCG ATGATGAAGCTG |
| Sequence-based reagent | MmTMEM16F_I521E_F | This paper | PCR primers | TCATCATCGAGATGATCCTCAACACG |
| Sequence-based reagent | MmTMEM16F_I521E_R | This paper | PCR primers | TGAGGATCATCTCGATGATGAAGCTG |
| Sequence-based reagent | MmTMEM16F_M522K_F | This paper | PCR primers | ATCATCATCAAGATCCTCAACACG |
| Sequence-based reagent | MmTMEM16F_M522K_R | This paper | PCR primers | TGAGGATCTTGATGATGATGAAGC |
| Sequence-based reagent | MmTMEM16F_T526K_F | This paper | PCR primers | TCCTCAACAAGATCTACGAGAAGGTGG |
| Sequence-based reagent | MmTMEM16F_T526K_R | This paper | PCR primers | CTCGTAGATCTTGTTGAGGATCATGATG |
| Sequence-based reagent | MmTMEM16F_I611K_F | This paper | PCR primers | GCTGACGAAGATCATGGGGGGA |
| Sequence-based reagent | MmTMEM16F_I611K_R | This paper | PCR primers | CCCCCATGATCTTCGTCAGCTGTG |
| Sequence-based reagent | MmTMEM16A_I546K_F | This paper | PCR primers | CGTGGTCAAGATTCTGCTGGATGAAG |
| Sequence-based reagent | MmTMEM16A_I546K_R | This paper | PCR primers | CCAGCAGAATCTTGACCACGAGGT |
| Sequence-based reagent | MmTMEM16A_I547K_F | This paper | PCR primers | TGGTCATCAAGCTGCTGGATGAAG |
| Sequence-based reagent | MmTMEM16A_I547K_R | This paper | PCR primers | TCCAGCAGCTTGATGACCACGAG |
| Sequence-based reagent | MmTMEM16A_E551K_F | This paper | PCR primers | TCTGCTGGATAAGGTTTACGGCTGC |
| Sequence-based reagent | MmTMEM16A_E551K_R | This paper | PCR primers | GCCGTAAACCTTATCCAGCAGAATGATG |
| Sequence-based reagent | AtOSCA1_2_K435L_F | This paper | PCR primers | TTGCACTGCTGCTTTTCCTCGC |
| Sequence-based reagent | AtOSCA1_2_K435L_R | This paper | PCR primers | GAGGAAAAGCAGCAGTGCAATACCC |
| Sequence-based reagent | AtOSCA1_2_K435L_L438K_F | This paper | PCR primers | ATTGCACTGCTGCTTTTCAAGGCC |
| Sequence-based reagent | AtOSCA1_2_K435L_L438K_R | This paper | PCR primers | CTTGAAAAGCAGCAGTGCAATACCCG |
| Sequence-based reagent | AtOSCA1_2_L438K_F | This paper | PCR primers | AAGCTTTTCAAGGCC TTTCTGCCATC |
| Sequence-based reagent | AtOSCA1_2_L438K_R | This paper | PCR primers | CAGAAAGGCCTTGA AAAGCTTCAGTGC |
| Sequence-based reagent | AtOSCA1_2_A439K_F | This paper | PCR primers | GCTTTTCCTCAAGT TTCTGCCATCC |
| Sequence-based reagent | AtOSCA1_2_A439K_R | This paper | PCR primers | GGCAGAAACTTGAGGAAAAGCTTCAG |
| Sequence-based reagent | MmTMEM63A_W472K_F | This paper | PCR primers | CTCCTGCTGAAGTCCTTCTCTGCG |
| Sequence-based reagent | MmTMEM63A_W472K_R | This paper | PCR primers | AGAGAAGGACTTCAGCAGGAGTGTGG |
| Sequence-based reagent | MmTMEM63A_S475K_F | This paper | PCR primers | GGTCCTTCAAGGCGCTGCTTCCG |
| Sequence-based reagent | MmTMEM63A_S475K_R | This paper | PCR primers | AAGCAGCGCCTTGAAGGACCACAGC |
| Sequence-based reagent | MmTMEM63A_A476K_F | This paper | PCR primers | TCCTTCTCTAAGCT GCTTCCGTCCA |
| Sequence-based reagent | MmTMEM63A_A476K_R | This paper | PCR primers | CGGAAGCAGCTT AGAGAAGGACCAC |
| Cell line (Homo sapiens) | TMEM16F KO HEK293T | Le et al., 2019b | ||
| Peptide, recombinant protein | AnnexinV-594 | Biotium | #29011 | |
| Chemical compound, drug | Ani9 | Sigma-Aldrich | SML1813 | |
| Software, algorithm | Scrambling assay | https://github.com/yanghuanghe/scrambling_activity, copy archived at Huanghe, 2020 |
Additional files
Download links
A two-part list of links to download the article, or parts of the article, in various formats.
Downloads (link to download the article as PDF)
Open citations (links to open the citations from this article in various online reference manager services)
Cite this article (links to download the citations from this article in formats compatible with various reference manager tools)
TMEM16 and OSCA/TMEM63 proteins share a conserved potential to permeate ions and phospholipids
eLife 13:RP96957.
https://doi.org/10.7554/eLife.96957.3


