Inhibition of ULK1/2 and KRASG12C controls tumor growth in preclinical models of lung cancer
- Department of Oncological Sciences, University of Utah, United States
- Huntsman Cancer Institute, University of Utah, United States
- Department of Genetics, The University of Texas MD Anderson Cancer Center, United States
- Deciphera Pharmaceuticals, United States
- Department of Pathology, University of Utah, United States
- Department of Internal Medicine, Division of Medical Oncology, University of Utah, United States
- Department of Dermatology, University of Utah, United States
Figures
Figure 1 with 2 supplements
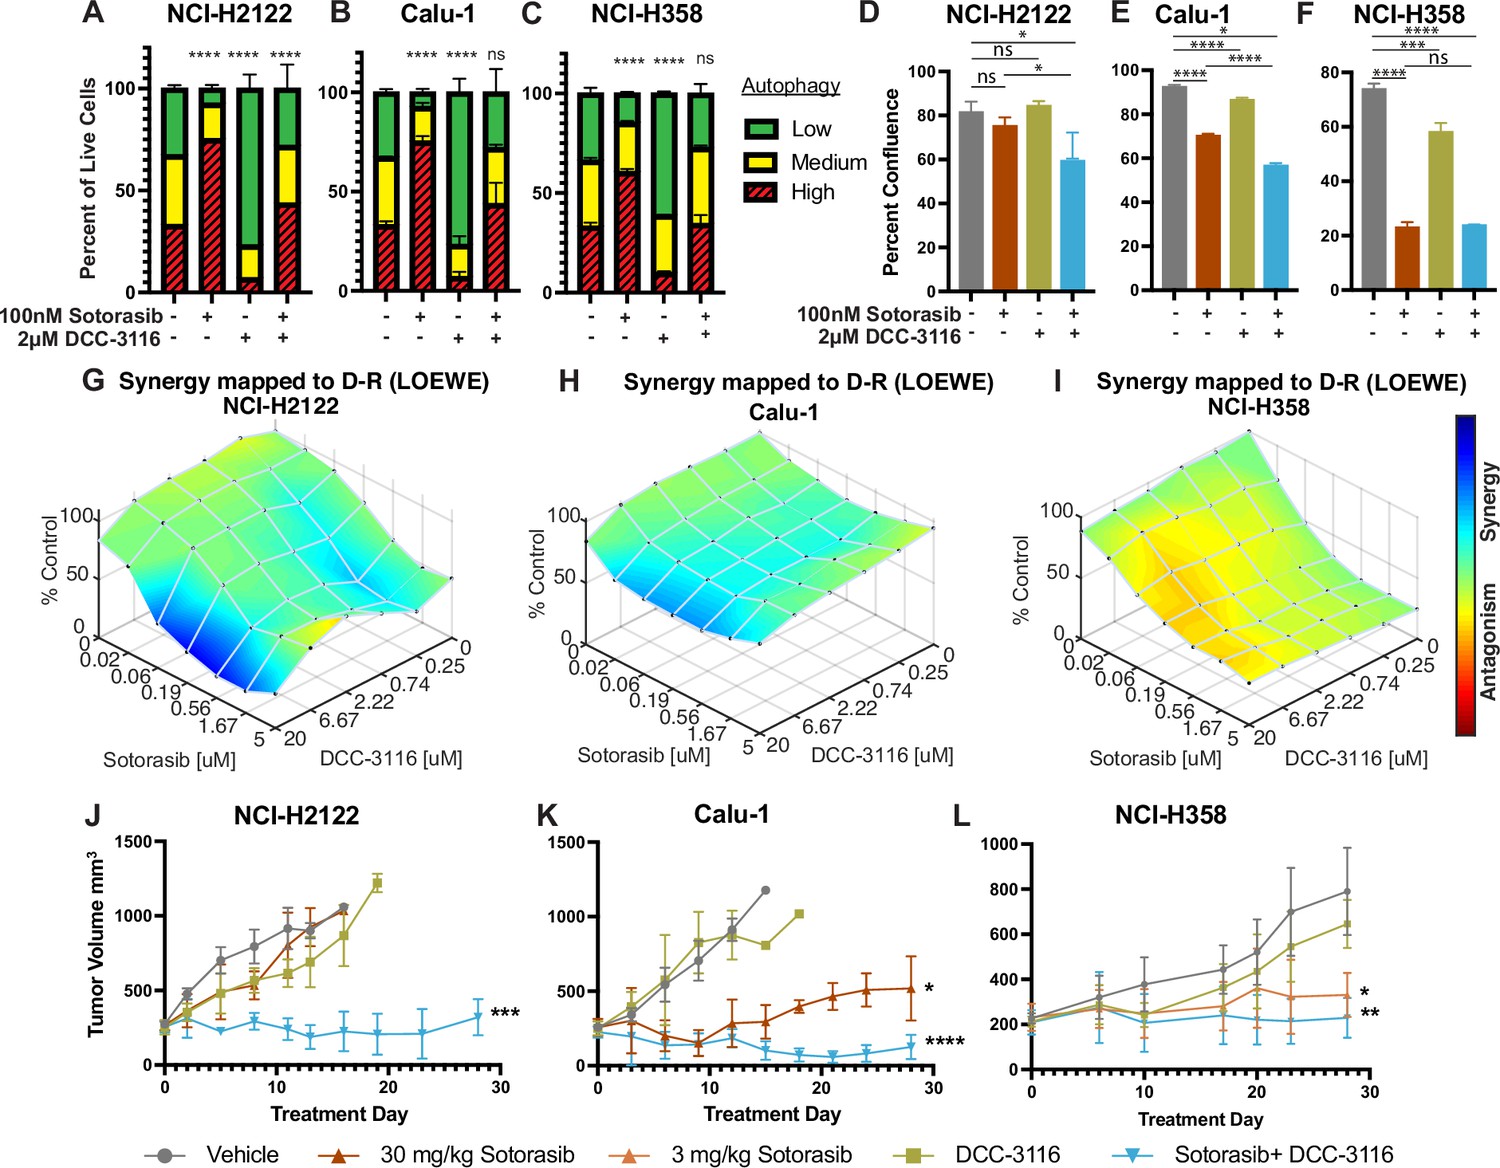
Human KRASG12C-driven lung cancer cells are sensitive to co-inhibition of KRASG12C and ULK1/2.
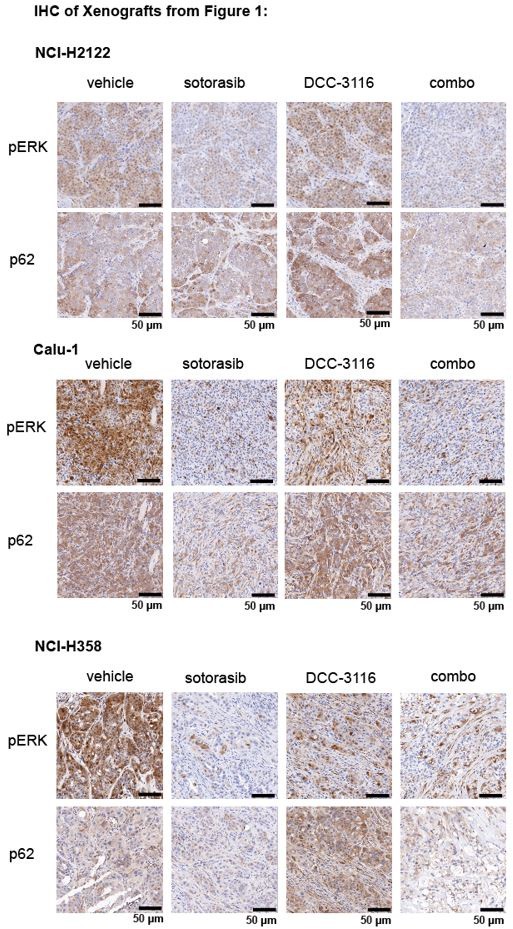
(A–C) Human KRASG12C-driven cell lines NCI-H2122 (A), Calu-1 (B), and NCI-H358 (C) increase autophagy as assessed by mCherry-EGFP-LC3 reporter after 48 hr of sotorasib treatment and decrease autophagy after 48 hr of DCC-3116 treatment. Red = high autophagy, yellow = medium autophagy, green = low autophagy. Statistical significance was determined by comparing autophagy levels to DMSO control, and an ordinary one-way ANOVA with Dunnett’s multiple comparisons was used. Ns = not significant, *p<0.05, **p<0.01, ***p<0.001, ****p<0.0001. N = 9 biological replicates. (D–F) Quantification of percent confluence of human KRASG12C-driven cell lines at 72 hr post-drug treatment. Statistical significance was determined by an ordinary one-way ANOVA. Ns = not significant, *p<0.05, **p<0.01, ***p<0.001, ****p<0.0001. N = 3 biological replicates. (G–I) In vitro synergy assay of human KRASG12C-driven cell lines using the Loewe method after 72 hr of treatment. N = 3 biological replicates. (J–L) Tumor volume measured over 28 days of treatment in mice inoculated with NCI-H2122 (J), Calu-1 (K), and NCI-H358 (L) cells. Vehicle and sotorasib were administered once daily via oral gavage and DCC-3116 was formulated in the chow. Statistical significance was determined by an ordinary one-way ANOVA compared to vehicle-treated tumors. Ns = not significant, *p<0.05, **p<0.01, ***p<0.001, ****p<0.0001. N = 4–5 mice per treatment.
-
Figure 1—source data 1
Uncropped and labeled gels for Figure 1.
- https://cdn.elifesciences.org/articles/96992/elife-96992-fig1-data1-v1.zip
-
Figure 1—source data 2
Raw unedited gels for Figure 1.
- https://cdn.elifesciences.org/articles/96992/elife-96992-fig1-data2-v1.zip
Figure 1—figure supplement 1
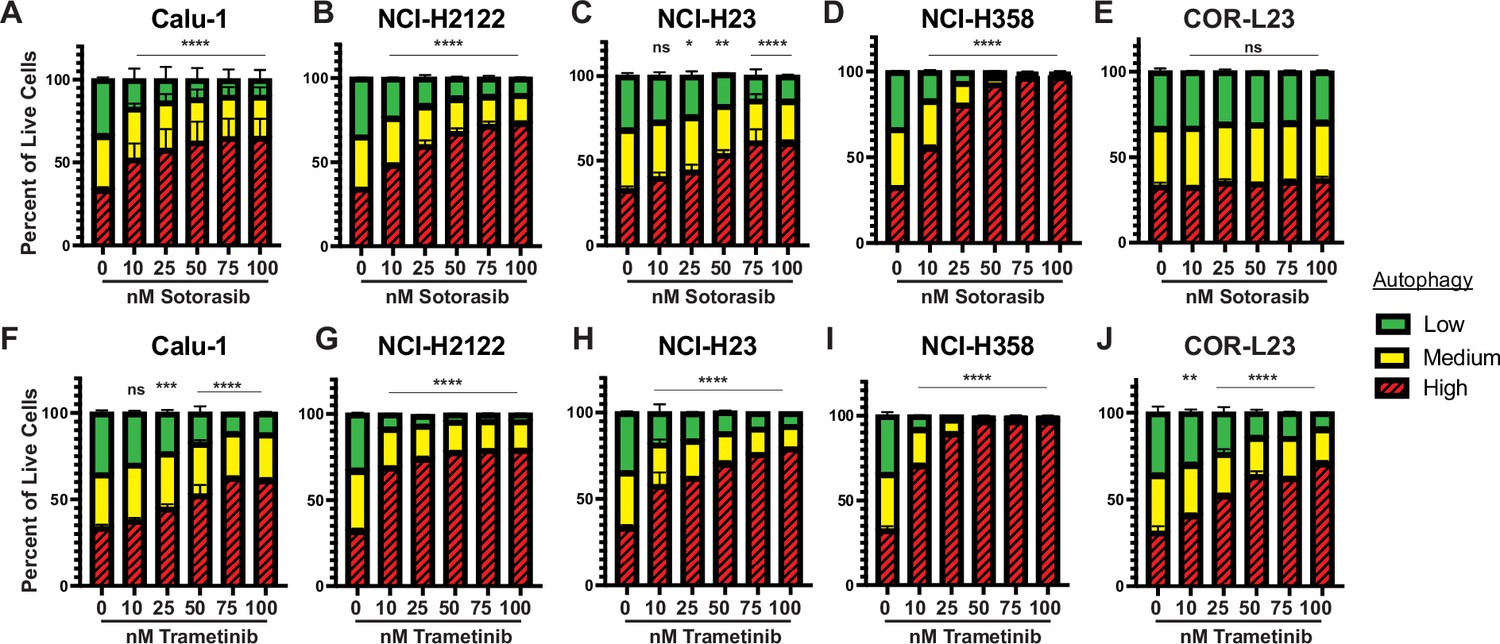
Human KRAS-driven lung cancer cells increase autophagy after KRASG12C or MEK inhibition.
(A–E) Autophagy levels in human KRASG12C-driven lung cancer cells Calu-1 (A), NCI-H2122 (B), NCI-H23 (C), NCI-H358 (D), and the KRASG12V-driven human lung cancer cell line Cor-L23 (E) after 48 hr of sotorasib at indicated concentrations with the fluorescent autophagy reporter (FAR). Red = high autophagy, yellow = medium autophagy, green = low autophagy. Statistical significance was determined by comparing autophagy levels to DMSO control, and an ordinary one-way ANOVA with Dunnett’s multiple comparisons was used. ns = not significant, *p<0.05, **p<0.01, ***p<0.001, ****p<0.0001. N = 9. (F–J) Autophagy levels in human KRASG12C-driven lung cancer cells Calu-1 (F), NCI-H2122 (G), NCI-H23 (H), NCI-H358 (I), and the KRASG12V-driven human lung cancer cell line Cor-L23 (J) after 48 hr of trametinib at indicated concentrations with the FAR. Red = high autophagy, yellow = medium autophagy, green = low autophagy. Statistical significance was determined by comparing autophagy levels to DMSO control, and an ordinary one-way ANOVA with Dunnett’s multiple comparisons was used. ns = not significant, *p<0.05, **p<0.01, ***p<0.001, ****p<0.0001. N = 9.
-
Figure 1—figure supplement 1—source data 1
Uncropped and labeled gels for Figure 1—figure supplement 1.
- https://cdn.elifesciences.org/articles/96992/elife-96992-fig1-figsupp1-data1-v1.zip
-
Figure 1—figure supplement 1—source data 2
Raw unedited gels for Figure 1—figure supplement 1.
- https://cdn.elifesciences.org/articles/96992/elife-96992-fig1-figsupp1-data2-v1.zip
Figure 1—figure supplement 2
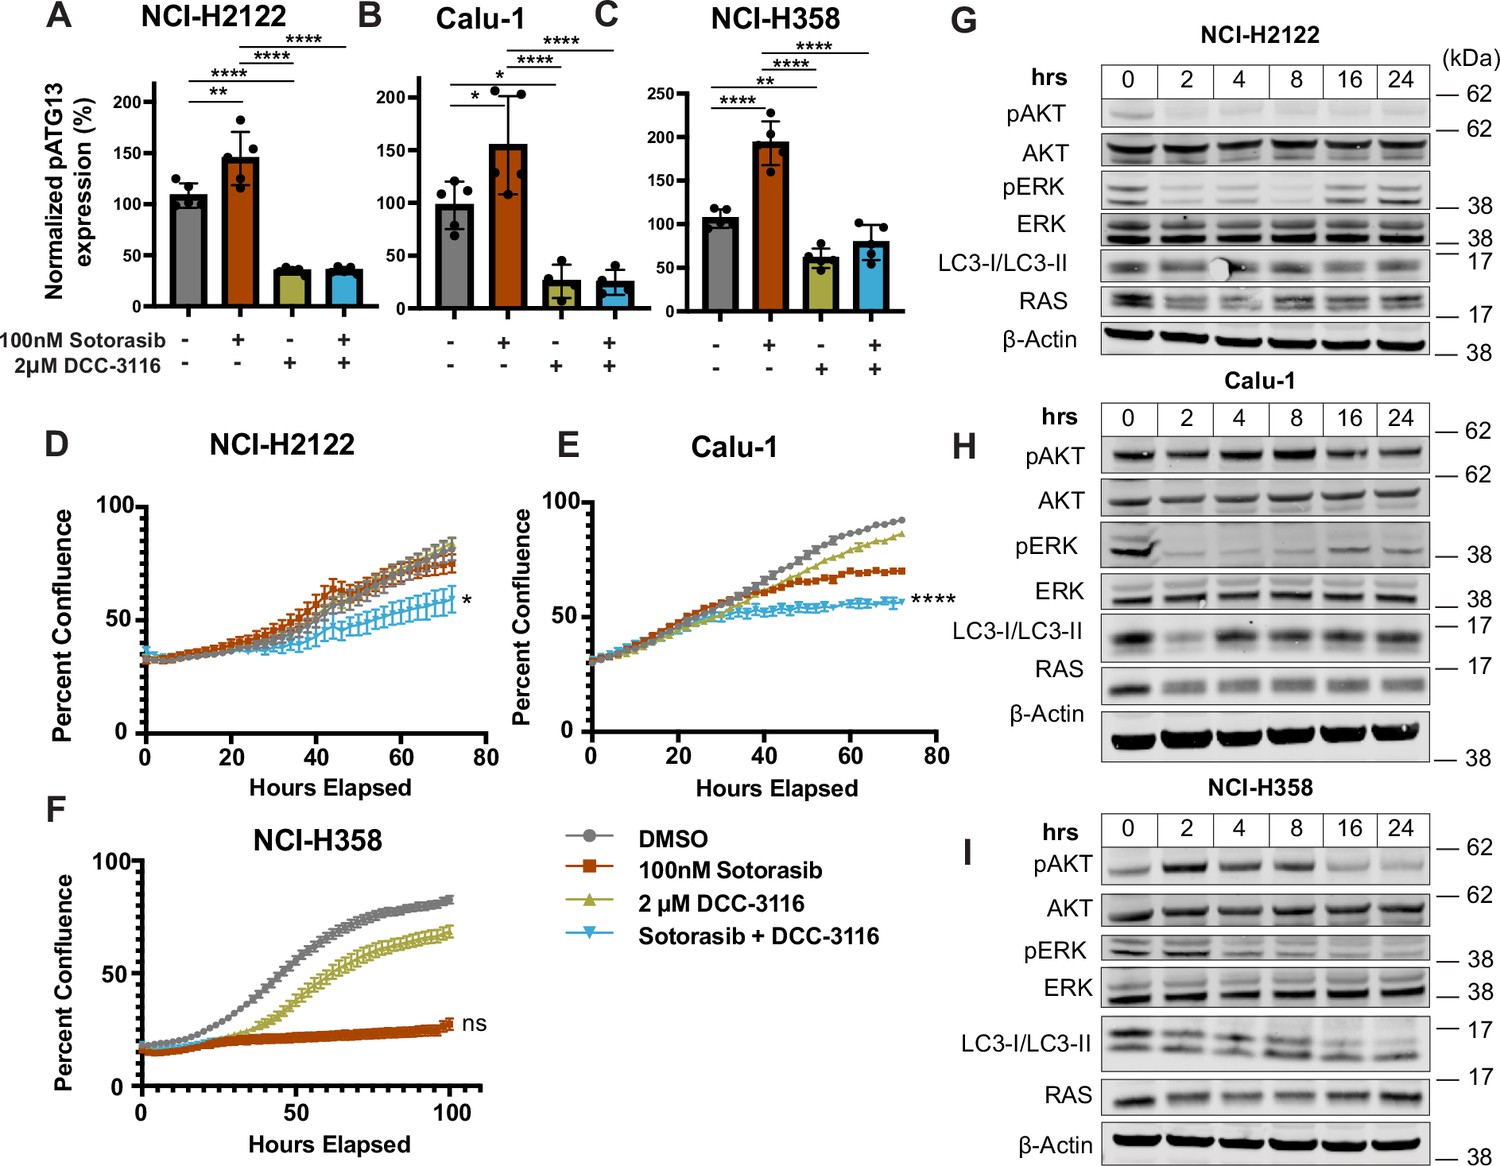
Human KRASG12C-driven lung cancer cell lines increase autophagy and decrease cellular proliferation after sotorasib treatment.
(A–C) ELISA measurement of pS318-ATG13 signal after 16 hr of drug treatment in NCI-H2122 (A), Calu-1 (B), and NCI-H358 cell lines (C). N = 3. Statistical analysis was performed using an ordinary one-way ANOVA with Tukey’s multiple comparisons test. ns = not significant, *p<0.05, ****p<0.0001. (D–F) Percent confluence over time of NCI-H2122 (D), Calu-1 (E), and NCI-H358 (F) cell lines treated with indicated compounds over time. Statistical analysis was performed using an ordinary one-way ANOVA with Tukey’s multiple comparisons test. ns = not significant, *p<0.05, **p<0.01, ***p<0.001, ****p<0.0001. N = 3–5. (G–I) Immunoblotting analysis of NCI- H2122 (G), Calu-1 (H), and NCI-H358 (I) cell lines after 100 nM sotorasib treatment over 24 hr.
Figure 2
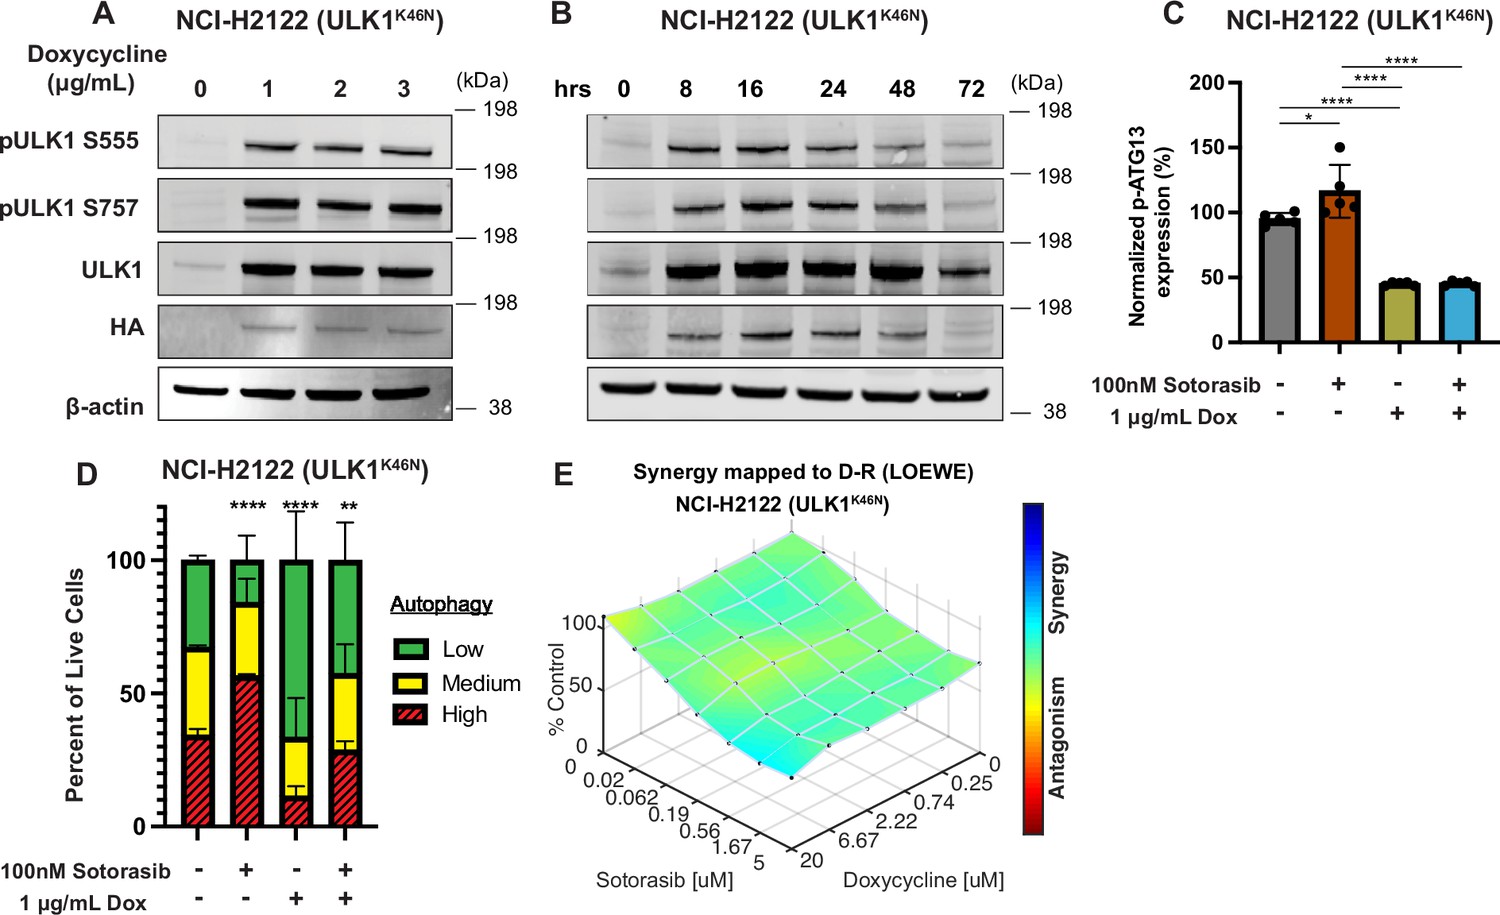
Genetic inhibition of ULK1 decreases autophagy and cooperates with sotorasib to reduce cell viability.
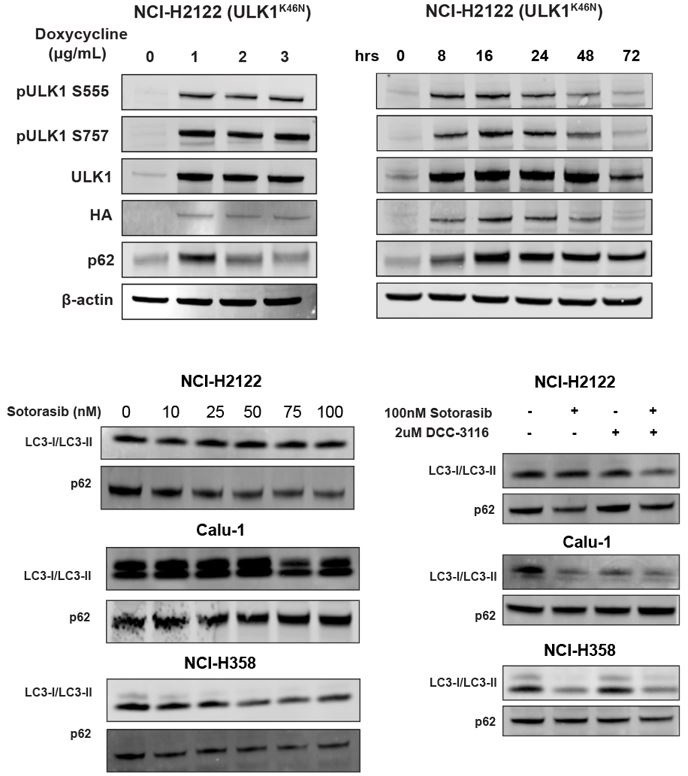
(A) Immunoblot of NCI-H2122:ULK1K46N cells after 24 hr of doxycycline treatment. (B) Immunoblot of NCI-H2122:ULK1K46N cells treated with 1 ug/mL doxycycline over time (hours). (C) ELISA of pS318-ATG13 expression after 16 hr of doxycycline treatment. Statistical significance was determined by an ordinary one-way ANOVA. Ns = not significant, *p<0.05, **p<0.01, ***p<0.001, ****p<0.0001. N = 3 biological replicates. (D) NCI-H2122:ULK1K46N cells were engineered to express the mCherry-EGFP-LC3 reporter, and a decrease in autophagy was demonstrated after 48 hr of doxycycline treatment. N = 3. All statistical significance was measured using an ordinary one-way ANOVA with Dunnett’s multiple comparisons test. *p<0.05, **p<0.01, ***p<0.001, ****p<0.0001. (E) In vitro synergy assay of NCI-H2122:ULK1K46N cells treated with DMSO control, sotorasib, and/or doxycycline over 48 hr using the Loewe method. N = 3 biological replicates.
© 2024, BioRender Inc. Figure 2C was created using BioRender, and is published under a CC BY-NC-ND 4.0. Further reproductions must adhere to the terms of this license
-
Figure 2—source data 1
Uncropped and labelled gels for Figure 2.
- https://cdn.elifesciences.org/articles/96992/elife-96992-fig2-data1-v1.zip
-
Figure 2—source data 2
Raw unedited gels for Figure 2.
- https://cdn.elifesciences.org/articles/96992/elife-96992-fig2-data2-v1.zip
Figure 3 with 1 supplement
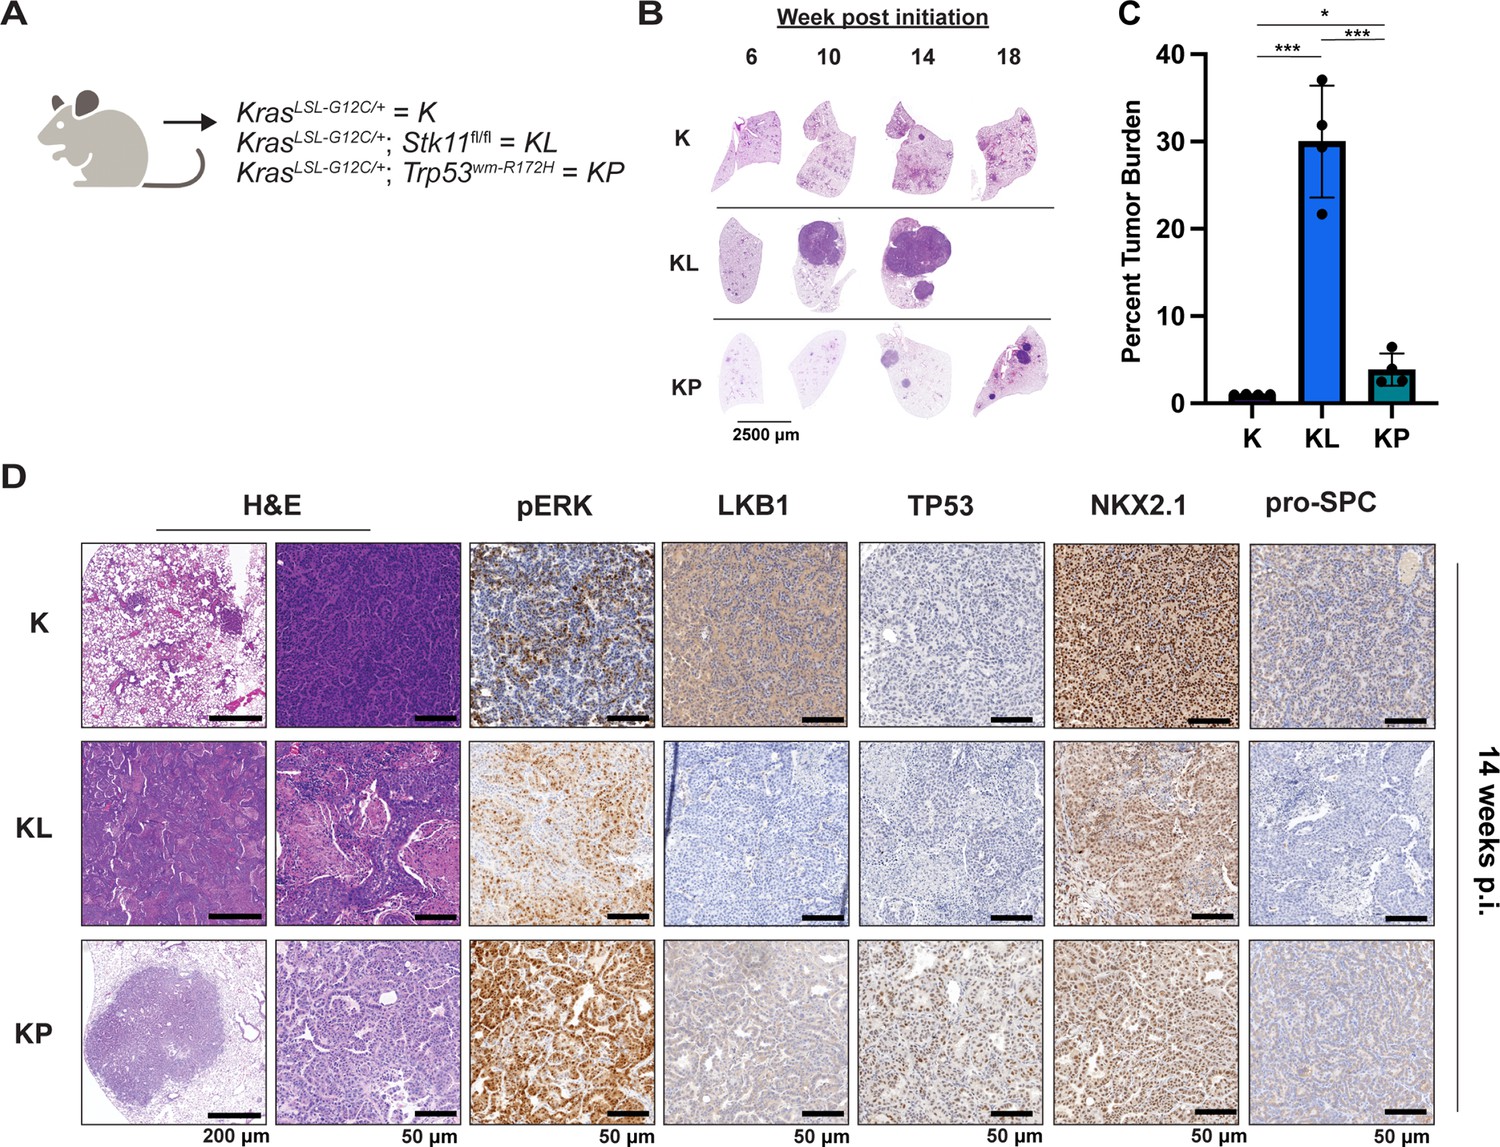
Either LKB1 silencing or expression of dominant-negative TP53R172H cooperates with KRASG12C in genetically engineered mouse (GEM) models of lung cancer.
(A) Schematic of genotypes of GEM models and abbreviations. Panel (A) was created with BioRender.com and published using a CC BY-NC-ND license with permission. (B) Representative images of lung lobes from GEM models at indicated time points post-initiation of lung tumorigenesis. (C) Quantification of lung tumor burdens from GEM models 14 weeks post-initiation of tumorigenesis. Statistical analysis was performed using an ordinary one-way ANOVA. Ns = not significant, *p<0.05, **p<0.01, ***p<0.001, ****p<0.0001. N = 4 mice. (D) Hematoxylin and eosin (H&E) and immunohistochemical analysis of representative lung sections from GEM models 14 weeks post-initiation of tumorigenesis. p.i. = post-initiation.
© 2024, BioRender Inc. Figure 3 panel A - created with BioRender.com, and published using a CC BY-NC-ND license with permission
Figure 3—figure supplement 1
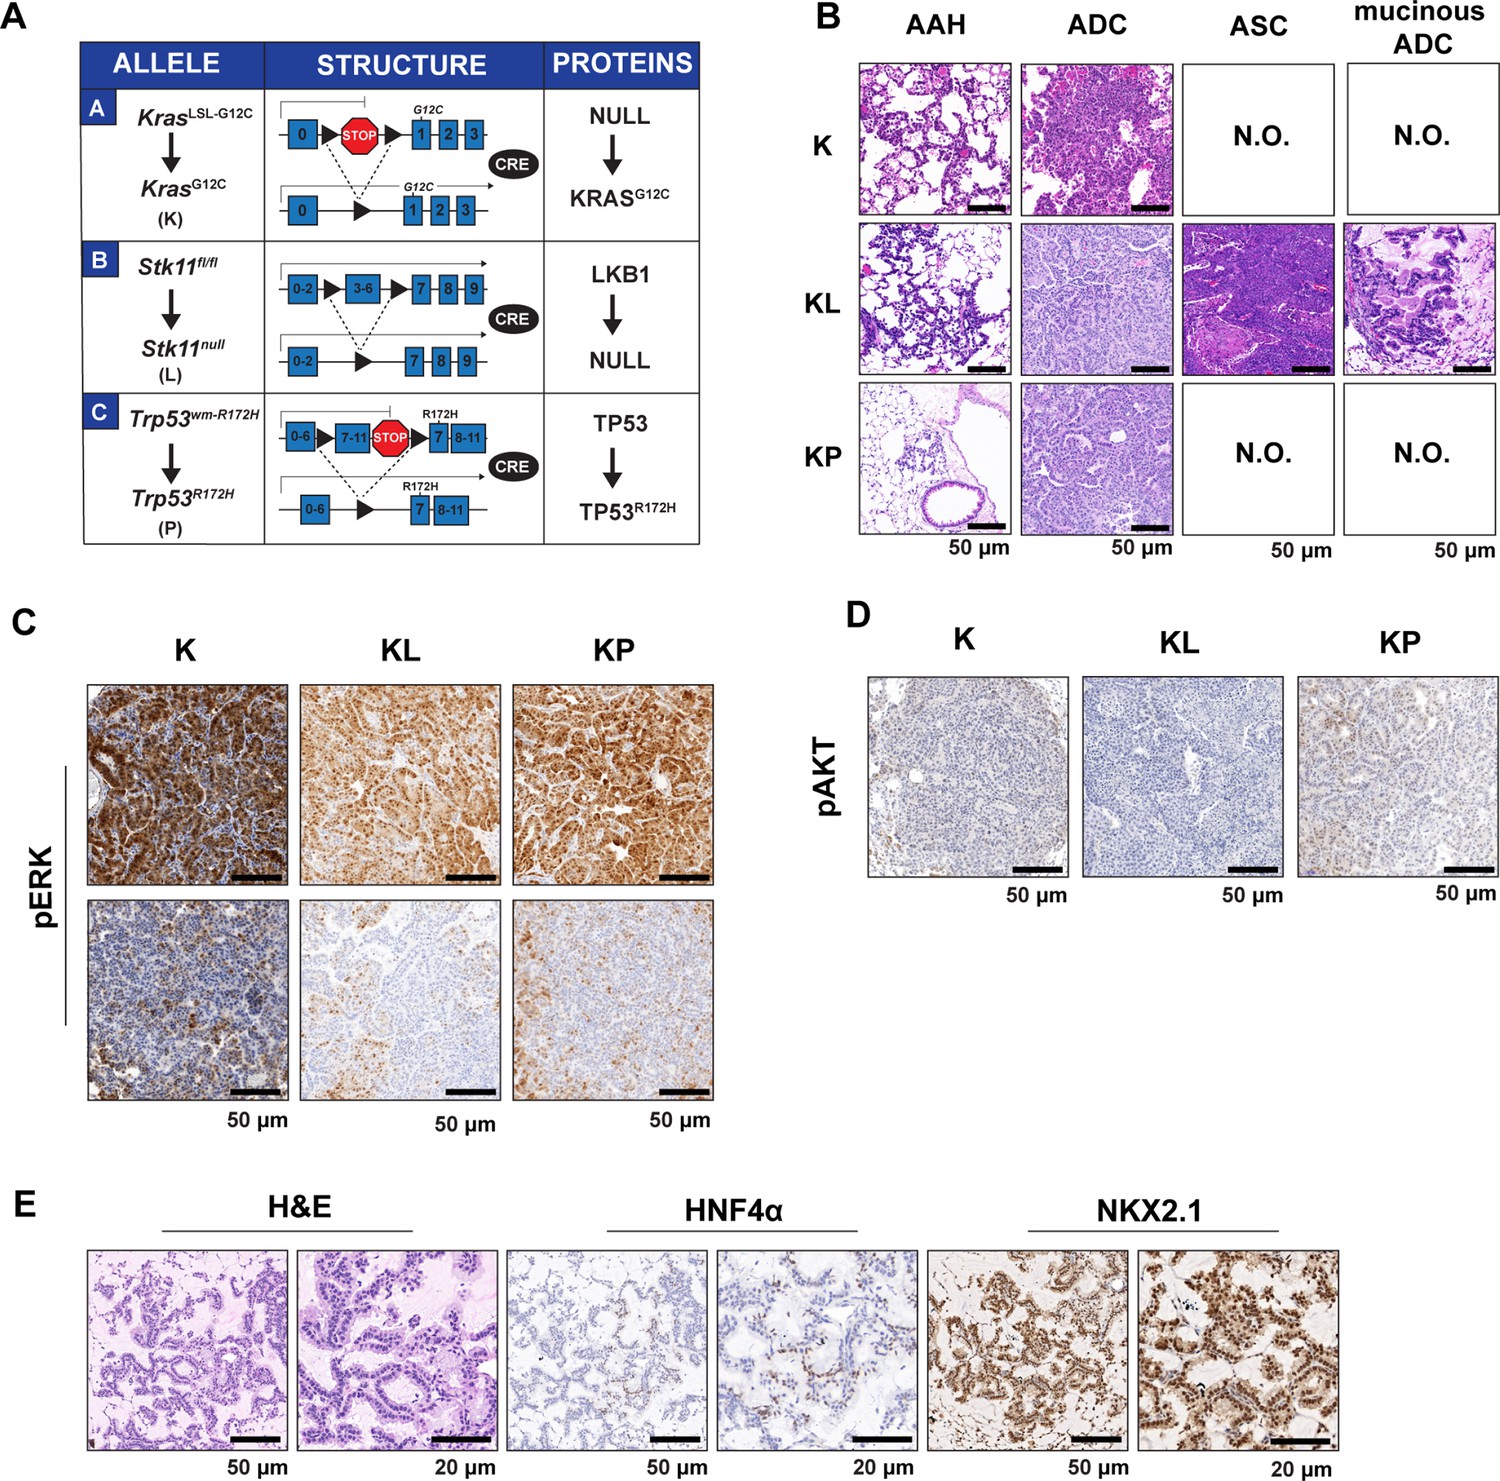
Loss of LKB1 expression leads to mixed adenosquamous cell carcinoma (ASC) and mucinous adenocarcinoma (ADC) lung tumors in KRASG12C-driven genetically engineered mouse (GEM) models.
(A) Schematic of allele, structure, and protein changes in GEM models used. (B) Representative hematoxylin and eosin (H&E) stains of K, KL, and KP GEM models 14 weeks post-initiation. N.O. = not observed, AAH = atypical adenomatous hyperplasia, mucinous ADC = mucinous adenocarcinoma. (C, D) Representative immunohistochemical stains of pERK1/2 (C) and pAKT1-3 (D) signal in K, KL, and KP GEM models. (E) Representative images of staining and immunohistochemistry of indicated proteins in KL mice.
Figure 4 with 1 supplement
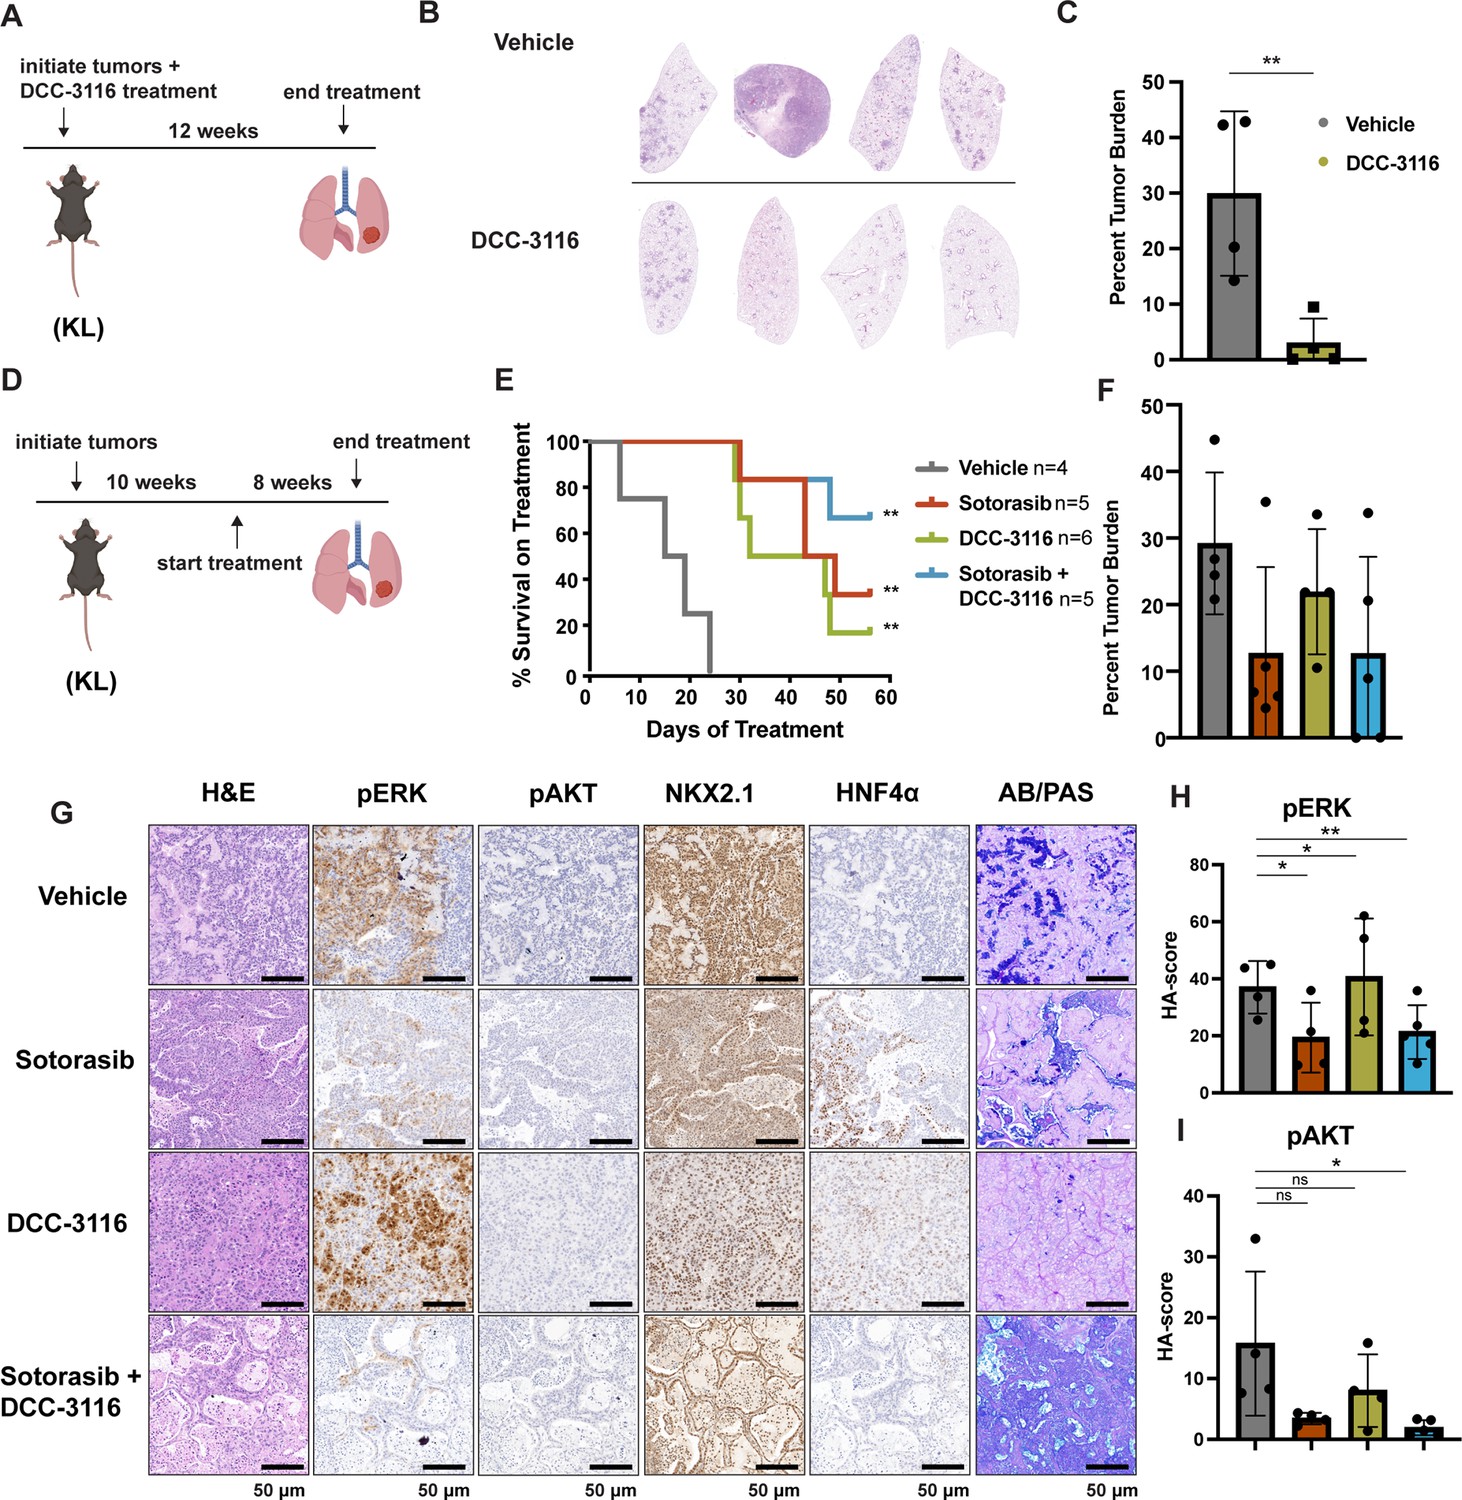
Combined inhibition of KRASG12C and ULK1/2 decreases tumor initiation and increases survival in KL genetically engineered mouse (GEM) models.
(A) Schematic of lung tumor prevention dosing strategy of KL GEMs. Panel (A) was created with BioRender.com and published using a CC BY-NC-ND license with permission. DCC-3116 was administered in drug-formulated chow. N = 4–6 mice. (B) Representative images of lung lobes from GEM models 12 weeks post-initiation of tumorigenesis and DCC-3116 treatment. (C) Quantification of tumor burden of (B). Statistical analysis was measured by an unpaired Student’s t-test. Ns = not significant, *p<0.05, **p<0.01, ***p<0.001, ****p<0.0001. N = 4 mice. (D) Schematic of treating tumor-bearing KL mice with vehicle control, 30 mg/kg sotorasib, chow containing DCC-3116 or the combination. Panel (D) was created with BioRender.com and published using a CC BY-NC-ND license with permission. DCC-3116 was administered in drug-formulated chow (Key resources table). Mice were treated daily for 56 days or until termination criteria were reached, whichever was reached first. N = 4–6 mice. (E) Kaplan–Meier survival curve of survival on treatment of KL mice treated as indicated. Statistical analysis was performed using a log-rank test. **p<0.01, N = 4–6 mice. (F) Quantification of tumor burden of (E). (G) H&E analysis of representative lung sections from KL mice after treatment. AB/PAS = Alcian Blue Periodic Acid Schiff, for staining mucins. (H, I) Quantification of immunohistochemical staining of treated mice pERK (H) and pAKT (I) as described in ‘Materials and methods’. Statistical analysis was measured with an ordinary one-way ANOVA. *p<0.05, **p<0.01, ns = not significant. N = 4–5 mice.
© 2024, BioRender Inc. Figure 4 panel A and D- created with BioRender.com, and published using a CC BY-NC-ND license with permission
Figure 4—figure supplement 1
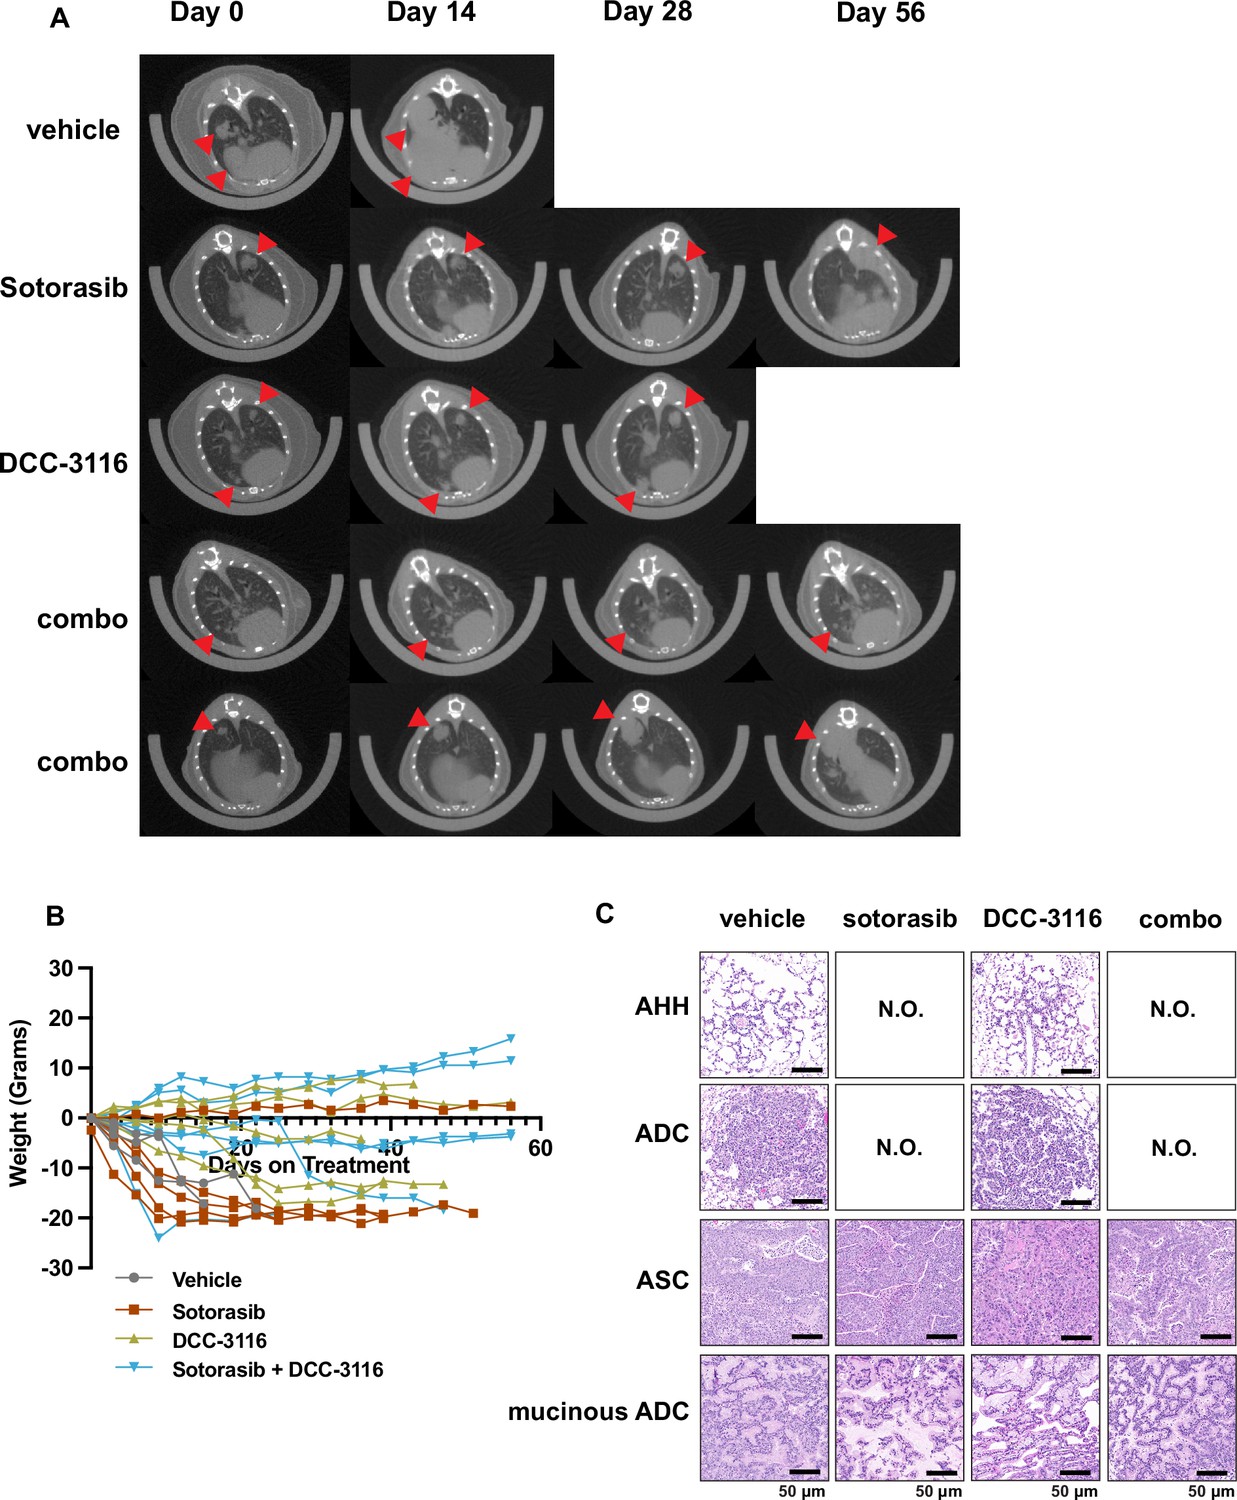
MicroCT, body weight, and pathological analysis of treated KL mice.
(A) Representative microCT images of KL mice pre-treatment (day 0) and 14 days, 28 days, and 56 days post-treatment. Vehicle-treated mice and most DCC-3116-treated mice reached termination criteria before the 56-day endpoint. Red arrows indicate lung tumors. (B) Percent change in the body weight of mice over the course of the treatment period. Each line depicts an individual mouse. (C) Representative images of hematoxylin and eosin staining of lung sections of KL mice at the end of treatment. N.O. = not observed, AH = alveolar hyperplasia, ADC = adenocarcinoma, ASC = adenosquamous cell carcinoma, mucinous ADC = mucinous adenocarcinoma.
Figure 5 with 1 supplement
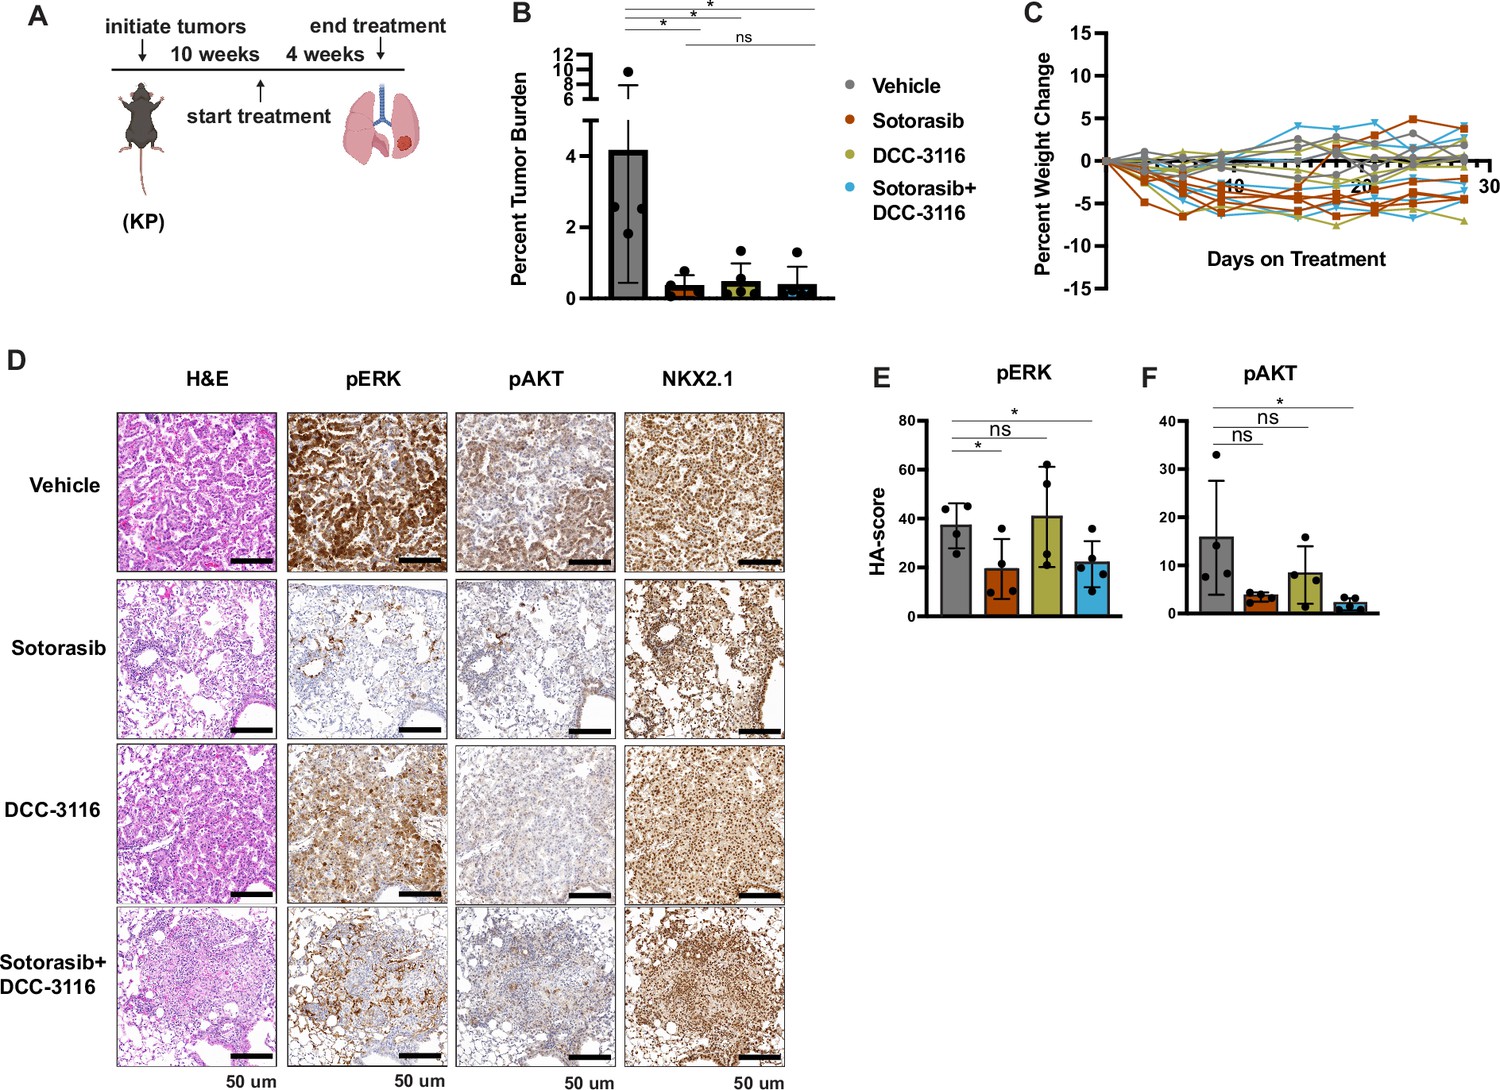
Inhibition of KRASG12C and ULK1/2 reduces tumor burden in a KP genetically engineered mouse (GEM) model.
(A) Schematic of the treatment of KP GEM models. Panel (A) was created with BioRender.com and published using a CC BY-NC-ND license with permission. Mice were administered vehicle control or 30 mg/kg sotorasib once daily via oral gavage. DCC-3116 was administered in drug-formulated chow. N = 4–5 mice. (B) Quantification of tumor burden of mice after 4 weeks of treatment. Statistical analysis was performed using an ordinary one-way ANOVA. *p<0.05, ns = not significant. N = 4–5 mice. (C) Percent change in the body weight of mice on treatment over 4 weeks. Each line depicts an individual mouse. (D) Representative images of histological analysis of lung lobes from KP mice 4 weeks after treatment. (E, F) Quantification of immunohistochemical staining of treated mice pERK1/2 (E) and pAKT1-3 (F) as described in ‘Materials and methods’. Statistical analysis was performed using an ordinary one-way ANOVA. *p<0.05, **p<0.01. ns = not significant. N = 4–5 mice.
© 2024, BioRender Inc. Figure 5 panel A - created with BioRender.com, and published using a CC BY-NC-ND license with permission
Figure 5—figure supplement 1
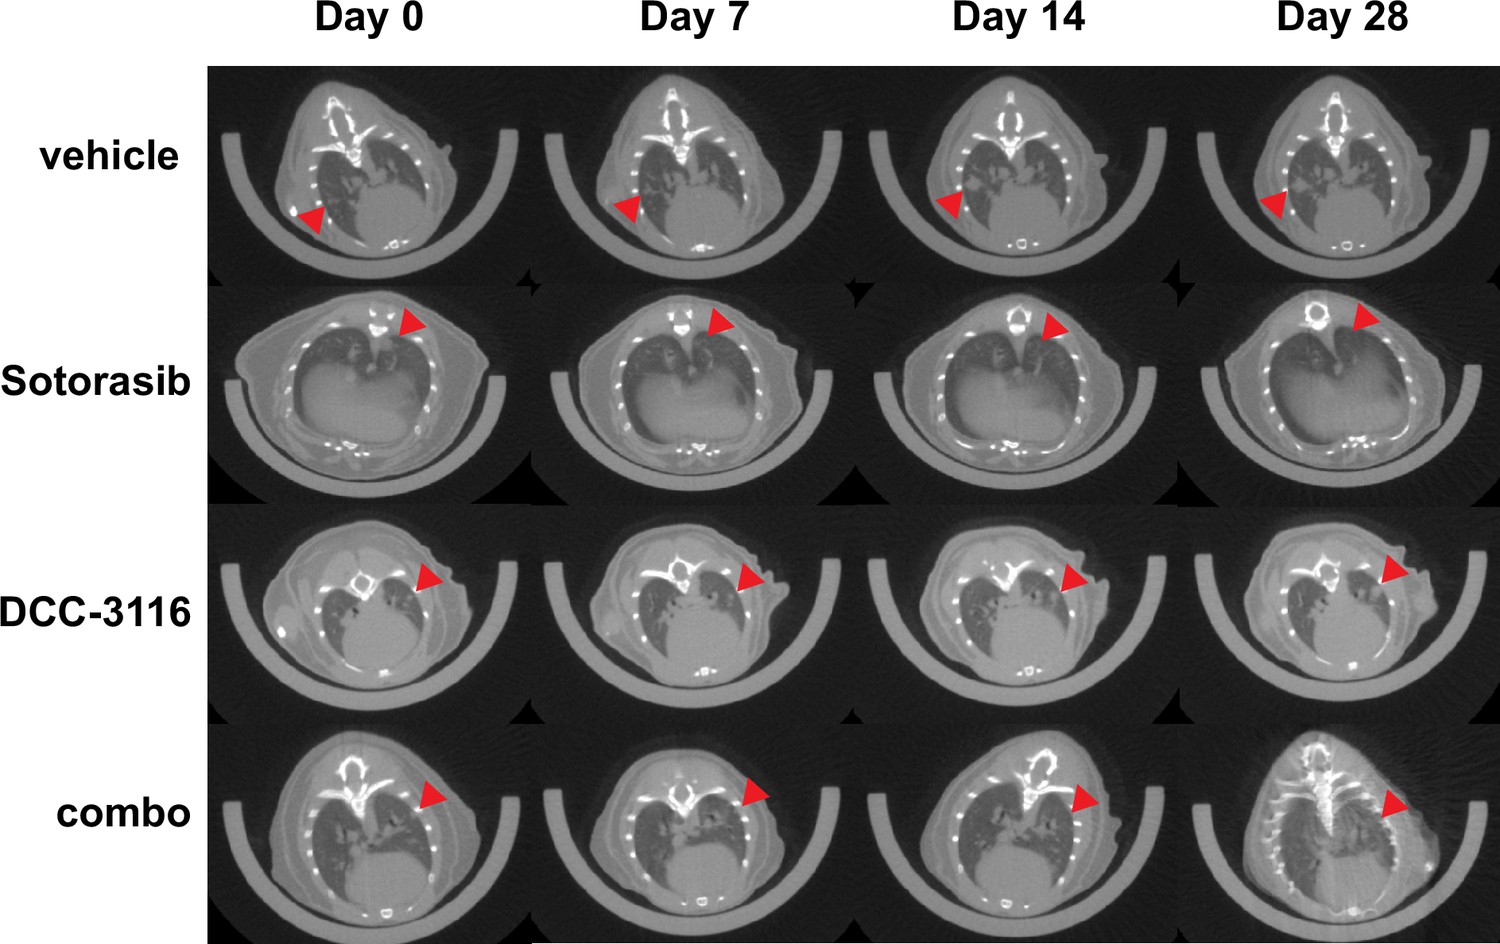
MicroCT images of KP mice on treatment.
Representative microCT images of KP mice pre-treatment (day 0) and 7 days, 14 days, and 28 days post-treatment. Red arrows indicate lung tumors.
Figure 6
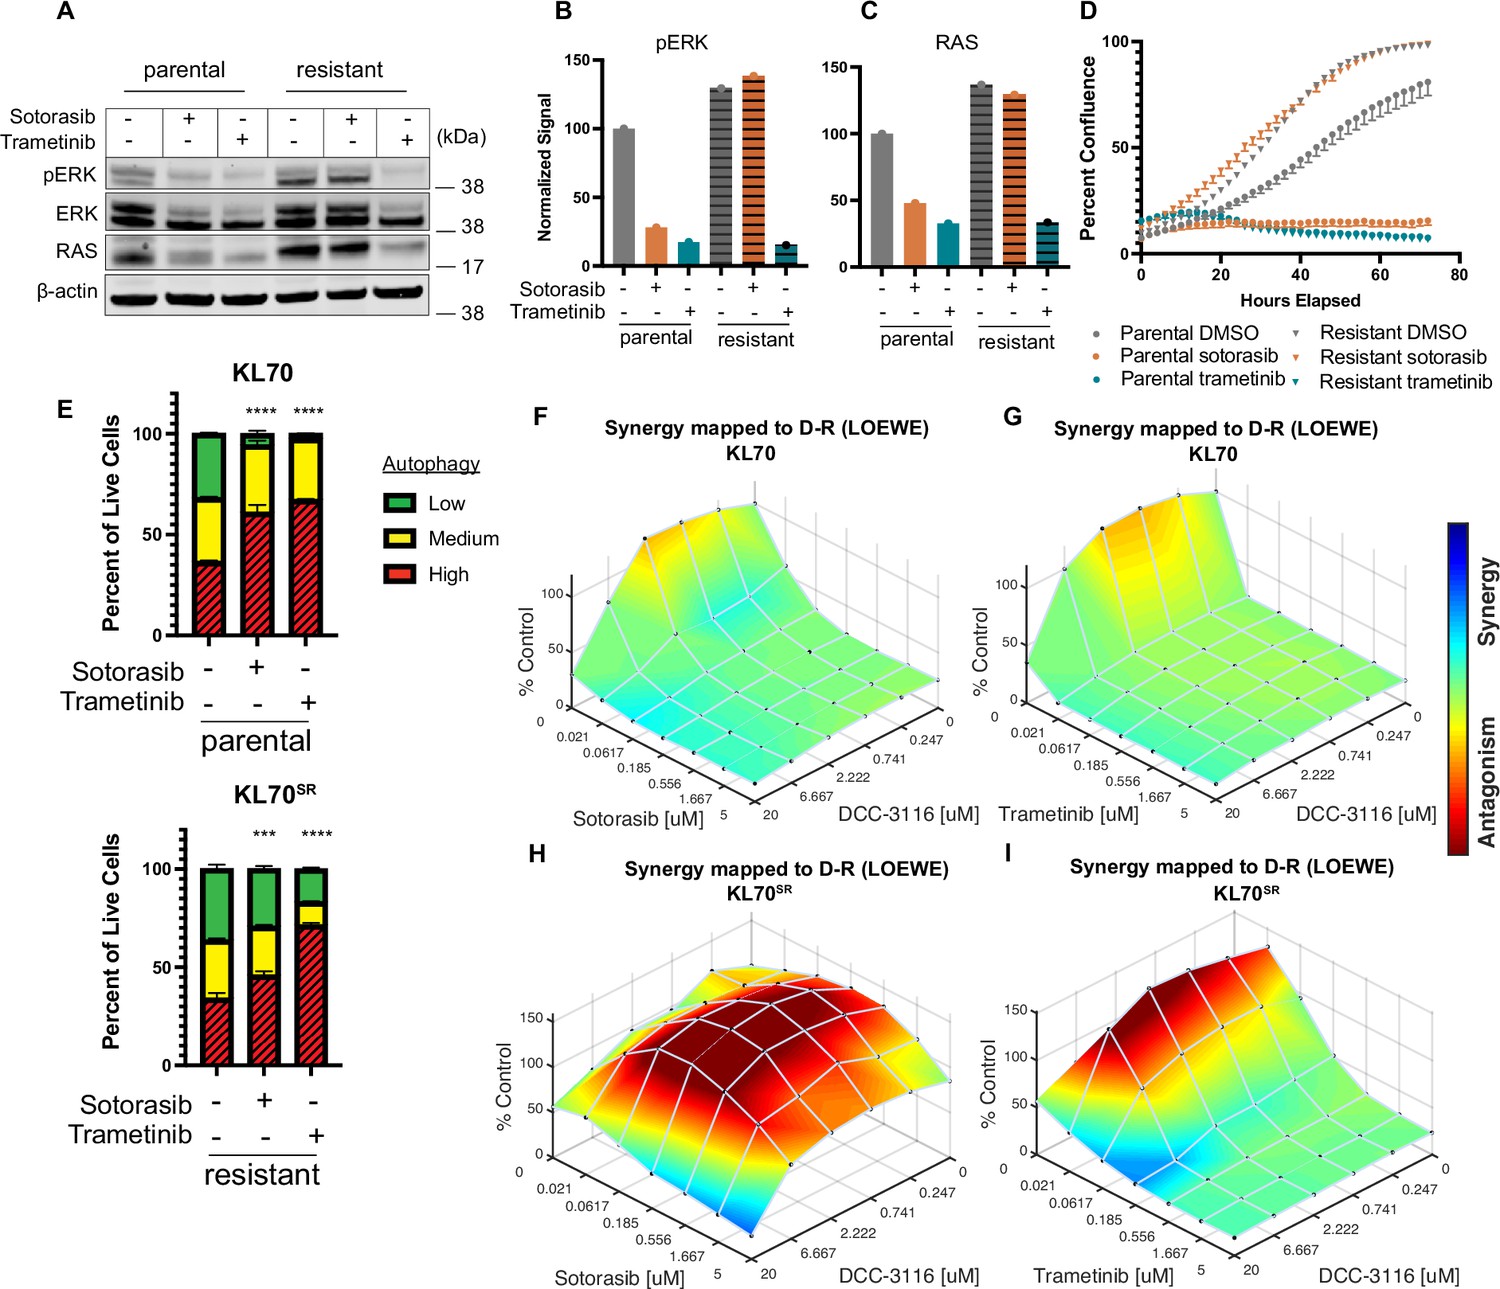
KL lung-cancer-derived cells that acquire resistance to sotorasib increase RAS and pERK1/2 expression and do not increase autophagy after sotorasib treatment.
(A) Immunoblot analysis of KL.70 and KL.70R cells treated with 100 nM sotorasib or 100 nM trametinib after 48 hr of treatment. (B, C) Quantification of signal from A normalized to b-actin. (D) Live-cell imaging of percent confluence of KL.70 cells over time treated with DMSO, 100 nm sotorasib of 100 nM trametinib. N = 3 biological replicates. (E) Autophagy measurement with fluorescent autophagy reporter (FAR) in cells assessed by mCherry-eGFP-LC3 reporter after 48 hr of 100 nM sotorasib or 100 nM trametinib treatment. Red = high autophagy, yellow = medium autophagy, green = low autophagy. Statistical significance was determined by comparing autophagy levels to DMSO control, and an ordinary one-way ANOVA with Dunnett’s multiple comparisons was used. Ns = not significant, *p<0.05, **p<0.01, ***p<0.001, ****p<0.0001. N = 9 biological replicates. (F, G) In vitro synergy assay of KL70 cells treated with indicated doses of sotorasib and/or DCC-3116 using the Loewe method after 72 hr of treatment. N = 3 biological replicates. (H, I) In vitro synergy assay of KL70SR cells treated with indicated doses of sotorasib and/or DCC-3116 using the Loewe method after 72 hr of treatment. N = 3 biological replicates.
-
Figure 6—source data 1
Uncropped and labeled gels for Figure 6.
- https://cdn.elifesciences.org/articles/96992/elife-96992-fig6-data1-v1.zip
-
Figure 6—source data 2
Raw unedited gels for Figure 6.
- https://cdn.elifesciences.org/articles/96992/elife-96992-fig6-data2-v1.zip
Author response image 1
Author response image 2
Author response image 3

Tables
Key resources table
| Reagent type (species) or resource | Designation | Source or reference | Identifiers | Additional information |
|---|---|---|---|---|
| Genetic reagent (Mus musculus) | KrasLSL-G12C | The Jackson Laboratory; PMID:32792368 | Strain #:033068 | Dow Lab |
| Genetic reagent (M. musculus) | Stk11fl/fl (mouse gene is Stk11 and protein is referred to as LKB1) | The Jackson Laboratory; PMID:21124450 | Strain #:014143 | Morrison Lab |
| Genetic reagent (M. musculus) | Trp53wm-R172H | PMID:30262850 | Lozano Lab | |
| Genetic reagent (M. musculus) | Nod.Cg-Prkdcscid/J | The Jackson Laboratory | Strain #:001303 | |
| Strain (adenovirus) | Ad5-CMV-CRE | University of Iowa Viral Vector Core | VVC-U of Iowa-5 | |
| Cell line (Homo sapiens) | 293T | ATCC | CRL-3216 | |
| Cell line (H. sapiens) | NCI-H2122 | ATCC | CRL-5985 | |
| Cell line (H. sapiens) | Calu-1 | ATCC | HTB-54 | |
| Cell line (H. sapiens) | NCI-H358 | ATCC | CRL-5807 | |
| Cell line (H. sapiens) | NCI-H23 | ATCC | CRL-5800 | |
| Cell line (H. sapiens) | Cor-L23 | Sigma-Aldrich | 92031919 | |
| Cell line (M. musculus) | KL70 | Tumor-derived cell line | ||
| Antibody | Anti-β-actin (mouse monoclonal) | Cell Signaling Technology | Cat# 3700 | WB (1:10,000) |
| Antibody | Anti-phospho-AKT S473 (rabbit monoclonal) | Cell Signaling Technology | Cat# 4060 | WB (1:1000) IHC (1:100) |
| Antibody | Anti-Akt (mouse monoclonal) | Cell Signaling Technology | Cat# 2920 | WB (1:1000) |
| Antibody | Anti-phospho AMPKa S485 (rabbit monoclonal) | Cell Signaling Technology | Cat# 2537 | WB (1:1000) |
| Antibody | Anti-phospho AMPKa T172 (rabbit monoclonal) | Cell Signaling Technology | Cat# 2535 | WB (1:1000) |
| Antibody | Anti-AMPK (rabbit monoclonal) | Cell Signaling Technology | Cat# 5831 | WB (1:1000) |
| Antibody | Anti-phospho-ATG13 S318 (rabbit polyclonal) | Rockland Immunochemicals | Cat# 600-401C49 | ELISA (1:500) |
| Antibody | Anti-ATG13 (rabbit monoclonal) | Cell Signaling Technology | Cat# 13272 | ELISA (1:500) |
| Antibody | Anti-HNF4α (rabbit monoclonal) | Cell Signaling Technology | Cat# 3113 | IHC (1:500) |
| Antibody | Anti-LKB1 (IHC formulated) (rabbit monoclonal) | Cell Signaling Technology | Cat# 13031 | IHC (1:250) |
| Antibody | Anti-LKB1 (rabbit monoclonal) | Cell Signaling Technology | Cat# 3050 | WB (1:1000) |
| Antibody | Anti-NKX2.1 (rabbit monoclonal) | Abcam | Cat# ab76013 | IHC (1:2000) |
| Antibody | Anti-p44/p42 ERK1/2 (mouse monoclonal) | Cell Signaling Technology | Cat# 4696 | WB (1:1000) |
| Antibody | Anti-phospho-p44/42 Thr202/Tyr204 ERK1/2 (rabbit monoclonal) | Cell Signaling Technology | Cat# 4377 | WB (1:1000) IHC (1:600) |
| Antibody | Anti-TP53 (rabbit polyclonal) | Leica Biosystems | NCL-L-p53-CM5p | IHC (1:1000) WB (1:2,000) |
| Antibody | Anti-Pro-Surfactant Protein C (pSPC) (rabbit monoclonal) | MilliporeSigma | Cat# AB3786 | IHC (1:2000) |
| Antibody | Anti-RAS (rabbit monoclonal) | Cell Signaling Technology | Cat#3965 | WB (1:1000) |
| Antibody | Streptavidin-Poly-HRP antibody | Thermo Fisher | Cat# 21140 | ELISA (1:4000) |
| Antibody | Anti-phospho-ULK1 S555 (rabbit monoclonal) | Cell Signaling Technology | Cat# 5869 | WB (1:500) |
| Antibody | Phospho-ULK1 S757 (rabbit monoclonal) | Cell Signaling Technology | Cat# 14202 | WB (1:500) |
| Antibody | ULK1 (rabbit monoclonal) | Cell Signaling Technology | Cat# 8054 | WB (1:500) |
| Antibody | IRDye 800 CW Goat anti-Rabbit IgG | LI-COR | Cat# 926-32211 | WB (1:20,000) |
| Antibody | IRDye 680LT Donkey anti-Mouse IgG | LI-COR | Cat# 926-68022 | WB (1:20,000) |
| Recombinant DNA reagent | pCW57-MCS1-P2A-MSC2 (Blast) | Addgene | Plasmid # 80921 | |
| Recombinant DNA reagent | psPAX2 | Addgene | Plasmid # 12260 | |
| Recombinant DNA reagent | pMD2.G | Addgene | Plasmid # 12259 | |
| Recombinant DNA reagent | pLV-ULK1K46N | Vector Builder | ||
| Recombinant DNA reagent | pBabePuro:mCherry-GFP-LC3 | Addgene | Plasmid # 22418 | |
| Recombinant DNA reagent | pUltra-Hot | Addgene | Plasmid # 24130 | |
| Chemical compound, drug | Sotorasib | Deciphera Pharmaceuticals | ||
| Chemical compound, drug | DCC-3116 | Deciphera Pharmaceuticals | ||
| Chemical compound, drug | DCC-3116 formulated chow | Deciphera Pharmaceuticals, Research Diets | ||
| Chemical compound, drug | Trametinib | Shanghai Biochem Partner | Cat# BCP02307 | |
| Chemical compound, drug | Corn oil | Sigma-Aldrich | Cat# C8267 | |
| Chemical compound, drug | DMSO | Sigma-Aldrich | Cat# D8418 |
Additional files
Download links
A two-part list of links to download the article, or parts of the article, in various formats.
Downloads (link to download the article as PDF)
Open citations (links to open the citations from this article in various online reference manager services)
Cite this article (links to download the citations from this article in formats compatible with various reference manager tools)
Inhibition of ULK1/2 and KRASG12C controls tumor growth in preclinical models of lung cancer
eLife 13:RP96992.
https://doi.org/10.7554/eLife.96992.3


