Visualization of endogenous G proteins on endosomes and other organelles
- Department of Pharmacology and Toxicology, Medical College of Georgia, Augusta University, United States
Figures
Figure 1 with 1 supplement

Validation of mNG-β1 and HiBit-β1 cells.
(A) Cartoon showing the peptide tag complementation systems used to label endogenous Gβ1 subunits. (B) SDS-PAGE of HiBit-β1 and mNG-β1 cell lysates; the predicted molecular weights of the edited gene products are 38.9 and 41.1 kilodaltons (KDa), respectively; representative of 3 independent experiments. (C) In permeabilized nucleotide-depleted cells BRET between dopamine D2R-Nluc receptors and mNG-β1-containing heterotrimers increases in response to dopamine (DA; 100 μM) and reverses after addition of GDP (100 μM); mean ± 95% CI; n=27 replicates from two independent experiments. (D) In intact cells BRET between HiBit-β1 and the Gβγ sensor memGRKct-Venus increases after stimulation of D2R dopamine, β2AR adrenergic, or M3R acetylcholine receptors with DA (100 μM), isoproterenol (Iso; 10 μM) and acetylcholine (Ach; 100 μM), respectively. Signals reversed when receptors were blocked with haloperidol (10 μM), ICI 118551 (10 μM) or atropine (10 μM); mean ± 95% CI; n=16 replicates from four independent experiments.
-
Figure 1—source data 1
PDF file containing original HiBit blot shown in panel B, indicating the relevant bands.
- https://cdn.elifesciences.org/articles/97033/elife-97033-fig1-data1-v1.pdf
-
Figure 1—source data 2
Original files for HiBit blot shown in panel B.
- https://cdn.elifesciences.org/articles/97033/elife-97033-fig1-data2-v1.zip
-
Figure 1—source data 3
Numerical data for traces shown in panels C and D.
- https://cdn.elifesciences.org/articles/97033/elife-97033-fig1-data3-v1.xlsx
Figure 1—figure supplement 1

Receptor-mediated accumulation of cyclic AMP (cAMP) is similar in HiBit-β1, mNG-β1 and parent cell lines.
Activation of endogenous β adrenergic receptors with isoproterenol (Iso; 10 μM) produces similar increases in cAMP as indicated by the Nluc-EPAC-VV cAMP sensor in (A) parental HEK and HiBit-β1 cells and (B) parental mNG2(1–10) and mNG-β1 cells; mean ± 95% CI of 20 replicates from n=5 independent experiments.
-
Figure 1—figure supplement 1—source data 1
Numerical data for traces shown in panels A and B.
- https://cdn.elifesciences.org/articles/97033/elife-97033-fig1-figsupp1-data1-v1.xlsx
Figure 2 with 3 supplements

Endogenous G proteins are abundant on the plasma membrane but not large organelles.
(A) A single field of view of mNG-β1 cells at three magnifications; scale bars are 40 μm, 20 μm, and 10 μm. (B) mNG-β1 does not colocalize with expressed markers of the endoplasmic reticulum (ER; PTP1b), mitochondria (MT; MOA) or medial-trans Golgi apparatus (GA; GalT); intensity line profiles depict absolute fluorescence intensity in each channel; scale bars are 2 μm.
Figure 2—figure supplement 1
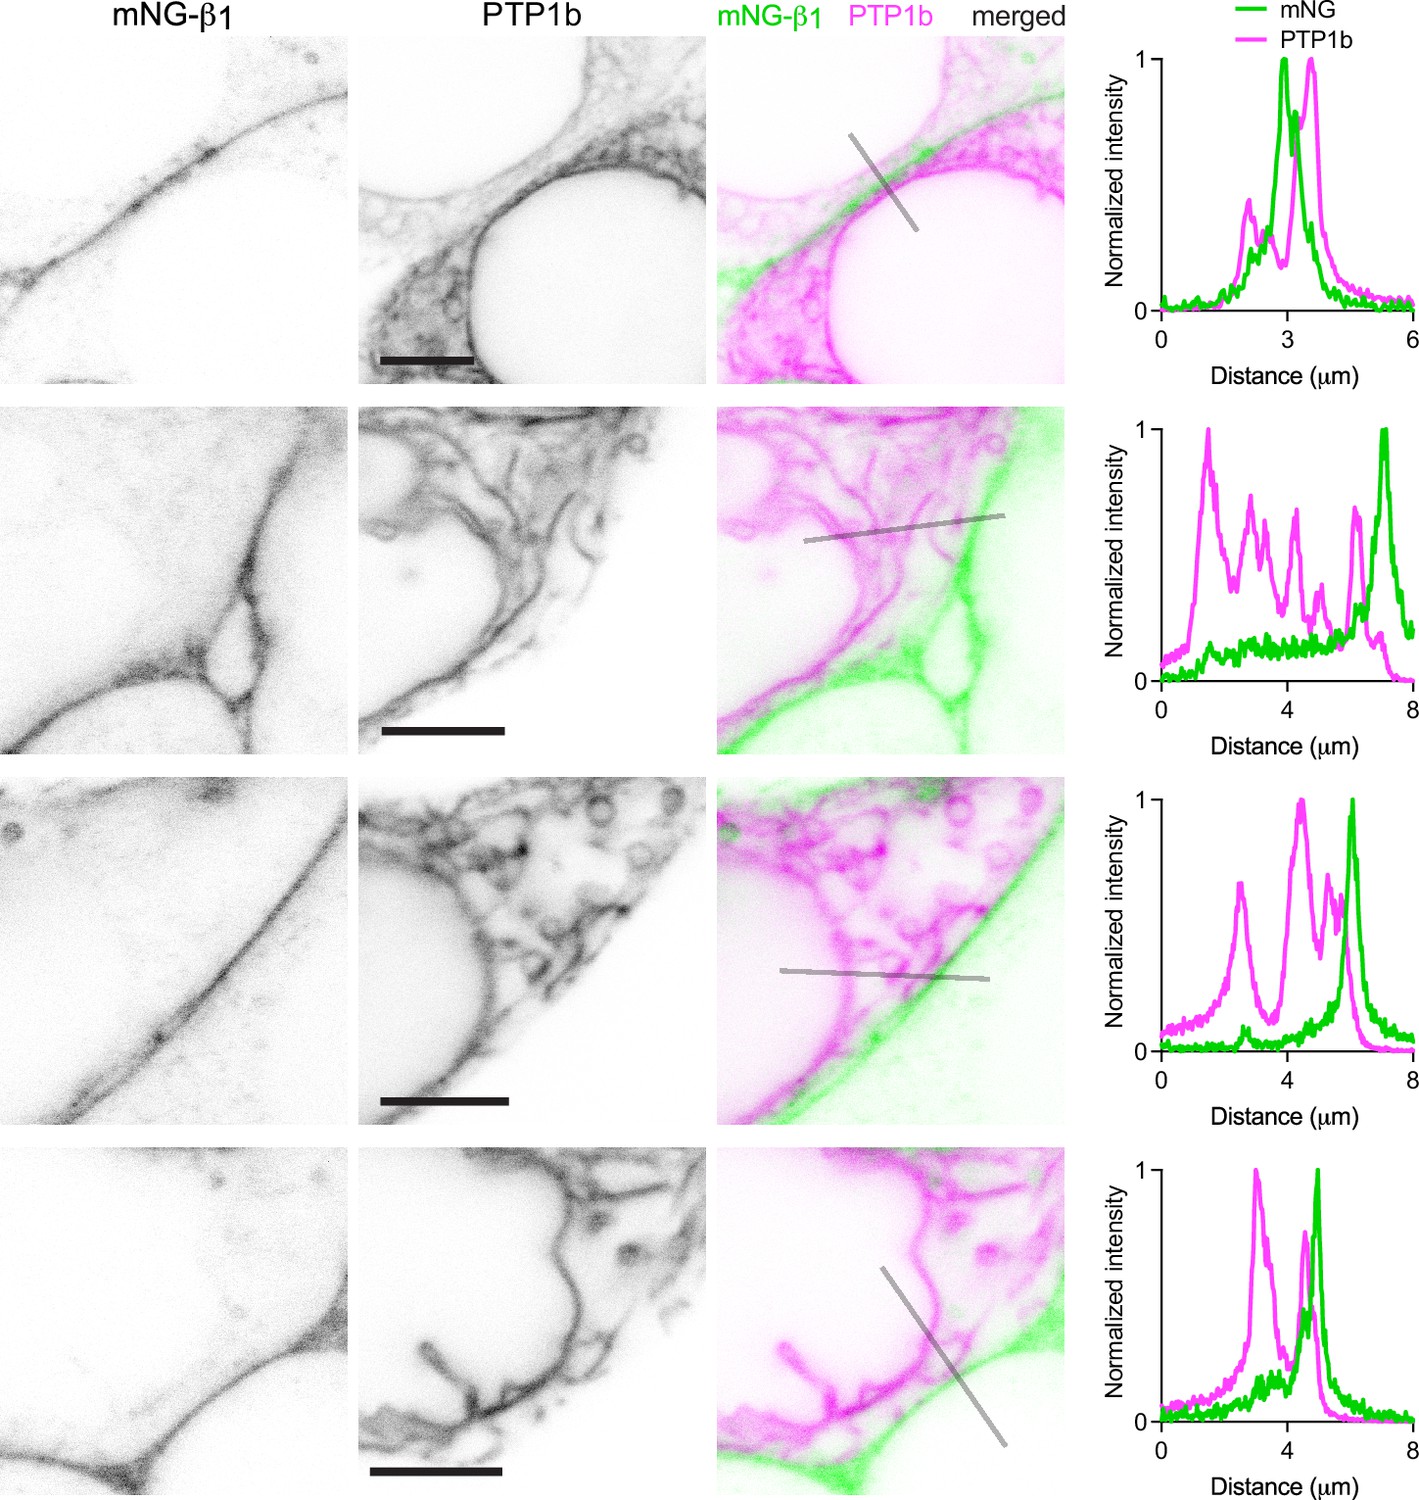
G proteins are not abundant on the endoplasmic reticulum (ER).
Exemplary images of mNG-β1 cells coexpressing the ER marker mRuby2-PTP1b. Intensity line profiles depict fluorescence intensity normalized to the maximum value in each channel; scale bars are 5 μm.
Figure 2—figure supplement 2
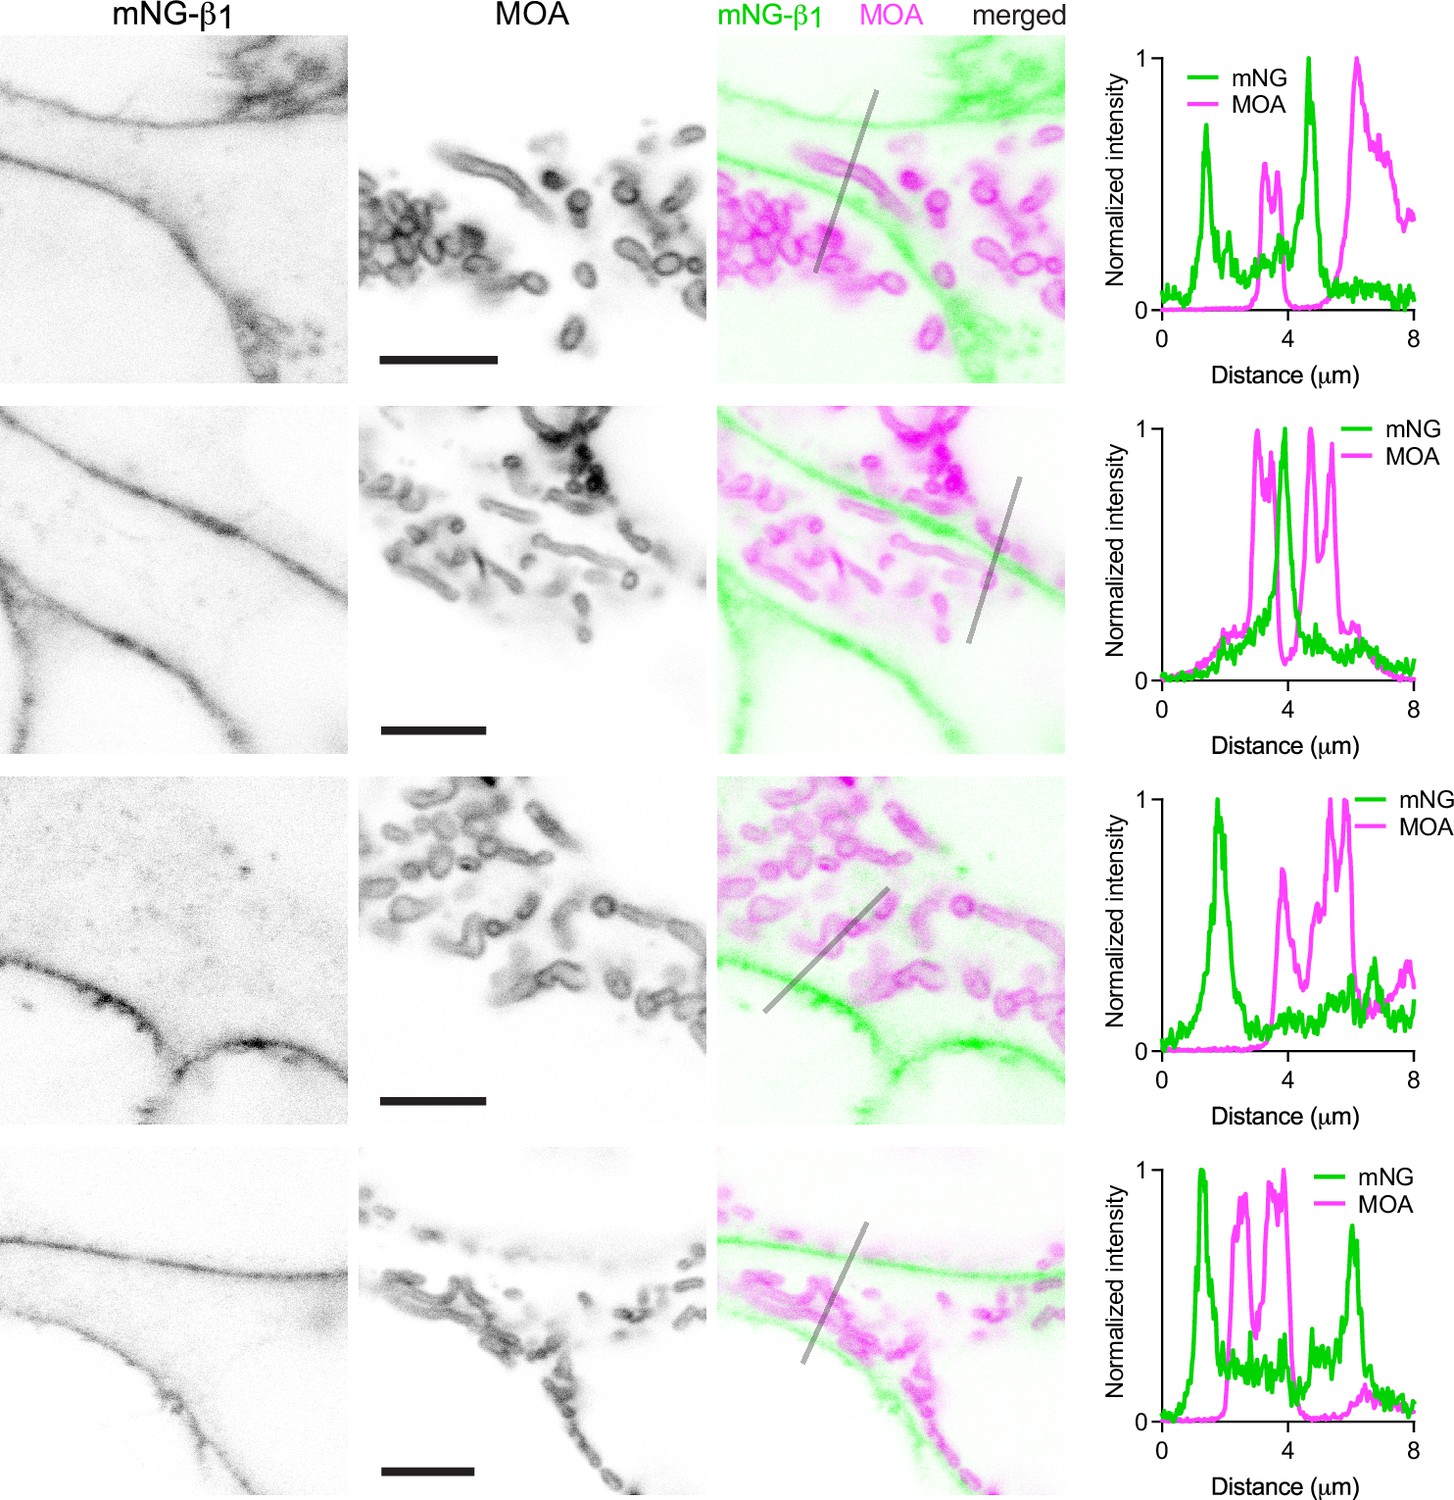
G proteins are not abundant on mitochondria (MT).
Exemplary images of mNG-β1 cells coexpressing the MT marker mRuby2-MOA. Intensity line profiles depict fluorescence intensity normalized to the maximum value in each channel; scale bars are 5 μm.
-
Figure 2—figure supplement 2—source data 1
Numerical data for individual line scans (panel C).
- https://cdn.elifesciences.org/articles/97033/elife-97033-fig2-figsupp2-data1-v1.xlsx
Figure 2—figure supplement 3

G proteins are not abundant on the medial-trans Golgi apparatus (GA).
Exemplary images of mNG-β1 cells coexpressing the GA marker mRuby2-Golgi-7 (GalT). Intensity line profiles depict fluorescence intensity normalized to the maximum value in each channel; scale bars are 5 μm.
Figure 3 with 7 supplements
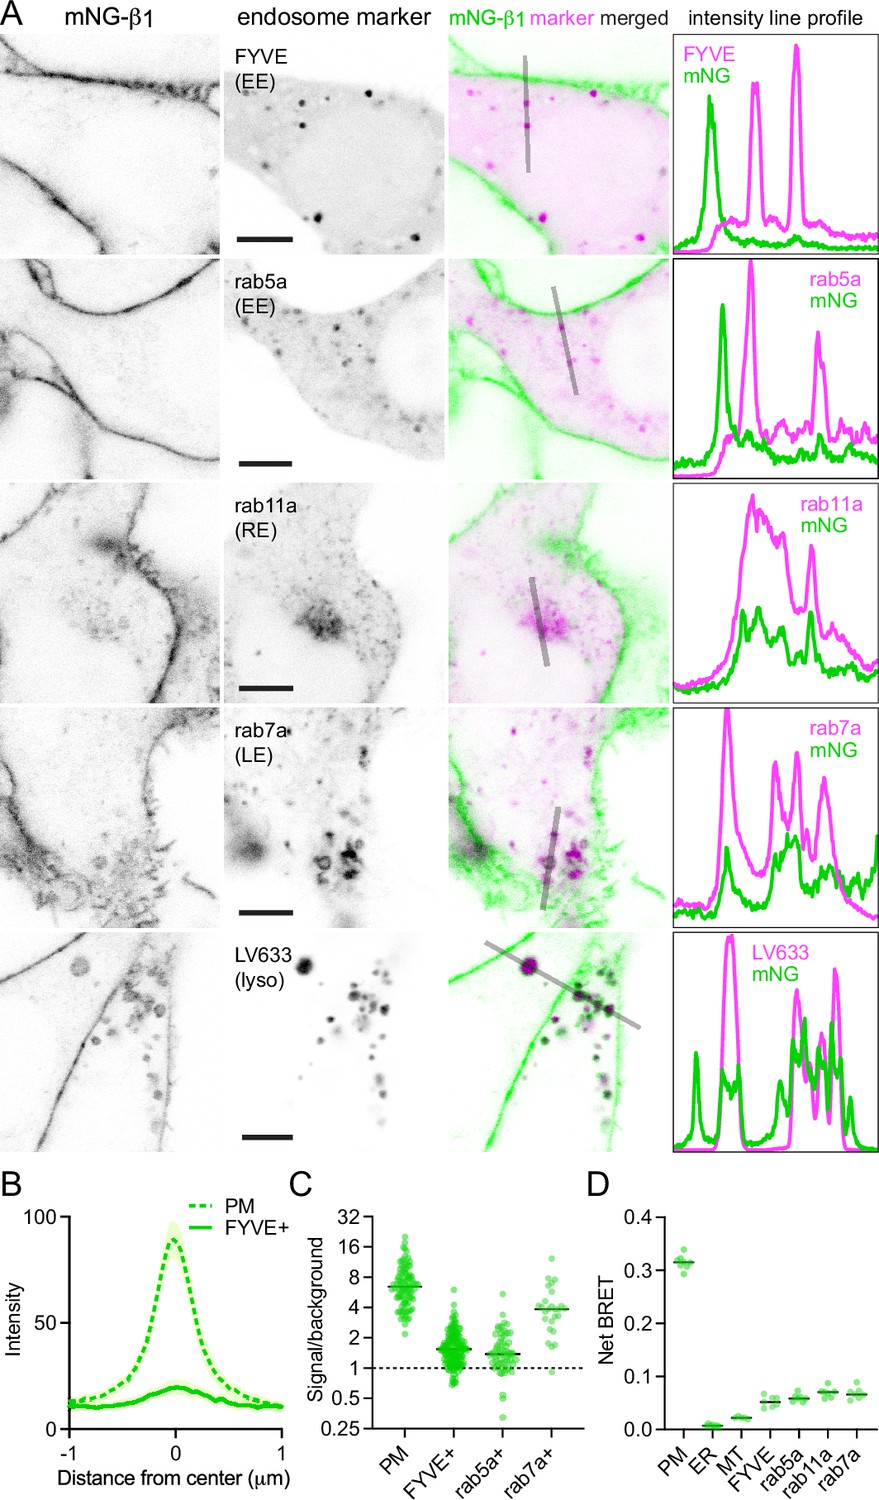
Endogenous G proteins colocalize with markers of endosomes and lysosomes.
(A) mNG-β1 colocalizes with expressed markers of early endosomes (EE; FYVE and rab5a), recycling endosomes (RE; rab11a), late endosomes (LE; rab7a) and lysosomes (lyso; LysoView 633); intensity line profiles depict absolute fluorescence intensity in each channel; scale bars are 5 μm. (B) Mean mNG-β1 fluorescence intensity line profiles drawn across the plasma membrane (PM) and FYVE-positive vesicles; mean ±95% CI; n=40 vesicles/cells. (C) mNG-β1 signal/background ratios for regions of interest surrounding the plasma membrane (PM; n=99), FYVE-positive (n=125) and rab5a-positive (n=56) early endosomes, and rab7a-positive (n=26) late endosomes; horizontal lines represent the median. (D) Bystander net BRET signals between HiBit-β1 and Venus-tagged markers of the plasma membrane (PM), endoplasmic reticulum (ER), mitochondria (MT), early endosomes (FYVE and rab5a), recycling endosomes (rab11a) and late endosomes (rab7a); horizontal lines represent the median; n=5–7 independent experiments.
-
Figure 3—source data 1
Numerical data for line profiles (panel B), signal/background ratios (panel C) and bystander BRET (panel D).
- https://cdn.elifesciences.org/articles/97033/elife-97033-fig3-data1-v1.xlsx
Figure 3—figure supplement 1
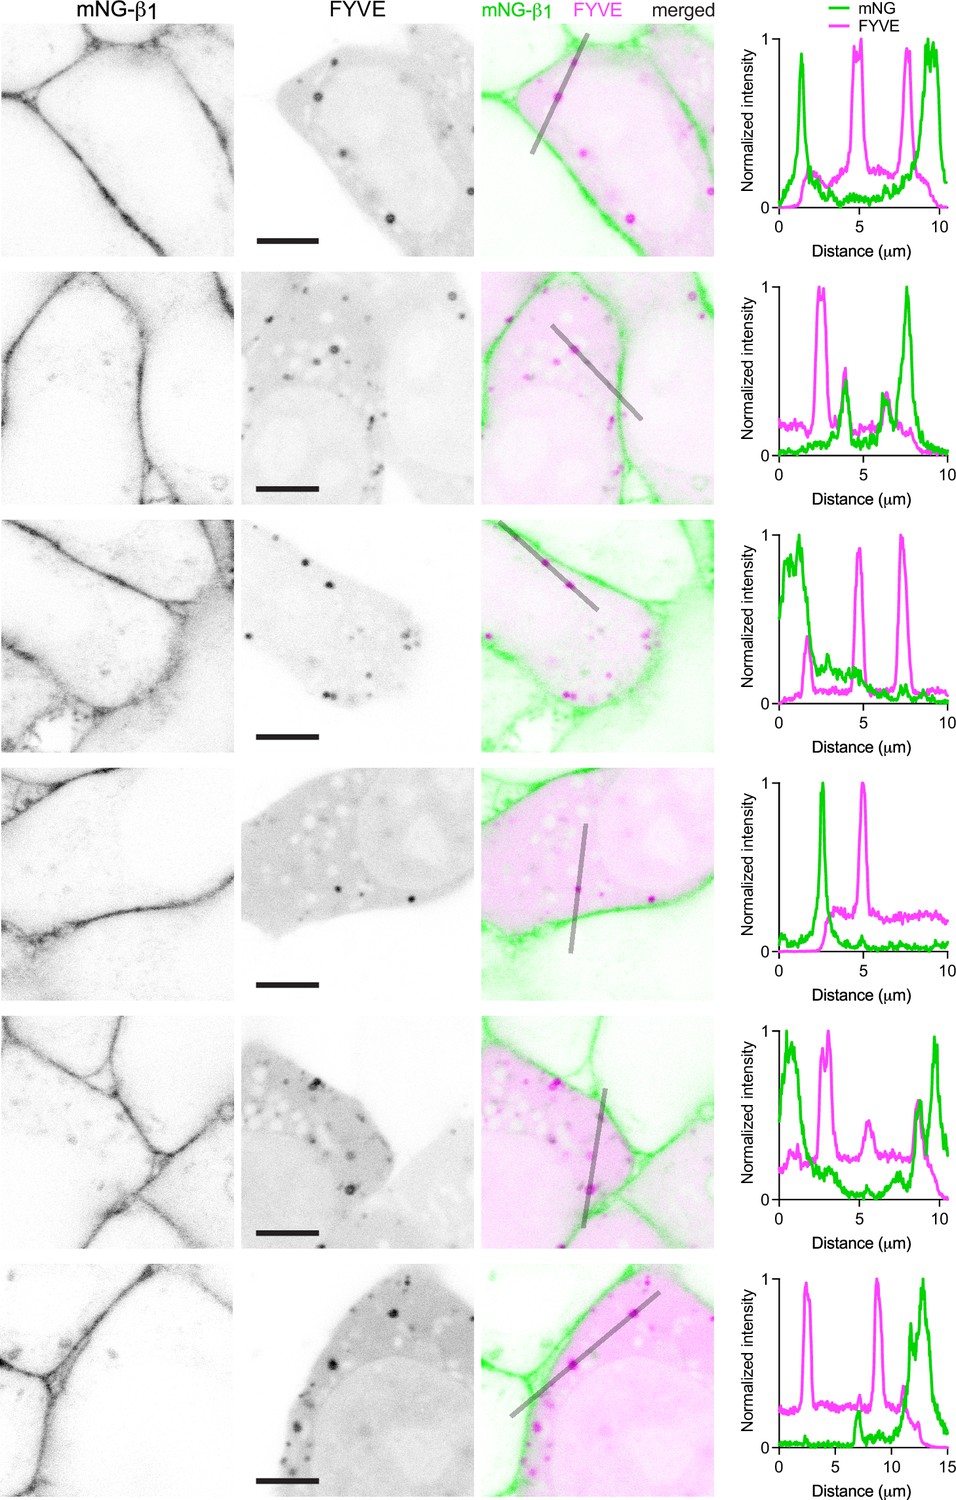
G proteins colocalize with the early endosome marker FYVE on some endosomes.
Exemplary images of mNG-β1 cells coexpressing the early endosome marker pmCherry-2xFYVE (FYVE). Intensity line profiles depict fluorescence intensity normalized to the maximum value in each channel; scale bars are 5 μm.
Figure 3—figure supplement 2
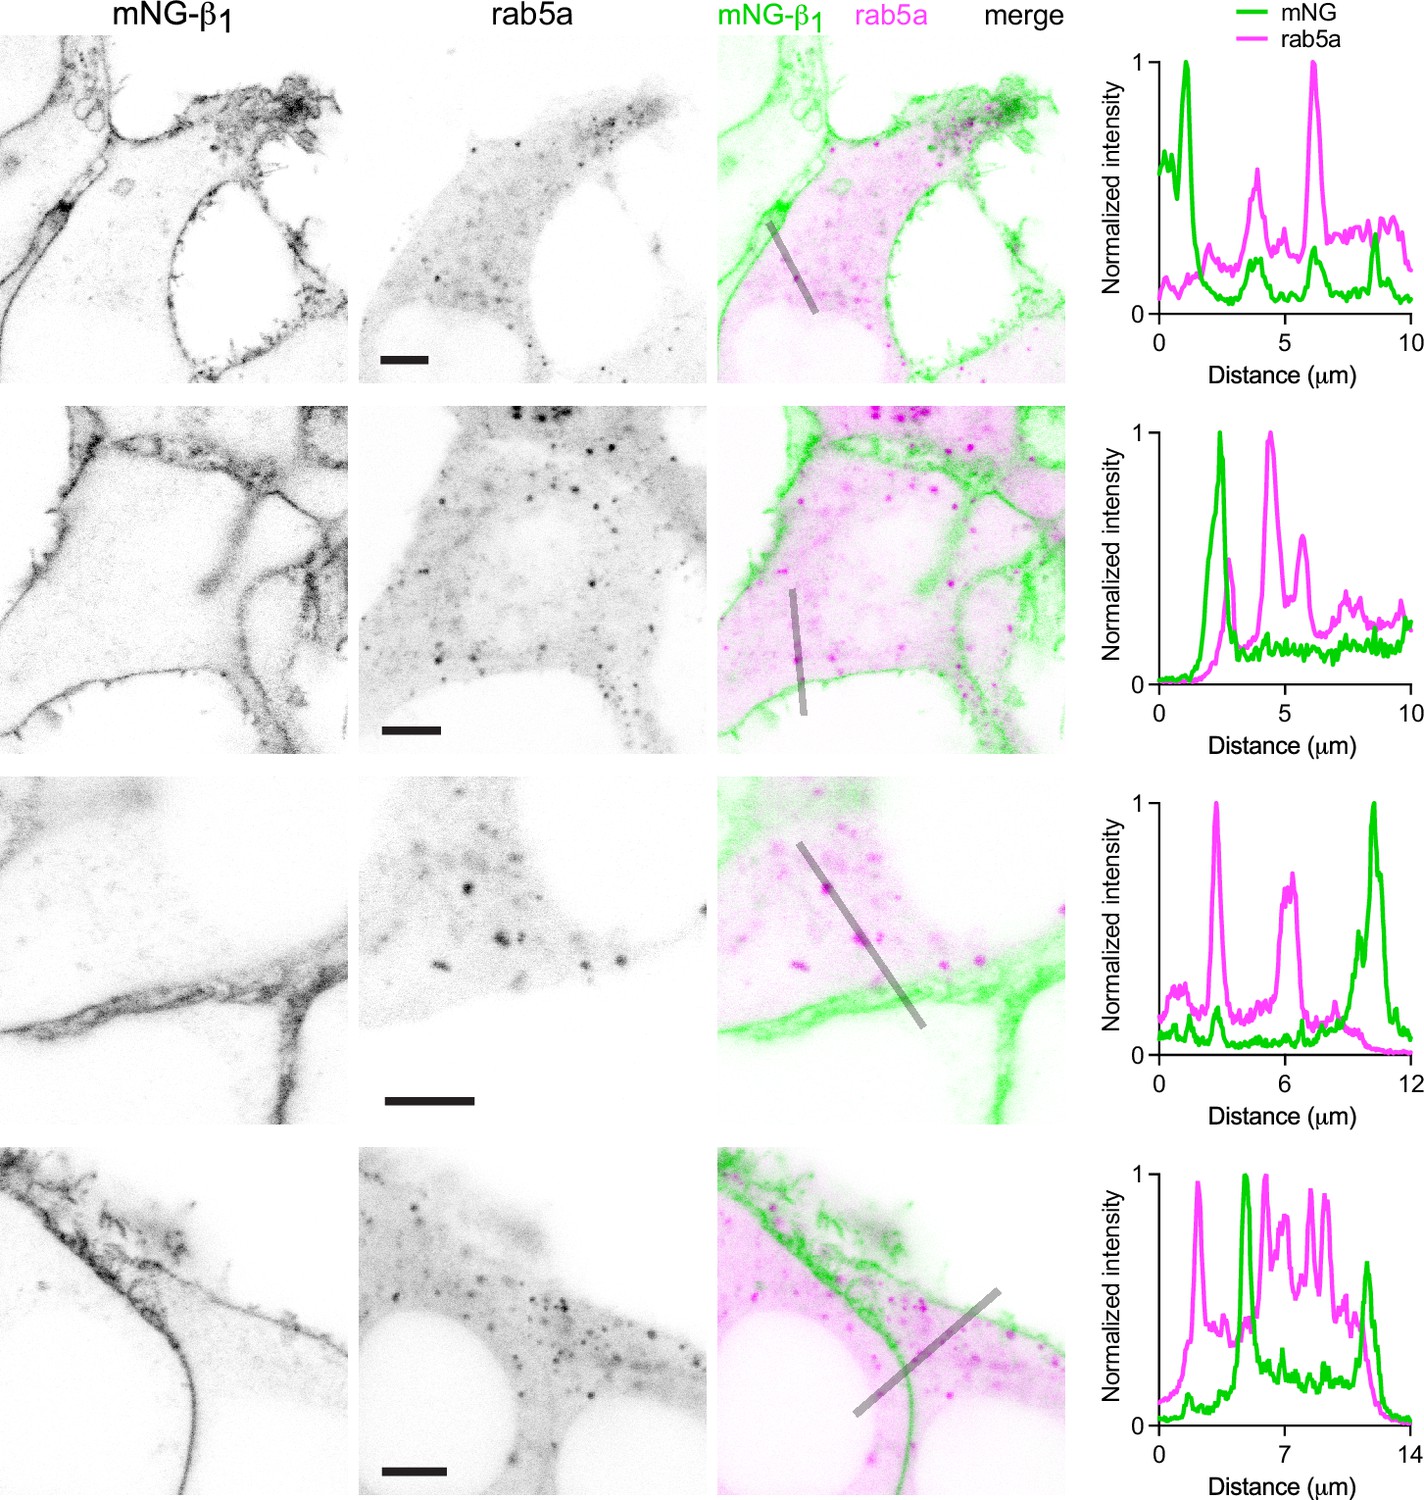
G proteins colocalize with the early endosome marker rab5a on some endosomes.
Exemplary images of mNG-β1 cells coexpressing the early endosome marker mRuby2-rab5a (rab5a). Intensity line profiles depict fluorescence intensity normalized to the maximum value in each channel; scale bars are 5 μm.
Figure 3—figure supplement 3
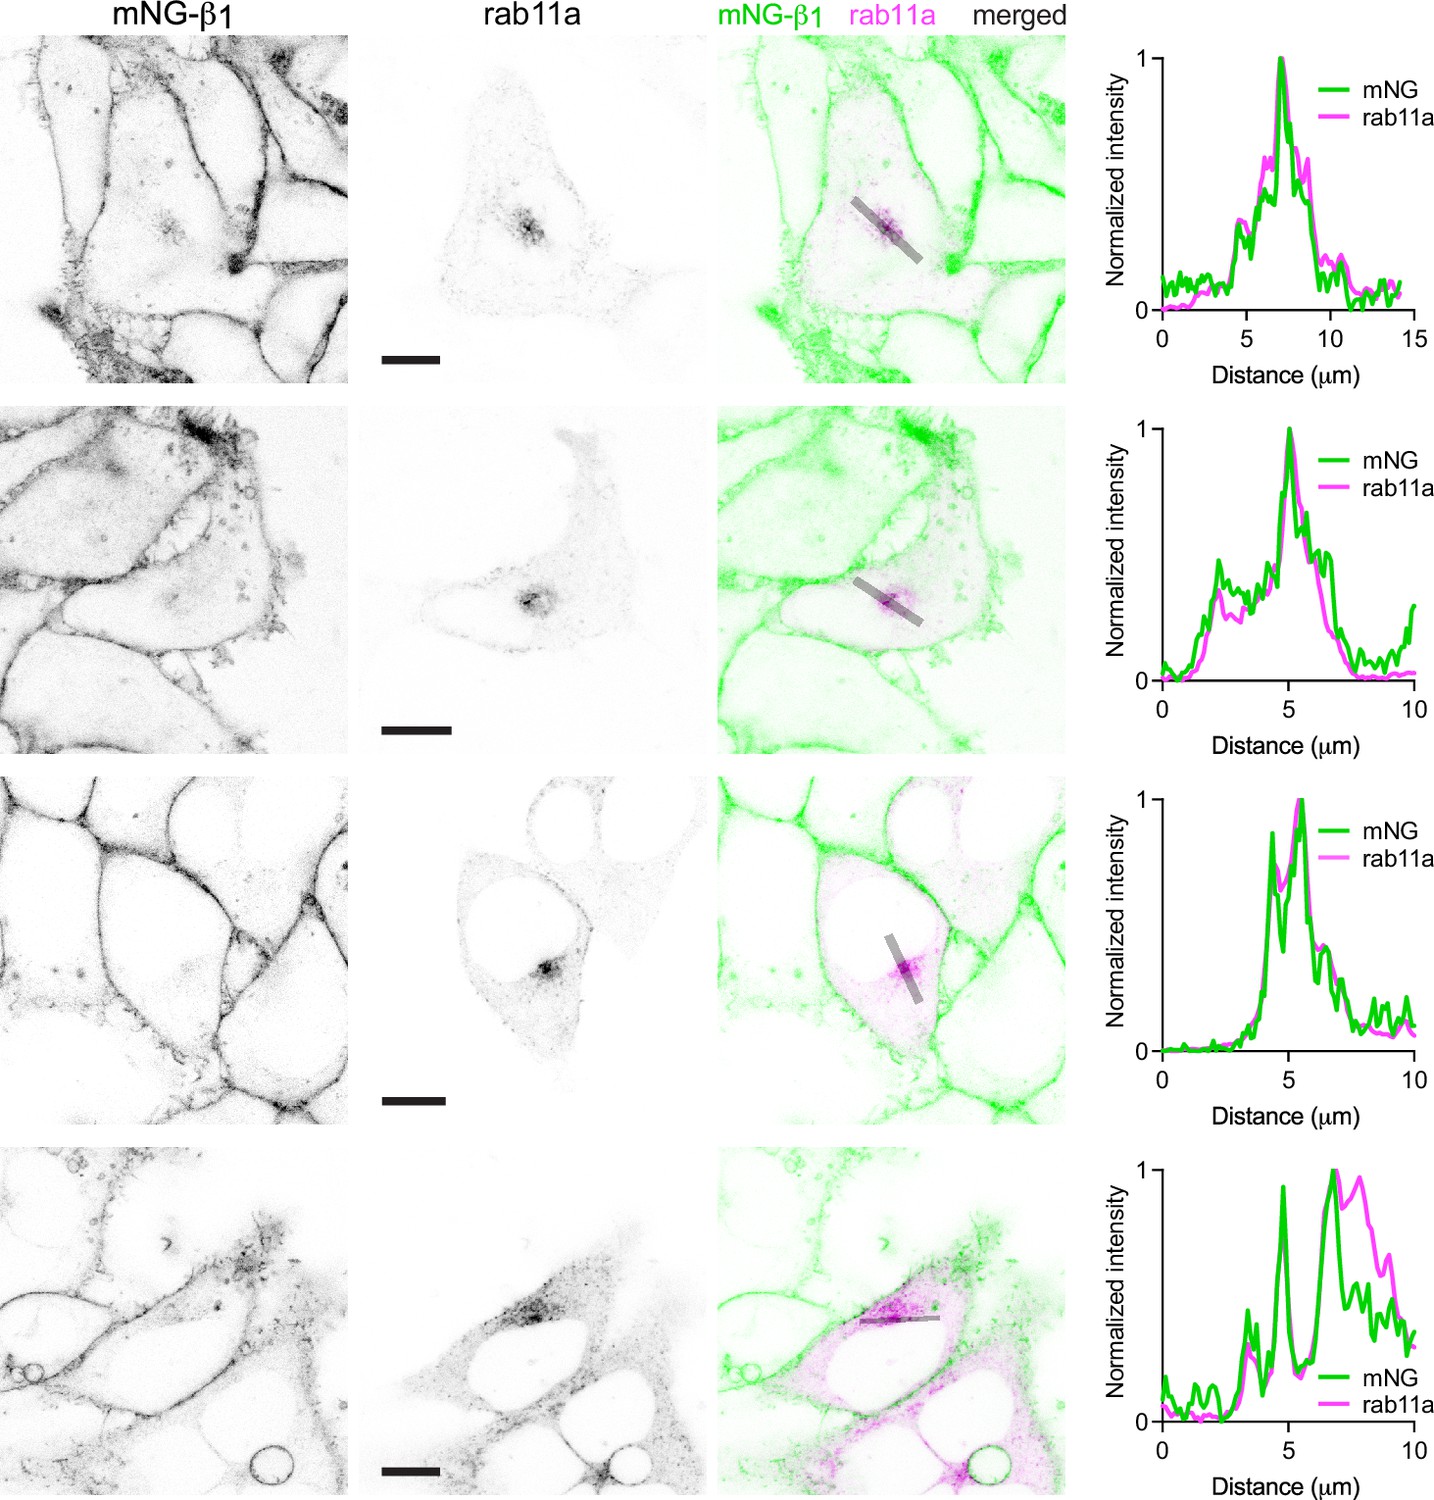
G proteins colocalize with the recycling endosome marker rab11a in a perinuclear region.
Exemplary images of mNG-β1 cells coexpressing the recycling endosome marker mCherry-rab11a (rab11a). Intensity line profiles depict fluorescence intensity normalized to the maximum value in each channel; scale bars are 10 μm.
Figure 3—figure supplement 4
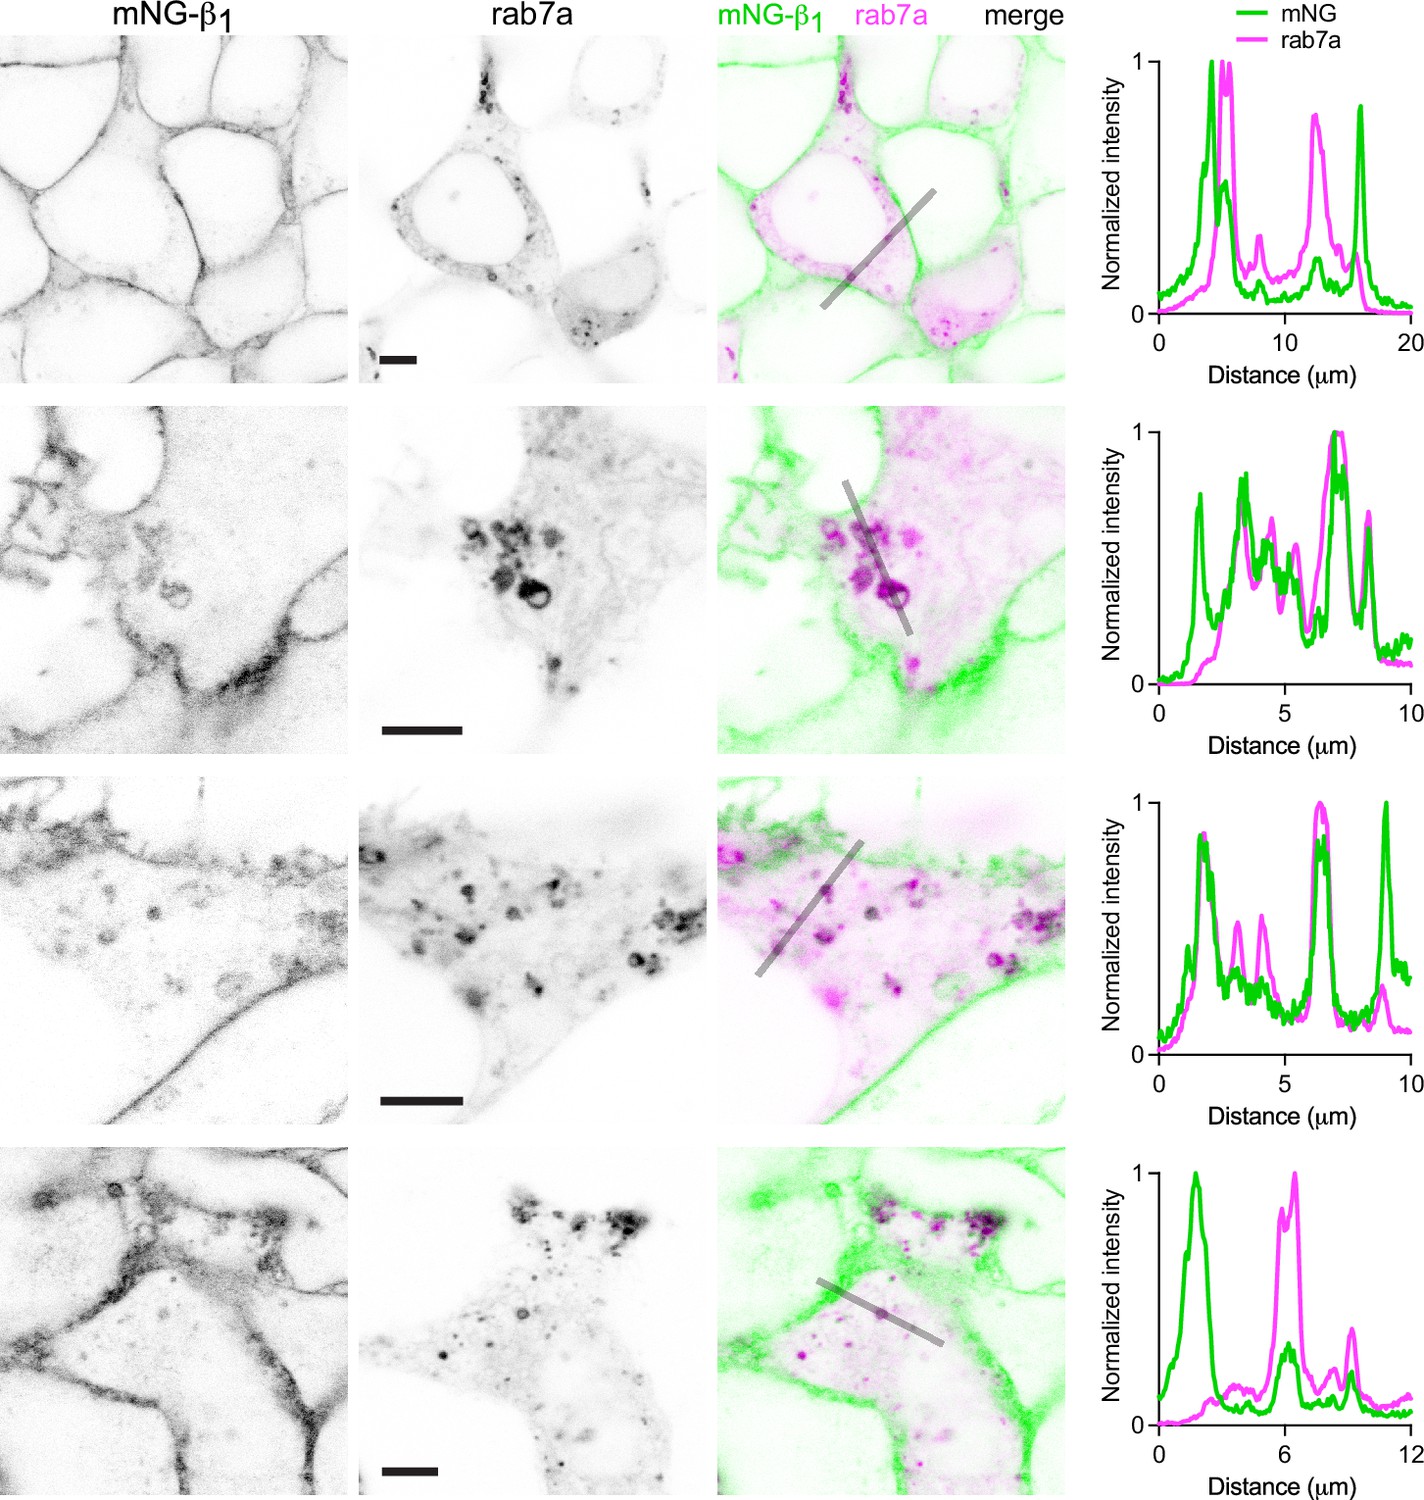
G proteins colocalize with the late endosome marker rab7a on many endosomes.
Exemplary images of mNG-β1 cells coexpressing the late endosome marker mCherry-rab7a (rab7a). Intensity line profiles depict fluorescence intensity normalized to the maximum value in each channel; scale bars are 5 μm.
Figure 3—figure supplement 5
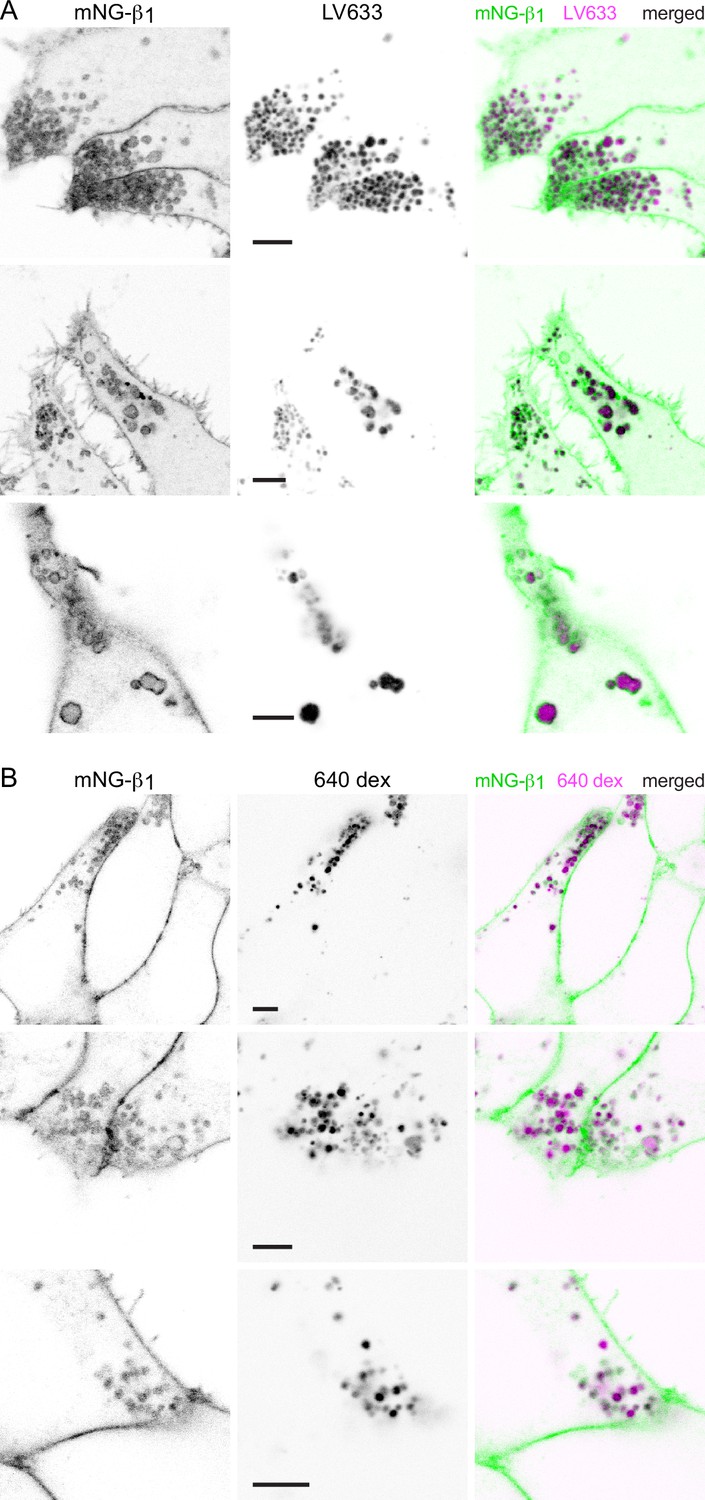
G proteins are abundant on lysosomes.
(A) Exemplary images of mNG-β1 cells stained with LysoView 633 (LV633); scale bars are 5 μm. (B) Exemplary images of mNG-β1 cells incubated overnight with 10,000 m.w. CF 640 dextran (640 dex); scale bars are 5 μm.
Figure 3—figure supplement 6
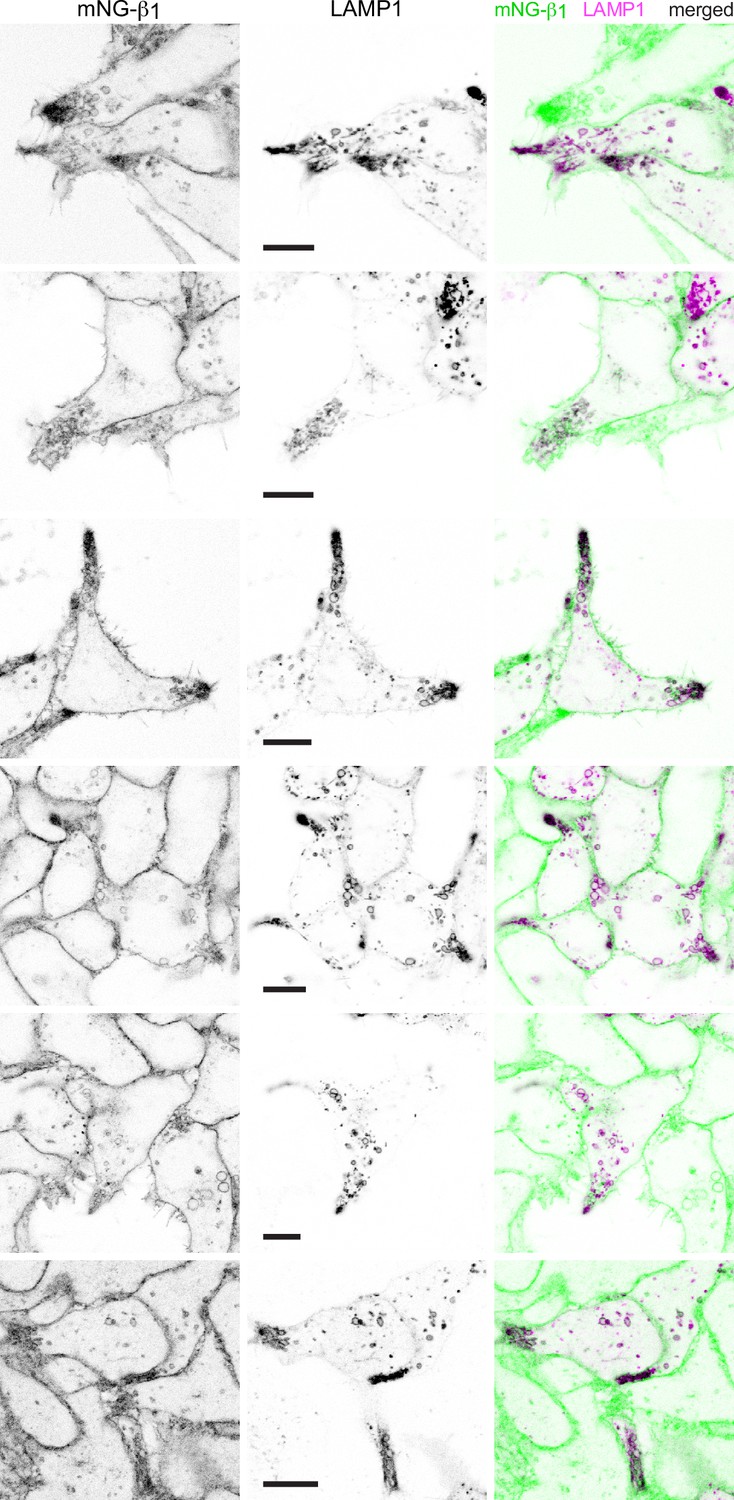
G proteins colocalize with the lysosome marker LAMP1.
Exemplary images of mNG-β1 cells coexpressing the lysosome marker LAMP1-mScarlet; scale bars are 5 μm.
Figure 3—figure supplement 7

G proteins colocalize with the trans-Golgi marker TGNP.
Exemplary images of mNG-β1 cells coexpressing the trans-Golgi marker mCherry-TGNP. Intensity line profiles depict fluorescence intensity normalized to the maximum value in each channel; scale bars are 5 μm.
Figure 4 with 2 supplements

Constitutive G protein endocytosis is inefficient.
(A) mNG-β1 colocalizes with newly internalized endocytic vesicles labeled with FM4-64 and CellMask Deep Red (arrowheads); scale bar is 2 μm. (B) A fluorescence intensity line profile for mNG-β1, FM4-64 and CellMask normalized to the peak value of each label at the plasma membrane (PM). (C) Mean mNG-β1, FM4-64 and CellMask fluorescence intensity line profiles drawn across vesicles, normalized to fluorescence intensity at the plasma membrane for each label; mean ± 95% CI; n=45 vesicles/cells.
-
Figure 4—source data 1
Numerical data for line profiles (panel C).
- https://cdn.elifesciences.org/articles/97033/elife-97033-fig4-data1-v1.xlsx
Figure 4—figure supplement 1
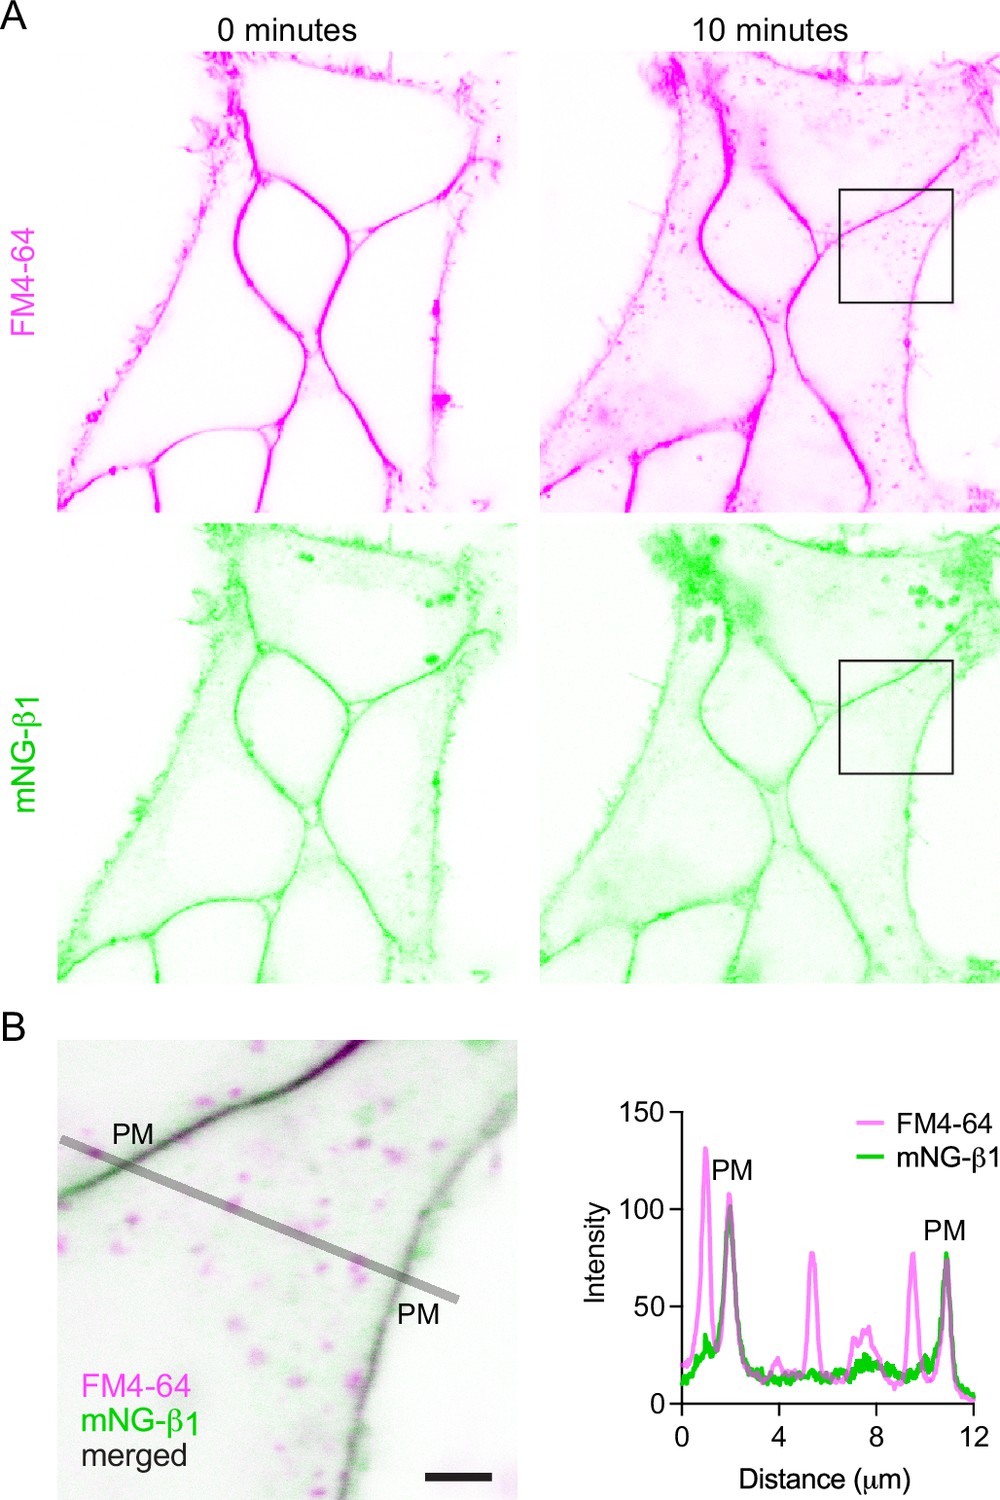
Constitutive endocytosis of G proteins is inefficient.
(A) Images of mNG-β1 cells immediately after and 10 minutes after staining with FM4-64. (B) An absolute fluorescence intensity line profile for mNG-β1 and FM4-64; scale bar is 2 μm. In this example absolute fluorescence intensity at the plasma membrane (PM) was similar for the two labels.
Figure 4—figure supplement 2

mNG-HRas ct is less abundant on endocytic vesicles than the plasma membrane.
(A) mNG-HRas ct colocalizes with newly internalized endocytic vesicles labeled with FM4-64 (arrowheads); scale bar is 2 μm. (B) A fluorescence intensity line profile for mNG-HRas ct and FM4-64 normalized to the peak value of each label at the plasma membrane (PM). (C) Mean mNG-HRas ct and FM4-64 fluorescence intensity line profiles drawn across vesicles, normalized to fluorescence intensity at the plasma membrane for each label; mean ±95% CI; n=78 vesicles/cells.
-
Figure 4—figure supplement 2—source data 1
Numerical data for line profiles (panel C).
- https://cdn.elifesciences.org/articles/97033/elife-97033-fig4-figsupp2-data1-v1.xlsx
Figure 5 with 2 supplements

Receptor activation does not change G protein endocytosis.
(A) mNG-β1 colocalizes with newly internalized endocytic vesicles labeled with FM4-64 and SNAP-tagged β2 adrenergic receptor (β2AR) labeled with Alexa Fluor 674; scale bar is 5 μm. Cells were stimulated with 10 μM isoproterenol for 15 min to induce β2AR internalization. (B) A fluorescence intensity line profile for mNG-β1, FM4-64 and β2AR normalized to the peak value of each label at the plasma membrane (PM). (C) Mean mNG-β1, FM4-64 and β2AR fluorescence intensity line profiles drawn across vesicles, normalized to fluorescence intensity at the plasma membrane for each marker; mean ± 95% CI; n=91 vesicles/cells. (D) Normalized peak mNG-β1/FM4-64 did not differ between vesicles that contained receptors (R; n=91) and vesicles formed by constitutive endocytosis (no R; n=45); n.s., not significant, p=0.20, unpaired t-test. (E) Bystander BRET between HiBit-β1 and markers of early endosomes (EE), recycling endosomes (RE) and late endosomes (LE) was unchanged after 30 minutes of receptor activation with isoproterenol (Iso; 10 μM), dopamine (DA; 100 μM) or acetylcholine (Ach; 100 μM) compared to the DPBS vehicle alone (control); mean ± SD, n=4 independent experiments; no agonist-treated group was significantly different from the control, paired t-test with a false discovery rate (FDR) of 1%.
-
Figure 5—source data 1
Numerical data for line profiles (panel C), intensity ratios (panel D) and bystander BRET (panel E).
- https://cdn.elifesciences.org/articles/97033/elife-97033-fig5-data1-v1.xlsx
Figure 5—figure supplement 1

Transient translocation of endogenous HiBit-β1 from the plasma membrane to intracellular compartments during activation.
(A) Bystander BRET between HiBit-β1 and a Venus-tagged marker of the plasma membrane (PM) decreased, whereas BRET between HiBit-β1 and a Venus-tagged markers of the endoplasmic reticulum (ER), early endosomes (EE), recycling endosomes (RE) and late endosomes (LE) increased during receptor activation with isoproterenol (Iso; 10 μM), dopamine (DA; 100 μM) or acetylcholine (Ach; 100 μM) compared to the DPBS vehicle alone (control); mean ± SD, n=5 independent experiments; all agonist-treated groups were significantly different from the control, paired t-test with a false discovery rate (FDR) of 1%. (B) Time course of bystander BRET between HiBit-β1 and a Venus-tagged marker of the ER during activation of D2R with DA (100 μM), followed by block of D2R with the antagonist haloperidol (Hal; 10 μM); mean ± 95% CI of 24 replicates from n=4 independent experiments.
-
Figure 5—figure supplement 1—source data 1
Numerical data for bystander BRET values (panel A) and traces (panel B).
- https://cdn.elifesciences.org/articles/97033/elife-97033-fig5-figsupp1-data1-v1.xlsx
Figure 5—figure supplement 2

G protein abundance on endosomes after GPCR and G protein activation.
Bystander BRET between HiBit-β1 and markers of early endosomes (EE), recycling endosomes (RE) and late endosomes (LE) was largely unchanged after 5 min (A) or 15 min (B) of receptor activation with isoproterenol (Iso; 10 μM), dopamine (DA; 100 μM), or acetylcholine (Ach; 100 μM) compared to the DPBS vehicle alone (control); mean ± SD, n=4 independent experiments; only two agonist-treated groups (indicated with *) were significantly different from the control, paired t-test with a false discovery rate (FDR) of 1%.
-
Figure 5—figure supplement 2—source data 1
Numerical data for bystander BRET (panels A and B).
- https://cdn.elifesciences.org/articles/97033/elife-97033-fig5-figsupp2-data1-v1.xlsx
Tables
Key resources table
| Reagent type (species) or resource | Designation | Source or reference | Identifiers | Additional information |
|---|---|---|---|---|
| Gene (Homo sapiens) | GNB1 | GenBank | Gene ID: 2782 | Gene (Homo sapiens) |
| Cell line (Homo sapiens) | HEK293 | ATCC | CRL-1573; RRID:CVCL_0045 | Cell line (Homo sapiens) |
| Cell line (Homo sapiens) | HEK293T expressing mNG2(1–10) | PMID:35271311 | Obtained from Manuel Leonetti | |
| Cell line (Homo sapiens) | HiBit-β1 | This paper | See Materials and Methods | |
| Cell line (Homo sapiens) | mNG-β1 | This paper | See Materials and Methods | |
| Sequence-based reagent | crRNA | Integrated DNA Technologies | See Materials and Methods | |
| Sequence-based reagent | tracrRNA | Integrated DNA Technologies | See Materials and Methods | |
| Sequence-based reagent | ssODN HDR donor | Integrated DNA Technologies | See Materials and Methods | |
| Recombinant protein | Cas9 Nuclease V3 | Integrated DNA Technologies | 1081059 | |
| Recombinant DNA reagent | mRuby-Golgi-7 | Addgene | 55865 | |
| Recombinant DNA reagent | mRuby2-Rab5a-7 | Addgene | 55911 | |
| Recombinant DNA reagent | mCherry-Rab7a-7 | Addgene | 55127 | |
| Recombinant DNA reagent | mCherry-Rab11a-7 | Addgene | 55124 | |
| Recombinant DNA reagent | pmCherry-2xFYVE | Addgene | 140050 | |
| Recombinant DNA reagent | mCherry-TGNP-N-10 | Addgene | 55145 | |
| Recombinant DNA reagent | Lamp1-mScarlet-I | Addgene | 98827 | |
| Recombinant DNA reagent | Venus-2xFYVE | This paper | Venus version of pmCherry-2xFYVE | |
| Recombinant DNA reagent | mRuby2-MOA | This paper | mRuby2 version of Venus-MOA | |
| Recombinant DNA reagent | mRuby2-PTP1b | This paper | mRuby2 version of Venus-PTP1b | |
| Recombinant DNA reagent | Venus-kras | PMID:21364942 | ||
| Recombinant DNA reagent | Venus-PTP1b | PMID:22816793 | ||
| Recombinant DNA reagent | Venus-MOA | PMID:22816793 | ||
| Recombinant DNA reagent | Venus-rab5a | PMID:21364942 | ||
| Recombinant DNA reagent | Venus-rab7a | PMID:27528603 | ||
| Recombinant DNA reagent | Venus-rab11a | PMID:27528603 | ||
| Recombinant DNA reagent | memGRKct-Venus | PMID:19258039 | ||
| Chemical compound | PEI Max | Polysciences | 24765 | |
| Other | CellMask Deep Red | ThermoFisher | C10046 | 1:1,000 |
| Other | LysoView 633 | Biotium | 70058 | 1:1,000 |
| Other | CF 640 dextran | Biotium | 80115 | 25 μg ml–1 |
| Other | FM4-64; SynaptoRed | Sigma-Aldrich | 574799 | 5 μM |
| Software | CRISPResso2 | PMID:30809026 | RRID:SCR_024503 | |
| Software | ImageJ | imagej.net/ij/ | RRID:SCR_003070 | |
| Software | GraphPad Prism | graphpad.com | RRID:SCR_002798 |
Additional files
Download links
A two-part list of links to download the article, or parts of the article, in various formats.
Downloads (link to download the article as PDF)
Open citations (links to open the citations from this article in various online reference manager services)
Cite this article (links to download the citations from this article in formats compatible with various reference manager tools)
Visualization of endogenous G proteins on endosomes and other organelles
eLife 13:RP97033.
https://doi.org/10.7554/eLife.97033.3


