Rate of brain aging associates with future executive function in Asian children and older adults
- Integrative Sciences and Engineering Programme, NUS Graduate School, National University of Singapore, Singapore
- Yong Loo Lin School of Medicine, National University of Singapore, Singapore
- Saw Swee Hock School of Public Health, National University of Singapore and National University Health System, Singapore
- Memory Aging and Cognition Centre, National University Health System, Singapore
- Singapore Eye Research Institute, Singapore National Eye Centre, Singapore
- Duke-NUS Medical School, Singapore
- Singapore Institute for Clinical Sciences (SICS), A*STAR Research Entities (ARES), Singapore
- Brain–Body Initiative Program, Agency for Science, Technology and Research (A*STAR), Singapore
- National University Health System, Singapore
- Liggins Institute, University of Auckland, New Zealand
- Douglas Mental Health University Institute, McGill University, Canada
- Strategic Research Program, A*STAR Research Entities (ARES), Singapore
- Department of Electrical and Computer Engineering, National University of Singapore, Singapore
- N.1 Institute for Health & Institute for Digital Medicine (WisDM), National University of Singapore, Singapore
Figures
Figure 1
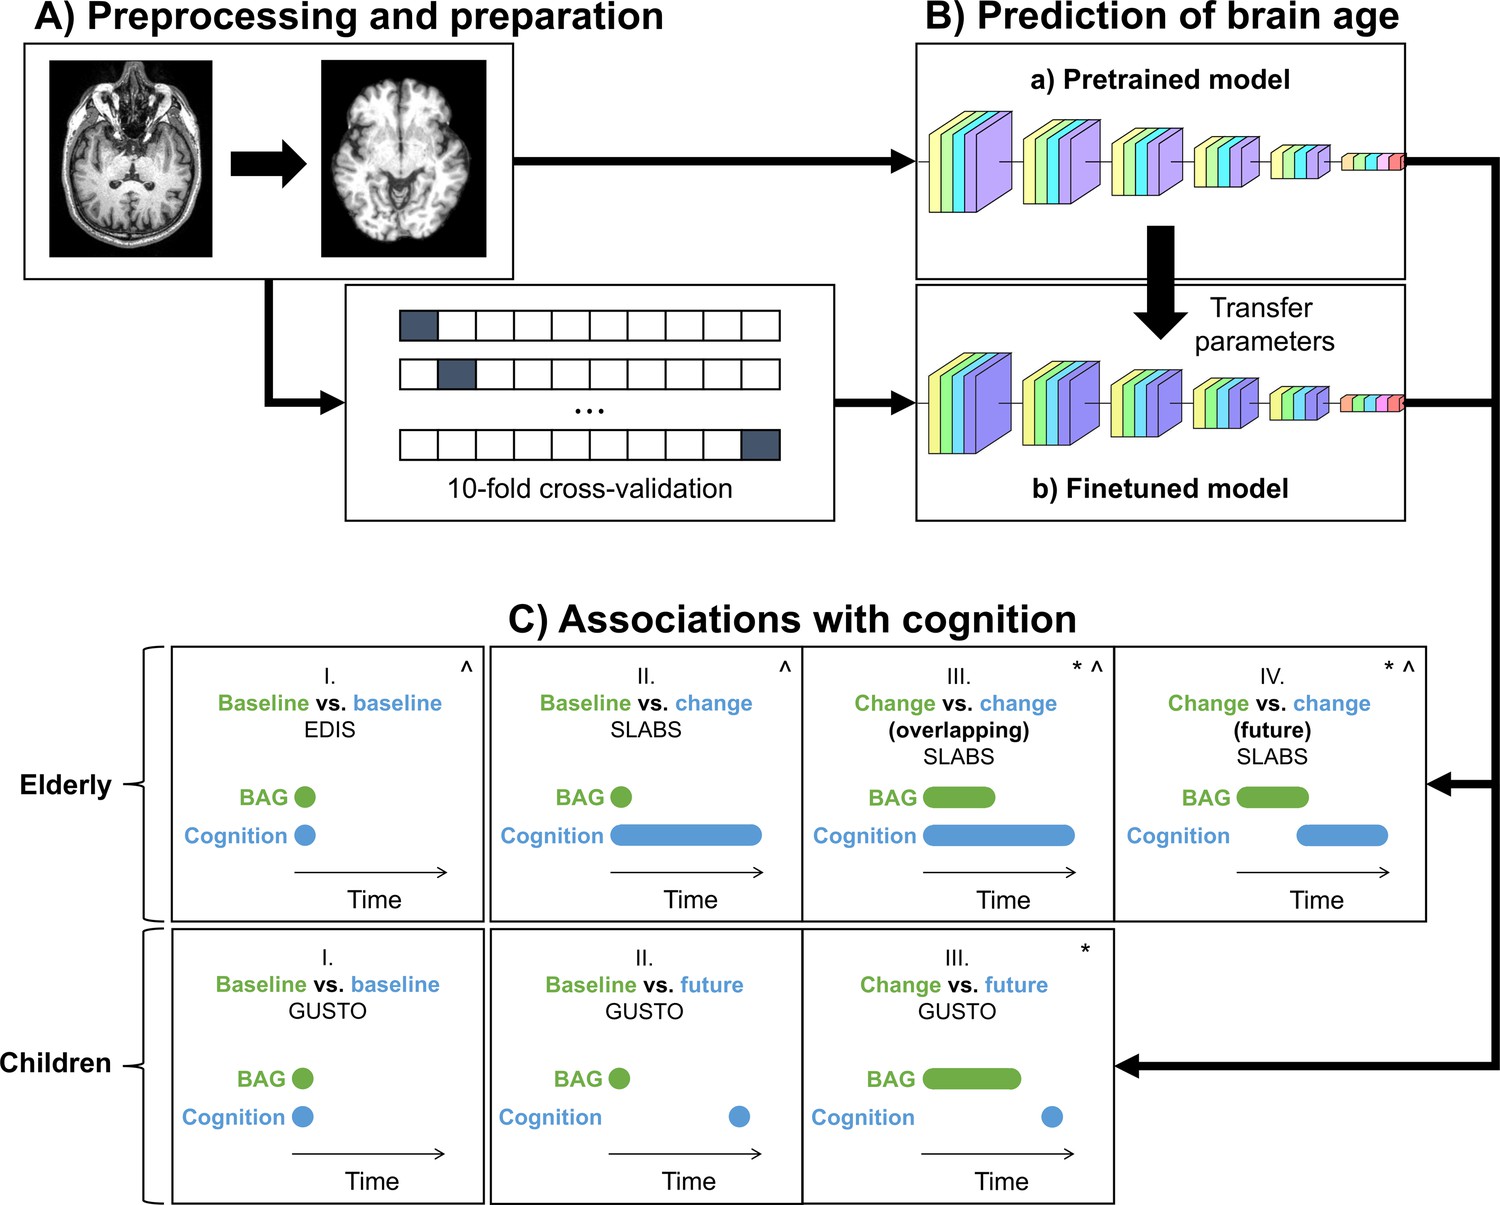
Study design schematic.
(A, B) T1 MRI scans were minimally preprocessed according to the simple fully convolutional network (SFCN) pipeline (Leonardsen et al., 2022). These were (a) directly input into the pretrained brain age model or (b) split into 10 cross-validation folds to finetune the model. The finetuned model transferred the weights from the pretrained model for initialization. All layers were then retrained. Age predictions were obtained on the test folds. BAG was calculated by subtracting chronological age from predicted age. Model interpretability was interrogated using guided backpropagation. (C) Cross-sectional and longitudinal association of BAG and cognitive performance were tested using multiple linear regression models in both elderly and children. Time intervals for BAG and cognition, based on data availability, are shown schematically. Annual rate of change was calculated from a linear regression with time for each participant. All models included chronological age and sex as covariates.:^ models for elderly also included years of education as a covariate;* models with (annual rate of) change in BAG also included baseline BAG as a covariate. EDIS, Epidemiology of Dementia in Singapore; SLABS, Singapore-Longitudinal Aging Brain Study; GUSTO, Growing Up in Singapore Towards healthy Outcomes; BAG, brain age gap.
Figure 2 with 1 supplement
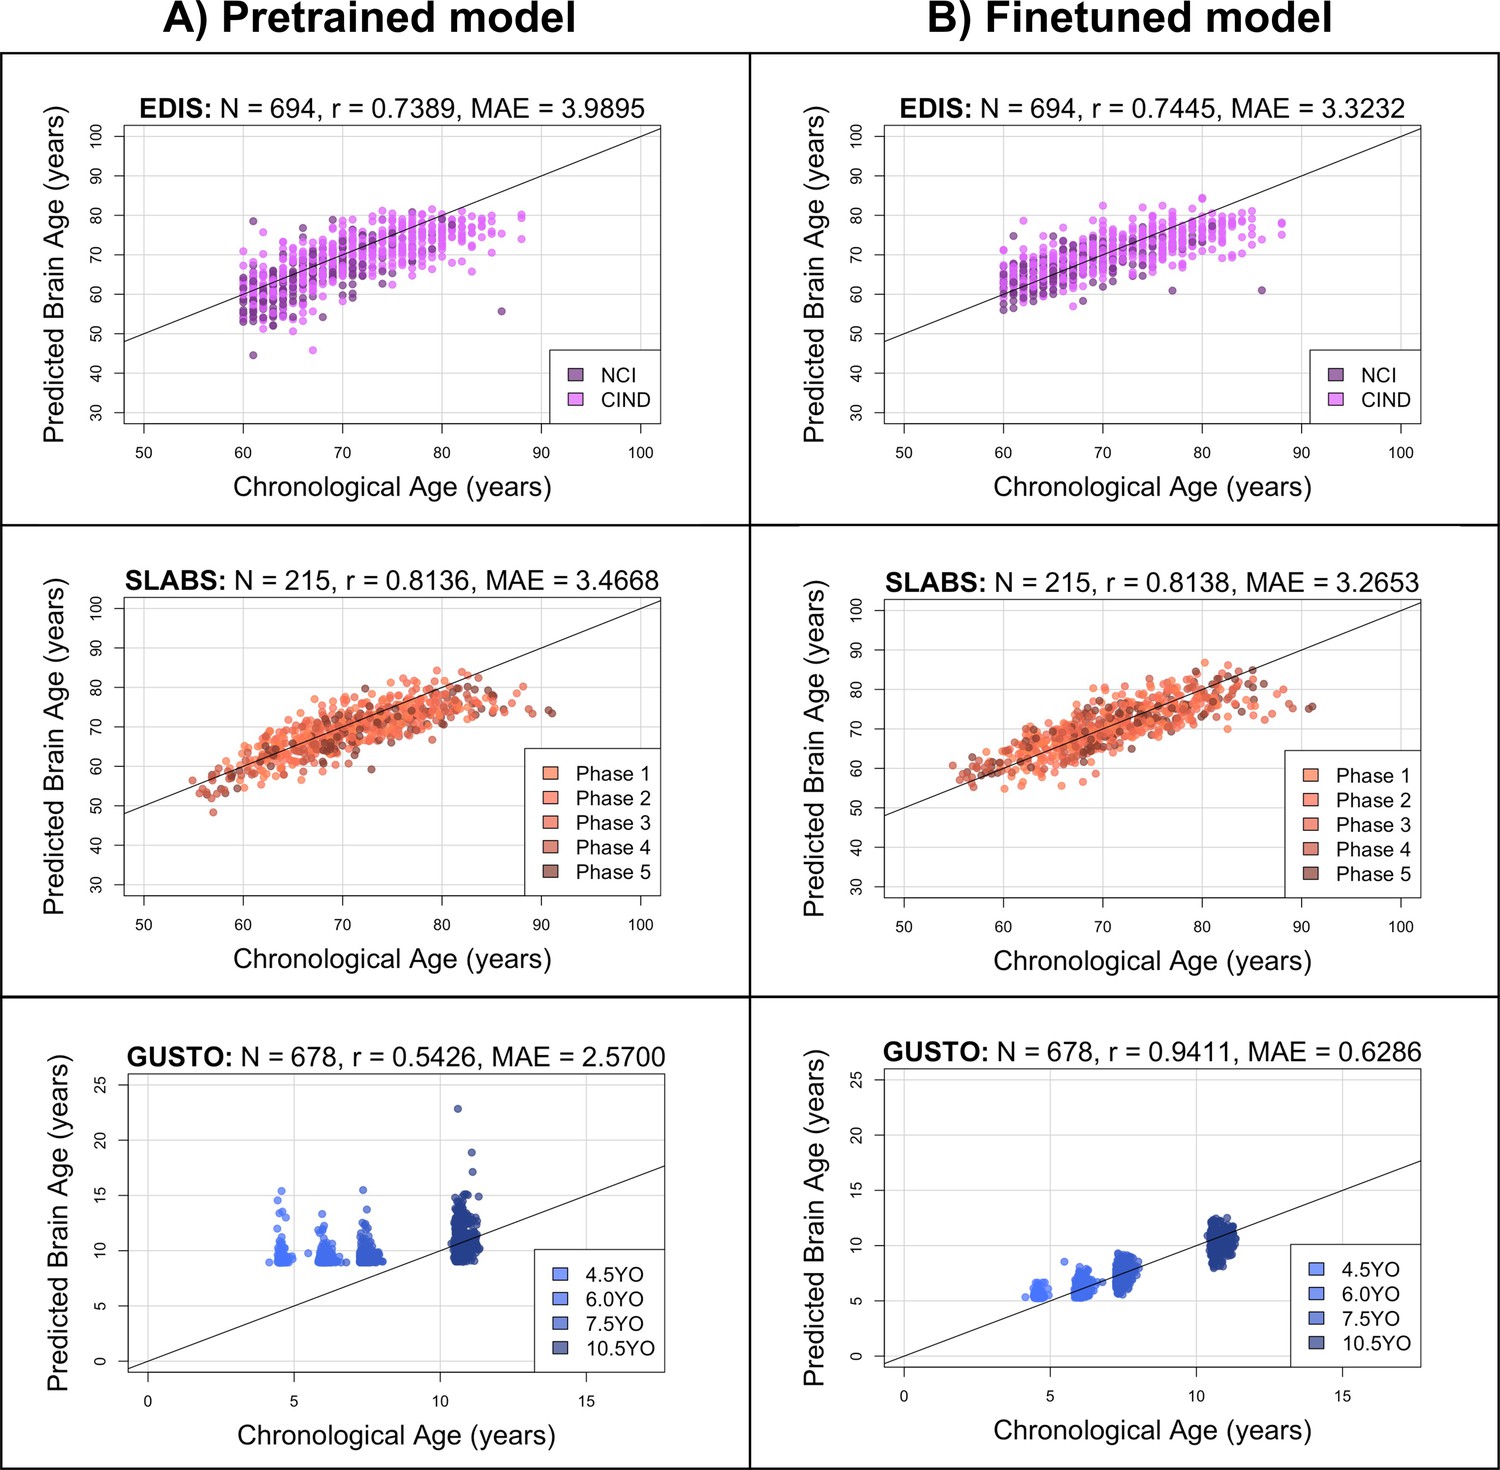
The pretrained brain age model performs well in elderly participants, while the finetuned model performs well in both elderly participants and children.
Black identity lines representing perfect prediction are included for reference. (A) Predicted brain ages from the pretrained model are plotted against chronological age. They are highly correlated for EDIS and SLABS (elderly), but not GUSTO (children). (B) Predicted brain ages from the finetuned model are plotted against chronological age. They are highly correlated in all three datasets. EDIS, Epidemiology of Dementia in Singapore; SLABS, Singapore-Longitudinal Aging Brain Study; GUSTO, Growing Up in Singapore Towards healthy Outcomes; N, number of participants; r, Pearson’s correlation coefficient; MAE, mean absolute error; NCI, no cognitive impairment; CIND, cognitive impairment no dementia.
Figure 2—figure supplement 1
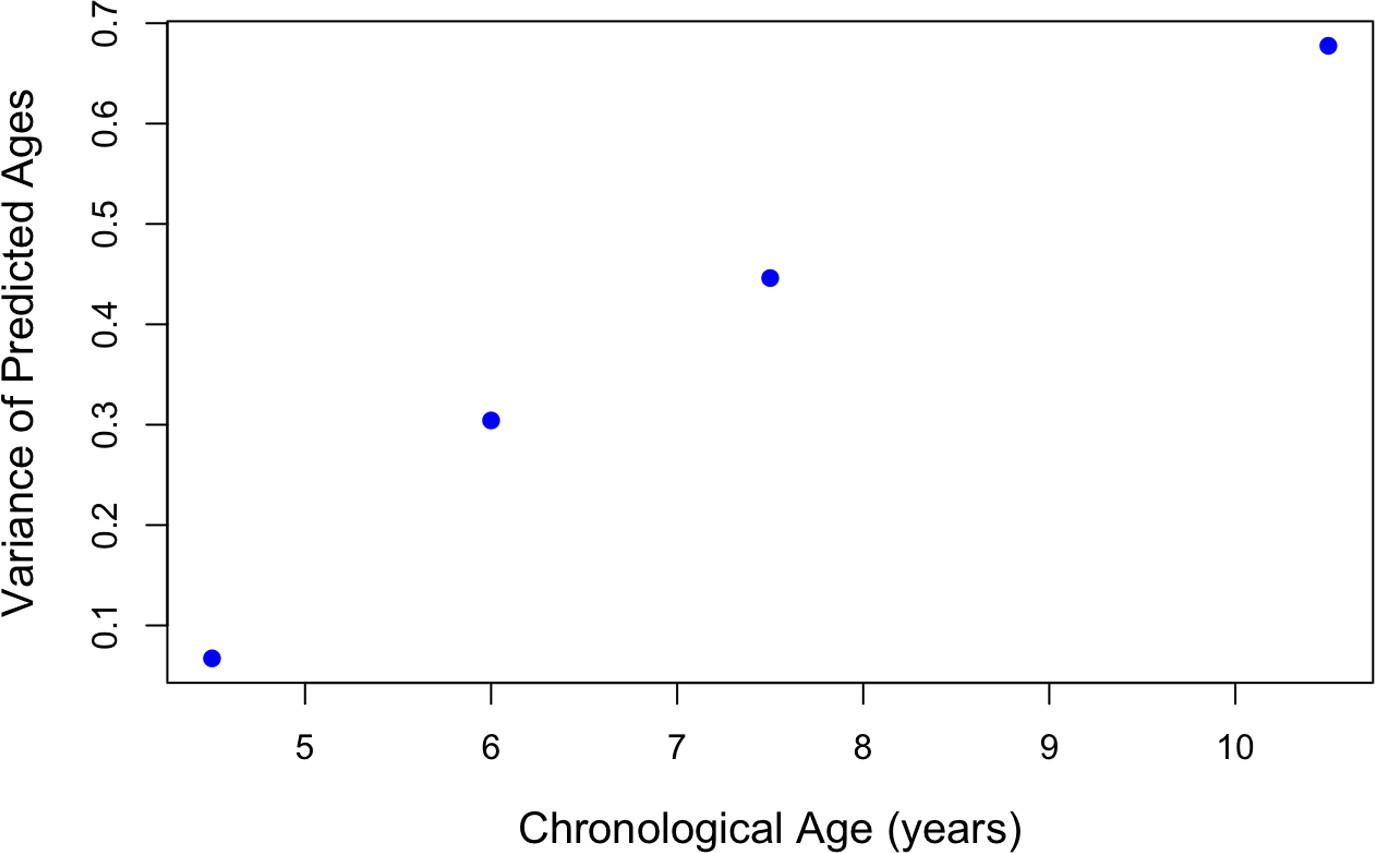
Variance of finetuned predicted ages by age group in Growing Up in Singapore Towards healthy Outcomes GUSTO.
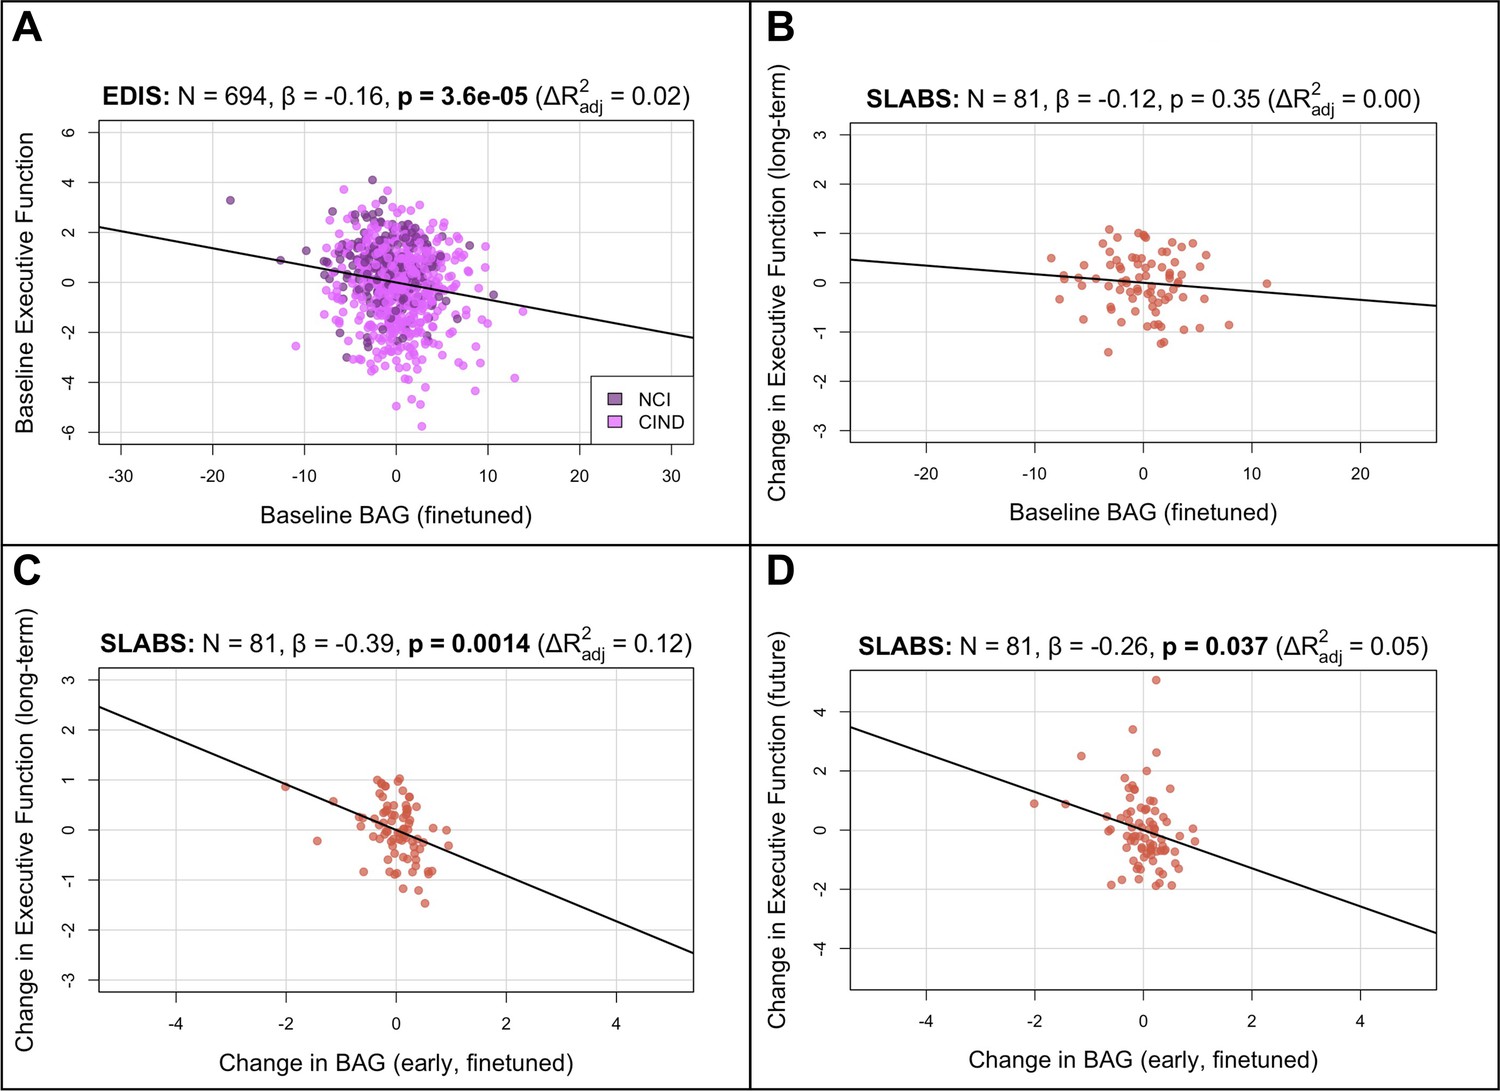
Figure 3 with 1 supplement
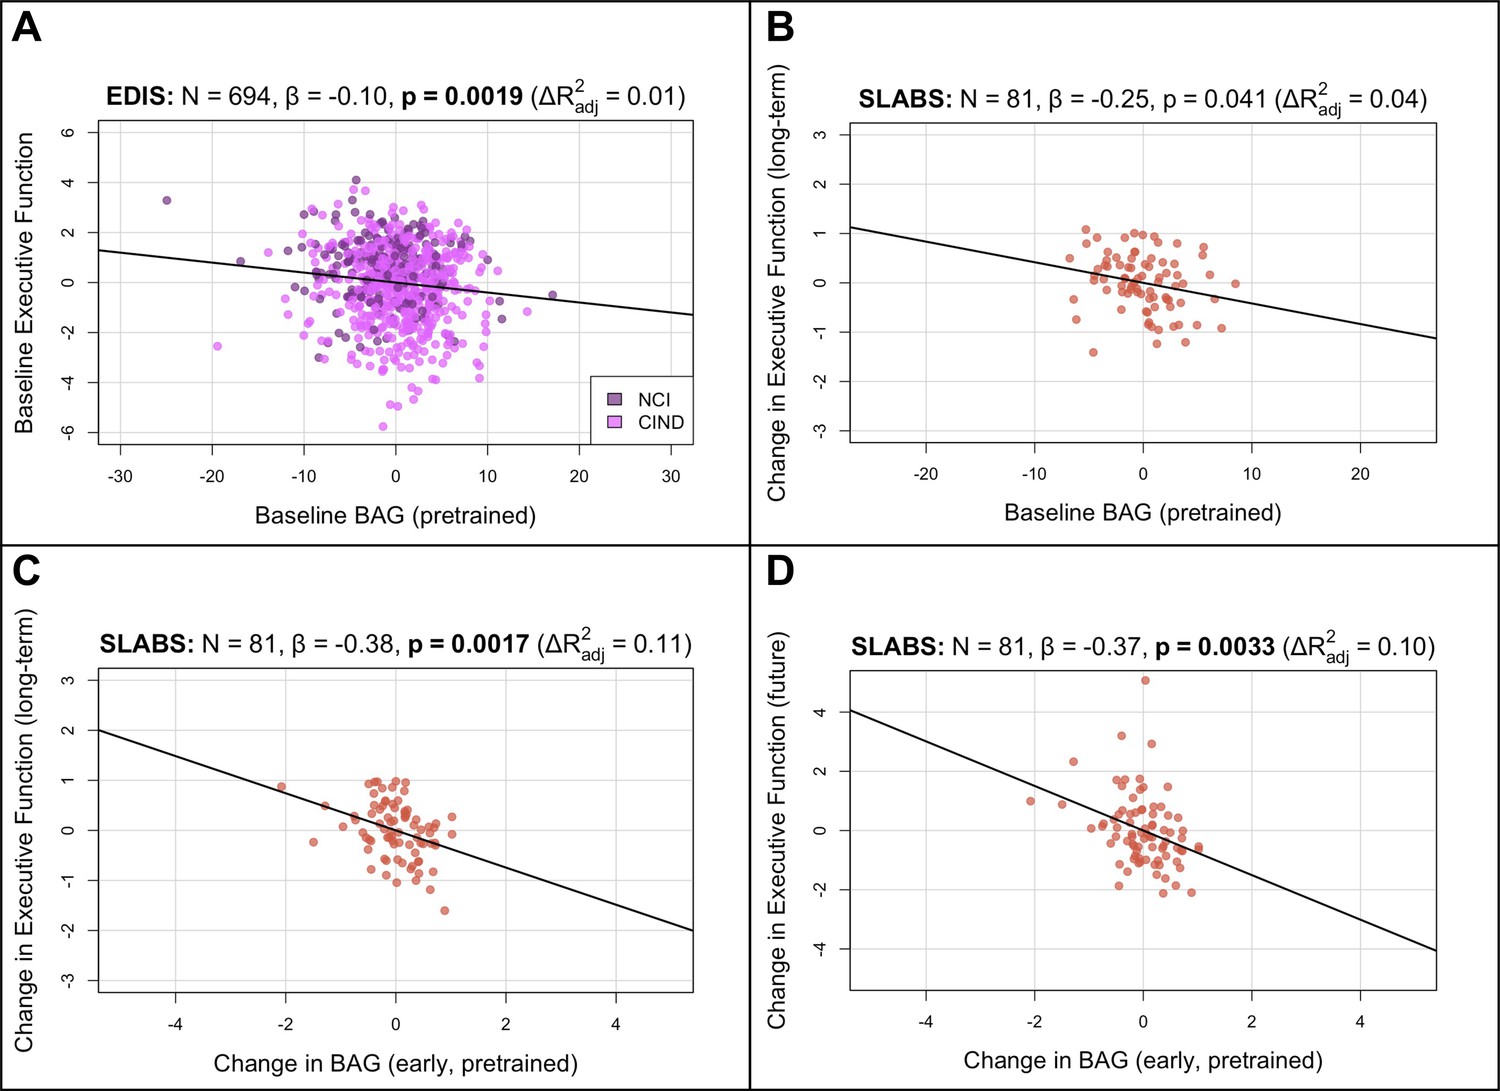
BAG from the pretrained model is negatively associated with executive function in elderly participants.
Bolded p-values indicate significance after Holm-Bonferroni correction (). All models include chronological age, sex, and years of education as covariates. Models with change in BAG also include baseline BAG as a covariate. Results are similar after finetuning (Figure 3—figure supplement 1). (A) Partial regression plot between baseline BAG and executive function in EDIS, colored by cognitive status. A significant negative association is observed. (B) Partial regression plot between baseline BAG and long-term rate of change in executive function (mean follow-up time = years) in SLABS. A negative association is observed, but it is not significant after correcting for multiple comparisons. (C) Partial regression plot of early longitudinal rate of change in BAG (mean follow-up time = years) when added to the model in (B). A significant negative association and increase in is observed. (D) Partial regression plot as in (C), but with future rate of change in executive function (mean follow-up time = years), removing the overlap with early change in BAG. A significant negative association is again observed. N, number of participants; β, standardized regression coefficient; p, p-value for variable of interest (x-axis); , change in adjusted when adding variable of interest; BAG, brain age gap; NCI, no cognitive impairment; CIND, cognitive impairment no dementia; EDIS, Epidemiology of Dementia in Singapore; SLABS – Singapore-Longitudinal Aging Brain Study.
Figure 3—figure supplement 1
Brain age gap from the finetuned model remains negatively associated with executive function in elderly.
Compare to Figure 3A–D. (A) EDIS dataset: baseline BAG relates to baseline execituve function. (B) SLABS dataset: Baseline BAG does not relate to future changes in executive function. (C, D) SLABS dataset: Change in BAQ relates to future changes in executive function (non-overlapping in C and overlaping in D).
Figure 4 with 2 supplements
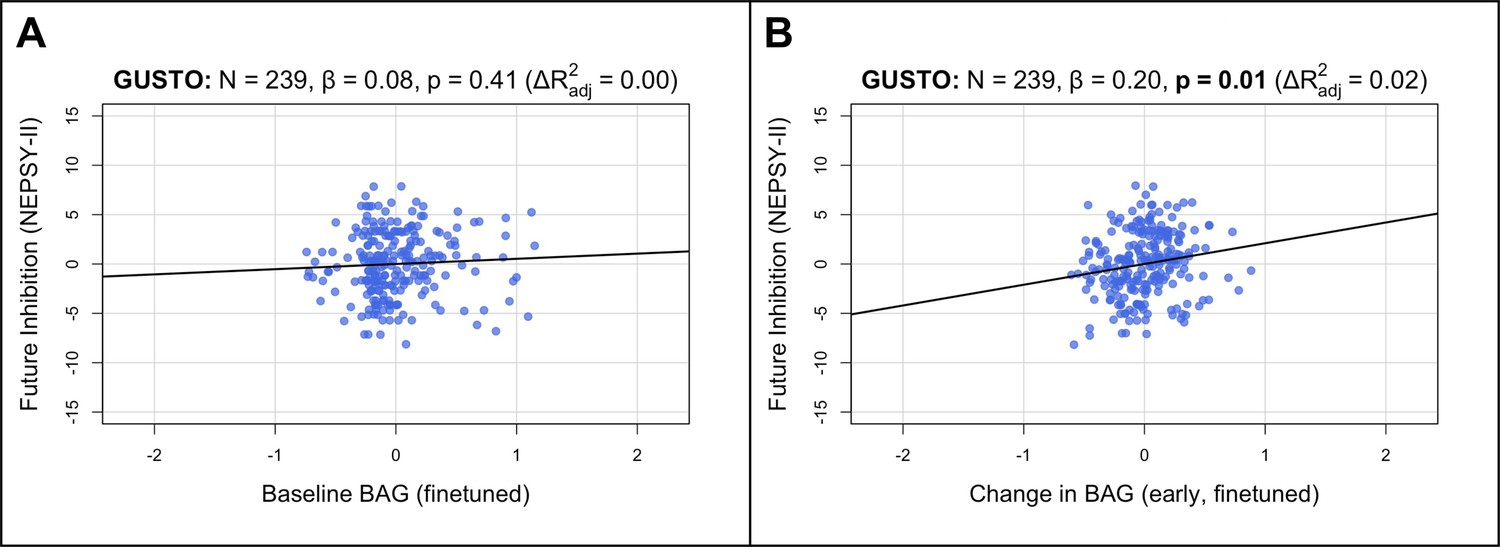
Longitudinal BAG from the finetuned model is positively associated with inhibition in children.
Bolded p-values indicate significance after Holm–Bonferroni correction (). All models include chronological age and sex as covariates. Models with change in BAG also include baseline BAG as a covariate. (A) Partial regression plot between baseline BAG (calculated from 4.5 or 6.0 years old) and future NEPSY-II inhibition scaled subscore (measured at 8.5 years old). No significant association is observed. (B) Partial regression plot of early longitudinal rate of change in BAG calculated from 4.5 to 7.5 years old (mean follow-up time = 2.4 ± 0.7 years) when added to the model in (A). A significant positive association and increase in is observed. N, number of participants; β, standardized regression coefficient; p, p-value for variable of interest (x-axis); , change in adjusted when adding variable of interest; BAG, brain age gap; GUSTO, Growing Up in Singapore Towards healthy Outcomes.
Figure 4—figure supplement 1
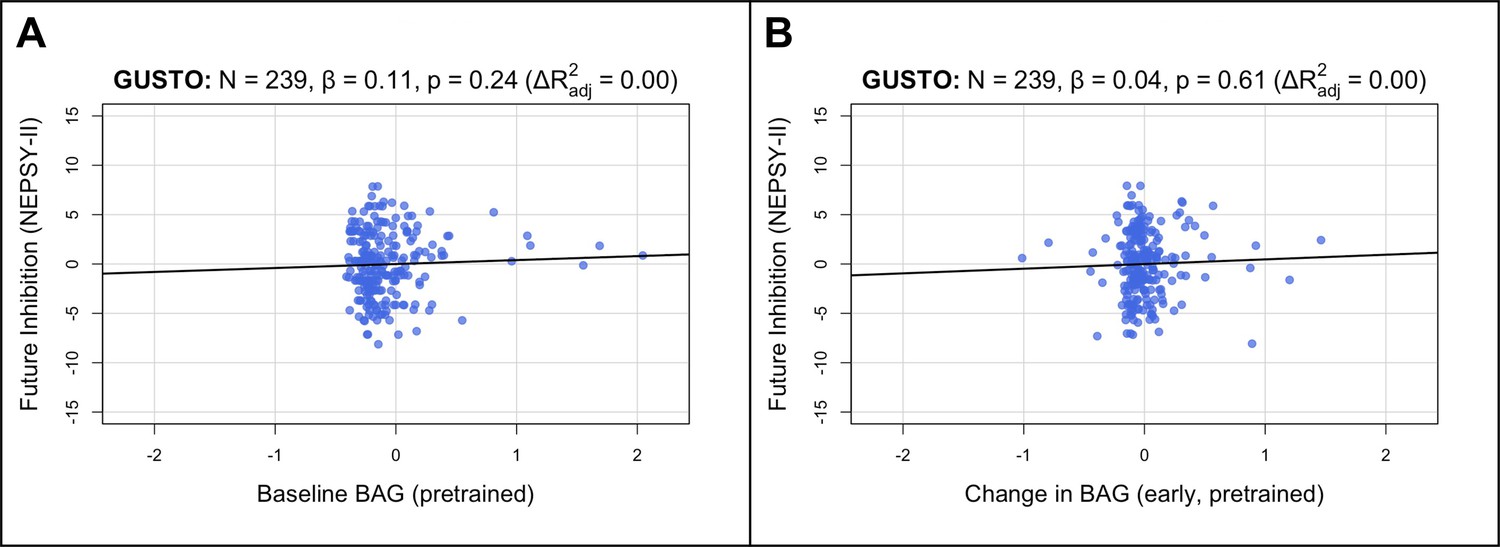
Brain age gap (BAG) from the pretrained model is not associated with inhibition in children.
Estimated BAGs > 2 are not shown for visual clarity. Compare to Figure 4A and B.
Figure 4—figure supplement 2
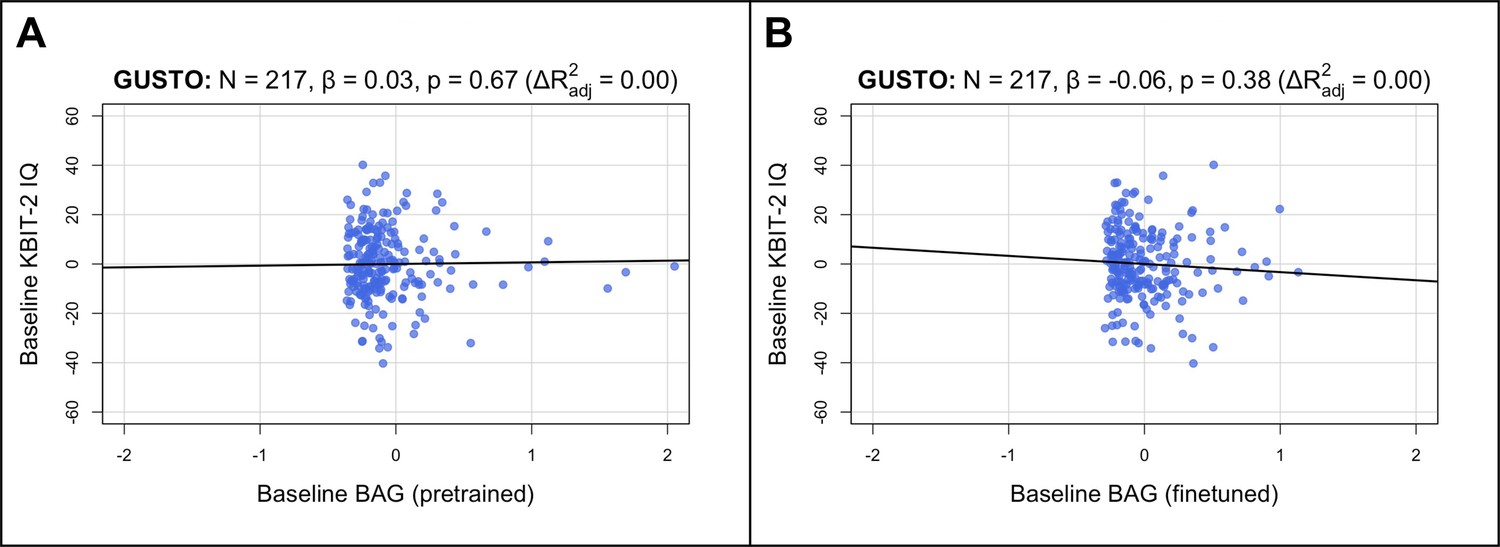
Baseline BAG is not associated with baseline IQ in children.
Both brainage and IQ were measured cross-sectionally at 4.5 years old. (A) Partial regression plot with baseline BAG from the pretrained model. Estimated BAGs > 2 are not shown for visual clarity. No significant relationship is observed. (B) Partial regression plot with baseline BAG from the finetuned model. No significant relationship is observed. N, number of participants; β, standardized regression coefficient; p, p-value for variable of interest (x-axis); Multiple , coefficient of determination; GUSTO, Growing Up in Singapore Towards healthy Outcomes; BAG, brain age gap; KBIT-2, Kaufman Brief Intelligence Test Second Edition.
Figure 5 with 1 supplement
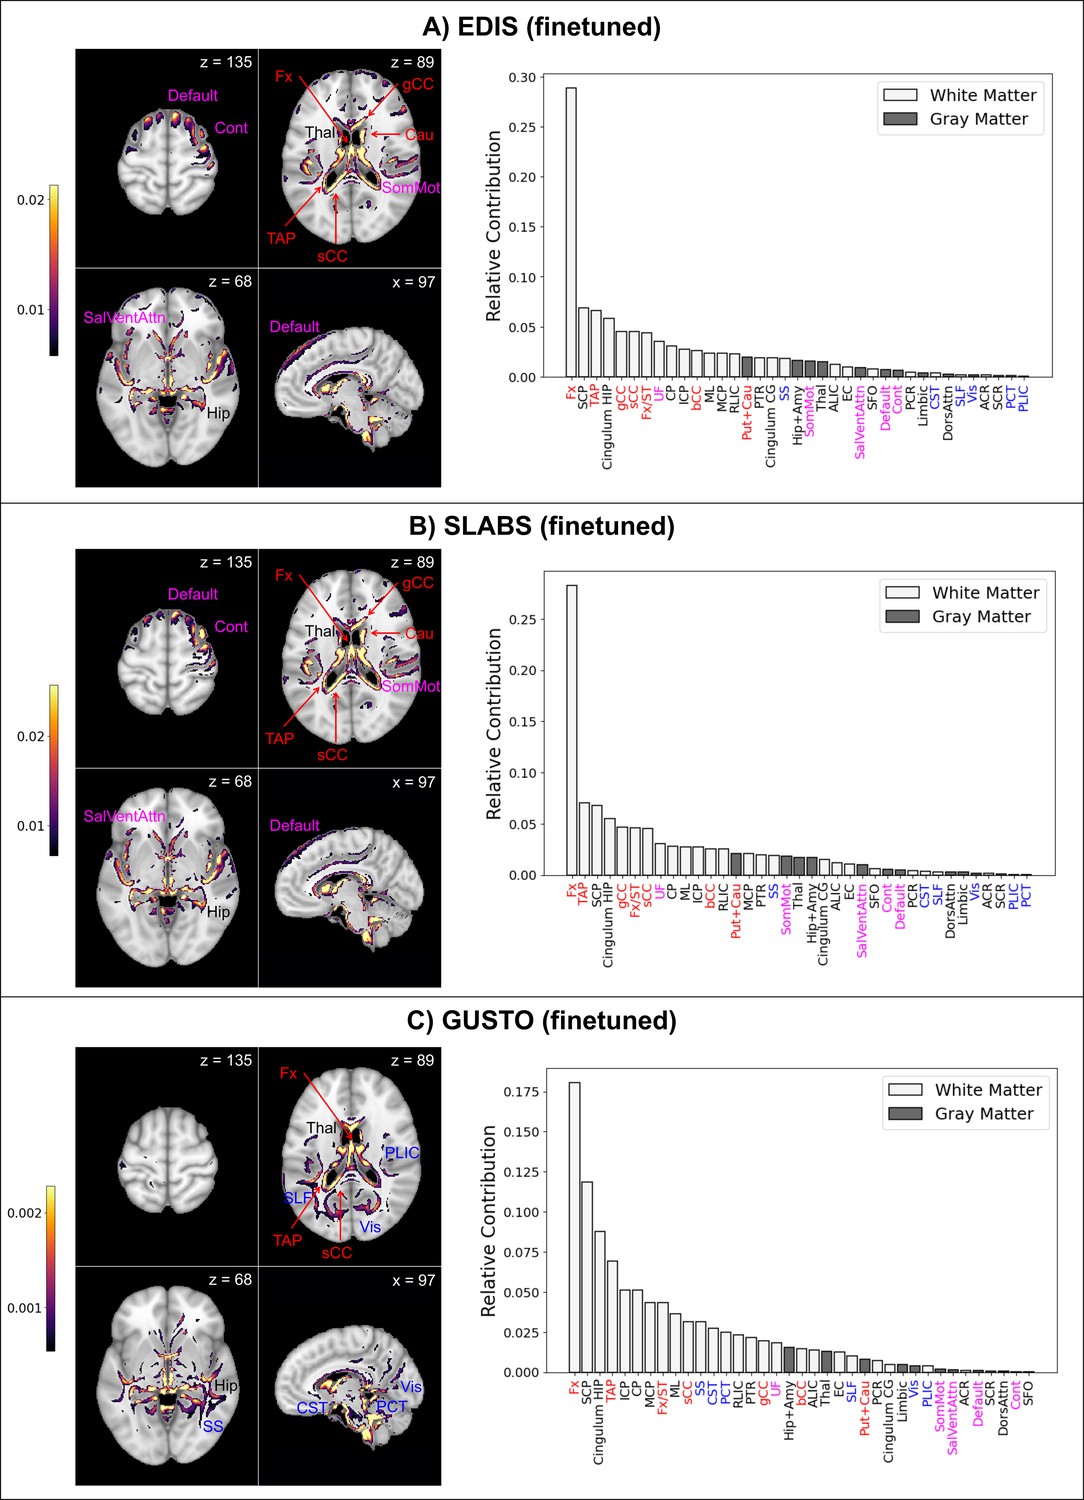
Finetuned brain age models focus on distinct features in children and elderly participants.
The top 10% of features are shown for four representative brain slices on the left. Relative contributions for gray and white matter features across the whole brain are shown on the right. Regions near the lateral ventricles are labeled in red. Features more prominent in elderly than children are labeled in magenta, while features more prominent in children than elderly are labeled in blue. Features and relative contributions are generally consistent between (A) EDIS and (B) SLABS, but key differences can be seen in (C) GUSTO. EDIS, Epidemiology of Dementia in Singapore; SLABS, Singapore-Longitudinal Aging Brain Study; GUSTO,Growing Up in Singapore Towards healthy Outcomes; MCP,–middle cerebellar peduncle; PCT, Pontine crossing tract; gCC, genu of corpus callosum; bCC, body of corpus callosum; sCC, splenium of corpus callosum; Fx, fornix (column and body); CST, corticospinal tract; ML, medial lemniscus; ICP, inferior cerebellar peduncle; SCP, superior cerebellar peduncle; CP, cerebral peduncle; ALIC, anterior limb of internal capsule; PLIC, posterior limb of internal capsule; RLIC, retrolenticular part of internal capsule; ACR, anterior corona radiata; SCR, superior corona radiata; PCR, posterior corona radiata; PTR, posterior thalamic radiation; SS, sagittal stratum; EC, external capsule; cingulum CG, cingulum (cingulate gyrus); cingulum HIP, cingulum (hippocampus); Fx/ST, fornix (cres)/stria terminalis; SLF, superior longitudinal fasciculus; SFO, superior fronto-occipital fasciculus; UF, uncinate fasciculus; TAP, tapetum; Vis, visual network; SomMot, somatomotor network; DorsAttn, dorsal attention network; SalVentAttn, salience/ventral attention network; Limbic, limbic network; Cont , control/frontoparietal network; Default, default mode network; Hip+Amy, hippocampus + amygdala; Put+Cau, putamen + caudate; Tha l, thalamus.
Figure 5—figure supplement 1
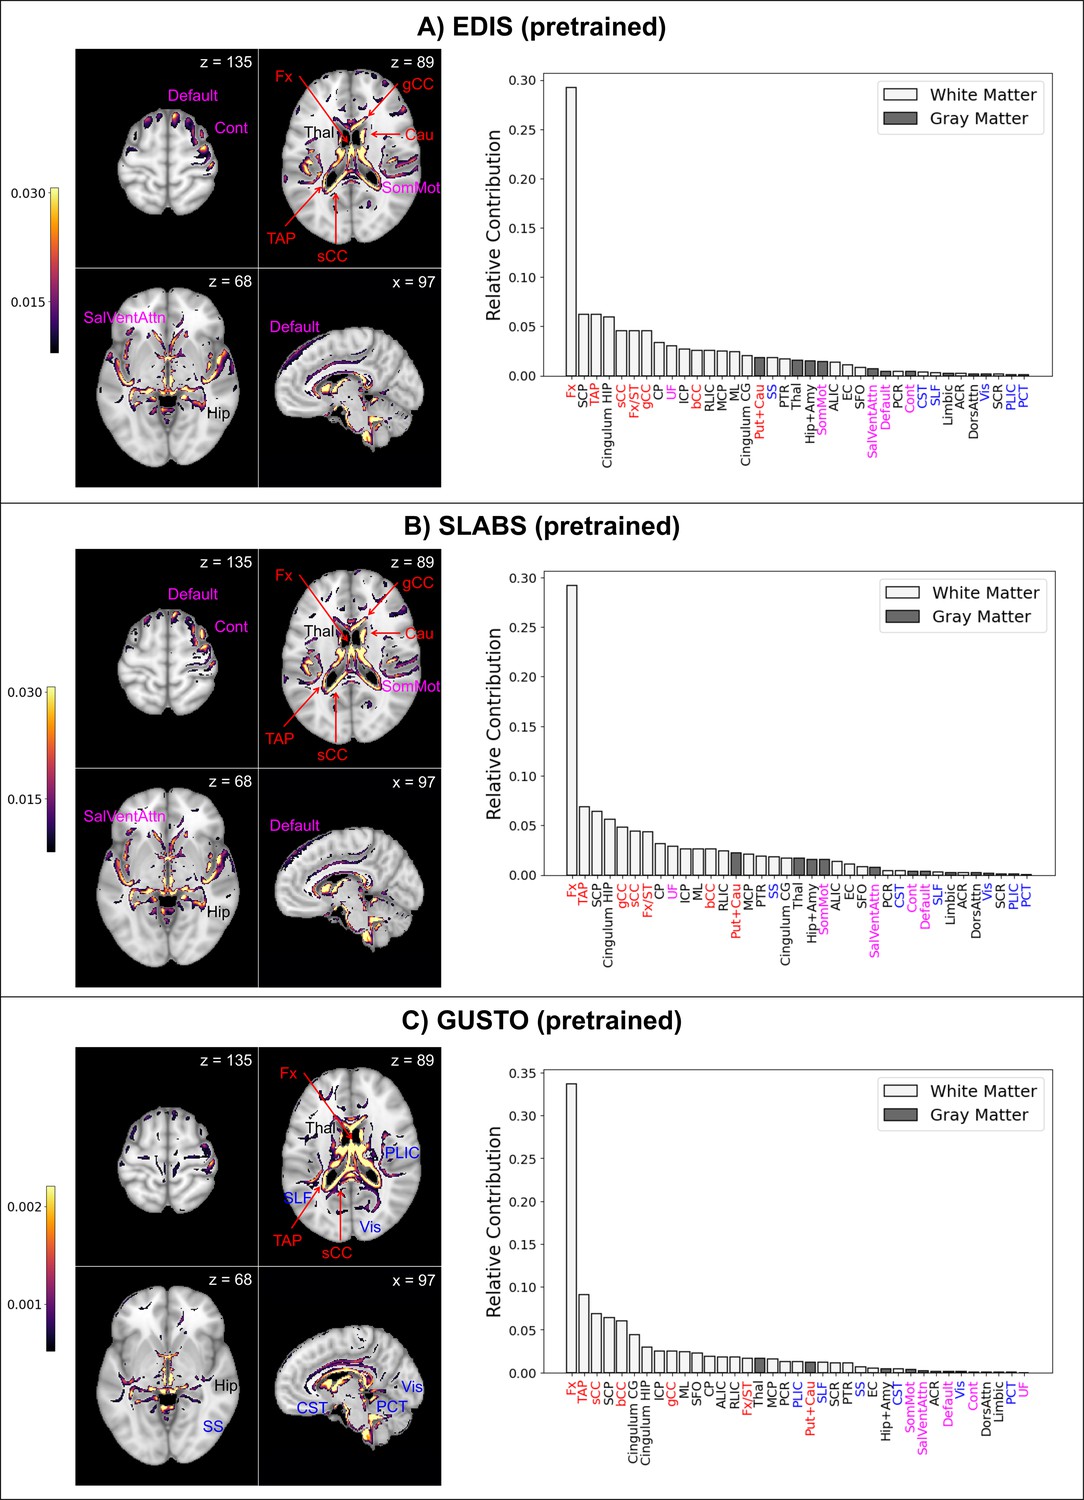
Pretrained models focus on similar features as finetuned models in EDIS and SLABS, but not in GUSTO.
Compare to Figure 5A–C. Features more prominent in elderly than children are labeled in magenta, while features more prominent in children than elderly are labeled in blue. Features and relative contributions are generally consistent between (A) EDIS and (B) SLABS, but key differences can be seen in (C) GUSTO.EDIS, Epidemiology of Dementia in Singapore; SLABS, Singapore-Longitudinal Aging Brain Study; GUSTO, Growing Up in Singapore Towards healthy Outcomes.
Appendix 1—figure 1
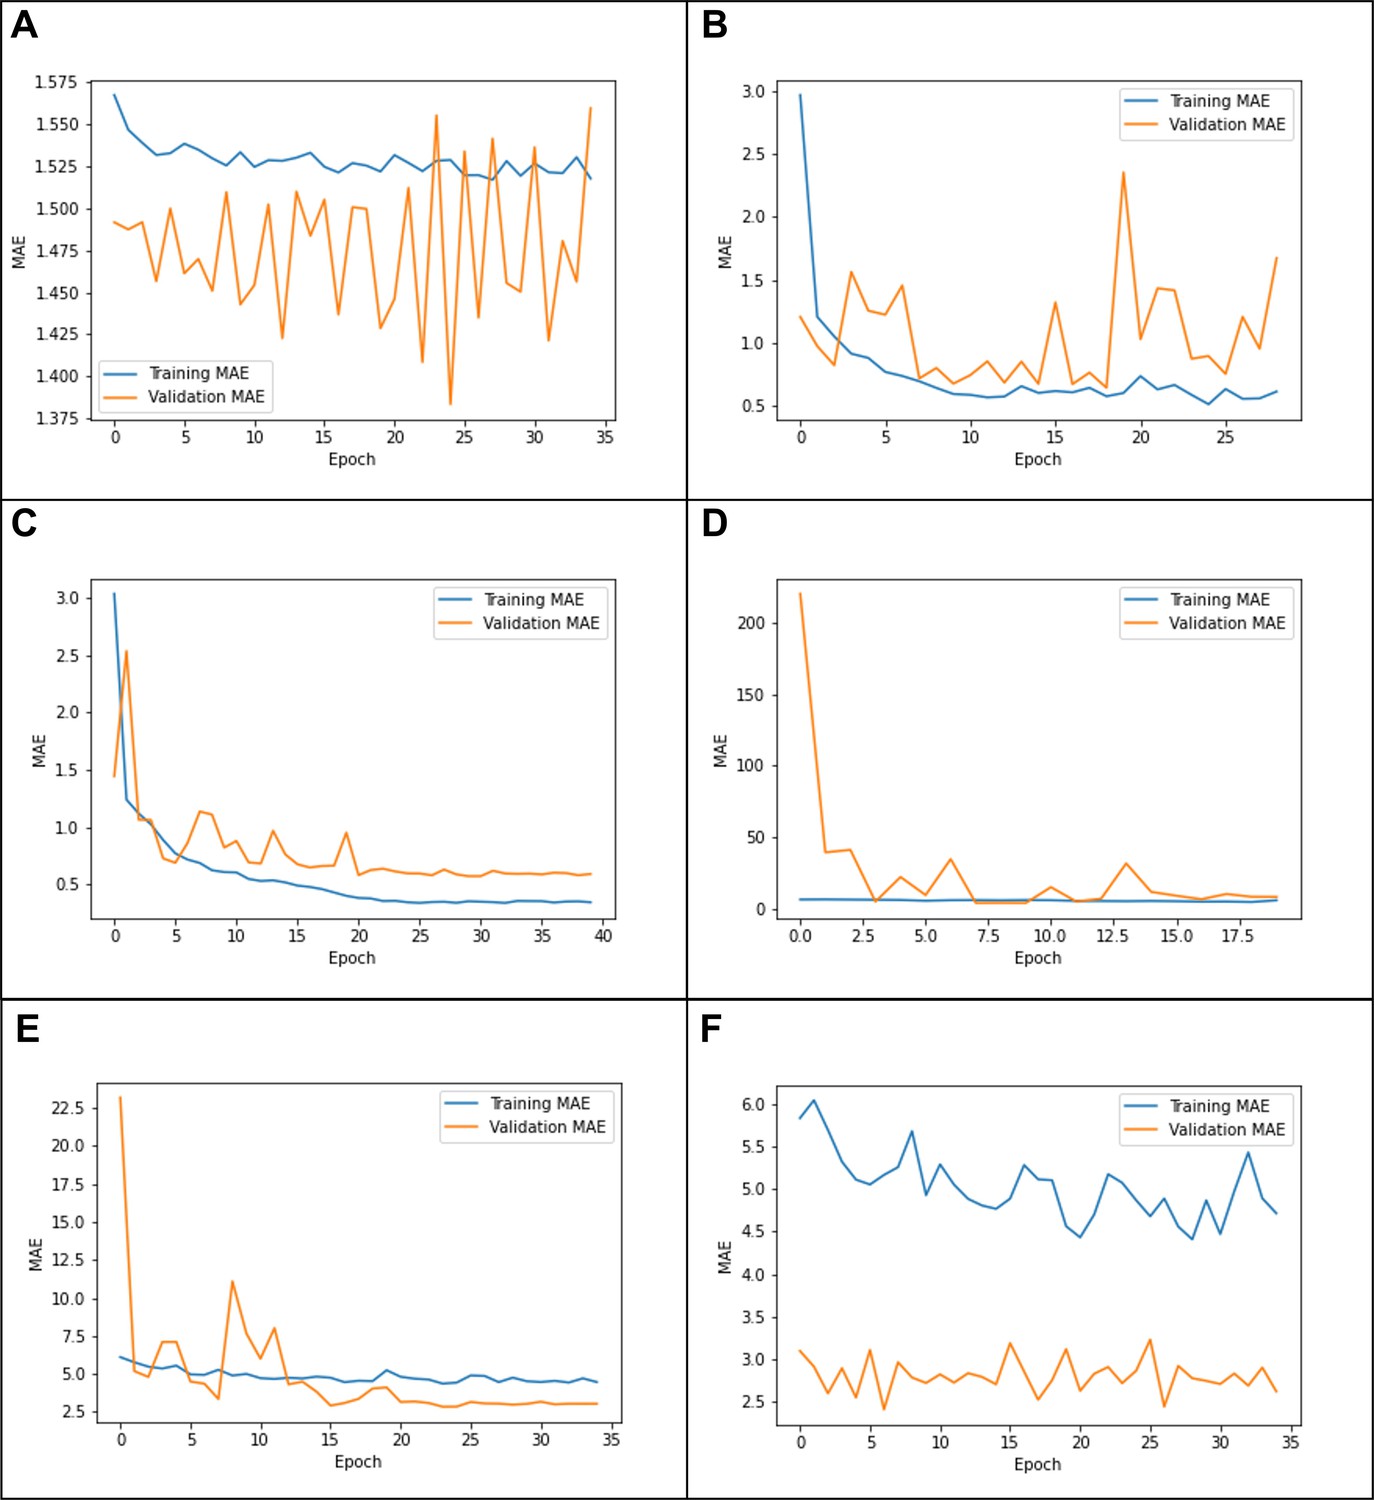
Example learning curves from (A) tuning the last layer only on Growing Up in Singapore Towards healthy Outcomes (GUSTO), showing underfitting; (B) tuning all layers on GUSTO, showing in stability; (C) using a cosine learning rate decay, showing a good fit (D) using the same parameters on Epidemiology of Dementia in Singapore (EDIS),showing ‘forgetting’; (E) using a lower initial learning rate(1e-4) on EDIS, showing a better fit; and (F) using an initial learning rate of 1e-6, showing underfitting.
Author response image 1
Author response image 2

Brain age predictions on unseen Caucasian sample of older adults.
Predictions from the (A) pretrained and (B) finetuned brain age models on ADNI participants. Compare to Figure 2 of the main text.
Tables
Table 1
Participant characteristics at baseline.
EDIS was cross-sectional, while SLABS and GUSTO were longitudinal. Reported as mean ± standard deviation (range). *GUSTO ethnicities were based on the mother. M/F, male/female; C/M/I/O, Chinese/Malay/Indian/Other; MMSE, Mini-Mental State Examination; EDIS, Epidemiology of Dementia in Singapore; SLABS, Singapore Longitudinal Aging Brain Study; GUSTO, Growing Up in Singapore Towards healthy Outcomes.
| Elderly | Children | ||
|---|---|---|---|
| Characteristic | EDIS (N=694) | SLABS (N=215) | GUSTO (N=678) |
| Age (years) | 69.91 ± 6.46 (60−88) | 68.17 ± 6.77 (55−85) | 5.85 ± 1.68 (4.2−11.3) |
| Sex (M/F) | 340/354 | 101/114 | 346/332 |
| Ethnicity (C/M/I/O) | 276/184/234/0 | 215/0/0/0 | 370/187/120/1* |
| Education (years) | 6.18 ± 4.63 (0−22) | 12.02 ± 3.45 (0−21) | N/A |
| MMSE score | 24.13 ± 3.59 (10−30) | 28.29 ± 1.27 (26−30) | N/A |
| Imaging follow-up (years) | N/A | 4.00 ± 3.33 (0−9.59) | 3.49 ± 2.41 (0−6.69) |
| Cognition sample size | N=694 | N=81–212 | N=217–239 |
Appendix 1—table 1
Optimized initial learning rates for each dataset and fold.
EDIS, Epidemiology of Dementia in Singapore; SLABS, Singapore Longitudinal Aging Brain Study; GUSTO, Growing Up in Singapore Towards healthy Outcomes.
| Fold | EDIS | SLABS | GUSTO |
|---|---|---|---|
| 0 | 1e-4 | 1e-4 | 1e-3 |
| 1 | 1e-4 | 1e-4 | 1e-3 |
| 2 | 1e-4 | 1e-5 | 1e-3 |
| 3 | 1e-4 | 1e-5 | 1e-3 |
| 4 | 1e-5 | 1e-4 | 1e-3 |
| 5 | 1e-4 | 1e-4 | 1e-3 |
| 6 | 1e-5 | 1e-5 | 1e-3 |
| 7 | 1e-4 | 1e-5 | 1e-3 |
| 8 | 1e-4 | 1e-5 | 1e-3 |
| 9 | 1e-4 | 1e-4 | 1e-3 |
Appendix 2—table 1
Participant cognitive characteristics at baseline.
EDIS was cross-sectional, while SLABS and GUSTO were longitudinal. EDIS, Epidemiology of Dementia in Singapore; SLABS, Singapore Longitudinal Aging Brain Study; GUSTO, Growing Up in Singapore Towards healthy Outcomes; KBIT-2, Kaufman Brief Intelligence Test Second Edition; WCST, Wisconsin Card Sorting Test; NEPSY-II, A Developmental Neuropsychological Assessment Second Edition.
| Characteristic | EDIS (N=694) |
|---|---|
| Global cognition z-score | −2.55 ± 2.21 (−10.47 − 1.96) |
| Executive function domain z-score | −1.57 ± 1.85 (−7.79 − 1.26) |
| Attention domain z-score | −2.13 ± 2.63 (−13.69 − 2.65) |
| Language domain z-score | −1.84 ± 1.70 (−11.72 − 2.85) |
| Visuomotor speed domain z-score | − 1.64 ± 1.76 (−5.87 − 2.25) |
| Visuoconstruction domain z-score | −2.50 ± 2.57 (−13.63 − 2.37) |
| Verbal memory domain z-score | −1.40 ± 1.40 (−5.17 − 2.78) |
| Visual memory domain z-score | −1.50 ± 1.48 (−9.10 −2.15) |
| Characteristic | SLABS (N=81) |
| Global cognition T-score | 51.82 ± 4.75 (41.21 − 61.65) |
| Executive function domain T-score | 51.98 ± 5.57 (42.39 − 64.08) |
| Attention domain T-score | 50.52 ± 6.11 (39.62 − 65.04) |
| Processing speed domain T-score | 52.96 ± 7.22 (36.13 − 71.84) |
| Verbal memory domain T-score | 52.18 ± 7.70 (32.38 − 67.04) |
| Visuospatial memory domain T-score | 51.48 ± 7.62 (35.00 − 65.80) |
| Cognition follow-up (years) | 7.83 ± 0.97 (5.58 − 9.59) |
| Characteristic | GUSTO (N=217–239) |
| KBIT-2 Composite IQ Standard Score (N=217, 4.5 years old) | 92.38 ± 14.24 (52 − 132) |
| WCST Total Errors Standard Score (N=220, 8.5 years old) | 99.45 ± 15.95 (64 − 136) |
| NEPSY-II Naming Scaled Score (N=239, 8.5 years old) | 10.45 ± 3.66 (3 − 19) |
| NEPSY-II Inhibition Scaled Score (N=239, 8.5 years old) | 10.31 ± 3.3 (2 − 18) |
| NEPSY-II Switching Scaled Score (N=239, 8.5 years old) | 9.26 ± 4.03 (1 − 19) |
Appendix 2—table 2
Model equations for analyzing associations with cognition.
Cog, standardized cognitive score; BAG, brain age gap; bl, baseline; ∆, annual rate of change; EDIS, Epidemiology of Dementia in Singapore; SLABS, Singapore Longitudinal Aging Brain Study; GUSTO, Growing Up in Singapore Towards healthy Outcomes.
| Age | Dataset | Label | Equation |
|---|---|---|---|
| Elderly | EDIS | I. Baseline vs. baseline | |
| Elderly | SLABS | II. Baseline vs. change | |
| Elderly | SLABS | III. Change vs. change (overlapping) | |
| Elderly | SLABS | IV. Change vs. change (future) | |
| Children | GUSTO | I. Baseline vs. baseline | |
| Children | GUSTO | II. Baseline vs. future | |
| Children | GUSTO | III. Change vs. future |
Appendix 3—table 1
Pretrained baseline vs. baseline results from EDIS.
p-values are bolded if less than α = 0.05. BAG, brain age gap; EDIS, Epidemiology of Dementia in Singapore; β, standardized regression coefficient; , lower limit of 95% CI; , upper limit of 95% CI; p, uncorrected p-value; pcorr, corrected p-value; , change in adjusted when adding variable of interest; , model coefficient of determination.
| Variable of interest | Outcome | β (CIL, CIU) | p | pcorr | Δ R2adj | R2 |
|---|---|---|---|---|---|---|
| Baseline BAG (pretrained) | Baseline global cognition | –0.1125 (–0.17, –0.06) | <0.0001 | 0.0006 | 0.0106 | 0.5011 |
| Baseline BAG (pretrained) | Baseline executive function | –0.1029 (–0.17, –0.04) | 0.0019 | 0.0076 | 0.0085 | 0.3297 |
| Baseline BAG (pretrained) | Baseline attention | –0.0404 (–0.11, 0.03) | 0.2461 | 0.2461 | 0.0004 | 0.2562 |
| Baseline BAG (pretrained) | Baseline language | –0.1145 (–0.18, –0.05) | 0.0009 | 0.0047 | 0.0107 | 0.2677 |
| Baseline BAG (pretrained) | Baseline visuomotor speed | –0.0825 (–0.14, –0.02) | 0.0052 | 0.0136 | 0.0053 | 0.4684 |
| Baseline BAG (pretrained) | Baseline visuo-construction | –0.0896 (–0.15, –0.03) | 0.0045 | 0.0136 | 0.0063 | 0.3911 |
| Baseline BAG (pretrained) | Baseline verbal memory | –0.1096 (–0.17, –0.05) | 0.0006 | 0.0034 | 0.0099 | 0.3826 |
| Baseline BAG (pretrained) | Baseline visual memory | –0.1395 (–0.20, –0.08) | < 0.0001 | 0.0002 | 0.0165 | 0.3515 |
Appendix 3—table 2
Finetuned baseline vs. baseline results from EDIS.
p-values are bolded if less than α = 0.05. BAG, brain age gap; EDIS, Epidemiology of Dementia in Singapore; β, standardized regression coefficient; CIL, lower limit of 95% CI; CIU, upper limit of 95% CI; p, uncorrected p-value; pcorr, corrected p-value; , change in adjusted when adding variable of interest; R2, model coefficient of determination.
| Variable of interest | Outcome | β (CIL, CIU) | p | pcorr | Δ R2adj | R2 |
|---|---|---|---|---|---|---|
| Baseline BAG (finetuned) | Baseline global cognition | –0.1661 (–0.23, –0.10) | < 0.0001 | < 0.0001 | 0.0171 | 0.5076 |
| Baseline BAG (finetuned) | Baseline executive function | –0.1607 (–0.24, –0.08) | <0.0001 | 0.0002 | 0.0158 | 0.3369 |
| Baseline BAG (finetuned) | Baseline attention | –0.0632 (–0.14, 0.02) | 0.1223 | 0.1223 | 0.0015 | 0.2573 |
| Baseline BAG (finetuned) | Baseline language | –0.1535 (–0.23, –0.07) | 0.0002 | 0.0007 | 0.0142 | 0.2712 |
| Baseline BAG (finetuned) | Baseline visuomotor speed | –0.1071 (–0.17, –0.04) | 0.0020 | 0.0040 | 0.0066 | 0.4697 |
| Baseline BAG (finetuned) | Baseline visuoconstruction | –0.1291 (–0.20, –0.06) | 0.0005 | 0.0015 | 0.0099 | 0.3946 |
| Baseline BAG (finetuned) | Baseline verbal memory | –0.1722 (–0.24, –0.10) | <0.0001 | <0.0001 | 0.0183 | 0.3910 |
| Baseline BAG (finetuned) | Baseline visual memory | –0.2194 (–0.29, –0.15) | <0.0001 | <0.0001 | 0.0302 | 0.3651 |
Appendix 3—table 3
Pretrained baseline vs. baseline results from SLABS.
p-values are bolded if less than α = 0.05. BAG, brain age gap; SLABS, Singapore Longitudinal Aging Brain Study; β, standardized regression coefficient; CIL, lower limit of 95% CI; CIU, upper limit of 95% CI; p, uncorrected p-value; pcorr, corrected p-value; , change in adjusted when adding variable of interest; , model coefficient of determination.
| Variable of interest | Outcome | β (CIL, CIU) | p | pcorr | ΔR2adj | R2 |
|---|---|---|---|---|---|---|
| Baseline BAG (pretrained) | Baseline global cognition | –0.0574 (–0.18, 0.06) | 0.3376 | 1.0000 | –0.0002 | 0.3514 |
| Baseline BAG (pretrained) | Baseline executive function | –0.0447 (–0.16, 0.07) | 0.4600 | 1.0000 | –0.0015 | 0.3379 |
| Baseline BAG (pretrained) | Baseline verbal memory | –0.0089 (–0.14, 0.12) | 0.8925 | 1.0000 | –0.0038 | 0.2090 |
| Baseline BAG (pretrained) | Baseline visual memory | –0.1299 (–0.27, 0.01) | 0.0716 | 0.4297 | 0.0105 | 0.0643 |
| Baseline BAG (pretrained) | Baseline attention | –0.0187 (–0.15, 0.11) | 0.7750 | 1.0000 | –0.0035 | 0.2261 |
| Baseline BAG (pretrained) | Baseline processing speed | –0.0036 (–0.12, 0.12) | 0.9492 | 1.0000 | –0.0029 | 0.4038 |
Appendix 3—table 4
Finetuned baseline vs. baseline results from SLABS.
p-values are bolded if less than α = 0.05. BAG, brain age gap; SLABS, Singapore Longitudinal Aging Brain Study; β, standardized regression coefficient; CIL, lower limit of 95% CI; CIU, upper limit of 95% CI; p, uncorrected p-value; pcorr, corrected p-value; , change in adjusted when adding variable of interest; , model coefficient of determination.
| Variable of interest | Outcome | β (CIL, CIU) | p | pcorr | ΔR2adj | R2 |
|---|---|---|---|---|---|---|
| Baseline BAG (finetuned) | Baseline global cognition | –0.0674 (–0.19, 0.05) | 0.2784 | 1.0000 | 0.0006 | 0.3522 |
| Baseline BAG (finetuned) | Baseline executive function | –0.0378 (–0.16, 0.09) | 0.5477 | 1.0000 | –0.0021 | 0.3373 |
| Baseline BAG (finetuned) | Baseline verbal memory | –0.0548 (–0.19, 0.08) | 0.4245 | 1.0000 | –0.0014 | 0.2113 |
| Baseline BAG (finetuned) | Baseline visual memory | –0.1243 (–0.27, 0.02) | 0.0974 | 0.5846 | 0.0081 | 0.0621 |
| Baseline BAG (finetuned) | Baseline attention | 0.0056 (–0.13, 0.14) | 0.9342 | 1.0000 | –0.0038 | 0.2258 |
| Baseline BAG (finetuned) | Baseline processing speed | 0.0229 (–0.14, 0.09) | 0.7008 | 1.0000 | –0.0025 | 0.4042 |
Appendix 3—table 5
Pretrained baseline vs. change results from SLABS.
p-values are bolded if less than α = 0.05. BAG, brain age gap; SLABS, Singapore Longitudinal Aging Brain Study; β, standardized regression coefficient; CIL, lower limit of 95% CI; CIU, upper limit of 95% CI; p, uncorrected p-value; pcorr, corrected p-value; , change in adjusted when adding variable of interest; , model coefficient of determination.
| Variable of interest | Outcome | β (CIL, CIU) | p | pcorr | ΔR2adj | R2 |
|---|---|---|---|---|---|---|
| Baseline BAG (pretrained) | Change in global cognition | –0.1213 (–0.36, 0.12) | 0.3232 | 1.0000 | –0.0002 | 0.0211 |
| Baseline BAG (pretrained) | Change in executive function | –0.2477 (–0.48, –0.01) | 0.0406 | 0.2433 | 0.0424 | 0.0711 |
| Baseline BAG (pretrained) | Change in verbal memory | –0.1263 (–0.37, 0.11) | 0.2970 | 1.0000 | 0.0013 | 0.0490 |
| Baseline BAG (pretrained) | Change in visual memory | 0.0337 (–0.21, 0.28) | 0.7815 | 1.0000 | –0.0122 | 0.0338 |
| Baseline BAG (pretrained) | Change in attention | 0.0253 (–0.21, 0.26) | 0.8345 | 1.0000 | –0.0125 | 0.0457 |
| Baseline BAG (pretrained) | Change in processing speed | –0.1032 (–0.35, 0.14) | 0.4015 | 1.0000 | –0.0039 | 0.0157 |
Appendix 3—table 6
Finetuned baseline vs. change results from SLABS.
p-values are bolded if less than α = 0.05. BAG, brain age gap; SLABS, Singapore Longitudinal Aging Brain Study; β, standardized regression coefficient; CIL, lower limit of 95% CI; CIU, upper limit of 95% CI; p, uncorrected p-value; pcorr, corrected p-value; , change in adjusted when adding variable of interest; , model coefficient of determination.
| Variable of interest | Outcome | β (CIL, CIU) | p | pcorr | ΔR2adj | R2 |
|---|---|---|---|---|---|---|
| Baseline BAG (finetuned) | Change in global cognition | –0.0480 (–0.30, 0.20) | 0.7041 | 1.0000 | –0.0116 | 0.0103 |
| Baseline BAG (finetuned) | Change in executive function | –0.1165 (–0.36, 0.13) | 0.3531 | 1.0000 | –0.0017 | 0.0292 |
| Baseline BAG (finetuned) | Change in verbal memory | –0.1431 (–0.39, 0.10) | 0.2491 | 1.0000 | 0.0045 | 0.0520 |
| Baseline BAG (finetuned) | Change in visual memory | 0.0409 (–0.21, 0.29) | 0.7431 | 1.0000 | –0.0118 | 0.0342 |
| Baseline BAG (finetuned) | Change in attention | 0.1232 (–0.13, 0.37) | 0.3193 | 1.0000 | 0.0001 | 0.0576 |
| Baseline BAG (finetuned) | Change in processing speed | –0.0125 (–0.26, 0.23) | 0.9214 | 1.0000 | –0.0134 | 0.0066 |
Appendix 3—table 7
Pretrained change vs. change results from SLABS.
p-values are bolded if less than α = 0.05. BAG, brain age gap; SLABS, Singapore Longitudinal Aging Brain Study; β, standardized regression coefficient; CIL, lower limit of 95% CI; CIU, upper limit of 95% CI; p, uncorrected p-value; pcorr, corrected p-value; , change in adjusted when adding variable of interest; , model coefficient of determination.
| Variable of interest | Outcome | β (CIL, CIU) | p | pcorr | ΔR2adj | R2 |
|---|---|---|---|---|---|---|
| Change in BAG (pretrained) | Change in global cognition | –0.1415 (–0.39, 0.11) | 0.2689 | 1.0000 | 0.0033 | 0.0370 |
| Change in BAG (pretrained) | Change in executive function | –0.3807 (–0.61, –0.15) | 0.0017 | 0.0100 | 0.1100 | 0.1864 |
| Change in BAG (pretrained) | Change in verbal memory | –0.0312 (–0.28, 0.22) | 0.8056 | 1.0000 | –0.0125 | 0.0498 |
| Change in BAG (pretrained) | Change in visual memory | 0.0917 (–0.16, 0.34) | 0.4718 | 1.0000 | –0.0064 | 0.0405 |
| Change in BAG (pretrained) | Change in attention | –0.1872 (–0.44, 0.06) | 0.1371 | 0.6857 | 0.0164 | 0.0736 |
| Change in BAG (pretrained) | Change in processing speed | –0.0868 (–0.34, 0.17) | 0.5001 | 1.0000 | –0.0074 | 0.0217 |
Appendix 3—table 8
Finetuned change vs. change results from SLABS.
p-values are bolded if less than α = 0.05. BAG, brain age gap; SLABS, Singapore Longitudinal Aging Brain Study; β, standardized regression coefficient; CIL, lower limit of 95% CI; CIU, upper limit of 95% CI; p, uncorrected p-value; pcorr, corrected pvalue; , change in adjusted when adding variable of interest; , model coefficient of determination.
| Variable of interest | Outcome | β (CIL, CIU) | p | pcorr | ΔR2adj | R2 |
|---|---|---|---|---|---|---|
| Change in BAG (finetuned) | Change in global cognition | –0.2367 (–0.48, 0.01) | 0.0576 | 0.2305 | 0.0360 | 0.0570 |
| Change in BAG (finetuned) | Change in executive function | –0.3861 (–0.62, –0.15) | 0.0014 | 0.0084 | 0.1190 | 0.1536 |
| Change in BAG (finetuned) | Change in verbal memory | –0.1017 (–0.35, 0.14) | 0.4091 | 1.0000 | –0.0041 | 0.0607 |
| Change in BAG (finetuned) | Change in visual memory | –0.0284 (–0.28, 0.22) | 0.8200 | 1.0000 | –0.0128 | 0.0349 |
| Change in BAG (finetuned) | Change in attention | –0.2651 (–0.50, –0.03) | 0.0287 | 0.1434 | 0.0493 | 0.1163 |
| Change in BAG (finetuned) | Change in processing speed | –0.0842 (–0.33, 0.17) | 0.5050 | 1.0000 | –0.0076 | 0.0125 |
Appendix 3—table 9
Pretrained baseline vs. future results from GUSTO.
p-values are bolded if less than α = 0.05. BAG, brain age gap; GUSTO, Growing Up in Singapore Towards healthy Outcomes; NEPSY-II, A Developmental Neuropsychological Assessment Second Edition; WCST, Wisconsin Card Sorting Test; β, standardized regression coefficient; CIL, lower limit of 95% CI; CIU, upper limit of 95% CI; p, uncorrected p-value; pcorr, corrected pvalue; , change in adjusted when adding variable of interest; , model coefficient of determination.
| Variable of interest | Outcome | β (CIL, CIU) | p | pcorr | ΔR2adj | R2 |
|---|---|---|---|---|---|---|
| Baseline BAG (pretrained) | Future WCST Standard Score | –0.0585 (–0.24, 0.13) | 0.5334 | 0.9798 | –0.0028 | 0.0256 |
| Baseline BAG (pretrained) | Future Naming (NEPSY-II) | 0.1290 (–0.05, 0.31) | 0.1573 | 0.6292 | 0.0043 | 0.0149 |
| Baseline BAG (pretrained) | Future Inhibition (NEPSY-II) | 0.1074 (–0.07, 0.29) | 0.2387 | 0.7161 | 0.0017 | 0.0155 |
| Baseline BAG (pretrained) | Future Switching (NEPSY-II) | 0.0630 (–0.12, 0.24) | 0.4899 | 0.9798 | –0.0022 | 0.0106 |
Appendix 3—table 10
Finetuned baseline vs. future results from GUSTO.
p-values are bolded if less than α = 0.05. BAG, brain age gap; GUSTO, Growing Up in Singapore Towards healthy Outcomes; NEPSY-II, A Developmental Neuropsychological Assessment Second Edition; WCST, Wisconsin Card Sorting Test; β, standardized regression coefficient; CIL, lower limit of 95% CI; CIU, upper limit of 95% CI; p, uncorrected p-value; pcorr, corrected p-value; , change in adjusted when adding variable of interest; , model coefficient of determination.
| Variable of interest | Outcome | β (CIL, CIU) | p | pcorr | ΔR2adj | R2 |
|---|---|---|---|---|---|---|
| Baseline BAG (finetuned) | Future WCST Standard Score | –0.0046 (–0.20, 0.20) | 0.9642 | 1.0000 | –0.0046 | 0.0239 |
| Baseline BAG (finetuned) | Future Naming (NEPSY-II) | –0.0108 (–0.21, 0.19) | 0.9143 | 1.0000 | –0.0042 | 0.0065 |
| Baseline BAG (finetuned) | Future Inhibition (NEPSY-II) | 0.0829 (–0.11, 0.28) | 0.4086 | 1.0000 | –0.0013 | 0.0125 |
| Baseline BAG (finetuned) | Future Switching (NEPSY-II) | –0.0359 (–0.23, 0.16) | 0.7203 | 1.0000 | –0.0037 | 0.0091 |
Appendix 3—table 11
Pretrained change vs. future results from GUSTO.
p-values are bolded if less than α = 0.05. BAG, brain age gap; GUSTO, Growing Up in Singapore Towards healthy Outcomes; NEPSY-II, A Developmental Neuropsychological Assessment Second Edition; WCST, Wisconsin Card Sorting Test; β, standardized regression coefficient; CIL, lower limit of 95% CI; CIU, upper limit of 95% CI; p, uncorrected p-value; pcorr, corrected p-value; , change in adjusted when adding variable of interest; , model coefficient of determination.
| Variable of interest | Outcome | β (CIL, CIU) | p | pcorr | ΔR2adj | R2 |
|---|---|---|---|---|---|---|
| Change in BAG (pretrained) | Future WCST Standard Score | –0.0639 (–0.21, 0.08) | 0.3877 | 1.0000 | –0.0011 | 0.0290 |
| Change in BAG (pretrained) | Future Naming (NEPSY-II) | –0.0280 (–0.17, 0.12) | 0.7020 | 1.0000 | –0.0036 | 0.0156 |
| Change in BAG (pretrained) | Future Inhibition (NEPSY-II) | 0.0376 (–0.11, 0.18) | 0.6073 | 1.0000 | –0.0031 | 0.0166 |
| Change in BAG (pretrained) | Future Switching (NEPSY-II) | 0.0021 (–0.14, 0.15) | 0.9772 | 1.0000 | –0.0043 | 0.0106 |
Appendix 3—table 12
Finetuned change vs. future results from GUSTO.
p-values are bolded if less than α = 0.05. BAG, brain age gap; GUSTO, Growing Up in Singapore Towards healthy Outcomes; NEPSY-II, A Developmental Neuropsychological Assessment Second Edition; WCST, Wisconsin Card Sorting Test; β, standardized regression coefficient; CIL, lower limit of 95% CI; CIU, upper limit of 95% CI; p, uncorrected p-value; pcorr, corrected pvalue; , change in adjusted when adding variable of interest; , model coefficient of determination.
| Variable of interest | Outcome | β (CIL, CIU) | p | pcorr | ΔR2adj | R2 |
|---|---|---|---|---|---|---|
| Change in BAG (pretrained) | Future WCST Standard Score | –0.0091 (–0.16, 0.14) | 0.9052 | 1.0000 | –0.0045 | 0.0239 |
| Change in BAG (pretrained) | Future Naming (NEPSY-II) | 0.0158 (–0.14, 0.17) | 0.8413 | 1.0000 | –0.0041 | 0.0067 |
| Change in BAG (pretrained) | Future Inhibition (NEPSY-II) | 0.2006 (0.05, 0.35) | 0.0103 | 0.0411 | 0.0237 | 0.0400 |
| Change in BAG (pretrained) | Future Switching (NEPSY-II) | 0.1795 (0.03, 0.33) | 0.0221 | 0.0663 | 0.0181 | 0.0311 |
Author response table 1
Linear relationship between pretrained baseline BAG and future cognitive score in ADNI.
Compare to Supplementary Tables S4 – S15 of the original text.
| Variable of Interest | Outcome | β (CIL, CIU) | p | Pcorr | Δ R2adj | R2 |
|---|---|---|---|---|---|---|
| Baseline BAG (pretrained) | Future Memory | -0.1744 (-0.36, 0.01) | 0.0632 | 0.2442 | 0.0181 | 0.1278 |
| Baseline BAG (pretrained) | Future Executive Function | -0.1368 (-0.32, 0.05) | 0.1522 | 0.3043 | 0.0081 | 0.0914 |
| Baseline BAG (pretrained) | Future Language | -0.1758 (-0.36, 0.01) | 0.0611 | 0.2442 | 0.0185 | 0.1277 |
| Baseline BAG (pretrained) | Future Visuospatial Function | -0.0284 (-0.26, 0.20) | 0.8053 | 0.8053 | -0.0098 | 0.0559 |
Author response table 2
Linear relationship between finetuned baseline BAG and future cognitive score in ADNI.
Compare to Supplementary Tables S4 – S15 of the original text.
| Variable of Interest | Outcome | β (CIL, CIU) | p | Pcorr | Δ R2adj | R2 |
|---|---|---|---|---|---|---|
| Baseline BAG (finetuned) | Future Memory | -0.1260 (-0.33, 0.07) | 0.2155 | 0.8621 | 0.0040 | 0.1142 |
| Baseline BAG (finetuned) | Future Executive Function | 0.0244 (-0.18, 0.23) | 0.8135 | 1.0000 | -0.0072 | 0.0766 |
| Baseline BAG (finetuned) | Future Language | -0.0823 (-0.28, 0.12) | 0.4193 | 1.0000 | -0.0025 | 0.1073 |
| Baseline BAG (finetuned) | Future Visuospatial Function | 0.0536 (-0.19, 0.30) | 0.6648 | 1.0000 | -0.0085 | 0.0572 |
Author response table 3
Linear relationship between pretrained change in BAG and future cognitive score in ADNI.
Compare to Supplementary Tables S4 – S15 of the original text.
| Variable of Interest | Outcome | β (CIL, CIU) | p | Pcorr | Δ R2adj | R2 |
|---|---|---|---|---|---|---|
| Change in BAG (pretrained) | Future Memory | -0.1743 (-0.35, -0.00) | 0.0492 | 0.1968 | 0.0209 | 0.1549 |
| Change in BAG (pretrained) | Future Executive Function | -0.0711 (-0.25, 0.11) | 0.4353 | 0.8705 | -0.0029 | 0.0959 |
| Change in BAG (pretrained) | Future Language | -0.0577 (-0.23, 0.12) | 0.5180 | 0.8705 | -0.0042 | 0.1306 |
| Change in BAG (pretrained) | Future Visuospatial Function | -0.1337 (-0.35, 0.08) | 0.2126 | 0.6377 | 0.0061 | 0.0718 |
Author response table 4
Linear relationship between finetuned change in BAG and future cognitive score in ADNI.
Compare to Supplementary Tables S4 – S15 of the original text.
| Variable of Interest | Outcome | β (CIL, CIU) | p | pcorr | Δ R2adj | R2 |
|---|---|---|---|---|---|---|
| Change in BAG (finetuned) | Future Memory | -0.2263 (-0.40, -0.05) | 0.0113 | 0.0451 | 0.0400 | 0.1674 |
| Change in BAG (finetuned) | Future Executive Function | -0.1453 (-0.33, 0.04) | 0.1153 | 0.2305 | 0.0117 | 0.0966 |
| Change in BAG (finetuned) | Future Language | -0.1737 (-0.35, 0.00) | 0.0543 | 0.1628 | 0.0204 | 0.1403 |
| Change in BAG (finetuned) | Future Visuospatial Function | -0.1290 (-0.34, 0.08) | 0.2244 | 0.2305 | 0.0053 | 0.0722 |
Additional files
Download links
A two-part list of links to download the article, or parts of the article, in various formats.
Downloads (link to download the article as PDF)
Open citations (links to open the citations from this article in various online reference manager services)
Cite this article (links to download the citations from this article in formats compatible with various reference manager tools)
Rate of brain aging associates with future executive function in Asian children and older adults
eLife 13:RP97036.
https://doi.org/10.7554/eLife.97036.3


