SLAM/SAP signaling regulates discrete γδ T cell developmental checkpoints and shapes the innate-like γδ TCR repertoire
- Department of Surgery, Larner College of Medicine, University of Vermont, United States
- Department of Pathology and Laboratory Medicine, Larner College of Medicine, University of Vermont Medical Center, United States
Figures
Figure 1 with 3 supplements
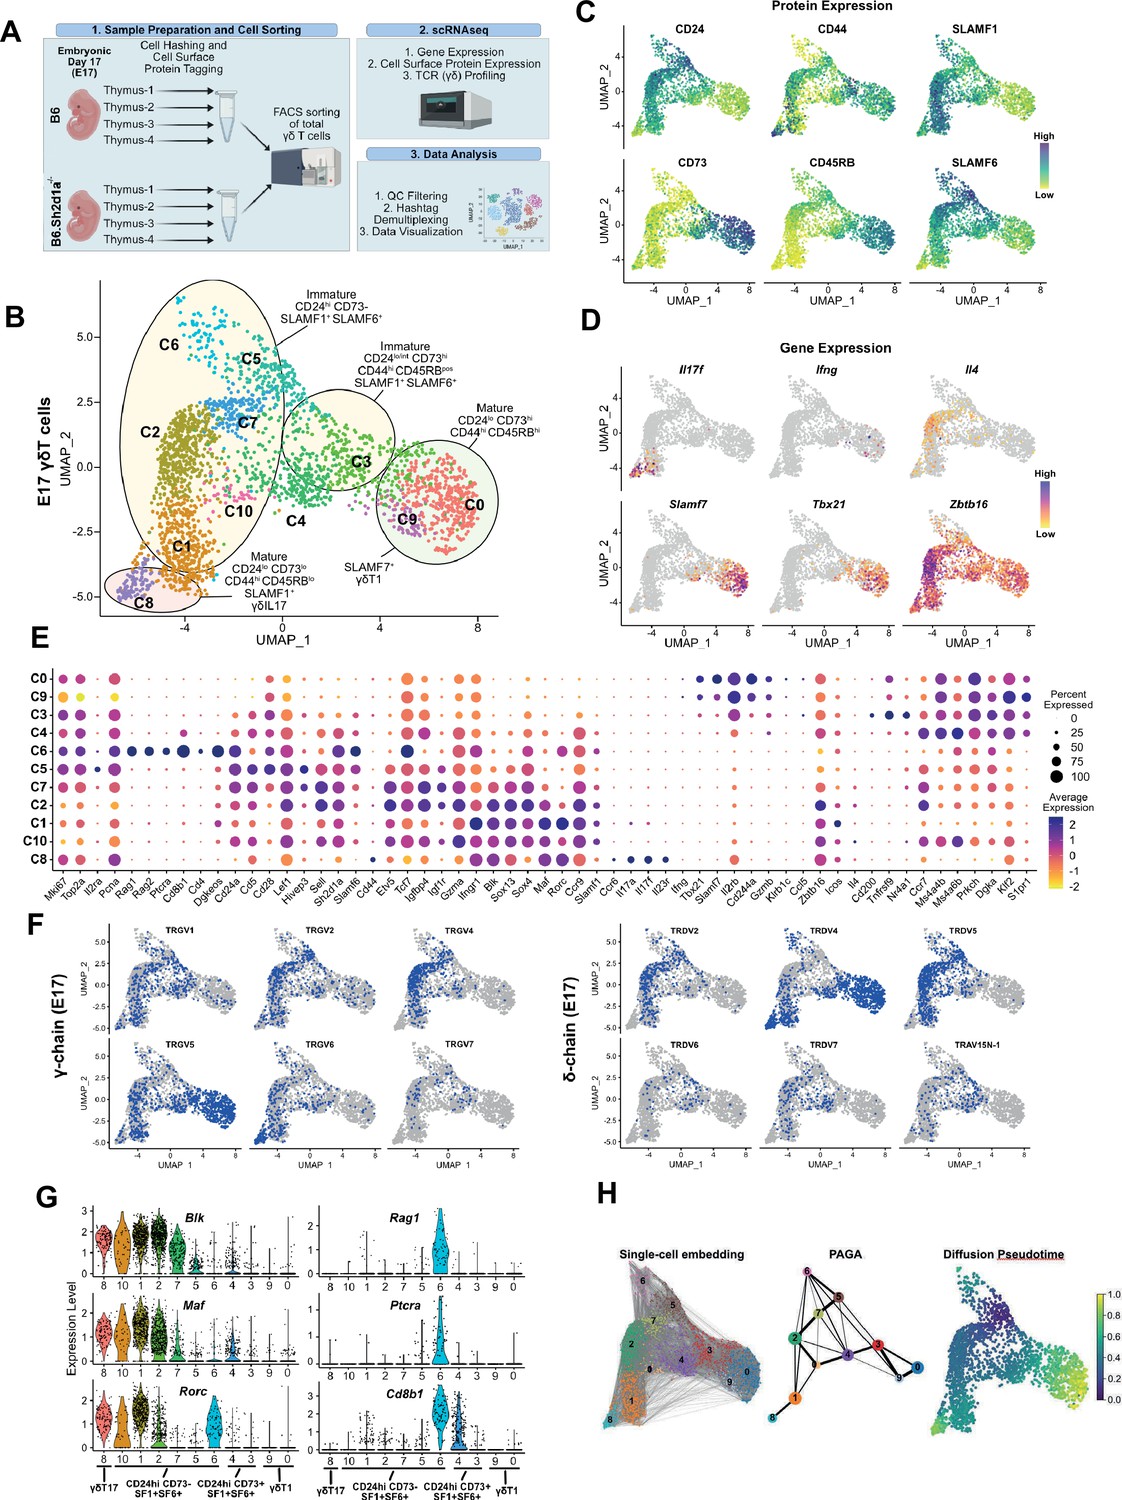
SLAM family receptor expression marks transcriptionally distinct developmental stages among E17 γδ T cells.
(A) Schematic workflow depicting the methodology for single-cell RNA sequencing (scRNAseq) library preparation and subsequent data analysis pipeline employed in this study. (B) Uniform manifold approximation and projection (UMAP) visualization displaying 11 distinct clusters of E17 B6 thymic γδ T cells, n = 4 individual mice. Clusters are annotated based on comprehensive protein and gene expression data. (C) Feature plots illustrating the cell surface protein expression profiles of CD24, CD73, CD44, CD45RB, SLAMF1, and SLAMF6 on B6 E17 thymic γδ T cells. Each data point represents a cell, color-coded to indicate varying protein expression levels (high: dark blue, low: yellow). (D) Feature plot illustrating the gene expression profiles of signature genes among individual B6 E17 thymic γδ T cells. Each data point represents a cell, color-coded based on gene expression levels (high: purple, low: yellow). (E) Dot plot demonstrating the scaled expression levels of selected genes in E17 B6 thymic γδ T cells. Normalized expression levels are depicted using a color scale ranging from low (yellow) to high (purple). Dot size corresponds to the fraction of cells within each cluster expressing the specific marker. (F) UMAP representation of E17 B6 thymic γδ T cells indicating the expression of selected TRGV (TCRγ; left) and TRDV (TCRδ; right) chain V-segment usage (in blue) across individual cells. (G) Violin plots illustrating the expression patterns of selected genes among E17 B6 thymic γδ T cell clusters. (H) Visualization of single-cell trajectories using PAGA (partition-based graph abstraction) with single-cell embedding (left) showing connectivity between individual nodes (middle). Weighted edges represent statistical measures of interconnectivity. The diffusion pseudotime plot (right) delineates inferred pseudotime progression of cells along developmental trajectories using cluster 5 (C5) as the root, highlighting their developmental order (from purple to yellow).
Figure 1—figure supplement 1

Quality control for single-cell CITE-seq.
(A) Representative gating scheme used for FACS sorting γδ cells from B6 (top) and B6.Sh2d1a-/- (bottom) thymus. (B) Left, Violin plots of B6 E17 thymic γδ T cells. nFeaure_RNA represents number of genes detected in each cell. nCount_RNA represents total number of molecules detected within a cell, percent.mt represents the frequency of mitochondrial genes expressed in each cell, and percent.ribo represents the frequency of ribosomal genes expressed in each cell. Middle, ridge plots demonstrating successful enrichment for selected hashtags in E17 thymus γδ T cells following demultiplexing. Right, uniform manifold approximation and projection (UMAP) representations showing distribution of demultiplexed γδ Τ cells among individual B6 E17 thymus samples. (C) Violin plots depicting distribution of cell surface protein oligo-conjugated antibody derived tags (ADTs) among different B6 E17 thymus γδ T cells clusters. (D) Violin plots depicting expression levels of selected genes among individual E17 B6 thymic γδ T cells clusters. (E) Representative dot plots of CD24 and SLAMF7 staining on neonatal thymus γδ T cells. The position of CD44+CD45RB+ cells is shown in blue. Data are representative of two independent experiments, n = 10 mice.
Figure 1—figure supplement 2

TCR repertoire profiling of B6 E17 thymus γδ T cells.
(A) Left, TCR clonotype bubble plot depicting the top 100 TCR clonotypes among B6 E17 γδ T cells (n = 2502 γδ T cells). Each bubble represents a unique TRGV/TRDV clonotype; the bubble size corresponds to the clonotype frequency, and colors correspond to specific TRGV chains utilized. The four most frequent clonotypes are numbered and their corresponding CDR3γ and CDR3δ sequences are displayed below. Right, uniform manifold approximation and projection (UMAP) representations depicting the location of the four most frequent clonotypes E17 thymic γδT cell clusters. (B) Diversity of the E17 γδ TCR repertoire, represented by the Inverse Simpson index. (C) Amino acid length distributions of E17 thymic γδ T cell CDR3γ (top) and CDR3δ (bottom) in immature Blk+, Etv5+, Maf+ C2 and C7 (left), immature RORγthigh C1 (middle), and mature RORγthigh c8 (right) clusters. The top 10 clonotypes are color-coded, all other clonotypes are shown in gray.
Figure 1—figure supplement 3

Identification of a BLKnegMAFnegRORγtpos E17 γδ T cell population expressing CD4 and CD8.
(A) Left, representative dot plot of CD24 and CD25 expression on E17 B6 thymic Vγ4 T cells. Right, histograms depicting BLK, PLZF, and RORγt expression in the gated populations at left. The geometric mean fluorescence intensity of individual populations is shown. (B) Feature plots showing cell surface protein expression of Vγ1 (top) and Vγ4 (bottom) on B6 E17 thymus γδ T cells. Each point represents a cell, color-coded based on the protein expression level (high: dark blue, low: yellow). (C) Top left, uniform manifold approximation and projection (UMAP) representation of E17 B6 γδ T cell flow cytometry data with selected FlowSOM clusters indicated by color. All other cells are shown in gray. Right, individual dot plots overlaid with the selected FlowSOM clusters from the UMAP plot. Data represent concatenated data from five B6 TCRβnegTCRδposγδ T cells and are representative of two independent experiments. (D) Increasing BLKnegRORγtpos frequency as thymocytes progress to DN4 stage. Representative contour plots of E17 DN thymocytes with selected gates shown (left) and BLK and RORγt expression associated with each gated population (right). Numbers indicate the percentage of cells in the gated population. (E) Immature Vγ1Vδ1 T cells comprise the major IL17-producing Vγ1 T cell population in E17 thymus. Left, representative contour plot of Vγ1 and Vδ1 (17D1) expression among E17 thymic γδT cells. Middle, Dot plot of CD24 and SSC expression on E17 thymic γδT cells. The position of Vγ1+Vδ1+ E17 T cells is shown in red. Right, dot plots of IL-17 and IFN-γ expression in E17 thymic Vγ1+17D1+ and Vγ1+17D1− cells after PMA/ionomycin stimulation.
Figure 2 with 1 supplement
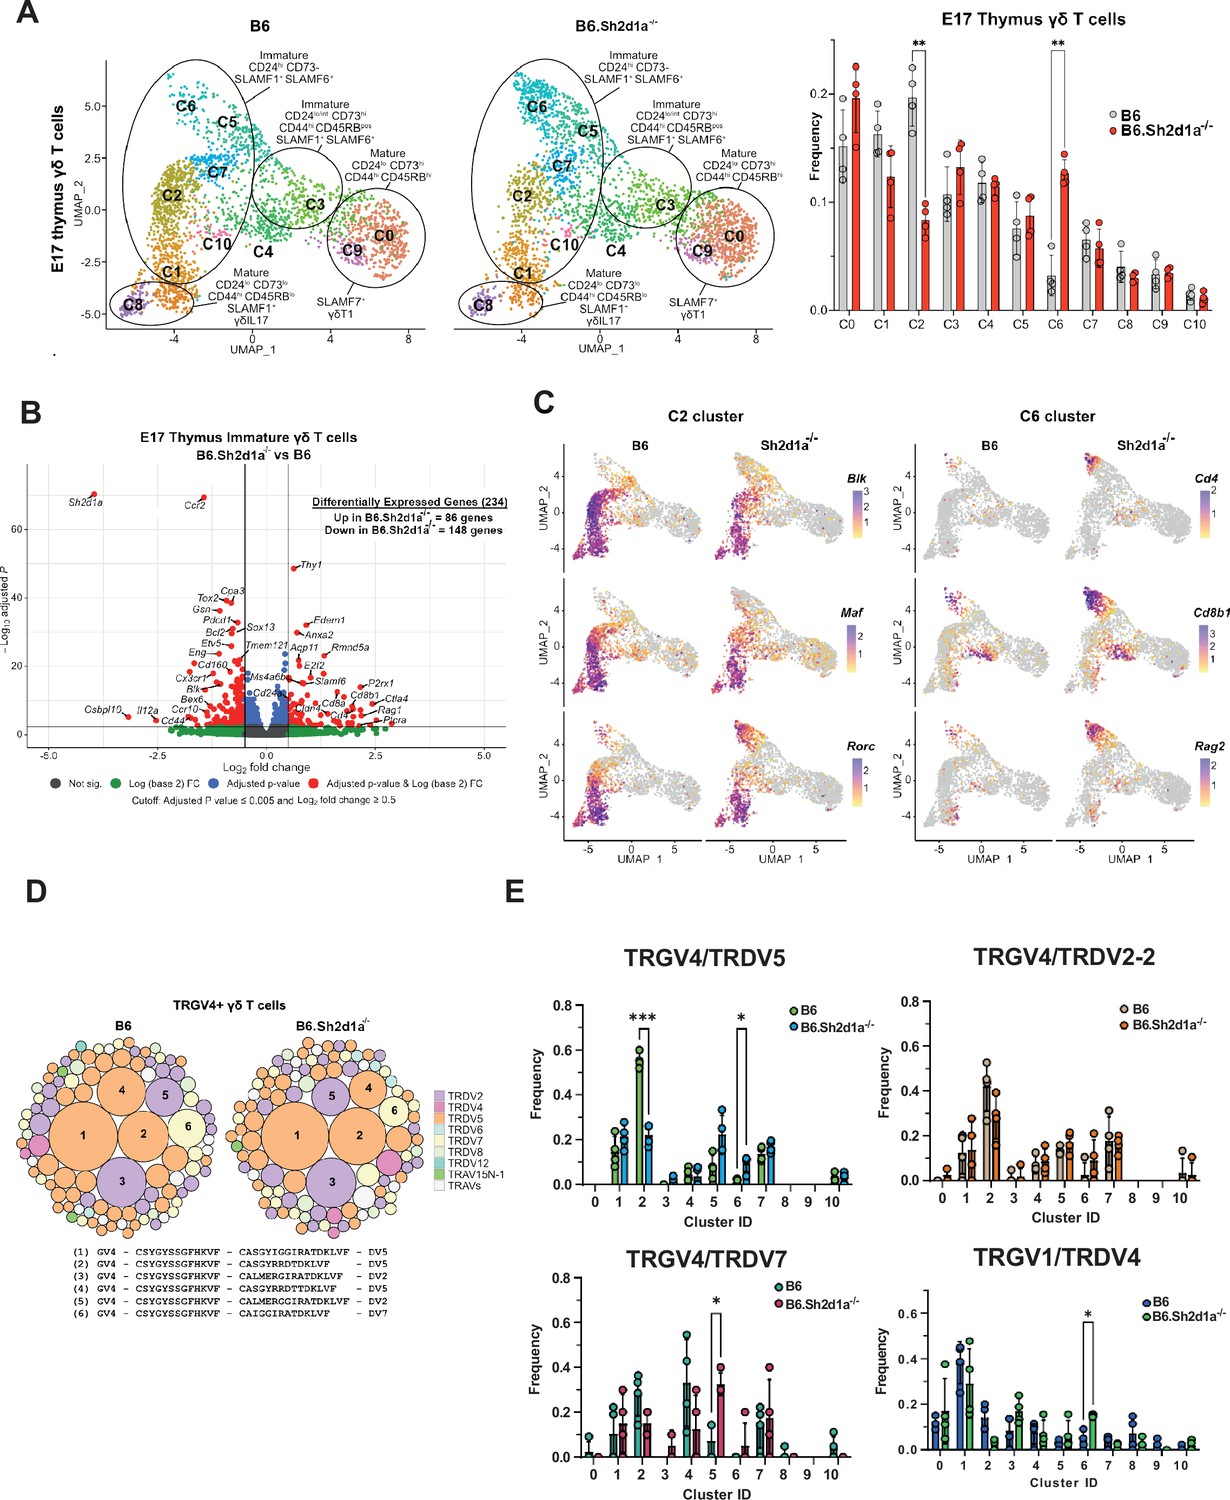
Identification of SAP-dependent developmental checkpoints during E17 γδ T cell developmental programming.
(A) Uniform manifold approximation and projection (UMAP) representation of B6 (left) and B6.Sh2d1a-/- (right) γδ T cells from E17 thymi (n = 4 mice per group) is shown at left. Clusters were annotated based on protein and gene expression data. The frequencies of B6 and B6.Sh2d1a-/- E17 γδ T cell clusters are shown at right. Bars represent the mean cluster frequency, error bars represent standard deviation, **p ≤ 0.01, two-way ANOVA, Sidak multiple comparisons test; n = 4 mice/genotype. (B) Volcano plot of differentially expressed genes among immature CD24highCD73neg (clusters: C1, C2, C5, C6, C7, and C10) B6 and B6.Sh2d1a-/- γδ Τ cells using pseudobulk scRNAseq analysis. Genes exhibiting a log2FC ≥0.5 or ≤ –0.5, and a padj ≤ 0.005 in are shown in red. Only some selected genes are labeled for the sake of clarity. (C) Feature plots illustrating gene expression profiles of selected C2 and C6 cluster-specific genes among individual B6 and B6.Sh2d1a-/- E17 thymic γδ T cells. Each point represents a cell, color-coded by gene expression level (high: purple, low: yellow). (D) TCR clonotype bubble plot displaying the top 100 B6 and B6.Sh2d1a-/- TRGV4 clonotypes in E17 thymus. Bubbles represent unique TRGV4/TRDV clonotypes; size indicates frequency of clonotype among all Vγ4 T cells (n = 388 B6, 288 B6.Sh2d1a-/- cells), and colors denote specific TRDV chains utilized. Selected clonotypes are numbered and their respective CDR3γ and CDR3δ sequences displayed below. (E) Altered TRGV/TRDV clonotype distribution between B6 and B6.Sh2d1a-/- E17 thymic γδ T cells. Frequencies of selected clonotypes among different clusters of B6 and B6.Sh2d1a-/- E17 γδ T cells is shown. Bars represent the mean clonotype frequency among the indicated TRGV/TRDV pairings shown, error bars represent standard deviation, *p ≤ 0.05, ***p ≤ 0.001, two-way ANOVA, Sidak multiple comparisons test; n = 4 mice/genotype-age groups.
-
Figure 2—source data 1
TCR clonotype distribution among E.17 B6 and B6.Sh2d1a-/- gamma delta T cells.
- https://cdn.elifesciences.org/articles/97229/elife-97229-fig2-data1-v1.xlsx
Figure 2—figure supplement 1

Expression levels of selected genes among individual B6 and B6.Sh2d1a-/- E17 thymic γδ T cell clusters.
(A) Genes whose expression decreased in B6.Sh2d1a-/- immature γδ T cells. (B) Genes whose expression increased in B6.Sh2d1a-/- immature γδ T cells, or whose expression was highest in the αβT cell-like c6 cluster.
Figure 3 with 1 supplement
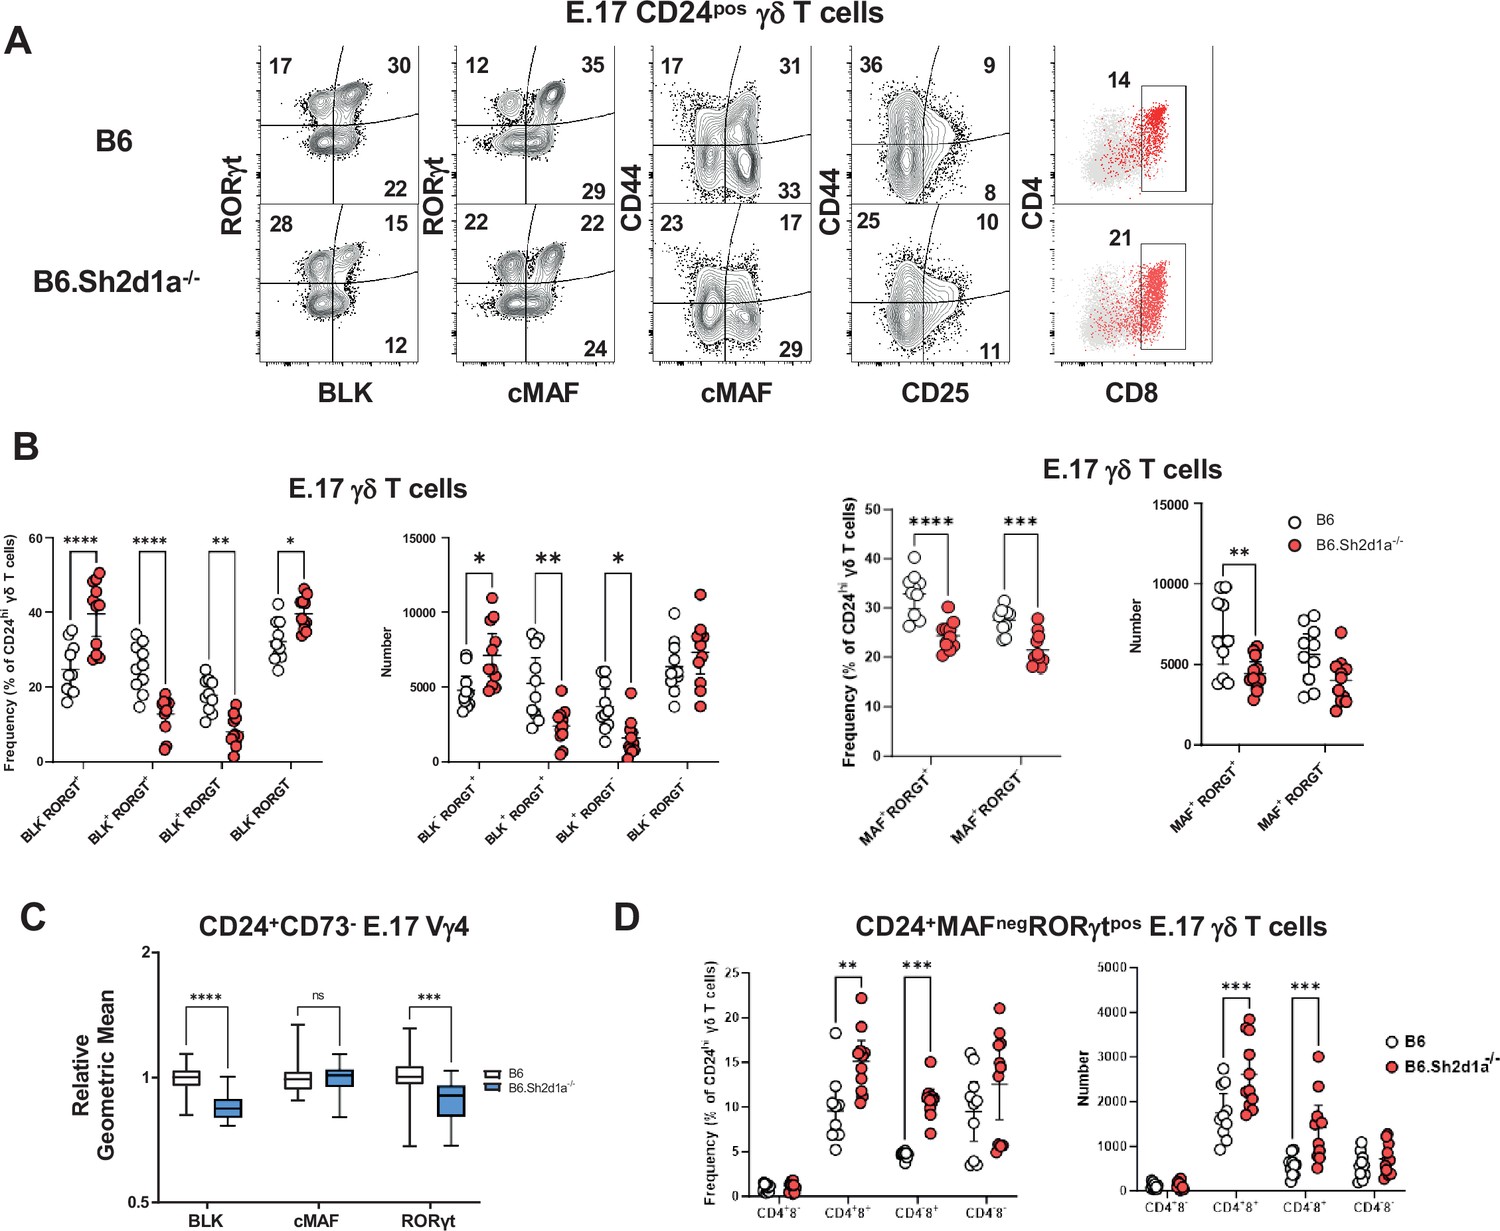
Increased frequency and number of immature CD4+CD8+c-MAF-RORγt+ γδ T cells in B6.Sh2d1a-/- E17 thymus.
(A) Representative contour plots depicting CD24pos E17 γδ T cells in B6 (top) and B6.Sh2d1a-/- (bottom) mice. Concatenated data from two B6 and three B6.Sh2d1a-/- embryos are shown, and are representative of two independent experiments. Numbers in the plots represent the frequency as a percentage of CD24pos γδ T cells. (B) Cumulative frequency and number of immature CD24pos BLK- (left), c-MAF- (right), RORγt-expressing E17 thymic γδ T cells. The mean and standard deviation are indicated. Data are the cumulative data from two independent experiments, n = 10 B6, 11 B6.Sh2d1a-/- pooled embryonic thymi, *p ≤ 0.05, **p ≤ 0.01, ***p ≤ 0.001, ****p ≤ 0.0001, two-way ANOVA, Sidak’s multiple comparisons test. (C) Relative geometric mean of BLK, c-MAF, and RORγt expression in B6 and B6.Sh2d1a-/- E17 CD24+CD73- Vγ4 γδ T cells, *p ≤ 0.001, ****p ≤ 0.0001, two-way ANOVA, Sidak’s multiple comparisons test. Data are representative of two independent experiments, 7–9 mice per group. (D) Cumulative frequency (left) and number (right) of immature CD4- and CD8- MAFnegRORγtpos E17 thymic γδ T cells in B6 and B6.Sh2d1a-/- thymus. The mean and standard deviation are indicated. Data are the cumulative data from two independent experiments, n = 10 B6, 11 B6.Sh2d1a-/- pooled embryonic thymi, **p ≤ 0.01, ***p ≤ 0.001, ****p ≤ 0.0001, two-way ANOVA, Sidak’s multiple comparisons test.
-
Figure 3—source data 1
Frequency and number of immature CD4+CD8+ cMaf-RORγt+ E17 γδ T cells.
- https://cdn.elifesciences.org/articles/97229/elife-97229-fig3-data1-v1.xlsx
Figure 3—figure supplement 1

SAP-dependent regulation of immature BLK+PLZF+RORγt+ and BLK-PLZF+/-RORγt+ E17 thymic γδ T cells.
(A) Total number of E17 thymic γδ T cells in B6 and B6.Sh2d1a-/- E17 thymus. (B) E17 thymic Vγ4 developmental checkpoints. Left, uniform manifold approximation and projection (UMAP) representation of E17 B6 and B6.Sh2d1a-/- Vγ4 T cell flow cytometry data with selected FlowSOM clusters indicated by color. All other cells are shown in gray. Right, individual dot plots overlaid with the selected FlowSOM clusters from the UMAP plot. Data represent concatenated data from four B6 and four B6.Sh2d1a-/- TCRβnegTCRδpos γδ T cells and are representative of two independent experiments. (C) Cumulative frequency and number of the indicated FlowSOM populations shown in (B), *p ≤ 0.05, **p ≤ 0.01, ***p ≤ 0.001, unpaired t-test, corrected for multiple comparison using Holm–Sidak’s test. (D) Decreased BLK, but not PLZF expression in B6.Sh2d1a-/- γδ T cells. Above, histograms of BLK and PLZF in immature E17 γδ T cells. B6 BLK (dark gray) and PLZF (red) histograms are overlaid on B6.Sh2d1a-/- (light gray) histograms for comparison. Below, control stains lacking BLK or PLZF. (E) Representative contour plots of immature CD25neg E.17 Vγ4 T cells in B6 and B6.Sh2d1a-/- mice.
-
Figure 3—figure supplement 1—source data 1
Frequency and number of uniform manifold approximation and projection (UMAP)/FlowSOM clustered E17 thymic Vγ4 T cells.
- https://cdn.elifesciences.org/articles/97229/elife-97229-fig3-figsupp1-data1-v1.xlsx
Figure 4 with 3 supplements
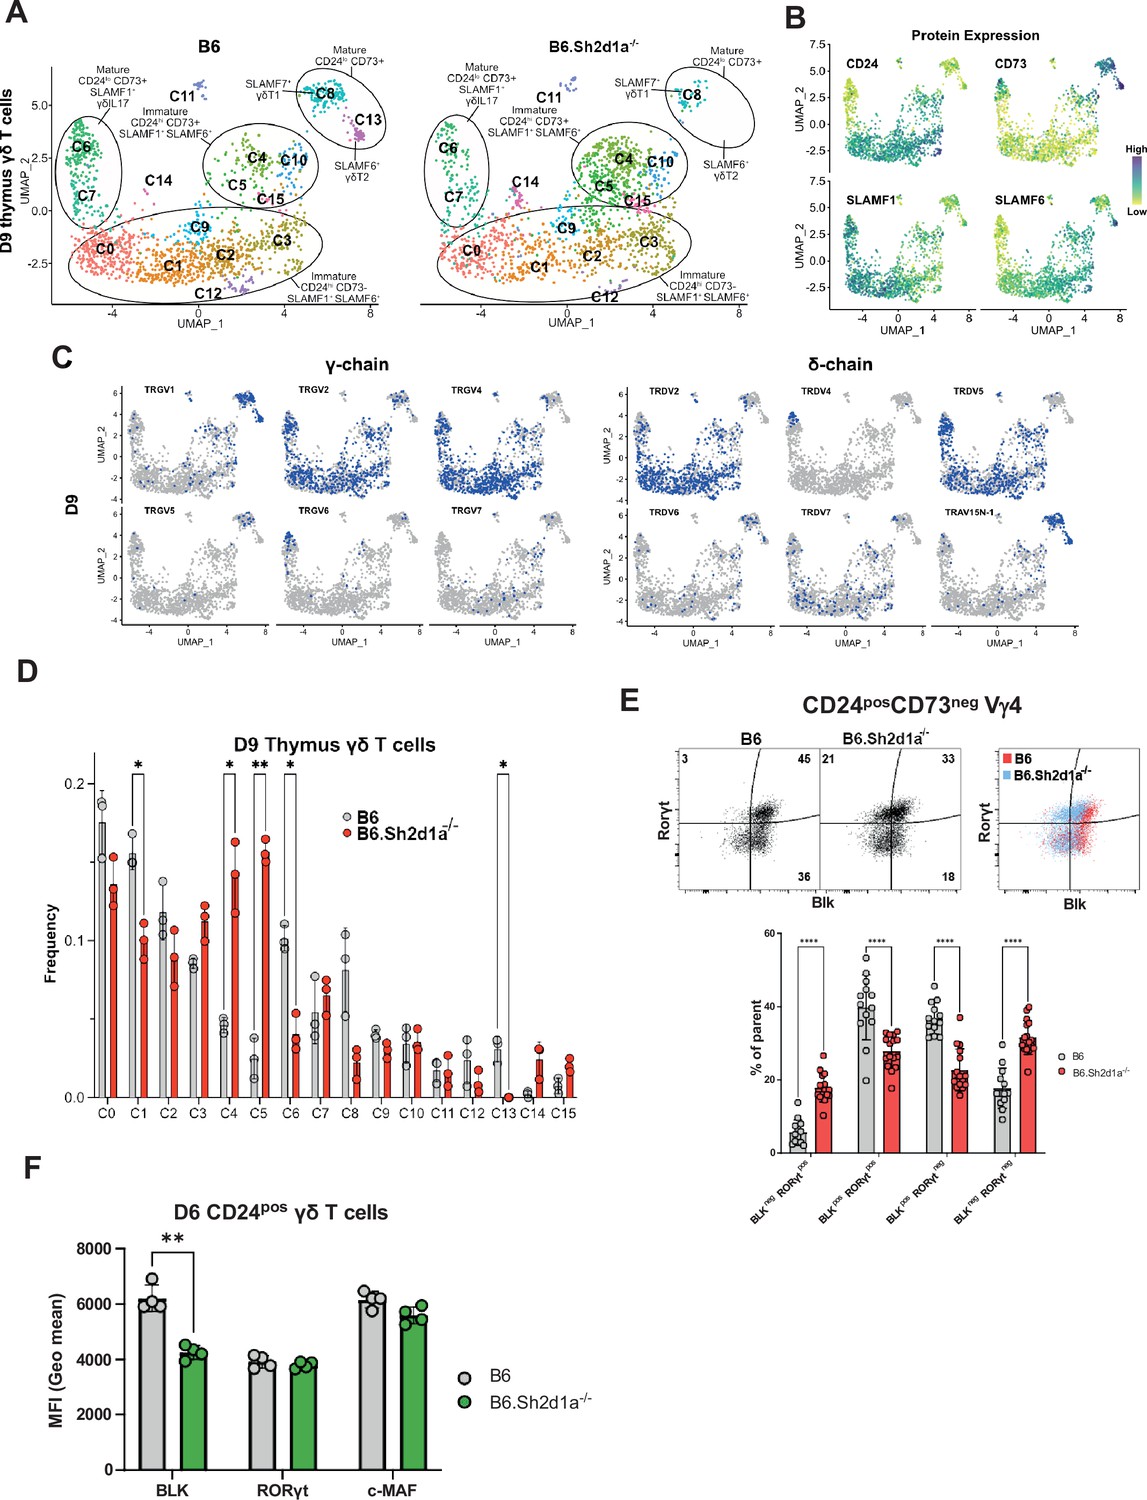
Identification of SAP-dependent developmental checkpoints during neonatal γδ T cell developmental programming.
(A) Uniform manifold approximation and projection (UMAP) representation of B6 (left) and B6.Sh2d1a-/- (right) γδ T cells from D9 neonatal thymi (n = 3 mice per strain). Cluster annotation is based on comprehensive protein and gene expression data. (B) Feature plots displaying cell surface protein expression patterns of CD24, CD73, SLAMF1, and SLAMF6 on D9 B6 thymus γδ T cells. Data are color-coded based on protein expression level (high: dark blue, low: yellow). (C) UMAP representation of D9 B6 thymic γδ T cells exhibiting selected TRGV4 (left) and TRDV (right) chain V-segment usage (in blue) in individual cells. (D) Frequencies of B6 and B6.Sh2d1a-/- D9 thymic γδ T cell clusters. Bars represent the mean cluster frequency, error bars represent standard deviation, *p ≤ 0.05, **p ≤ 0.01, two-way ANOVA, Sidak multiple comparisons test, 3 mice/strain. (E) Representative contour plots depicting BLK and RORγt expression in B6 and B6.Sh2d1a-/- CD24posCD73neg D9 Vγ4 T cells are shown above. Cumulative frequencies of BLK and RORγt expression are shown below. The mean and standard deviation are indicated. Data are the cumulative data from three independent experiments, n = 13 B6, 16 B6.Sh2d1a-/- mice, ****p ≤ 0.0001, two-way ANOVA, Sidak’s multiple comparisons test. (F) Decreased BLK expression in immature B6.Sh2d1a-/- γδ T cells. Data represent the mean expression of the indicated proteins in D6 neonate BLKpos, RORγtpos, or cMafpos thymic γδ T cells, **p ≤ 0.01.
-
Figure 4—source data 1
Comparison of BLK, RORγt, and cMaf expression among neonatal thymic γδ T cells.
- https://cdn.elifesciences.org/articles/97229/elife-97229-fig4-data1-v1.xlsx
Figure 4—figure supplement 1

Transcriptional heterogeneity in neonatal thymic γδ T cells.
(A) Dot plot showing scaled expression level of selected genes in B6 D9 thymic γδ T cells. Level of normalized expression is shown using a color scale ranging from low (yellow) to high (purple). Dot size represents the fraction of cells within each cluster that express the marker. (B) Violin plots showing the specificity of the oligo-conjugated antibody derived tags (ADT) to cell surface proteins (CD24, CD73, SLAMF1, SLAMF6) among different B6 D9 thymus γδ T cell clusters. (C) Violin plots showing expression levels of selected genes among individual clusters in the B6 D9 thymic γδ T cells. (D) Violin plots showing expression levels of Zbtb16 gene (expressing PLZF) among individual clusters in the B6 E17 (top) and D9 (bottom) thymic γδ T cells.
Figure 4—figure supplement 2

Flow cytometric analysis of D9 thymic γδ T cells.
(A) SLAMF6 and SLAMF7 expression defines γδNKT cell subsets. Left, representative dot plot of PLZF and T-bet expression in B6 D9 thymic Vγ1Vδ6.3 γδNKT cells. Representative contour plots of ICOS and NK1.1 (top right) and SLAMF6 and SLAMF7 (bottom right) staining in PLZFhiT-betlow and PLZFlowT-bethigh subsets are shown at right. Data are representative of two independent experiments with a total of ten mice. (B) Left, representative dot plot of SLAMF6 and SLAMF7 expression in B6 D9 thymic Vγ1Vδ6.3 γδNKT cells. Right, representative dot plots of intracellular IL4 and IFN-γ expression in SLAMF6hiSLAMF7low, SLAMF6highSLAMF7hi, and SLAMF6lowSLAMF7hi γδNKT cell subsets. Numbers indicate percentage. Cumulative data of IL-4 and IFN-γ expression is shown below. Data are representative of two independent experiments with a total of 10 mice. (C) Increased number of immature CD200-S1P1+ γδ T cells in SAP-deficient neonatal thymus.
-
Figure 4—figure supplement 2—source data 1
Phenotypic characterization of neonatal thymic γδ T cells.
- https://cdn.elifesciences.org/articles/97229/elife-97229-fig4-figsupp2-data1-v1.xlsx
Figure 4—figure supplement 3

scRNAseq with TCR repertoire profiling of B6 and B6.Sh2d1a-/- adult thymic γδ T ells.
(A) Uniform manifold approximation and projection (UMAP) representation of B6 and B6.Sh2d1a-/- adult thymus (6 weeks old) γδ T cells, n = 3 mice per strain. (B) Feature plots illustrating the cell surface protein expression profiles of CD24, CD73, SLAMF1, and SLAMF6 on adult thymic γδ T cells. Each data point represents a cell, color-coded to indicate varying protein expression levels (high: dark blue, low: yellow). (C) Frequencies of B6 and B6.Sh2d1a-/-γδ T cell clusters. Bars represent the mean cluster frequency, error bars represent standard deviation, *p ≤ 0.05, **p ≤ 0.01, ****p ≤ 0.0001, two-way ANOVA, Sidak multiple comparisons test. (D) Dot plot showing scaled expression level of selected genes in B6 adult thymic γδ T cells. Level of normalized expression is shown using a color scale ranging from low (yellow) to high (purple). Dot size represents the fraction of cells within each cluster that express the marker. (E) Expression of selected TRG (left) and TRDs chain (right) V-segment usage (blue) by individual adult thymus γδ Τ cells in B6 and B6.Sh2d1a-/- mice.
Figure 5
SAP shapes the neonatal γδ TCR repertoire.
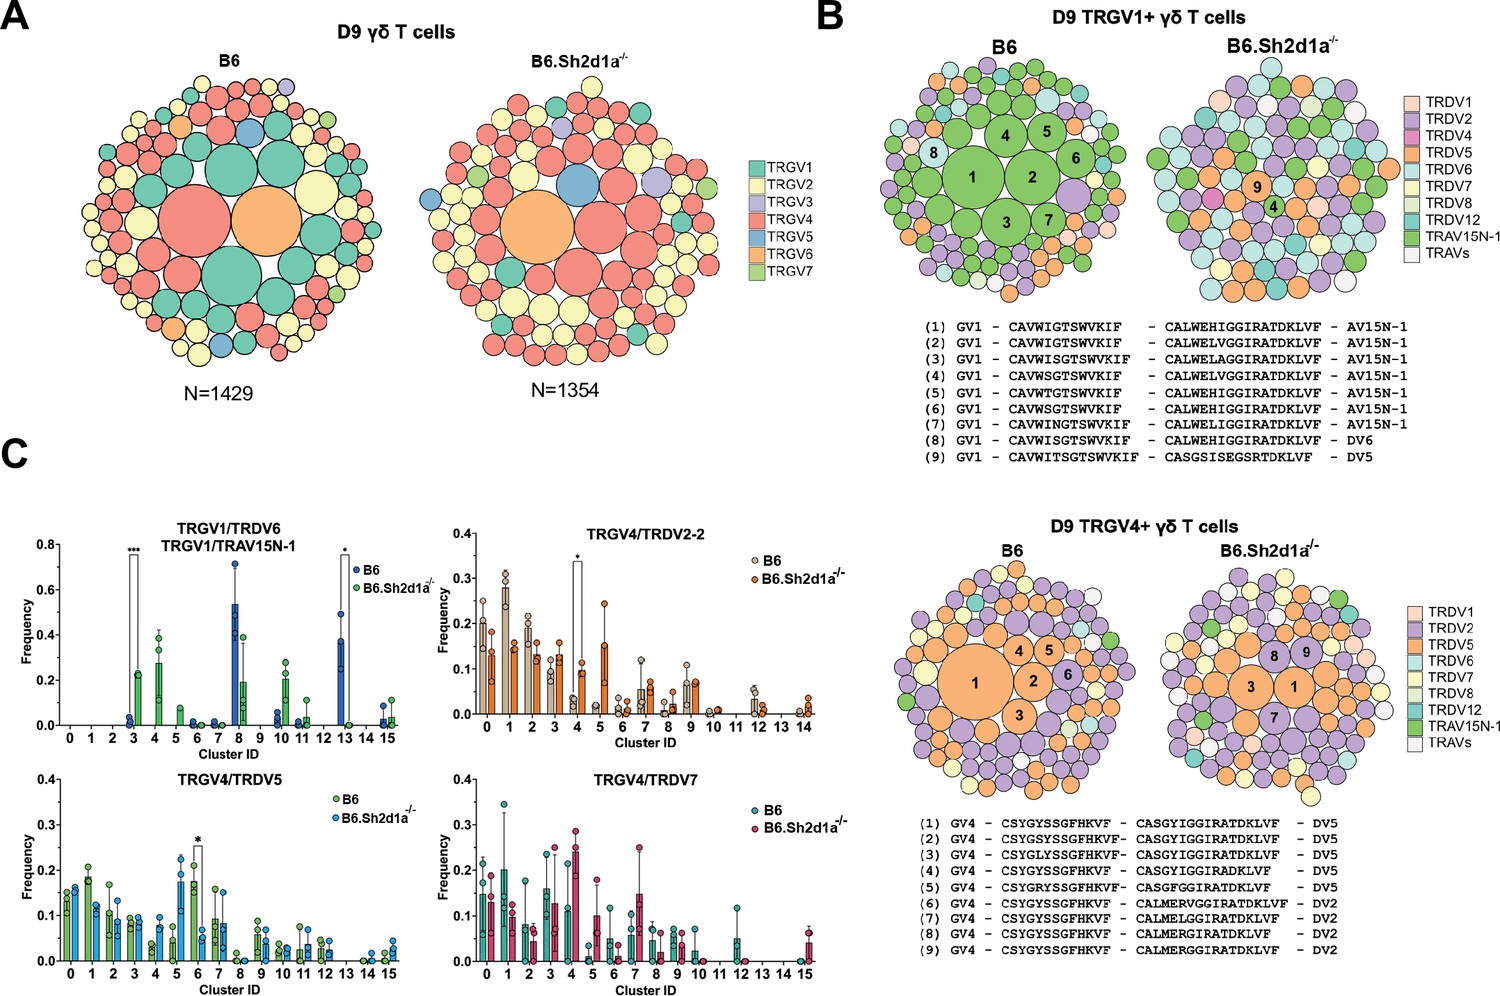
(Α) TCR clonotype bubble plots depicting the top 100 B6 and B6.Sh2d1a-/- TCR clonotypes among D9 thymic γδ T cells. Each bubble represents a unique clonotype, is sized according to its frequency as a percentage of all γδ T cells n = 1429 B6, 1354 B6.Sh2d1a-/- cells, and is colored based on specific TRGV chains utilized. (B) TCR clonotype bubble plots depicting the top 100 B6 and B6.Sh2d1a-/- TRGV1 (above) and TRGV4 (below) clonotypes among D9 γδ T cells. Bubble size indicates clonotype frequency as a percentage of TRGV1+ (n = 198 B6, 98 B6.Sh2d1a-/-) or TRGV4+ (n = 646 B6, 669 B6.Sh2d1a-/-) cells, and colors correspond to specific TRDV chains. Selected clonotypes are numbered and their corresponding CDR3γ and CDR3δ sequences are displayed below. (C) Distribution of selected TRGV/TRDV clonotypes among B6 and B6.Sh2d1a-/- D9 thymic γδ T cell clusters. Data are representative of 3 mice/strain, *p ≤ 0.05, ***p ≤ 0.001, two-way ANOVA, Sidak multiple comparisons test.
-
Figure 5—source data 1
TCR clonotype distribution among neonatal B6 and B6.Sh2d1a-/- gamma delta T cells.
- https://cdn.elifesciences.org/articles/97229/elife-97229-fig5-data1-v1.xlsx
Figure 6 with 1 supplement
Restricted TCR repertoire in peripheral innate-like γδT1 and γδT17 subsets.
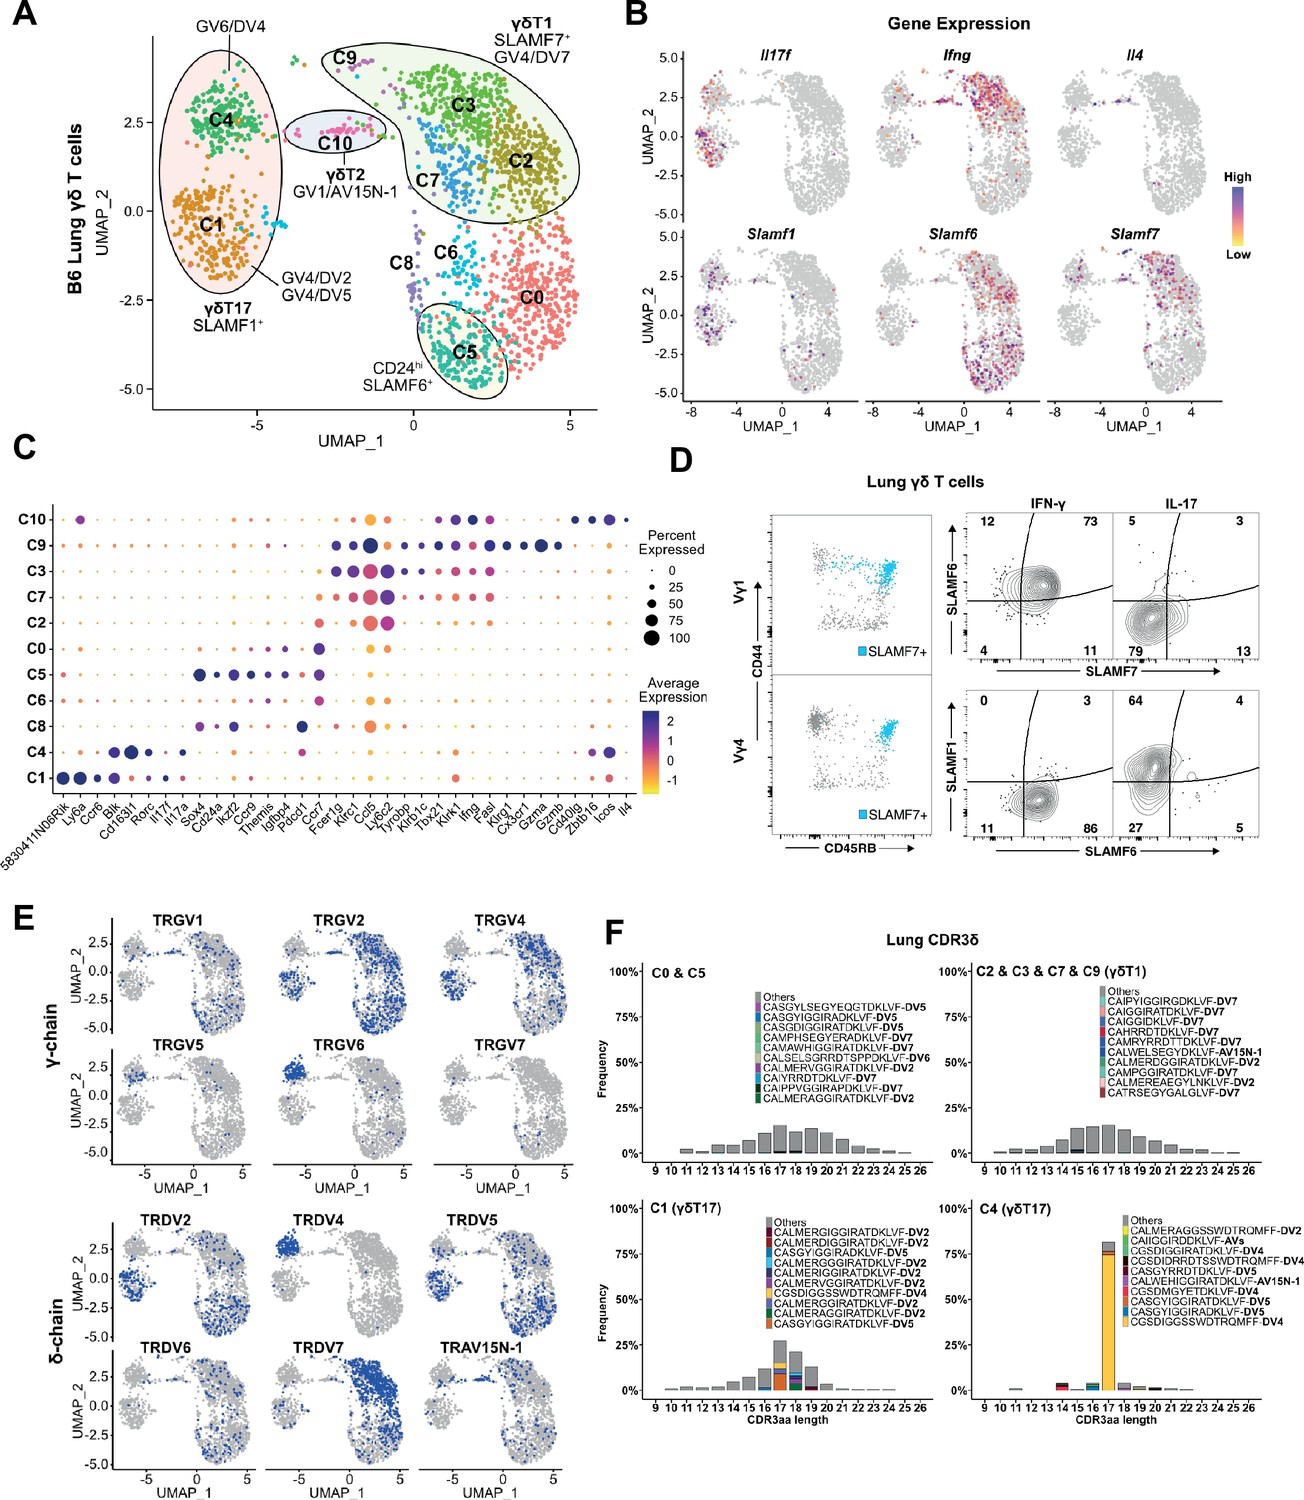
(A) Uniform manifold approximation and projection (UMAP) representation of B6 adult lung γδ T cells. Clusters are annotated based on gene expression and TCR profiling data. (B) Feature plot displaying gene expression profiles of selected genes among individual B6 lung γδ T cells, color-coded based on gene expression levels. (C) Dot plot indicating scaled expression levels of selected genes in B6 lung γδ T cells, with dot size representing the fraction of cells within each cluster expressing the marker. (D) SLAMF6 and SLAMF7 co-expression marks CD44+CD45RB+ IFN-γ-producing cells in the periphery. Representative dot plots (left) of CD44 and CD45RB expression on lung Vγ1 (top) and Vγ4 (bottom) γδ T cells. SLAMF7-expressing cells are highlighted in blue. Representative contour plots (right) of SLAMF1, SLAMF6, and SLAMF7 expression on IFN-γ+ and IL-17+ lung γδ T cells. (E) UMAP representation of B6 lung γδ T cells indicating selected TRG and TRD chain V-segment usage (blue). (F) Amino acid length distribution of lung CDR3δ clonotypes among immature C0/C5, γδT1 C2/C3/C7/C9, γδT17 C1, and γδT17 C4 clusters. The top 10 clonotypes in each group are color-coded, while all other clonotypes are shown in gray.
Figure 6—figure supplement 1

Lung Vγ4 exhibit a high usage of TRDV7 chains with a diverse CDR3.
(A) TRDV usage among FACS-sorted lung Vγ4 γδ Τ cells from seven male and six female mice. (B) Left, amino acid length distribution of top lung TRDV5+ CDR3δ clonotypes in the lung Vγ4 γδ T cell population. Right, distribution of the most frequent clonotypes among individual B6 mice. (C) Left, amino acid length distribution of top lung TRDV2+ CDR3δ clonotypes in the lung Vγ4 γδ T cell population. Right, distribution of the most frequent clonotypes among individual B6 mice. (D) Left, amino acid length distribution of top lung TRDV7+ CDR3δ clonotypes in the lung Vγ4 γδ T cell population. Right, distribution of the most frequent clonotypes among individual B6 mice. (E) Left, amino acid length distribution of top lung TRGV4+ CDR3γ clonotypes in the lung Vγ4 γδ T cell population. Right, distribution of the most frequent clonotypes among individual B6 mice.
Figure 7 with 1 supplement
Specific decrease in Vγ4/Vδ7 γδT1 cells in the lungs of SAP-deficient mice.
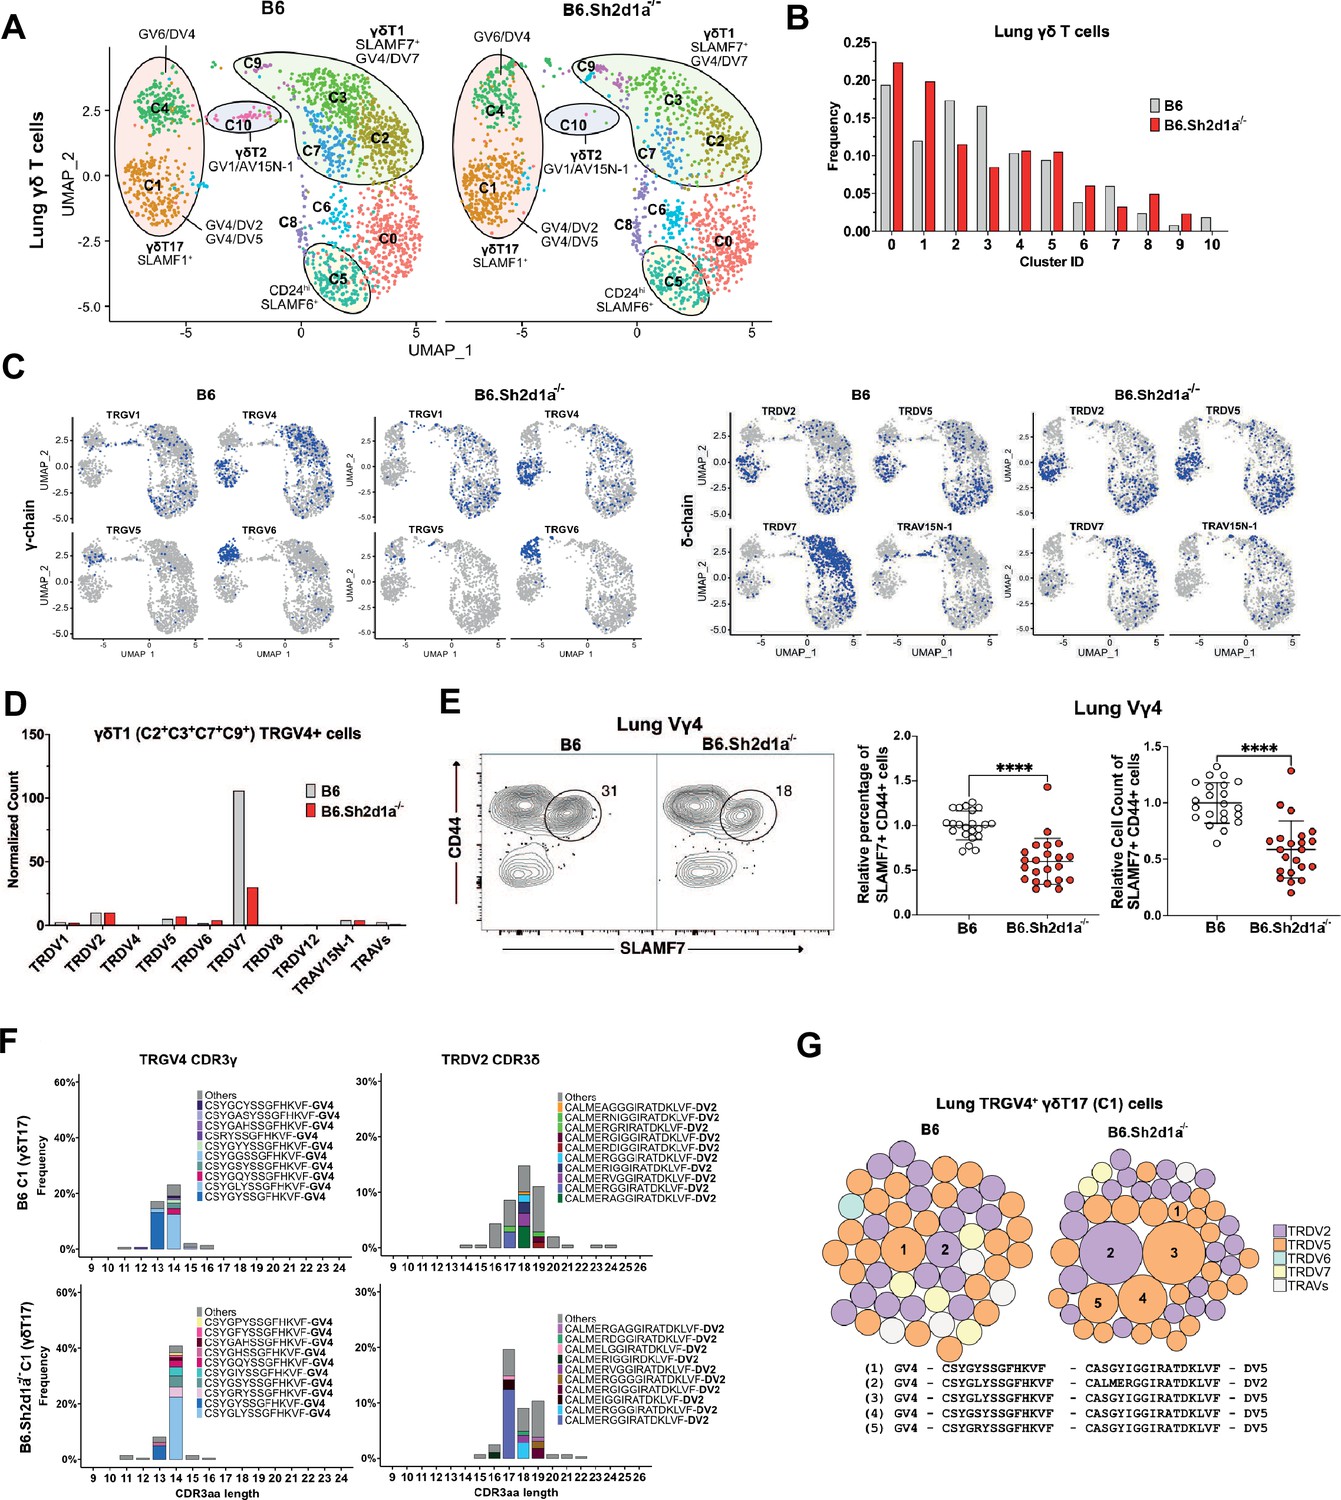
(A) Uniform manifold approximation and projection (UMAP) representation of B6 (left) and B6.Sh2d1a-/- (right) lung γδ T cells, pooled from 3 mice per strain. (B) SAP-dependent variation in lung γδ T cell cluster frequencies. The frequency of each B6 and B6.Sh2d1a-/- cluster as a percentage of all lung γδ T cells is shown. (C) UMAP representation of selected TRG and TRD chain V-segment usage (blue) among B6 and B6.Sh2d1a-/- lung γδ T cells. (D) SAP-dependent decrease in lung γδT1 TRGV4/TRDV7. Normalized TRDV counts in B6 and B6.Sh2d1a-/- lung TRGV4+ γδT1 clusters (C2/C3/C7/C9). (E) SAP-dependent decrease in SLAMF7+ lung Vγ4 T cells. Representative contour plots of CD44 and SLAMF7 expression in B6 (left) and B6.Sh2d1a-/- (right) lung Vγ4 γδ T cells are shown at left. Relative frequencies and counts of CD44+SLAMF7+ lung Vγ4 cells is shown at right. Data represent the cumulative data from five independent experiments, ****p < 0.0001 using unpaired t-test. (F) SAP-dependent skewing of the lung γδT17 TCR repertoire. Amino acid length distributions of B6 and B6.Sh2d1a-/- TRGV4+ CDR3γ (left) and TRDV2+ CDR3δ (right) sequences in the lung Vγ4 γδT17 C1 cluster. The top 10 clonotypes are color-coded and all other clonotypes are shown in gray. Bars represent the frequency of γδ T cells in the c1 cluster. (G) TCR clonotype bubble plots depicting the top 50 lung TRGV4 clonotypes in the C1 γδT17 cluster. Bubble size indicates clonotype frequency as a percentage of C1 Vγ4 (n = 62 B6, 104 B6.Sh2d1a-/-) T cells, and colors correspond to specific TRDV chains. Selected clonotypes are numbered and their corresponding CDR3γ and CDR3δ sequences are displayed below.
Figure 7—figure supplement 1

Significant and specific reduction of peripheral TRGV4/TRDV7+ γδT1 in B6.Sh2d1a-/- mice.
(A) The relative expression of the specified TRDV transcripts in adult lung and spleen CD45+ leukocytes (normalized to total TRDC transcript levels) in B6 and B6.Sh2d1a-/- mice, **p < 0.01, ****p < 0.0001, two-way ANOVA followed by Sidak multiple comparisons test. (B) SAP-dependent decrease in CD44+SLAMF7+ spleen Vγ4 T cells. The relative percentage and count of CD44+SLAMF7+ Vγ4 cells in B6 and B6.Sh2d1a-/- spleen subsets are shown. Data are representative of five independent experiments with 3–5 mice per strain per experiment, ****p < 0.0001, as determined by unpaired t-tests. (C) No difference in lung Vγ4 homeostasis in B6.Sh2d1a-/- mice. Top left, representative contour plots showing the frequency of BrdU staining in B6 and B6.Sh2d1a-/- lung γδ T cells. Cumulative data from two independent experiments are shown at top right. Bottom left, representative contour plots depicting Annexin V and Live/Dead staining in B6 and B6.Sh2d1a-/- lung γδ T cells. Cumulative results are shown at bottom right, and are representative of three independent experiments.
-
Figure 7—figure supplement 1—source data 1
Characterization of Vγ4 γδT1 in B6 and B6.Sh2d1a-/- periphery.
- https://cdn.elifesciences.org/articles/97229/elife-97229-fig7-figsupp1-data1-v1.xlsx
Tables
Key resources table
| Reagent type (species) or resource | Designation | Source or reference | Identifiers | Additional information |
|---|---|---|---|---|
| Strain, strain background (Mus musculus) | C57BL/6J | Jackson Laboratory | Cat#: 000664 | |
| Strain, strain background (Mus musculus) | B6.129S6-Sh2d1atm1Pls/J | Jackson Laboratory | Cat#: 025754 | |
| Biological sample (Mus musculus) | Thymus, spleen, lung | This paper | Freshly isolated tissue | |
| Antibody | Anti-mouse CD16/32, Fc block (rat monoclonal) | Biolegend | Cat#: 101301 | (1:200) |
| Antibody | Anti-CD4-BUV395 (rat monoclonal) | Thermo Fisher | Cat#: 363-0042-82 | (1:500) |
| Antibody | Normal Rat Serum (IgG) | Stem Cell Technologies | Cat#: 13551 | (1:200) |
| Antibody | Anti-CD11b-Alexa Fluor 647 (rat monoclonal) | Biolegend | Cat#: 101220 | (1:1000) |
| Antibody | Anti-CD11c-Alexa Fluor 647 (rat monoclonal) | Biolegend | Cat#: 117314 | (1:200) |
| Antibody | Annexin V Conjugate | Thermo Fisher | Cat#: 35111 | (1:20) |
| Antibody | Anti-CD19-Alexa Fluor 647 (rat monoclonal) | Biolegend | Cat#: 115525 | (1:500) |
| Antibody | Anti-CD24-SB600 (rat monoclonal) | Thermo Fisher | Cat#: 63-0242-82 | (1:200) |
| Antibody | Anti-CD24-BV605 (rat monoclonal) | Biolegend | Cat#: 101827 | (1:400) |
| Antibody | Anti-CD25-PE-Dazzle594 (rat monoclonal) | Biolegend | Cat#: 102048 | (1:500) |
| Antibody | Anti-CD25-Alexa Fluor 488 (rat monoclonal) | Biolegend | Cat#: 102017 | (1:800) |
| Antibody | Anti-CD27-PE-Dazzle594 (hamster monoclonal) | Biolegend | Cat#: 124228 | (1:400) |
| Antibody | Anti-CD44-BV510 (rat monoclonal) | Biolegend | Cat#: 103044 | (1:400) |
| Antibody | Anti-CD45RB-APC-Cy7 (rat monoclonal) | Biolegend | Cat#: 103310 | (1:800) |
| Antibody | Anti-CD73-APC-F750 (rat monoclonal) | Biolegend | Cat#: 127222 | (1:400) |
| Antibody | Anti-CD150-BV650 (rat monoclonal) | Biolegend | Cat#: 115931 | (1:400) |
| Antibody | Anti-CD196-BV785 (hamster monoclonal) | Biolegend | Cat#: 129823 | (1:200) |
| Antibody | Anti-CD319-APC (rat monoclonal) | Biolegend | Cat#: 152004 | (1:800) |
| Antibody | Anti-cMAF-Alexa488 (mouse monoclonal) | Thermo Fisher | Cat#: 53-9855-82 | (1:100) |
| Antibody | Anti-IFNγ-PE (rat monoclonal) | Biolegend | Cat#: 505808 | (1:200) |
| Antibody | Anti-IL17a-BV605 (rat monoclonal) | Biolegend | Cat#: 506927 | (1:200) |
| Antibody | Anti-IL4-PE-Cy7 (rat monoclonal) | Biolegend | Cat#: 504118 | (1:100) |
| Antibody | Anti-PLZF-PE (hamster monoclonal) | Biolegend | Cat#: 145804 | (1:100) |
| Antibody | Anti-T-bet-PE-Dazzle-594 (mouse monoclonal) | Biolegend | Cat#: 644828 | (1:200) |
| Antibody | Anti-TCRb-Alexa647 (hamster monoclonal) | Biolegend | Cat#: 109218 | (1:800) |
| Antibody | Anti-Vγ5-FITC (hamster monoclonal) | BD Biosciences | Cat#: 553229 | (1:300) |
| Antibody | Anti-Vδ6.3-R718 (hamster monoclonal) | BD Biosciences | Cat#: 752197 | (1:250) |
| Antibody | Anti-RORγt-PE-CF594 (mouse monoclonal) | BD Biosciences | Cat#: 562684 | (1:200) |
| Antibody | Anti-TCRδ-BB700 (hamster monoclonal) | BD Biosciences | Cat#: 745818 | (1:100) |
| Antibody | Anti-Vγ1-BV421 (hamster monoclonal) | Biolegend | Cat#: 141116 | (1:300) |
| Antibody | Anti-CD8α-Alexa700 (rat monoclonal) | Thermo Fisher | Cat#: 56-0081-82 | (1:400) |
| Antibody | Anti-CD45-eFluor506 (rat monoclonal) | Thermo Fisher | Cat#: 69-0451-82 | (1:400) |
| Antibody | Anti-CD200-PerCP-eF710 (rat monoclonal) | Thermo Fisher | Cat#: 46-5200-82 | (1:500) |
| Antibody | Anti-CD278-SB645 (rat monoclonal) | Thermo Fisher | Cat#: 64-9942-82 | (1:1000) |
| Antibody | Anti-Ki67-PE-eFluor610 (rat monoclonal) | Thermo Fisher | Cat#: 61-5698-82 | (1:1000) |
| Antibody | Anti-Ly108-BUV615 (13G3 monoclonal) | BD Bioscience | Cat#: 751341 | (1:400) |
| Antibody | Anti-TCR-Vγ4-PE-Cy7 (hamster monoclonal) | Thermo Fisher | Cat#: 25-5828-82 | (1:400) |
| Antibody | Anti-S1P1 (rat monoclonal) | R&D Systems | Cat#: FAB7089P | (1:100) |
| Antibody | Anti-Blk (rabbit polyclonal) | Cell Signaling Technologies | Cat#: 3262S | (1:200) |
| Antibody | Anti-Vdelta1 (17D1) (rat monoclonal) | Willi Born; National Jewish Health, CO, USA | Hybridoma | |
| Sequence-based reagent | GDC1F | This paper | Sequence is in Materials and methods | |
| Sequence-based reagent | GC1R1 | This paper | Sequence is in Materials and methods | |
| Sequence-based reagent | GC1R2 | This paper | Sequence is in Materials and methods | |
| Sequence-based reagent | DC1R1 | This paper | Sequence is in Materials and methods | |
| Sequence-based reagent | GDC2F | This paper | Sequence is in Materials and methods | |
| Sequence-based reagent | GC2R1 | This paper | Sequence is in Materials and methods | |
| Sequence-based reagent | GC2R2 | This paper | Sequence is in Materials and methods | |
| Sequence-based reagent | DC2R1 | This paper | Sequence is in Materials and methods | |
| Commercial assay or kit | Fixable UV LIVE/DEAD Kit | Thermo Fisher Scientific | Cat#: L23105 | (1:400) |
| Commercial assay or kit | BD Horizon Brilliant Staining Buffer | BD Biosciences | Cat#: 566349 | |
| Commercial assay or kit | Invitrogen eBioscience Foxp3/Transcription Factor Fixation/Permeabilization Concentrate and Diluent | Thermo Fisher Scientific | Cat#: 50-112-9060 | |
| Commercial assay or kit | BrdU Flow Kit | BD Biosciences | Cat#: 559619 | |
| Commercial assay or kit | Fixable Viability Dye eFluor 780 | Thermo Fisher Scientific | Cat#: 65-0865-14 | (1:1000) |
| Commercial assay or kit | Binding Buffer for Annexin V (10×) | Thermo Fisher Scientific | Cat#: 00-0055-43 | |
| Chemical compound, drug | 5-bromo-deoxyuridine (BrdU) | Sigma-Aldrich | Cat#: 19-160 | |
| Software, algorithm | FlowJo | BD Biosciences | ||
| Software, algorithm | R | R Foundation | RRID:SCR_001905 |
Additional files
-
Supplementary file 1
Cluster-specific gene markers for thymic gamma delta T cells.
- https://cdn.elifesciences.org/articles/97229/elife-97229-supp1-v1.xlsx
-
Supplementary file 2
TCR clonotypes in B6 and B6.Sh2d1a-/- thymic gamma delta T cells.
- https://cdn.elifesciences.org/articles/97229/elife-97229-supp2-v1.xlsx
-
Supplementary file 3
Pseudobulk analysis of differential gene expression among immature B6 and B6.Sh2d1a-/- thymic gamma delta T cells.
- https://cdn.elifesciences.org/articles/97229/elife-97229-supp3-v1.xlsx
-
Supplementary file 4
Bulk RNAseq differential gene expression between neonatal immature B6 and B6.Sh2d1a-/- gamma delta T cells.
- https://cdn.elifesciences.org/articles/97229/elife-97229-supp4-v1.xlsx
-
Supplementary file 5
Cluster-specific gene markers for adult lung gamma delta T cells.
- https://cdn.elifesciences.org/articles/97229/elife-97229-supp5-v1.xlsx
-
Supplementary file 6
TCR clonotypes in B6 and B6.Sh2d1a-/- lung gamma delta T cells.
- https://cdn.elifesciences.org/articles/97229/elife-97229-supp6-v1.xlsx
-
MDAR checklist
- https://cdn.elifesciences.org/articles/97229/elife-97229-mdarchecklist1-v1.pdf
Download links
A two-part list of links to download the article, or parts of the article, in various formats.
Downloads (link to download the article as PDF)
Open citations (links to open the citations from this article in various online reference manager services)
Cite this article (links to download the citations from this article in formats compatible with various reference manager tools)
SLAM/SAP signaling regulates discrete γδ T cell developmental checkpoints and shapes the innate-like γδ TCR repertoire
eLife 13:RP97229.
https://doi.org/10.7554/eLife.97229.3


