The Kv2.2 channel mediates the inhibition of prostaglandin E2 on glucose-stimulated insulin secretion in pancreatic β-cells
- School of Life Sciences, Fudan University, China
- International Human Phenome Institute (Shanghai), China
- Department of Endocrinology and Metabolism, Huashan Hospital, Fudan University, China
- State Key Laboratory of Medical Neurobiology and MOE Frontiers Center for Brain Science, and the Institutes of Brain Science, Fudan University, China
Figures
Figure 1
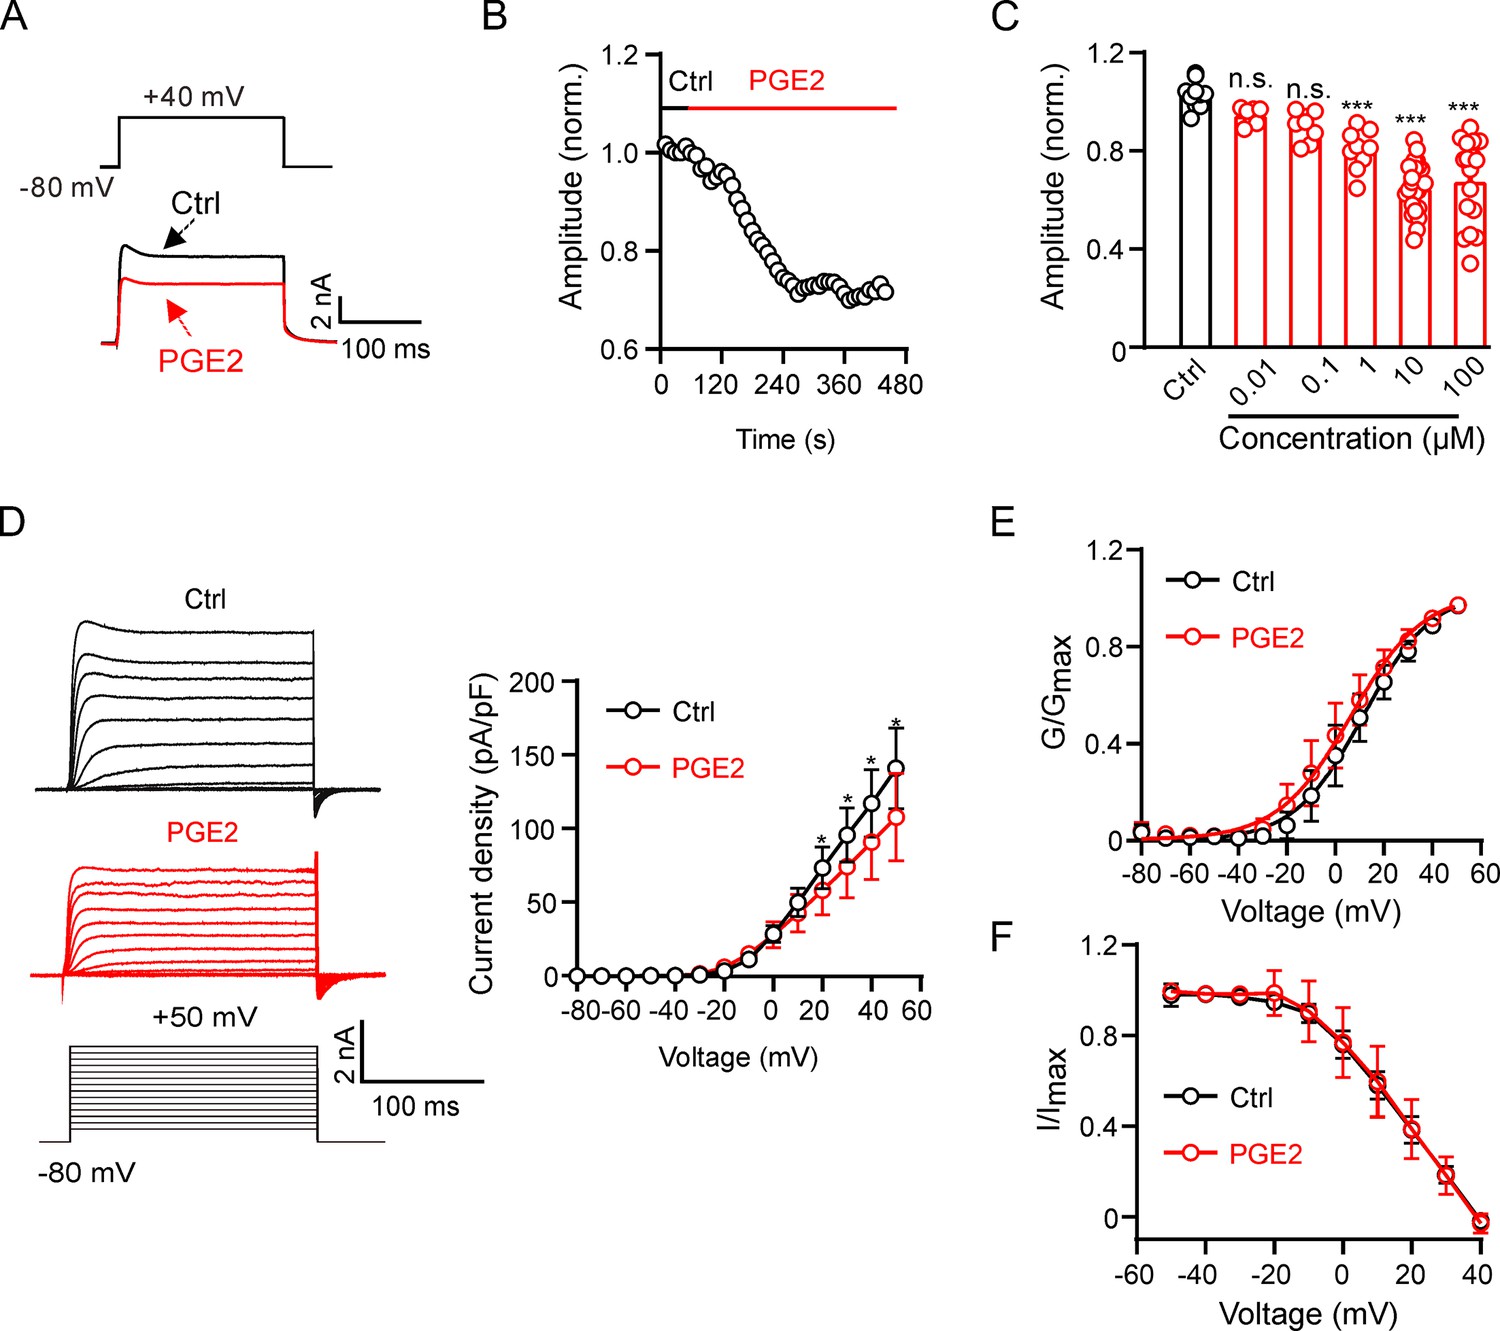
Prostaglandin E2 (PGE2) inhibits Kv2.2 channels in HEK293T cells.
(A) Representative Kv2.2 current traces induced by a depolarization pulse from –80 to +40 mV under the control condition (black) and subsequently in the presence of 10 μM PGE2 (red) in the same HEK293T cell. PGE2 was applied to the extracellular solution and recordings taken at an interval of 10 s. (B) The time course of the Kv2.2 current inhibition by 10 μM PGE2. (C) PGE2 inhibited Kv2.2 currents in a concentration-dependent manner. n.s., not significant. ***p<0.001. One-way ANOVA with Bonferroni post hoc test (0.01 μM: n=7, p=0.4002; 0.1 μM: n=8, p=0.0672; 1 μM: n=9, ***p=0.0002; 10 μM: n=24, ***p<0.0001; 100 μM: n=17, ***p<0.0001). (D) Left, representative Kv2.2 current recordings in response to 200 ms 10 mV depolarizing steps from –80 to +50 mV in the control (top, black) and PGE2-treated (bottom, red) groups. Right, plot of the current-voltage relationship from left (n=7 for each data point). *p<0.05. Two-tailed paired t-test. (E) Plot of Kv2.2 current activation curves in the control (black) and PGE2-treated (red, n=7 for each data point) groups. (F) Plot of Kv2.2 current inactivation curves in the control (black) and PGE2-treated (red, n=7 for each data point) groups.
-
Figure 1—source data 1
Statistical data for Figure 1B–F.
- https://cdn.elifesciences.org/articles/97234/elife-97234-fig1-data1-v1.xlsx
Figure 2
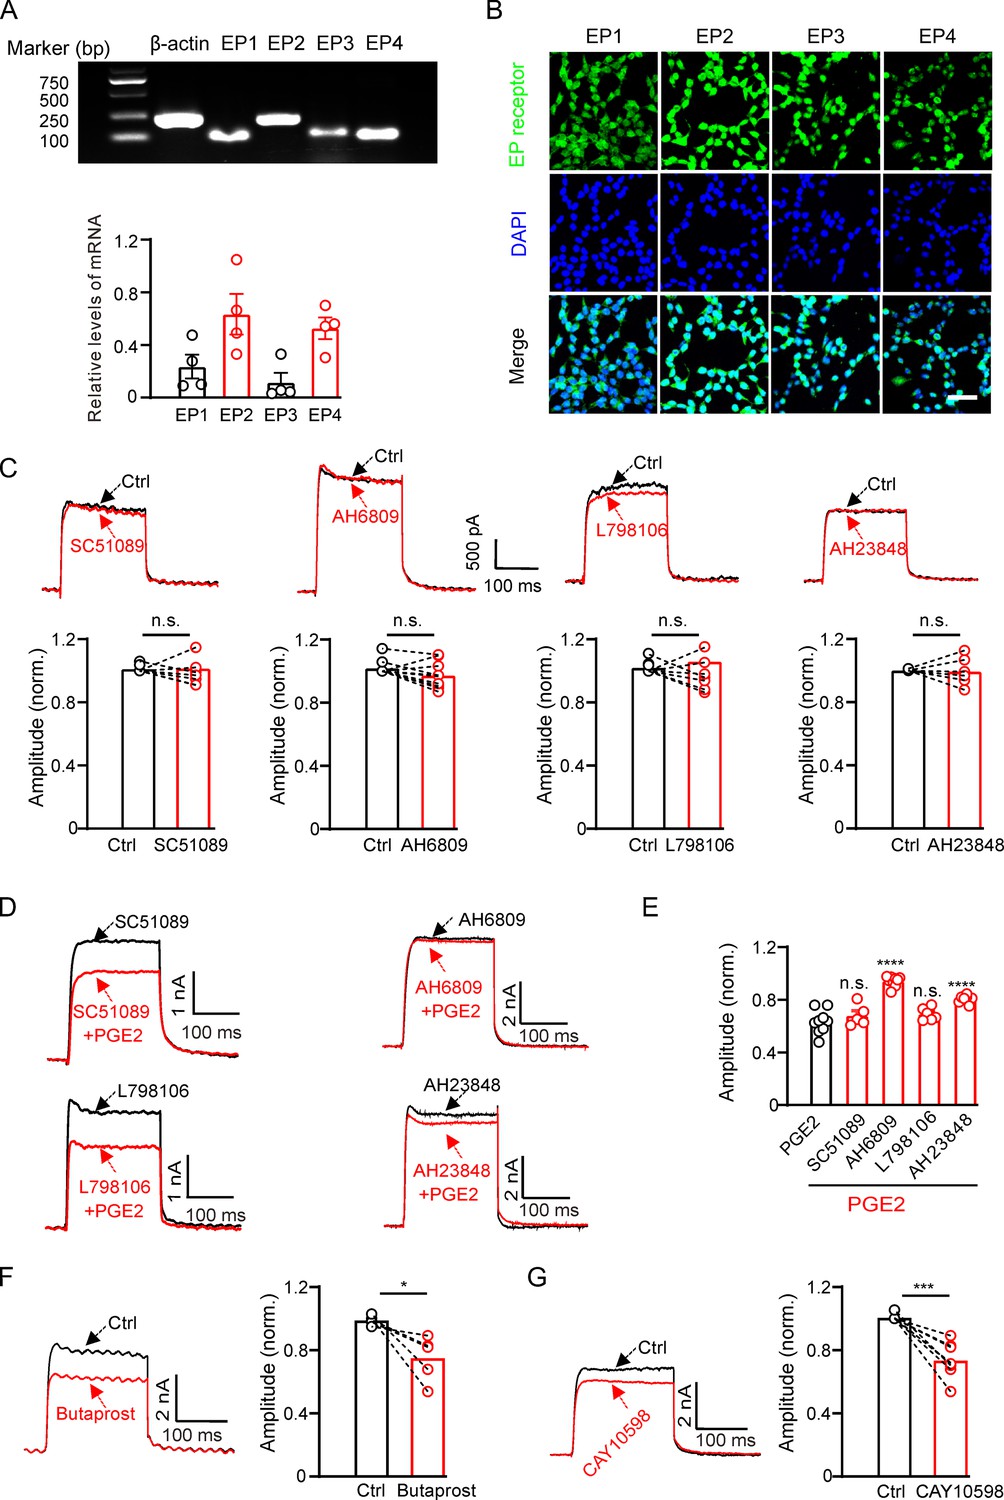
Prostaglandin E2 (PGE2) inhibits Kv2.2 currents via the EP2/EP4 signaling pathway in HEK293T cells.
(A) Top, real-time polymerase chain reaction (RT-PCR) showing the mRNA expression of EP1–4 receptors in HEK293T cells. Bottom, statistics of the mRNA expression of EP1–4 receptors in HEK293T cells (n=4). (B) Representative examples of immunofluorescence images showing expression of EP1–4 receptors in HEK293T cells. Scale bar, 20 μm. (C) SC51089 (the EP1 receptor antagonist), AH6809 (the EP2 receptor antagonist), L798106 (the EP3 receptor antagonist), and AH23848 (the EP4 receptor antagonist) per se did not alter Kv2.2 currents. n.s., not significant (SC51089: n=8, p=0.9154; AH6809: n=10, p=0.0661; L798106: n=9, p=0.5581; AH23848: n=6, p=0.8827). (D) Representative Kv2.2 current traces induced by a depolarization pulse from –80 to +40 mV in the presence of SC51089, AH6809, L798106, and AH23848 respectively, and subsequently in the presence of an additional 10 μM PGE2 in the same HEK293T cell. (E) Statistical analysis showing the effect of EP1–4 antagonists on PGE2-induced inhibition of Kv2.2 channels. ****p<0.001 versus PGE2 alone by a two-tailed unpaired t-test. n.s., not significant (+SC51089: n=5, p=0.3997; +AH6809: n=10, ****p<0.0001; +L798106: n=6, p=0.1785; +AH23848: n=8, ****p<0.0001). (F) Left, representative Kv2.2 current traces induced by a depolarization pulse from –80 to +40 mV under the control condition and subsequently in the presence of the EP2 receptor agonist butaprost in the same HEK293T cell. Right, statistics for the amplitude of Kv2.2 currents from left using a two-tailed paired t-test (n=5, *p=0.0306). (G) Similar to F, but with the EP4 receptor agonist CAY10598 in the extracellular solution (n=8, ***p=0.0003).
-
Figure 2—source data 1
Statistical data for Figure 2A, C, E, F, and G.
- https://cdn.elifesciences.org/articles/97234/elife-97234-fig2-data1-v1.xlsx
-
Figure 2—source data 2
Uncropped DNA gel image for Figure 2A.
- https://cdn.elifesciences.org/articles/97234/elife-97234-fig2-data2-v1.zip
-
Figure 2—source data 3
PDF file containing uncropped DNA gel image for Figure 2A, indicating the relevant bands and treatments.
- https://cdn.elifesciences.org/articles/97234/elife-97234-fig2-data3-v1.zip
Figure 3
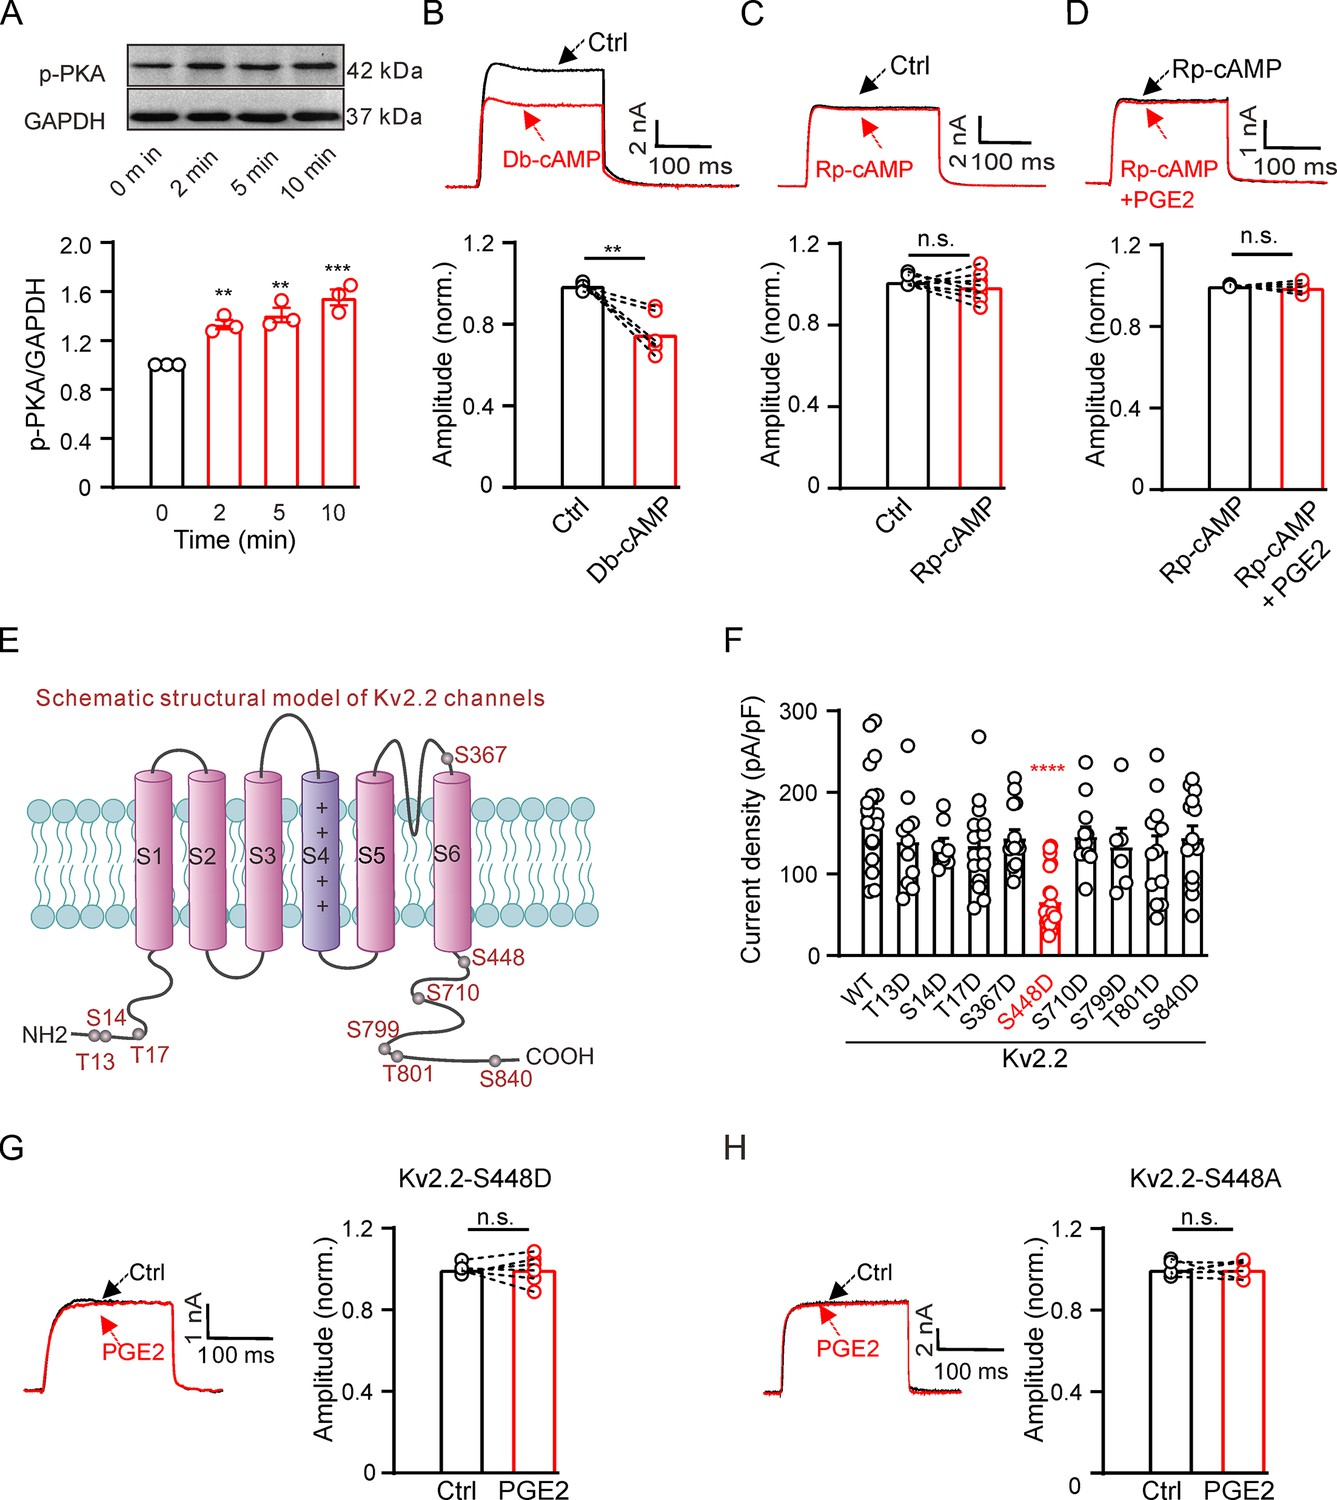
Prostaglandin E2 (PGE2) inhibits Kv2.2 currents via the PKA signaling pathway.
(A) Top, representative western blot showing the PKA phosphorylation level in HEK293T cells following treatment with 10 μM PGE2 for time intervals of 2, 5, and 10 min. Bottom, statistics from three independent experiments using a one-way ANOVA with Bonferroni post hoc test (n=3; 2 min: **p=0.0078; 5 min: **p=0.002; 10 min: ***p=0.0002). (B) Top, representative Kv2.2 current traces induced by a depolarization pulse from –80 to +40 mV under the control condition (black) and subsequently in the presence of 10 μM Db-cAMP (red) in the same HEK293T cell. Bottom, statistics for the amplitude of Kv2.2 currents from top using a two-tailed paired t-test (n=6, **p=0.0035). (C) Similar to B, but with Rp-cAMP in the extracellular solution (n=8, p=0.3851). (D) Top, representative Kv2.2 current traces induced by a depolarization pulse from –80 to +40 mV in the presence of 10 μM Rp-cAMP (black) and subsequently in the presence of an additional 10 μM PGE2 (red) in the same HEK293T cell. Bottom, statistics for the amplitude of Kv2.2 current from top using a two-tailed paired t-test (n=5, p=0.6425). n.s., not significant. (E) Schematic structural models of Kv2.2 channels indicate the positions of nine potential PKA phosphorylation sites. (F) Statistics for the amplitude of wild-type and various mutant Kv2.2 channel currents, induced by a depolarization pulse from –80 to +40 mV (n=6–24). ****p<0.0001 compared to wild-type Kv2.2 by a one-way ANOVA with Bonferroni post hoc test. (G) Left, representative Kv2.2-S448D mutant channel current traces induced by a depolarization pulse from –80 to +40 mV under the control condition (black) and subsequently in the presence of 10 μM PGE2 (red) in the same HEK293T cell. Right, statistics for the amplitude of Kv2.2 current from left using a two-tailed paired t-test (n=6, p>0.9999). n.s., not significant. (H) Similar to G, this section presents data for the Kv2.2-S448A mutant channel in HEK293T cells (n=6, p>0.9999).
-
Figure 3—source data 1
Statistical data for Figure 3A, B, C, D, F, G, and H.
- https://cdn.elifesciences.org/articles/97234/elife-97234-fig3-data1-v1.xlsx
-
Figure 3—source data 2
Uncropped western blot images for Figure 3A.
- https://cdn.elifesciences.org/articles/97234/elife-97234-fig3-data2-v1.zip
-
Figure 3—source data 3
PDF file containing uncropped western blot images for Figure 3A, indicating the relevant bands and treatments.
- https://cdn.elifesciences.org/articles/97234/elife-97234-fig3-data3-v1.zip
Figure 4
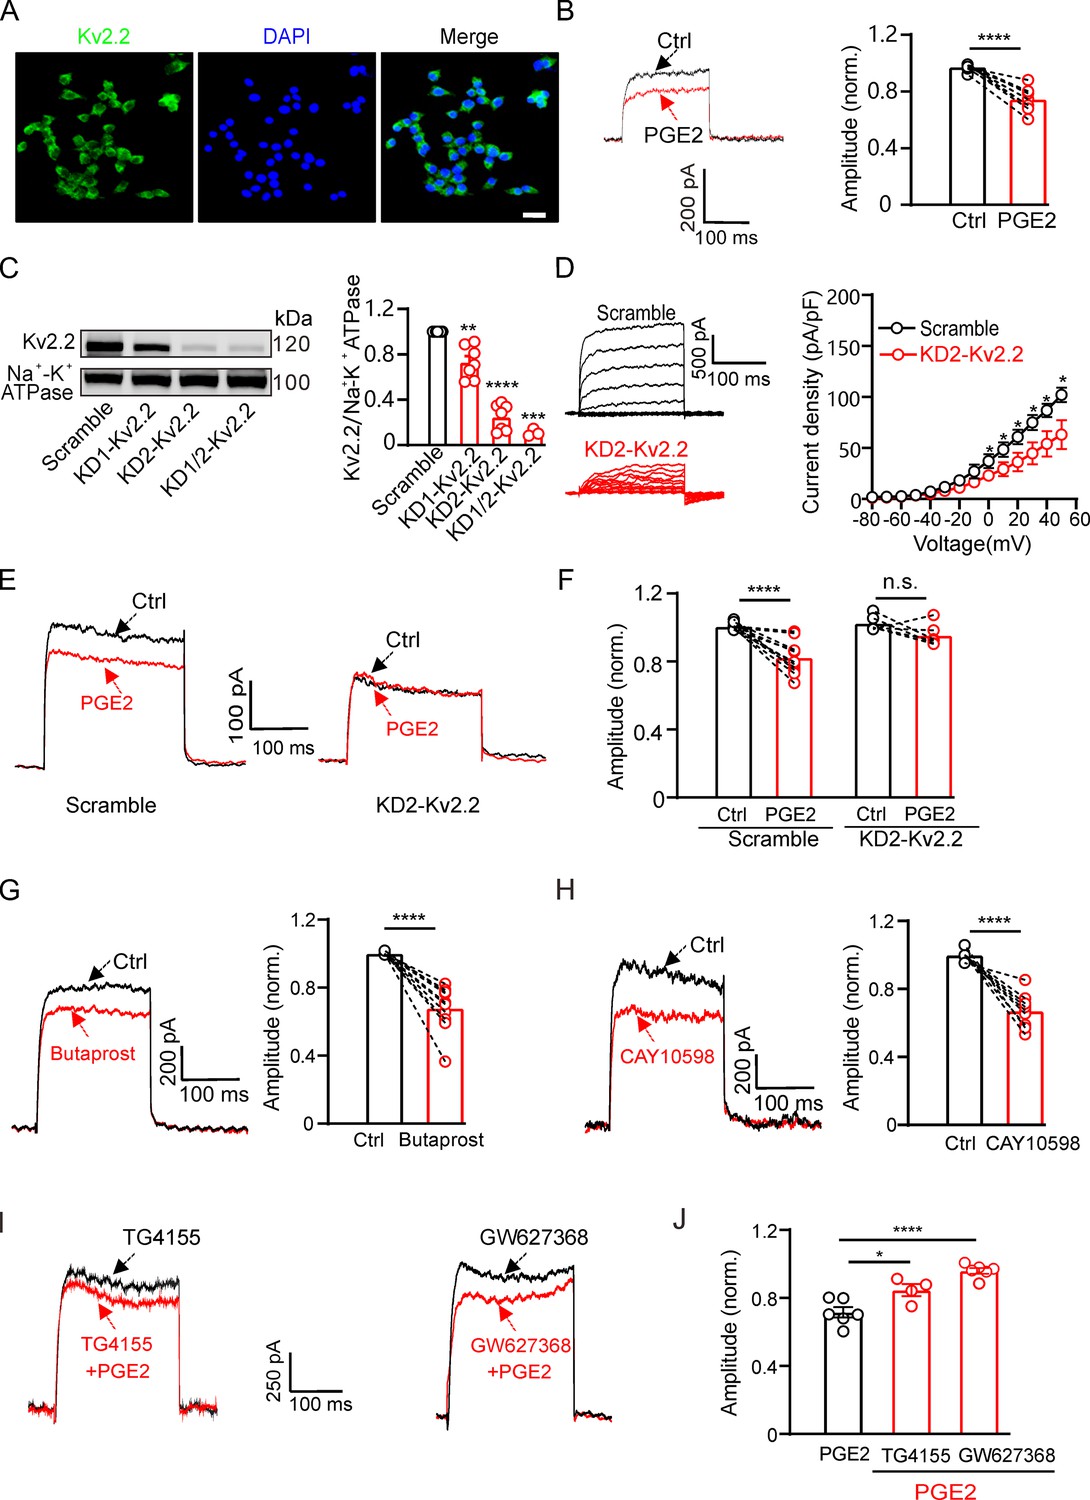
Prostaglandin E2 (PGE2) inhibits native Kv2.2 channels in INS-1(832/13) cells.
(A) Representative examples of immunofluorescence images showing high expression of Kv2.2 channels in INS-1(832/13) cells. Scale bar, 20 μm. (B) Left, representative IK traces induced by a depolarization pulse from –80 to +40 mV under the control condition (black) and subsequently in the presence of 10 μM PGE2 (red) in the same INS-1(832/13) cell. Right, statistics for the amplitude of IK from left using a two-tailed paired t-test (n=10, ****p<0.0001). (C) Left, representative examples of western blot images showing the effects of the two shRNA oligos (KD1-Kv2.2 and KD2-Kv2.2) on Kv2.2 channel surface expression in HEK293T cells transfected with Kv2.2. Right, statistics for cell surface expression of Kv2.2 channels from left using a two-tailed unpaired t-test. KD1-Kv2.2: n=7, **p=0.0066; KD2-Kv2.2: n=7, ****p<0.0001; KD1/KD2-Kv2.2: n=3, ***p=0.0005, compared with scramble. (D) Knockdown of Kcnb2 significantly reduced IK amplitude in INS-1(832/13) cells (n=6, *p<0.05). (E) Left, representative IK traces induced by a depolarization pulse from –80 to +40 mV under the control condition (black) and subsequently in the presence of 10 μM PGE2 (red) in the same INS-1(832/13) cell transfected with scramble control or KD2-Kv2.2. (F) Knockdown of Kcnb2 abrogated the inhibitory effect of PGE2 on IK in INS-1(832/13) cells. Scramble-PGE2: n=11, ****p<0.0001; KD2-PGE2: n=6, p=0.1227; two-tailed paired t-test. (G) Left, representative Kv2.2 current traces induced by a depolarization pulse from –80 to +40 mV under the control condition and subsequently in the presence of the EP2 receptor agonist butaprost in the same INS-1(832/13) cell. Right, statistics for the amplitude of Kv2.2 currents from left using a two-tailed paired t-test (n=10, ****p<0.0001). (H) Similar to G, but with the EP4 receptor agonist CAY10598 in the extracellular solution (n=9, ****p<0.0001). (I) Representative Kv2.2 current traces induced by a depolarization pulse from –80 to +40 mV in the presence of TG4155 or GW627368, followed by the addition of 10 μM PGE2 in the same INS-1(832/13) cell. (J) Statistical analysis showing the effects of EP2 and EP4 antagonists on PGE2-induced inhibition of Kv2.2 channels. *p<0.05 and ****p<0.0001 versus PGE2 alone by a two-tailed unpaired t-test (+TG4155: n=4, *p=0.0242; +GW627368: n=6, ****p<0.0001).
-
Figure 4—source data 1
Statistical data for Figure 4B, C, D, F, G, H, and J.
- https://cdn.elifesciences.org/articles/97234/elife-97234-fig4-data1-v1.xlsx
-
Figure 4—source data 2
Uncropped western blot images for Figure 4C.
- https://cdn.elifesciences.org/articles/97234/elife-97234-fig4-data2-v1.zip
-
Figure 4—source data 3
PDF file containing uncropped western blot images for Figure 4C, indicating the relevant bands and treatments.
- https://cdn.elifesciences.org/articles/97234/elife-97234-fig4-data3-v1.zip
Figure 5 with 1 supplement
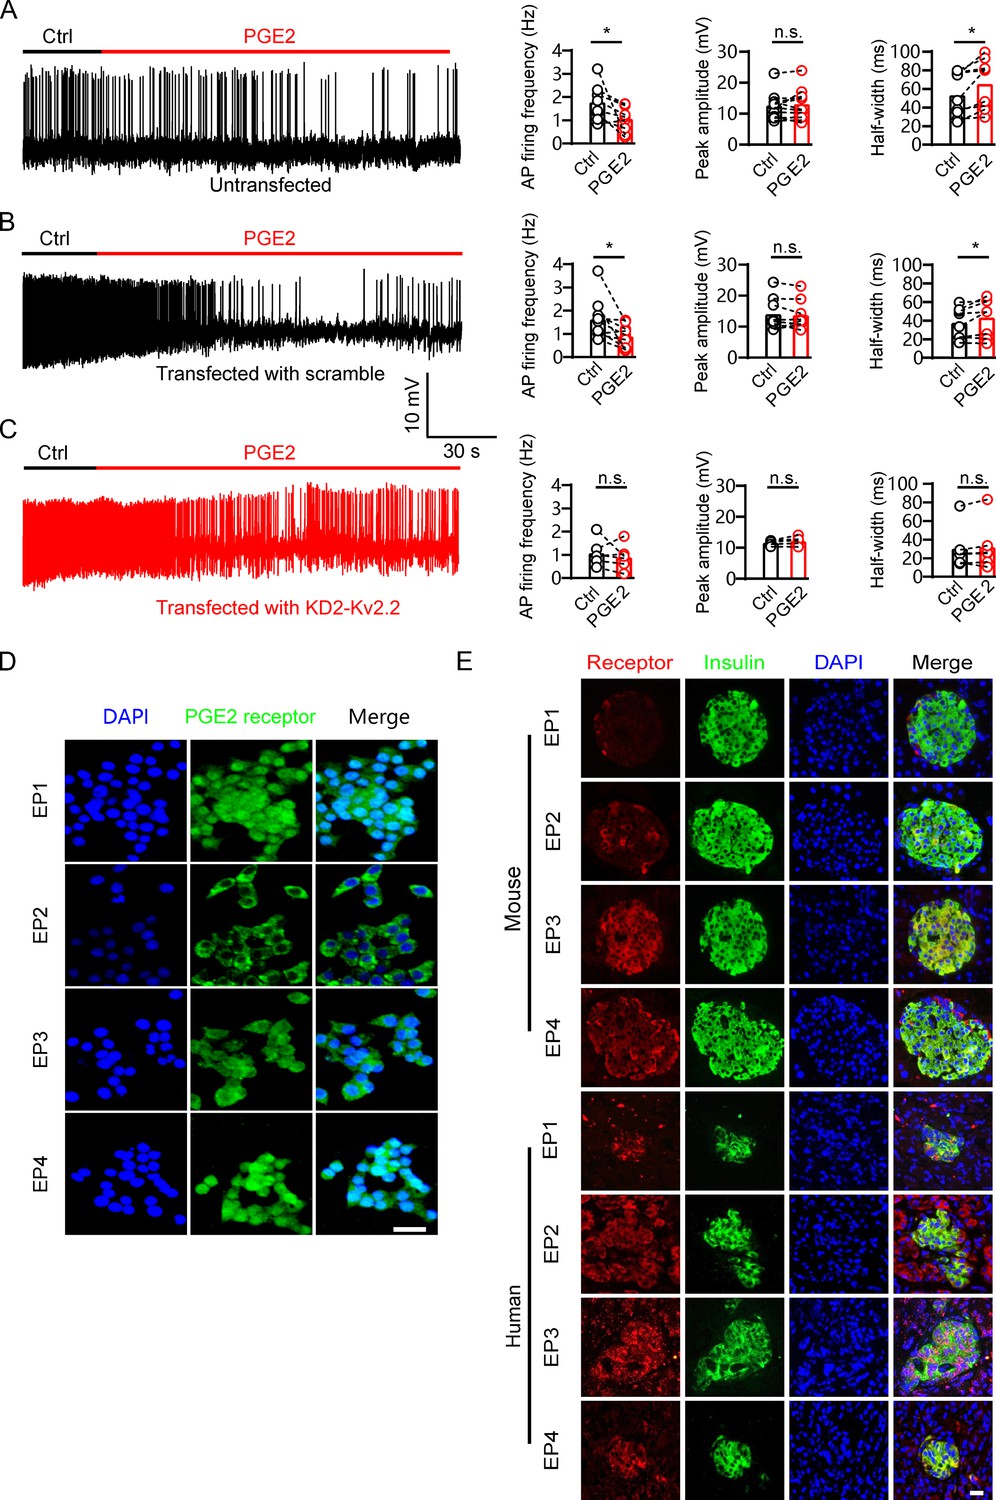
Prostaglandin E2 (PGE2) reduces β-cell electrical excitability through Kv2.2 channels.
(A) Left, representative action potential (AP) firings induced by 20 mM glucose under the control condition and subsequently in the presence of 10 μM PGE2 in the same INS-1(832/13) cell. Right, statistics for the AP firing frequency (*p=0.0385), amplitude (p=0.9478), and half-width (*p=0.0101) from A (n=9). Two-tailed paired t-test. (B) Similar to A, but the INS-1(832/13) cells were transfected with scramble-Kv2.2 (n=8) (frequency: *p=0.0285; amplitude: p=0.6603; half-width: *p=0.0281). (C) Similar to B, but the INS-1(832/13) cells were transfected with KD2-Kv2.2 (n=6). n.s., not significant (frequency: p=0.4564; amplitude: p=0.1601; half-width: p=0.3034). (D) Representative immunofluorescence images showing expression of EP1–4 receptors in INS-1(832/13) cells. Scale bar, 20 μm. (E) Representative immunofluorescence images showing expression of EP1–4 receptors in mouse and human islets. Scale bar, 20 μm.
-
Figure 5—source data 1
Statistical data for Figure 5A, B, and C.
- https://cdn.elifesciences.org/articles/97234/elife-97234-fig5-data1-v1.xlsx
Figure 5—figure supplement 1
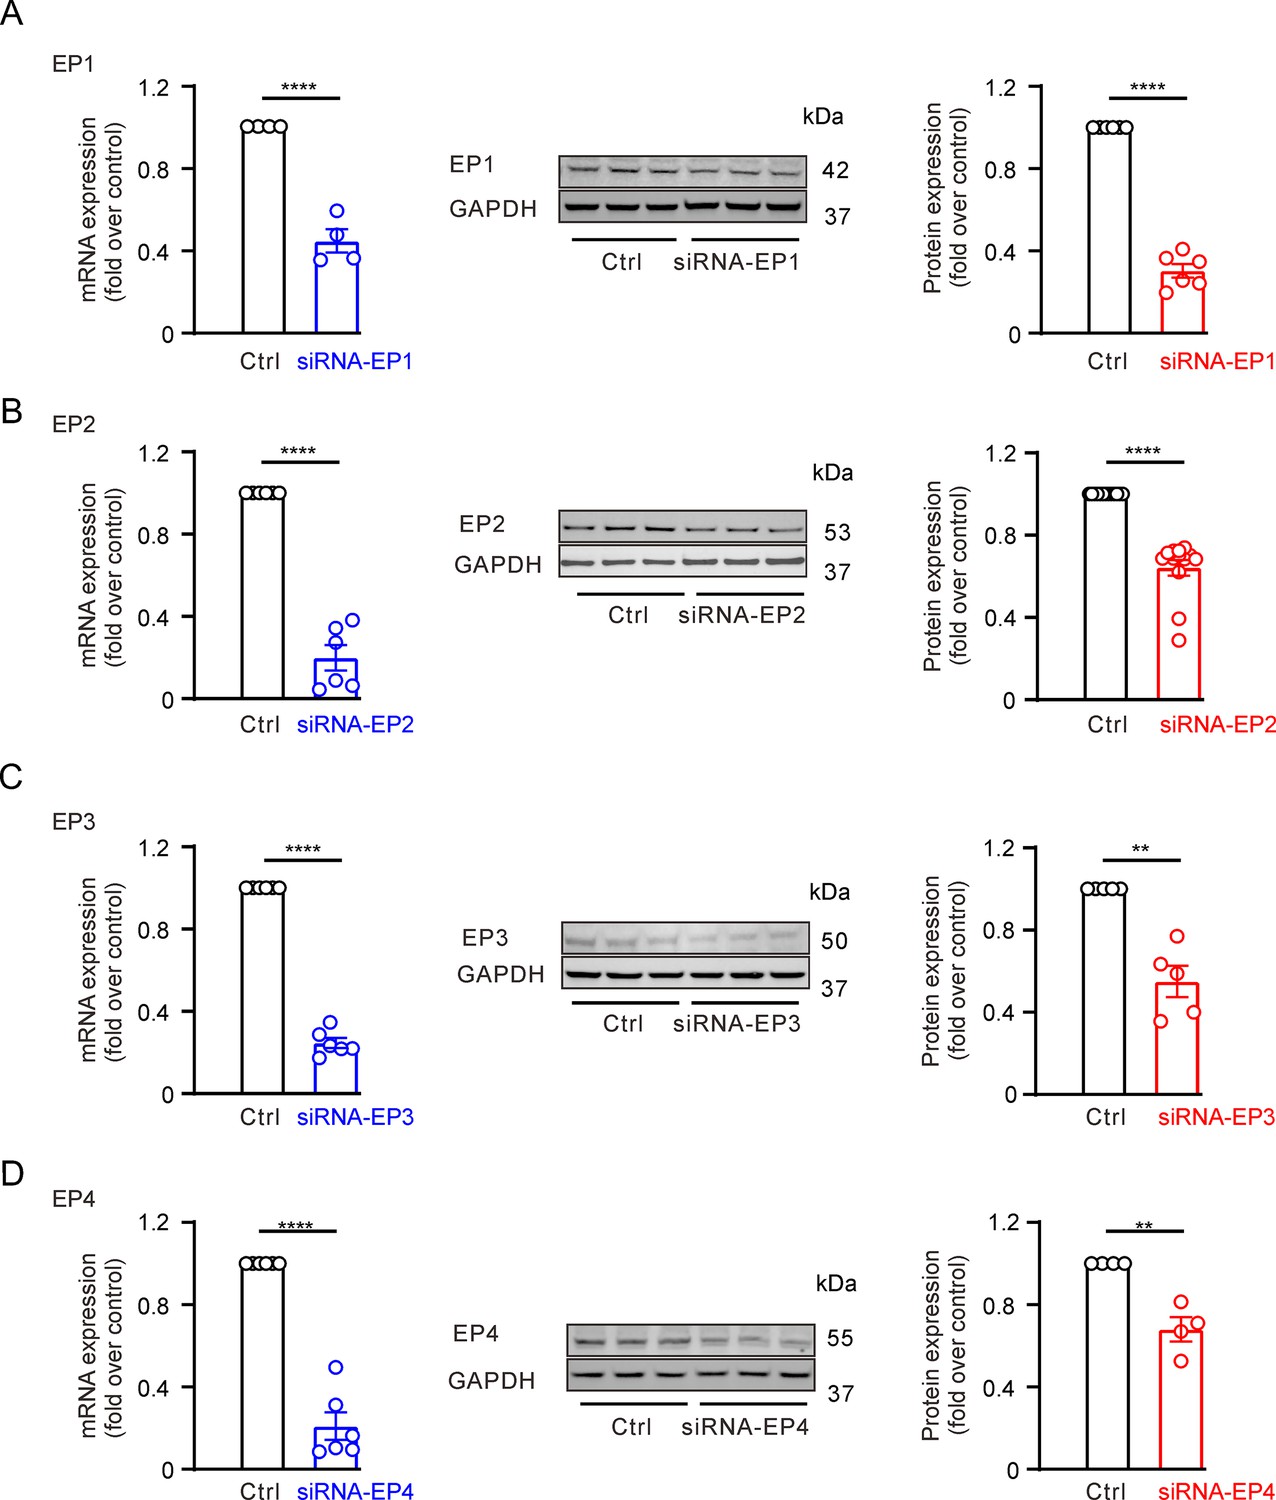
Validation of EP receptor antibody specificity in INS-1(83 2/13) cells using siRNA knockdown.
(A) Left, quantification of mRNA expression following siRNA targeting of Ptger1 (siRNA-EP1). Middle, representative western blot images showing the effect of siRNA-EP1 on EP1 protein levels. Right, quantification of EP1 protein expression after siRNA-EP1 treatment. mRNA expression: n=4, ****p<0.0001; protein expression: n=6, ****p<0.0001; two-tailed t-test. (B) Similar to A, but assessing the effect of siRNA targeting Ptger2 (siRNA-EP2) on EP2 receptor expression. mRNA expression: n=6, ****p<0.0001; protein expression: n=13, ****p<0.0001; two-tailed t-test. (C) Similar to A, but assessing the effect of siRNA targeting Ptger3 (siRNA-EP3) on EP3 receptor expression. mRNA expression: n=6, ****p<0.0001; protein expression: n=5, **p=0.0042; two-tailed t-test. (D) Similar to A, but assessing the effect of siRNA targeting Ptger4 (siRNA-EP4) on EP4 receptor expression. mRNA expression: n=6, ****p<0.0001; protein expression: n=4, **p=0.0017; two-tailed t-test. The siRNA sequences targeting the four EP receptors are: siRNA-EP1 (forward, reverse): 5′-GGUCACUACGAGCUACAGUTT and 5′- ACUGUAGCUCGUAGUGACCTT; siRNA-EP2 (forward, reverse): 5′- GUCUGCGUCAUCCAUCACUTT and 5′- AGUGAUGGAUGACGCAGACTT; siRNA-EP3 (forward, reverse): 5′- CUGGGUGCUGUGUCCAACGTT and 5′- CGUUGGACACAGCACCCAGTT; siRNA-EP4 (forward, reverse): 5′- GGGCCUGUCAUUUCCUGGGTT and 5′- CCCAGGAAAUGACAGGCCCTT.
-
Figure 5—figure supplement 1—source data 1
Statistical data for Figure 5—figure supplement 1.
Uncropped western blot images for Figure 5—figure supplement 1.
- https://cdn.elifesciences.org/articles/97234/elife-97234-fig5-figsupp1-data1-v1.xlsx
-
Figure 5—figure supplement 1—source data 2
Uncropped western blot images for Figure 5—figure supplement 1.
- https://cdn.elifesciences.org/articles/97234/elife-97234-fig5-figsupp1-data2-v1.zip
-
Figure 5—figure supplement 1—source data 3
PDF file containing uncropped western blot images for Figure 5—figure supplement 1, indicating the relevant bands and treatments.
- https://cdn.elifesciences.org/articles/97234/elife-97234-fig5-figsupp1-data3-v1.zip
Figure 6
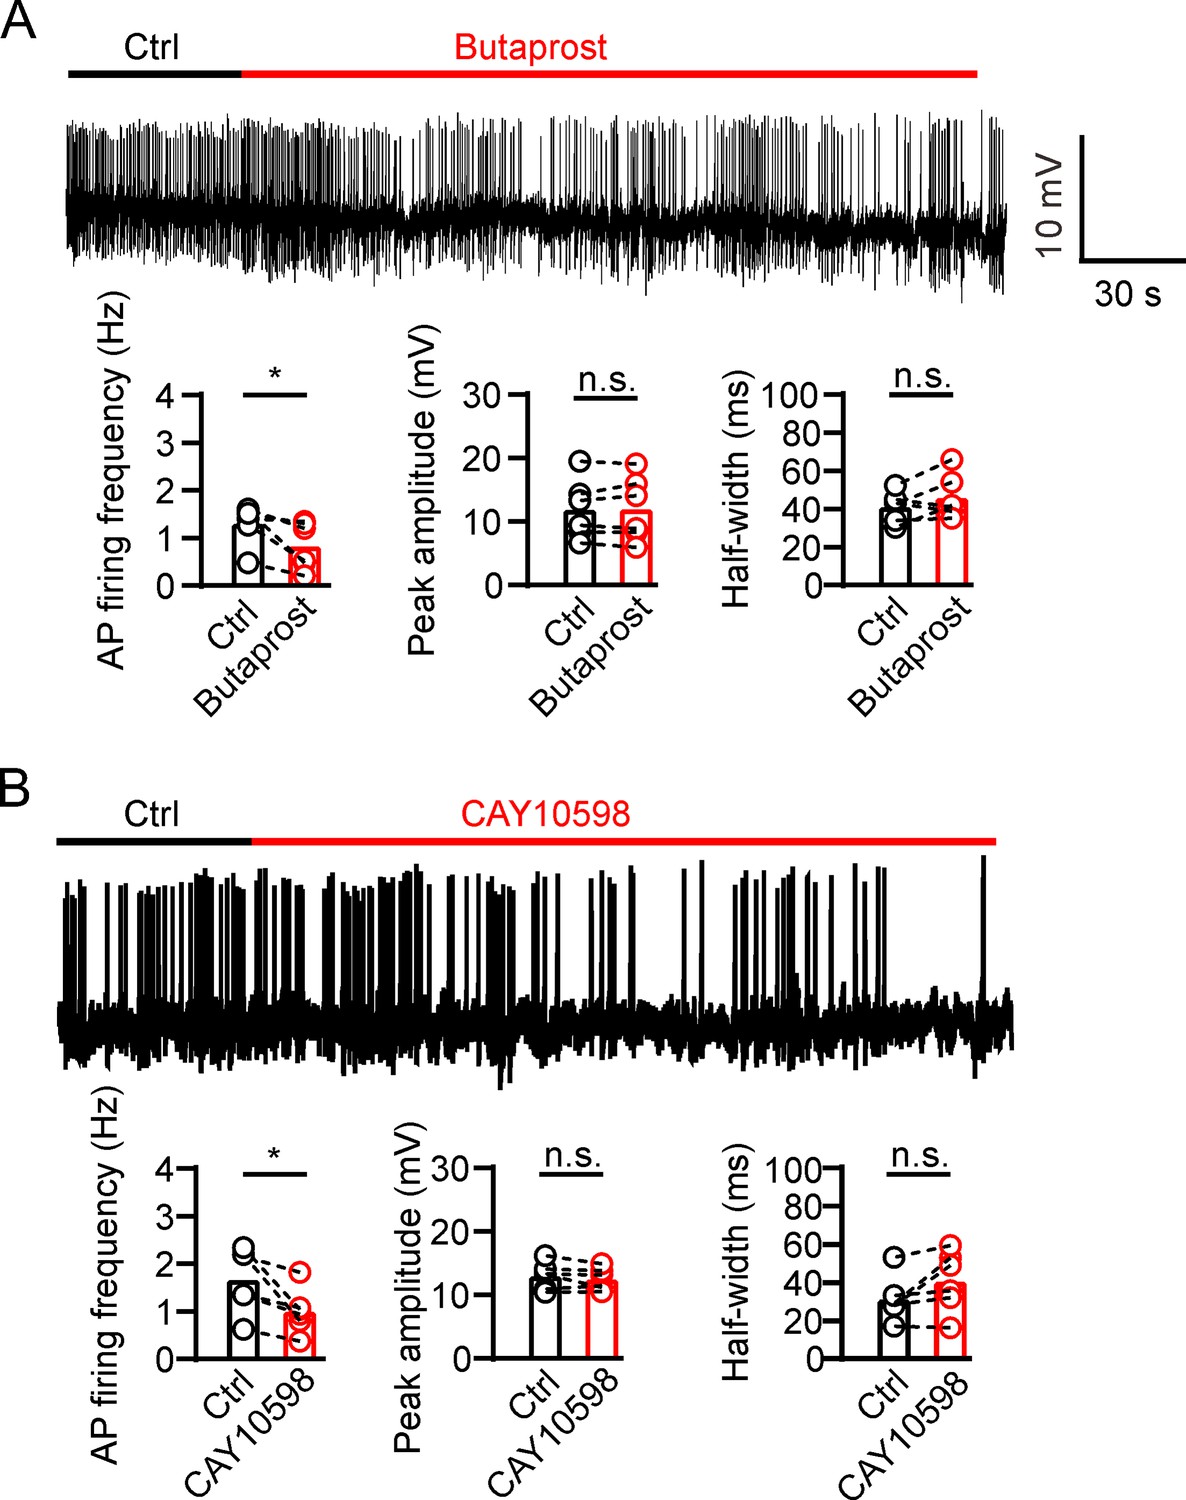
Prostaglandin E2 (PGE2) reduces β-cell electrical excitability through EP2/4.
(A) Top, representative action potential (AP) firings induced by 20 mM glucose under the control condition and subsequently in the presence of 20 μM butaprost in the same INS-1(832/13) cell. Bottom, statistics for the AP firing frequency (*p=0.0312), amplitude (p=0.7354), and half-width (p=0.2067) from top (n=6). Two-tailed paired t-test. (B) Similar to A, but in the presence of 20 μM CAY10598 (n=6), AP firing frequency (*p=0.0291), amplitude (p=0.2211), half-width (p=0.0753).
-
Figure 6—source data 1
Statistical data for Figure 6A and B.
- https://cdn.elifesciences.org/articles/97234/elife-97234-fig6-data1-v1.xlsx
Figure 7 with 1 supplement
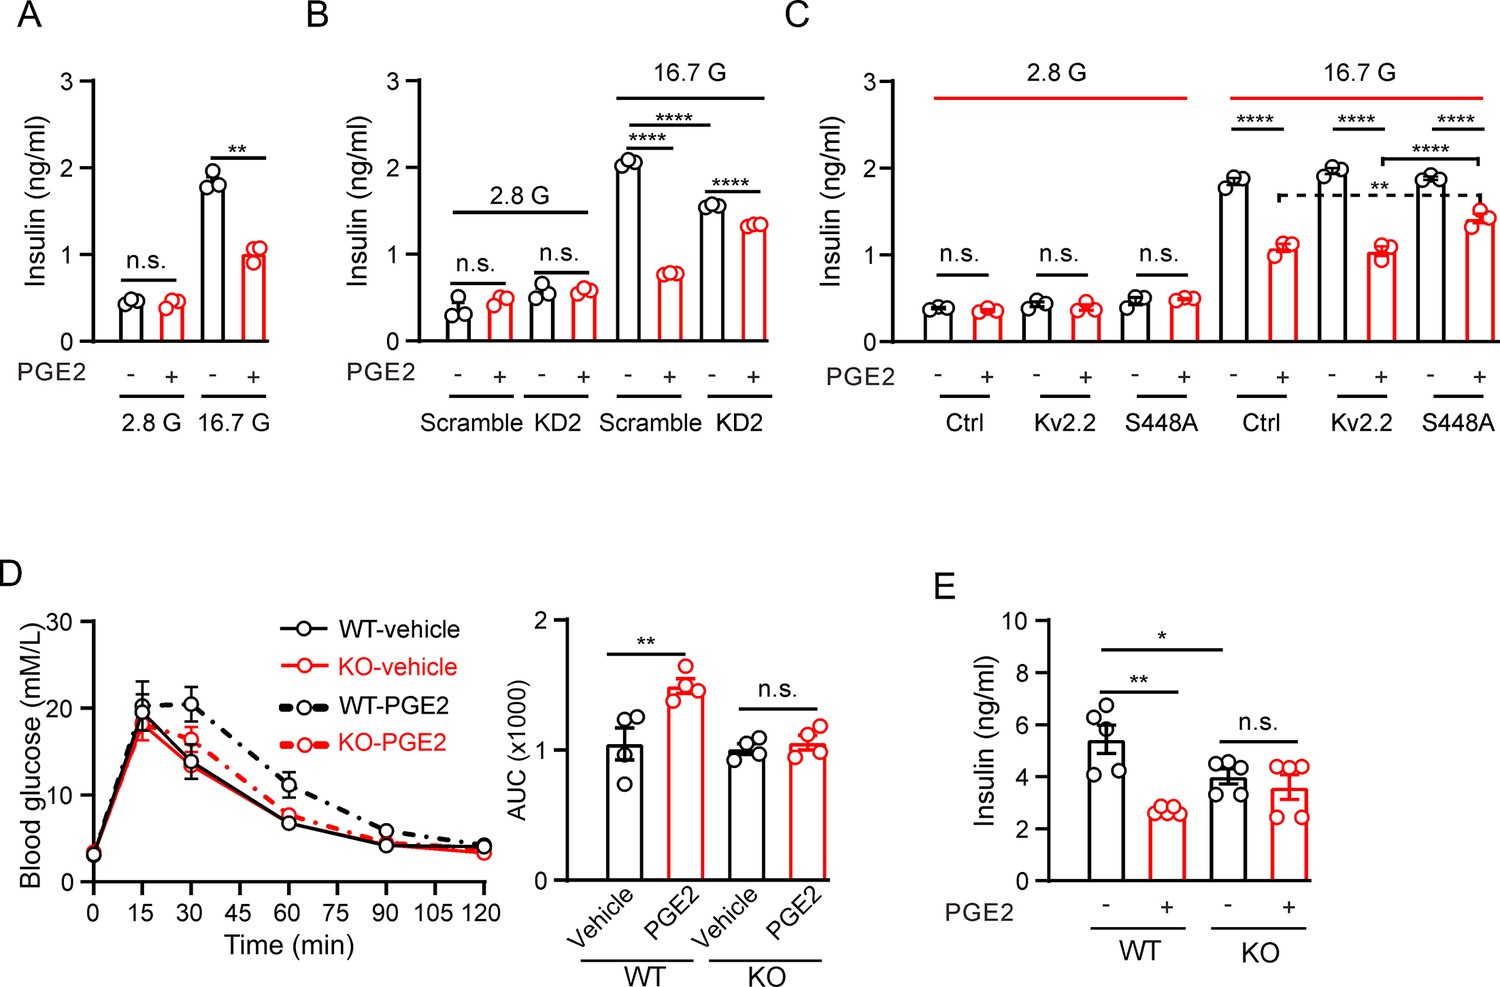
Prostaglandin E2 (PGE2) inhibits glucose-stimulated insulin secretion (GSIS) through Kv2.2 channels.
(A) Effects of PGE2 on insulin secretion in INS-1(832/13) cells under basal (2.8 mM, 2.8 G) or stimulatory (16.7 mM, 16.7 G) glucose concentrations (n=3). 2.8 G, PGE2: n.s., not significant (p=0.9497); 16.7 G, PGE2: **p=0.0082. Two-tailed unpaired t-test. (B) Knockdown of Kcnb2 reduced GIGS and greatly alleviated the PGE2-induced inhibition of GSIS in INS-1(832/13) cells (n=3). ****p<0.0001; n.s., not significant. Two-tailed unpaired t-tests. (C) Effects of PGE2 on insulin secretion in INS-1(832/13) cells transfected with empty vectors, Kv2.2, or Kv2.2-S448A mutant channels under basal (2.8 mM, 2.8 G) or stimulatory (16.7 mM, 16.7 G) glucose concentrations (n=3). Overexpression of Kv2.2-S448A mutant channels greatly alleviated the PGE2-induced inhibition of GSIS in INS-1(832/13) cells. n.s., not significant; ****p<0.0001; **p=0.0096. Two-tailed unpaired t-test. (D) Left, the effect of PGE2 on the glucose tolerance test in Kcnb2−/− and control animals (n=4 animals per group). Right, statistics for AUC from left. **p=0.0064. n.s., not significant (p=0.9684). Two-tailed unpaired t-tests. (E) Statistics for the effect of PGE2 on GSIS (16.7 mM glucose) in isolated islets from Kcnb2−/− and control animals. N=5 animals per group. *p=0.0483, **p=0.001. n.s., not significant (p=0.4766). Two-tailed unpaired t-tests.
-
Figure 7—source data 1
Statistical data for Figure 7A–E.
- https://cdn.elifesciences.org/articles/97234/elife-97234-fig7-data1-v1.xlsx
Figure 7—figure supplement 1
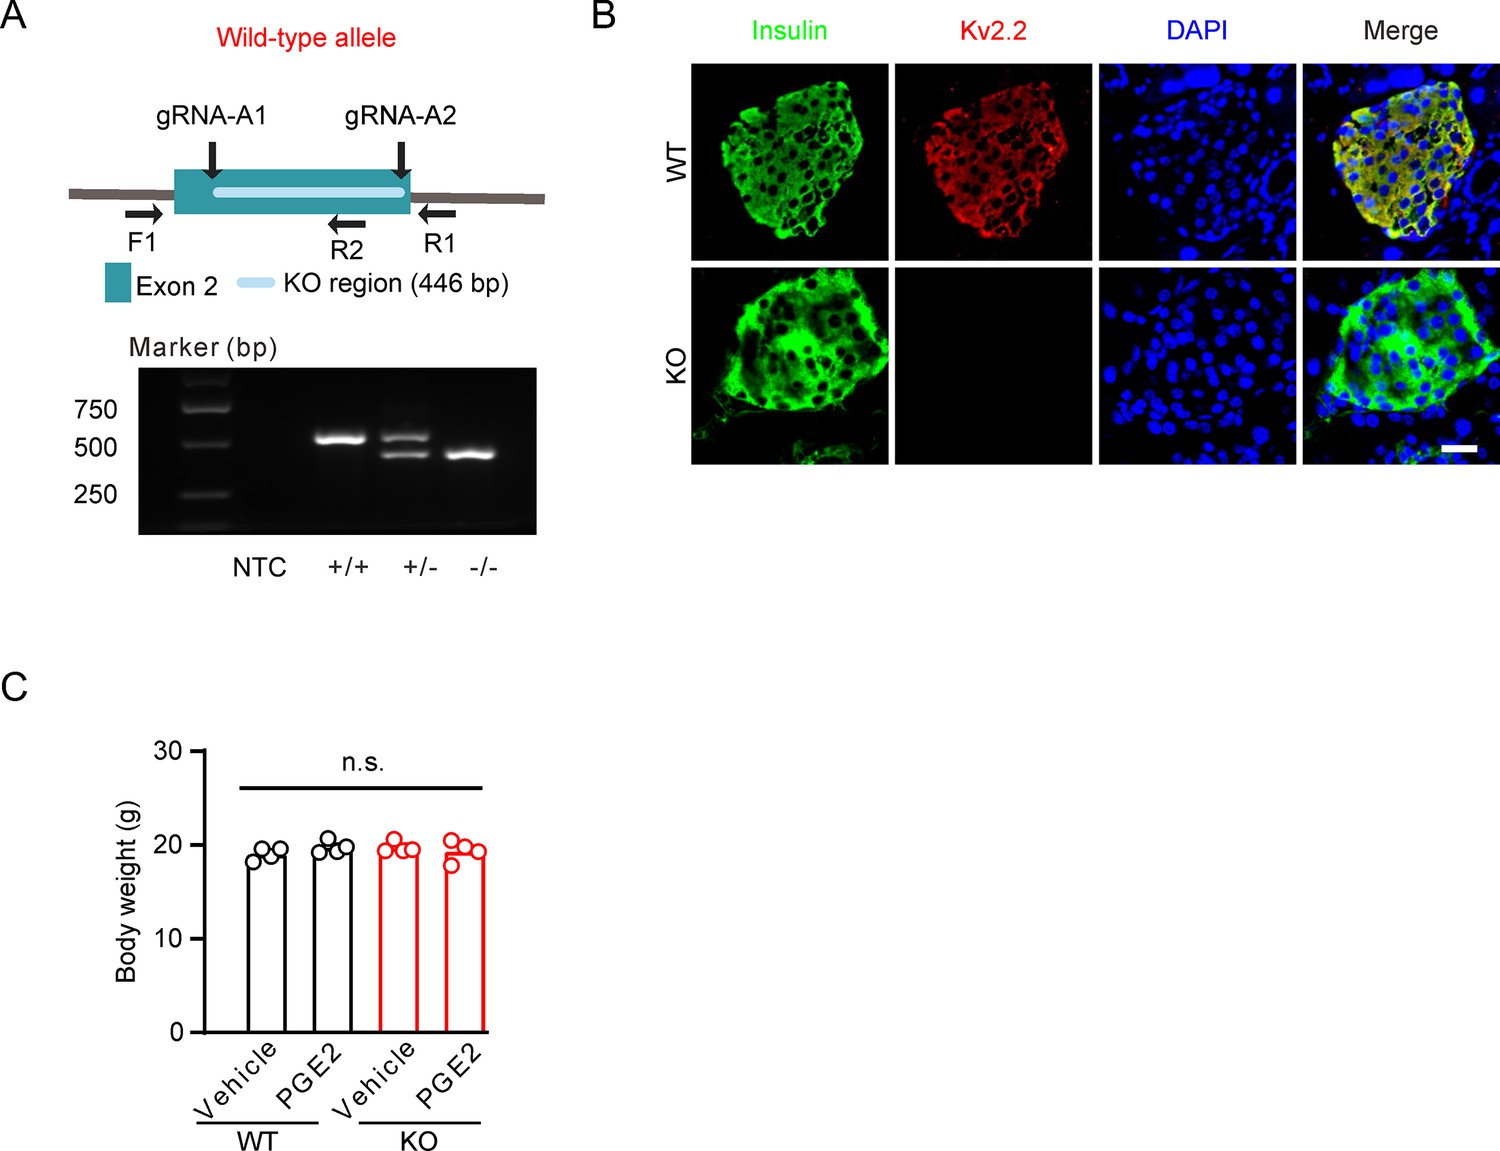
Generation of Kcnb2 knockout mice.
(A) Top, cartoon of the Kcnb2 targeted gene disruption. Bottom, PCR products generated from wild-type (+/+, 521 bp), heterozygous (+/−, 521 and 415 bp), and homozygous knockout (−/−, 415 bp) mice with primers (F1 and R1) specific to the surrounding Kcnb2 gene disruption sequence and one primer (R2) specific to the targeting sequence. NTC, no template control. (B) Representative immunofluorescence images showing expression of Kv2.2 channels in wild-type and Kcnb2 knockout mouse pancreatic islet β-cells. Scale bar, 20 μm. (C) Kcnb2 knockout did not alter the body weight of animals (n=4 animals per group).
-
Figure 7—figure supplement 1—source data 1
Statistical data for Figure 7—figure supplement 1C.
- https://cdn.elifesciences.org/articles/97234/elife-97234-fig7-figsupp1-data1-v1.xlsx
-
Figure 7—figure supplement 1—source data 2
Uncropped DNA gel image for Figure 7—figure supplement 1A.
- https://cdn.elifesciences.org/articles/97234/elife-97234-fig7-figsupp1-data2-v1.zip
-
Figure 7—figure supplement 1—source data 3
PDF file containing uncropped DNA gel image for Figure 7—figure supplement 1A, indicating the relevant bands and treatments.
- https://cdn.elifesciences.org/articles/97234/elife-97234-fig7-figsupp1-data3-v1.zip
Figure 8
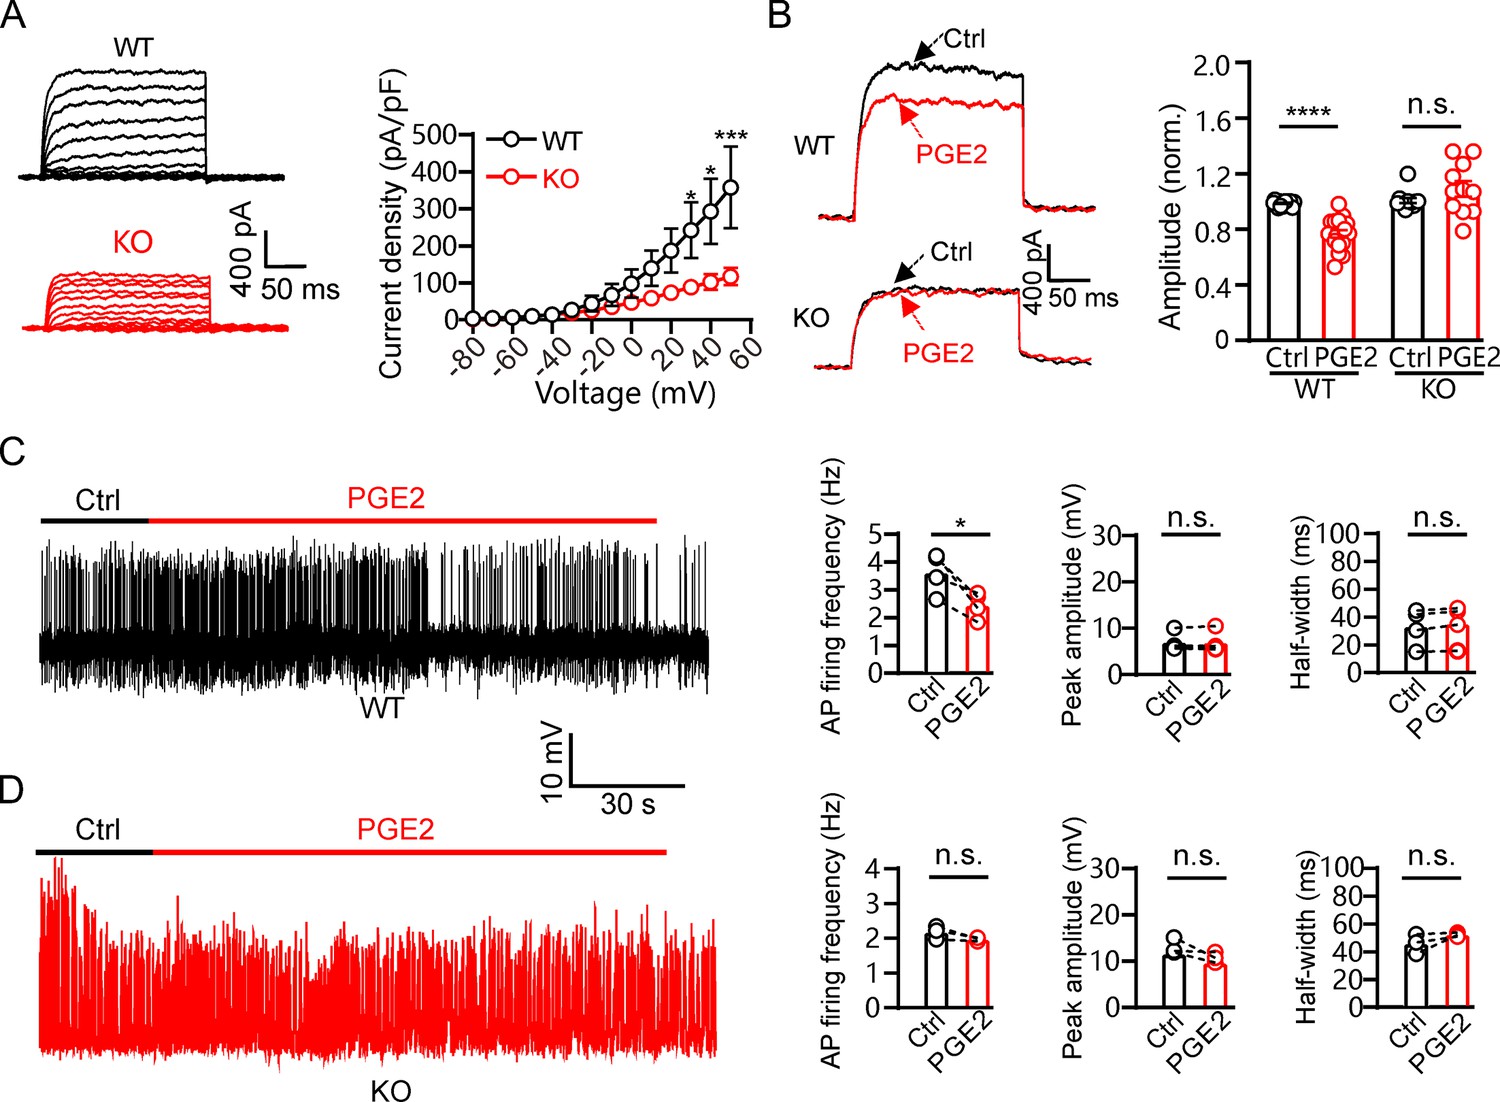
Prostaglandin E2 (PGE2) inhibits mouse pancreatic β-cell electrical excitability through Kv2.2 channels.
(A) Left, representative IK recordings in response to 200 ms depolarization pulses from – 80 to +50 mV in wild-type and Kcnb2−/− knockout mouse pancreatic β-cells. Right, plot of the current-voltage relationship from left (n=7 for each data point). (B) Left, representative IK traces induced by a depolarization pulse from –80 to +40 mV under the control condition and subsequently in the presence of 10 μM PGE2 in the same β-cell from wild-type or Kcnb2−/− mice. Right, statistics for the IK amplitude using a two-tailed paired t-test (n=17). ****p<0.0001; n.s., not significant (n=12, p=0.6317). (C) Left, representative action potential (AP) firings induced by 20 mM glucose under the control condition and subsequently in the presence of 10 μM PGE2 in the same β-cell within wild-type mouse pancreatic islets. Right, statistics for the AP firing frequency (*p=0.0288), amplitude (p=0.8589), and half-width (p=0.0563) from left (n=4). Two-tailed paired t-tests. (D) Left, representative AP firings induced by 20 mM glucose under the control condition and subsequently in the presence of 10 μM PGE2 in the same β-cell within Kcnb2−/− mouse pancreatic islets. Right, statistics for the AP firing frequency (p=0.1536), amplitude (p=0.1981), and half-width (p=0.2385) from left (n=3). Two-tailed paired t-tests.
-
Figure 8—source data 1
Statistical data for Figure 8A–D.
- https://cdn.elifesciences.org/articles/97234/elife-97234-fig8-data1-v1.xlsx
Author response image 1

Effect of Db-cAMP on GSIS in INS-1 cells.
Statistics for the effect of different concentrations of Db-cAMP on GSIS in INS-1(832/13) cells. One-way ANOVA with Bonferroni post hoc test. *p < 0.05; ***p < 0.001; ****p < 0.0001; n.s., not significant.
Additional files
Download links
A two-part list of links to download the article, or parts of the article, in various formats.
Downloads (link to download the article as PDF)
Open citations (links to open the citations from this article in various online reference manager services)
Cite this article (links to download the citations from this article in formats compatible with various reference manager tools)
The Kv2.2 channel mediates the inhibition of prostaglandin E2 on glucose-stimulated insulin secretion in pancreatic β-cells
eLife 13:RP97234.
https://doi.org/10.7554/eLife.97234.3


