Mechanical forces pattern endocardial Notch activation via mTORC2-PKC pathway
- Fudan University, China
- Key Laboratory of Growth Regulation and Translational Research of Zhejiang Province, School of Life Sciences, Westlake University, China
- Westlake Laboratory of Life Sciences and Biomedicine, China
- Institute of Basic Medical Sciences, Westlake Institute for Advanced Study, China
Figures
Figure 1 with 1 supplement
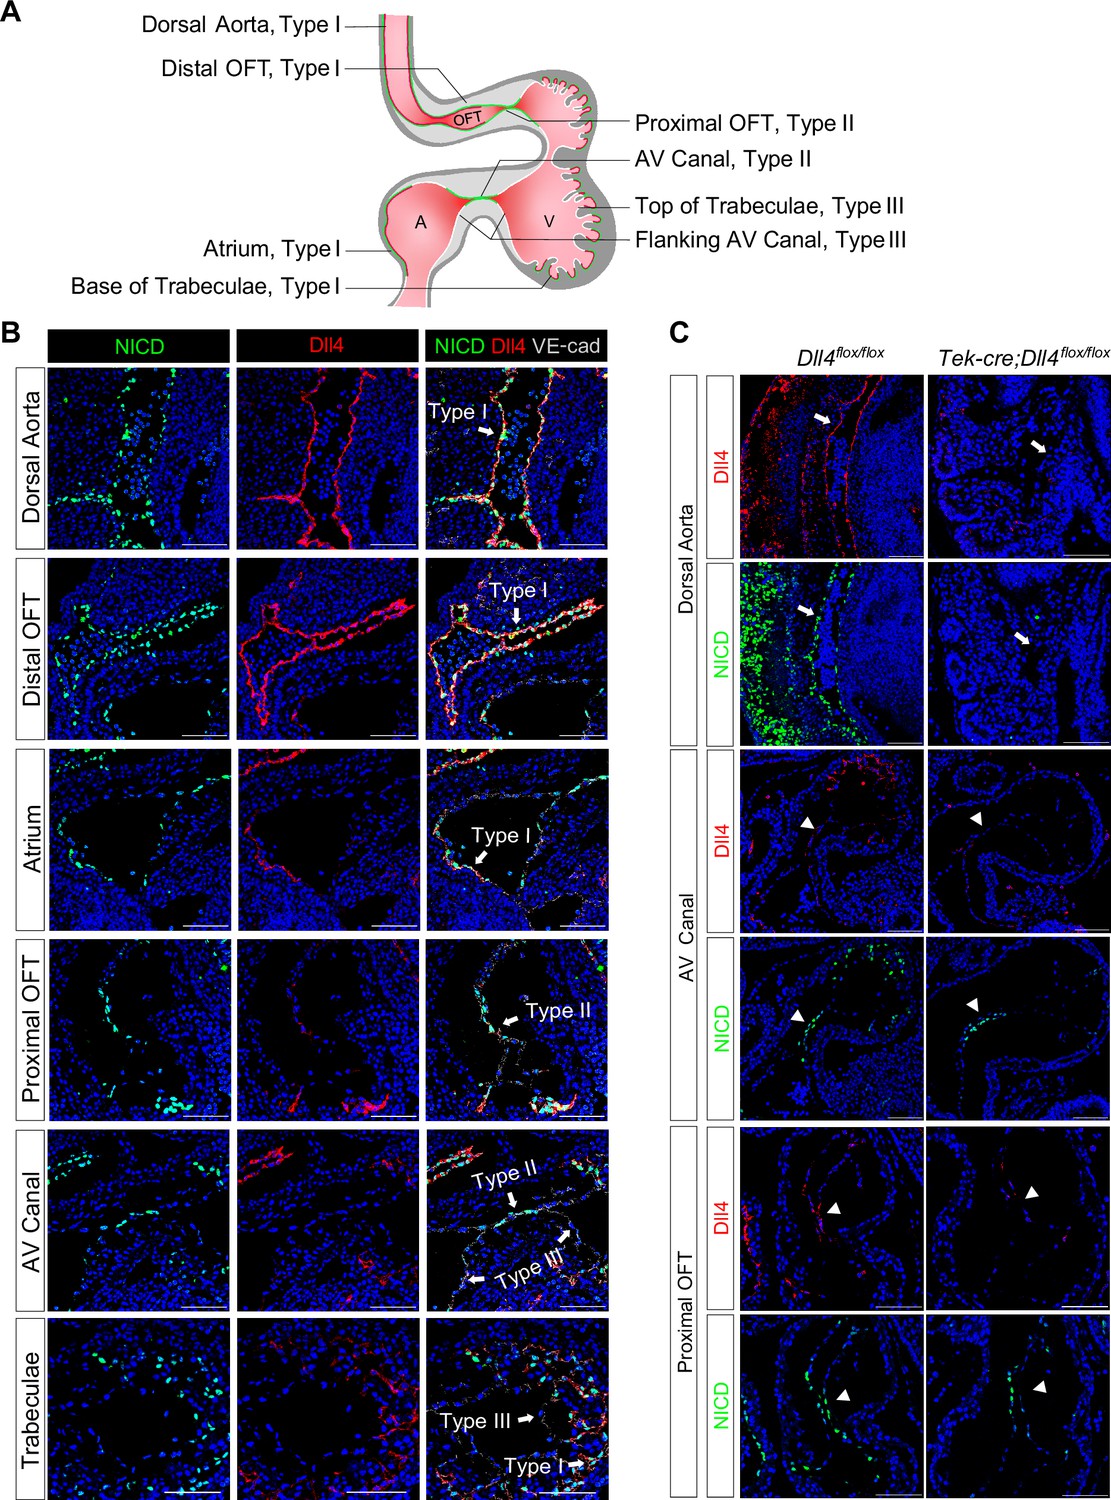
Endocardium and vascular endothelium of dorsal aorta showed different patterns of Notch1 activation and Dll4 ligand expression.
(A) Schematic representation of three types of endothelial cells and their corresponding localizations. (B) Type I cells are NICD-high and Dll4-high. Type II cells are NICD-high and Dll4-low. Type III cells are NICD-low and Dll4-low. Scale bars, 100 µm. (n = 3 embryos) (C) Representative images showing Dll4 protein and NICD in wild-type and endothelial-specific Dll4-deleted (Tek-cre; Dll4flox/flox) E9.5 mouse hearts. Scale bars, 100 µm. (wild-type: n = 3 embryos; Tek-cre; Dll4flox/flox: n = 3 embryos).
Figure 1—figure supplement 1
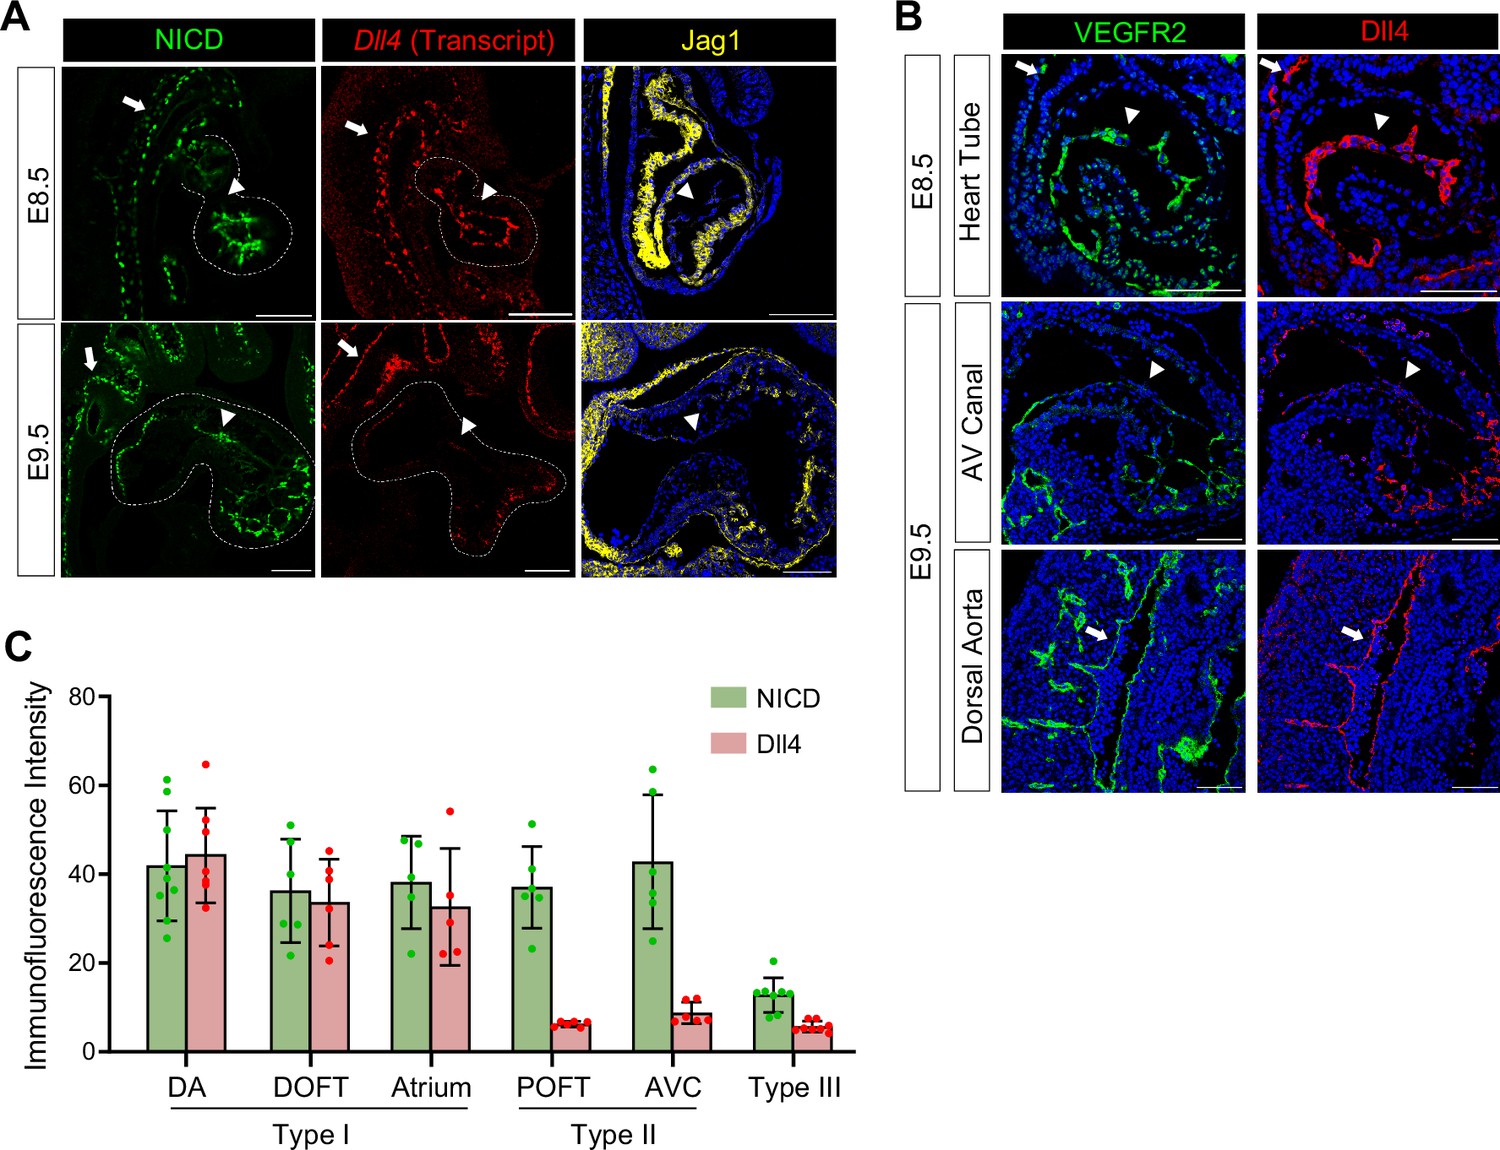
Notch is strongly activated in the atrioventricular canal (AVC) and proximal outflow tract (OFT) endocardium despite weak ligand expression at the onset of endothelial-to-mesenchymal transition (EMT).
(A) Representative images of NICD (green) whole mount immunofluorescence, Dll4 (red) whole mount in situ hybridization, and Jag1 (yellow) immunofluorescence of E8.5 and E9.5 mouse hearts. Arrows indicate arterial endothelium and arrowheads indicate endocardium. (B) Representative images demonstrating VEGFR2 (Green) and Dll4 (red) protein expression in E8.5 and E9.5 mouse arteries (arrow) and endocardium (arrowhead). (C) Quantification of NICD and Dll4 immunofluorescence intensity within the area of each three types of endothelial cells. Each point in the quantification chart represents one section from a total of three embryos. Scale bars, 100 µm. Data are expressed as the mean ± SD.
Figure 2 with 2 supplements
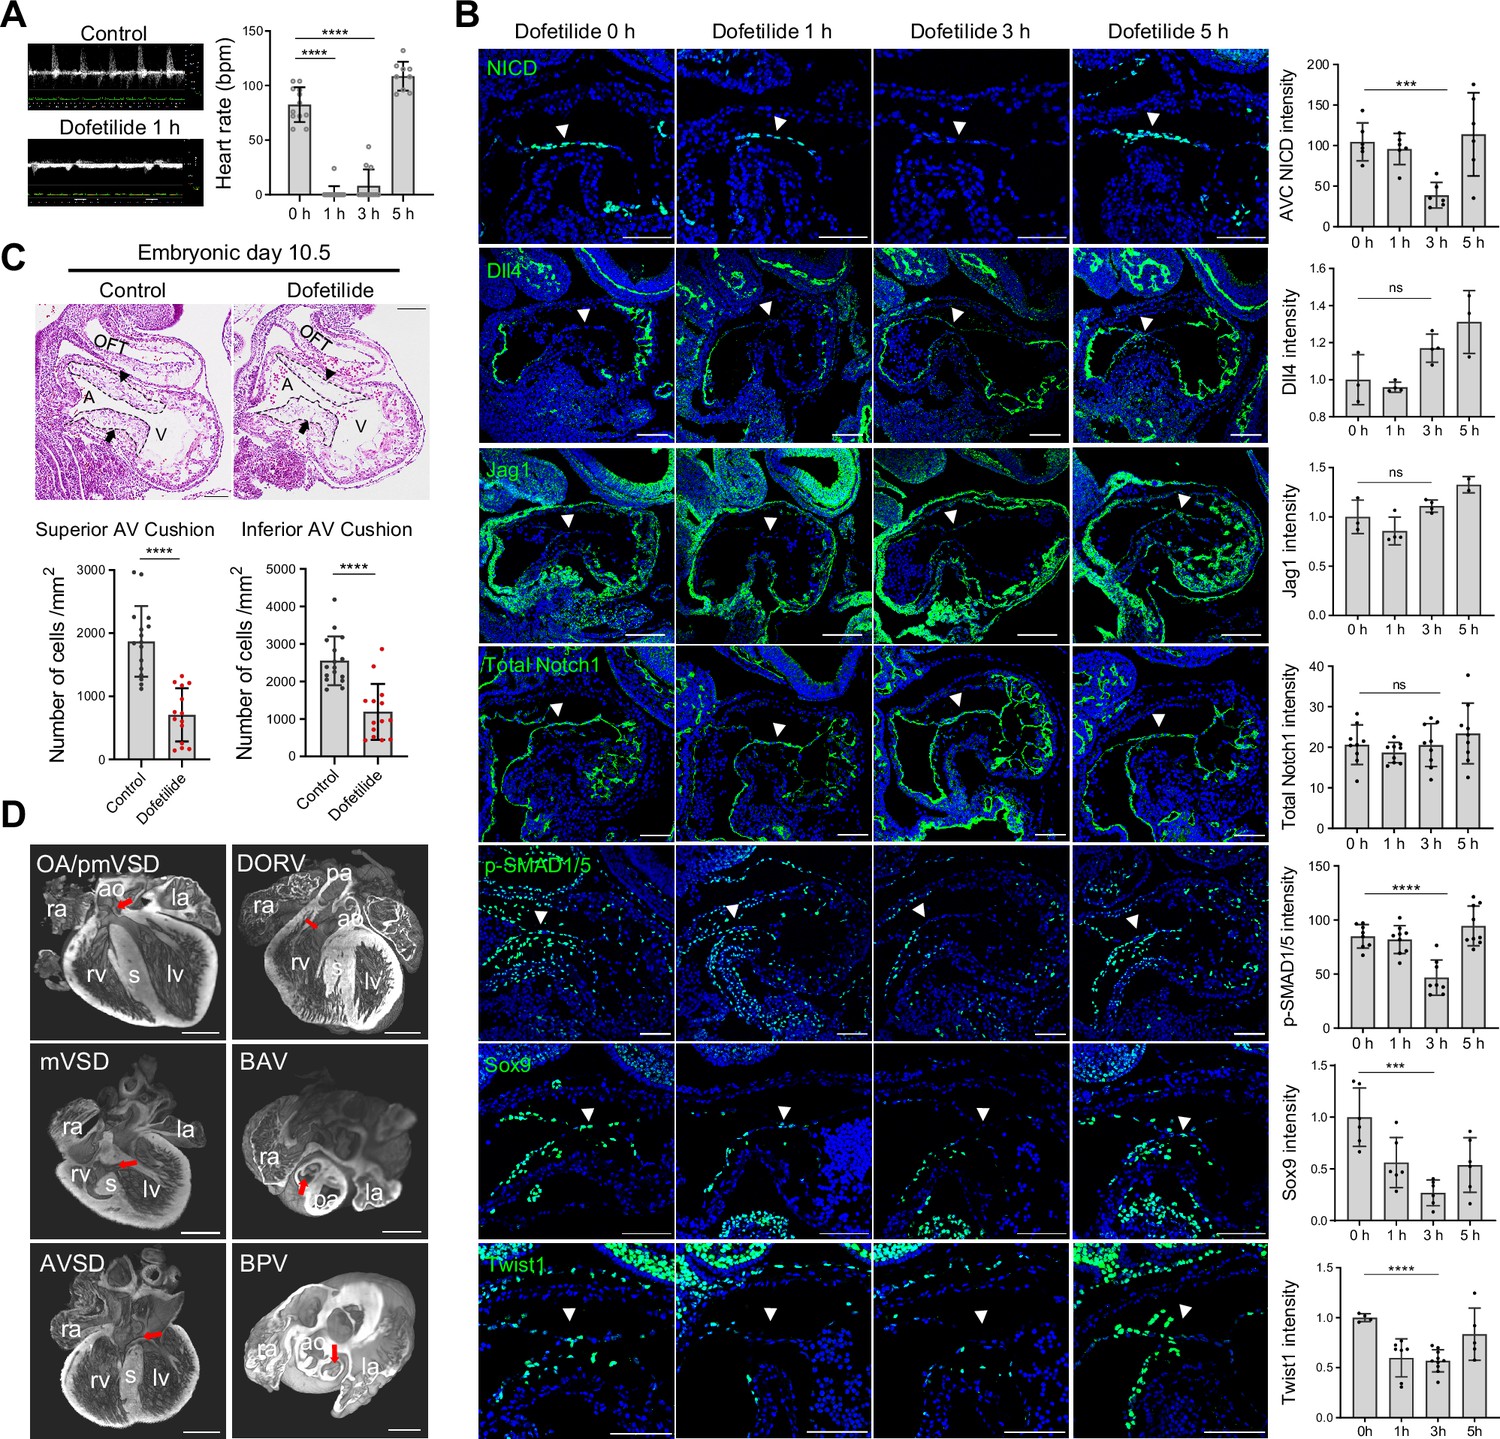
Notch activation in the cushion endocardium is dependent on blood flow.
(A) Echocardiography of control and dofetilide treated embryos. (0 hr: n=12; 1 hr: n=15; 3 hr: n=12; 5 hr: n=9). (B) Expression of NICD, Dll4, Jag1, total Notch1, p-SMAD1/5, and Sox9, Twist1 in the E9.5 atrioventricular (AV) canal endocardium (arrowhead). Each point in the quantification chart represents one embryo. (C) Sagittal E10.5 hematoxylin-eosin stained sections demonstrated hypocellularity in both superior (arrowhead) and inferior AV cushion (arrow) caused by dofetilide treatment. Quantification of mesenchymal cell density in superior (below left) and inferior (below right) AV cushion (Control: n=16 embryos; Dofetilide: n=14 embryos). OFT, outflow tract; A, atrium; V, ventricle. (D) Representative heart defects induced by maternal dofetilide treatment. pmVSD, perimembranous ventricular septal defect; DORV, double-outlet right ventricle; mVSD, muscular VSD; OA, overriding aorta; BAV, bicuspid aortic valve; AVSD, atrioventricular septal defect; BPV, bicuspid pulmonary valve; ra, right atrium; la, left atrium; ao, aorta; rv, right ventricle; lv, left ventricle; s, interventricular septum; pa, pulmonary artery. Scale bars, 100 µm (B, C), 500 µm (D). Differences between groups were analyzed by t-test. Data are expressed as the mean ± SD. ***p<0.001, ****p<0.0001, ns: non-significant.
Figure 2—figure supplement 1
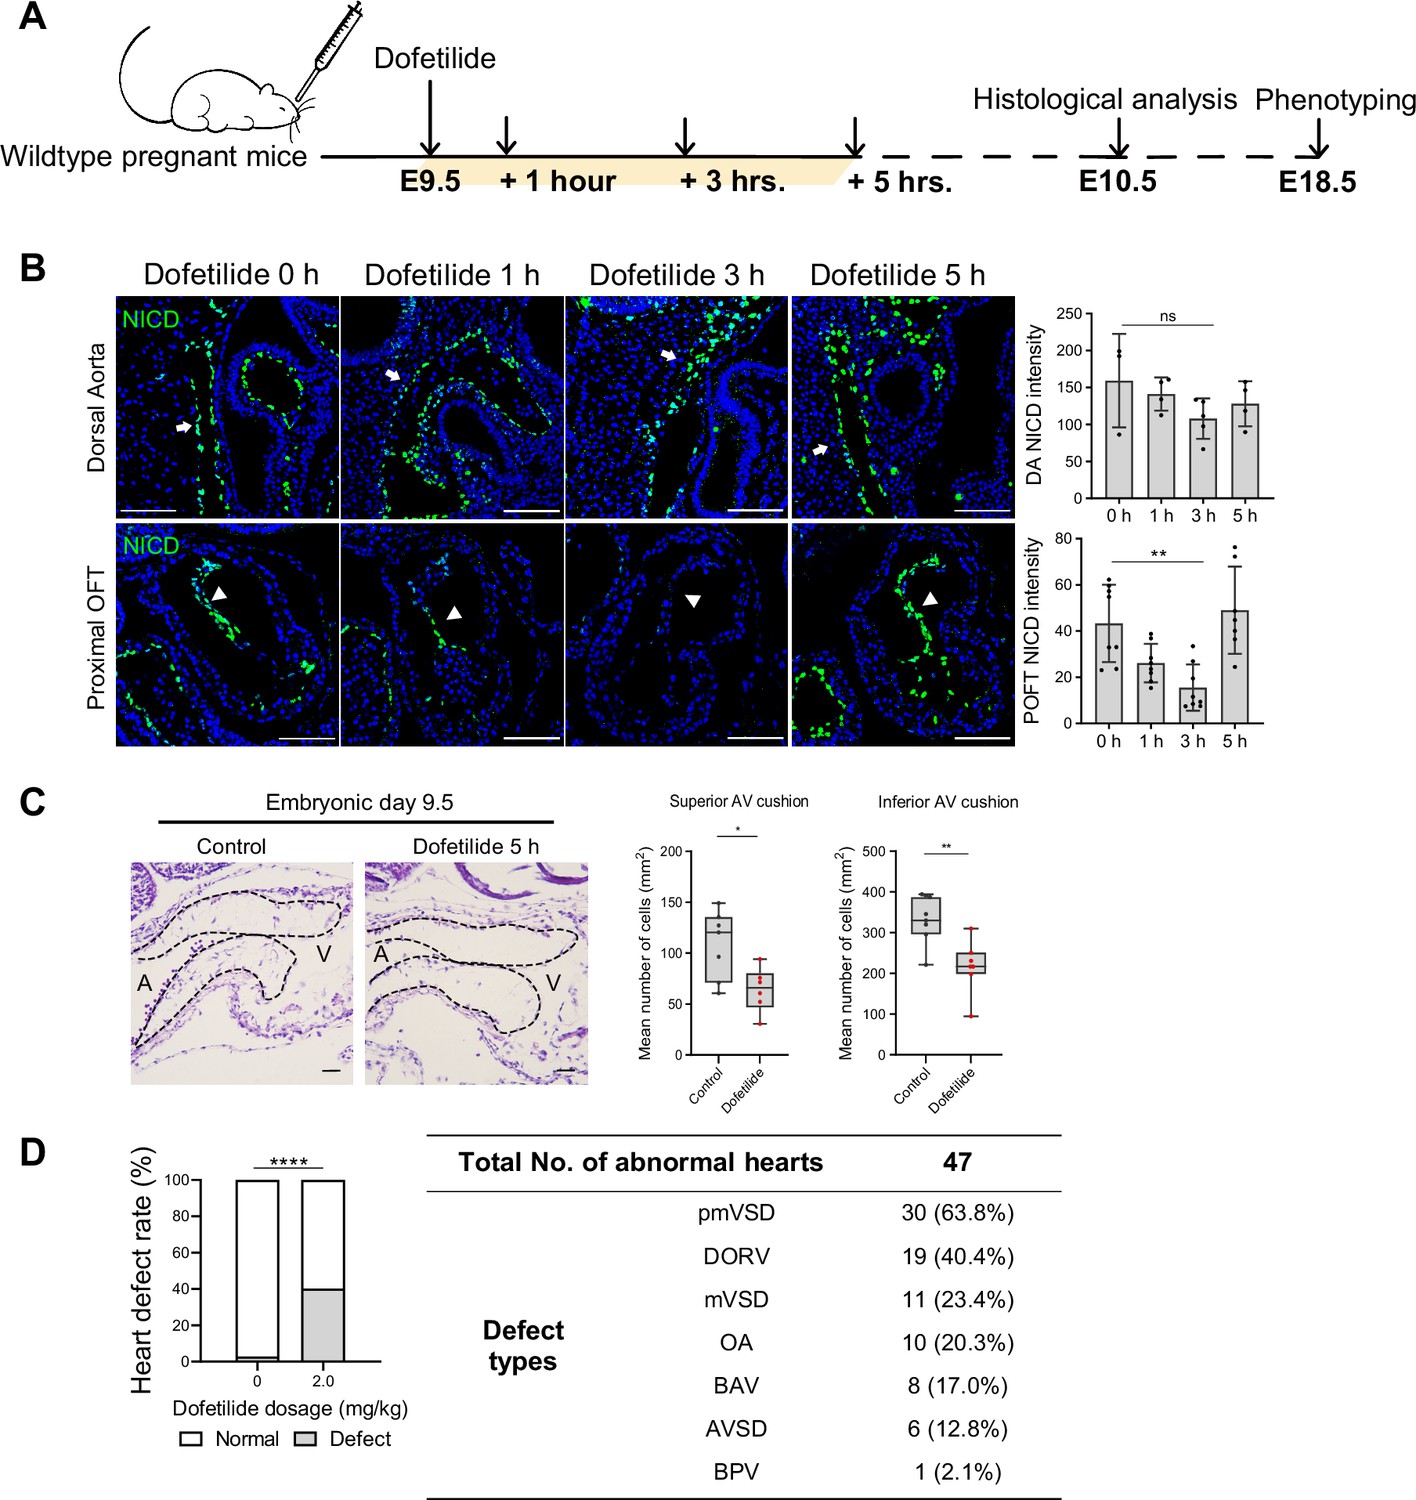
Blood flow is essential for Notch activation in the cushion endocardium and the development of the endocardial cushion.
(A) Schematic diagram of the experimental design. (B) Representative figures and statistics of NICD expression in dorsal aorta and POFT after dofetilide treatment. Each point in the quantification chart represents one embryo. (C) HE staining of E9.5 embryonic hearts and the quantifications of superior and inferior atrioventricular (AV) cushion cell density in the control group and 5 hr after dofetilide treatment. (Control: n=7 embryos; Dofetilide: n=6 embryos). (D) Heart defects induced by maternal dofetilide treatment. (0 mg/kg: n=37; 2.0 mg/kg: n=117). pmVSD, perimembranous ventricular septal defect; DORV, double-outlet right ventricle; mVSD, muscular VSD; OA, overriding aorta; BAV, bicuspid aortic valve; AVSD, atrioventricular septal defect; BPV, bicuspid pulmonary valve. Arrow: dorsal aorta endothelium. Arrowhead: endocardium. Scale bars, 100 µm. Differences between groups were analyzed by t-test (B, C) and Two-sided Fisher’s exact test (D). Data are expressed as the mean ± SD. *p<0.05, **p<0.01, ****p<0.0001, ns: non-significant.
Figure 2—figure supplement 2
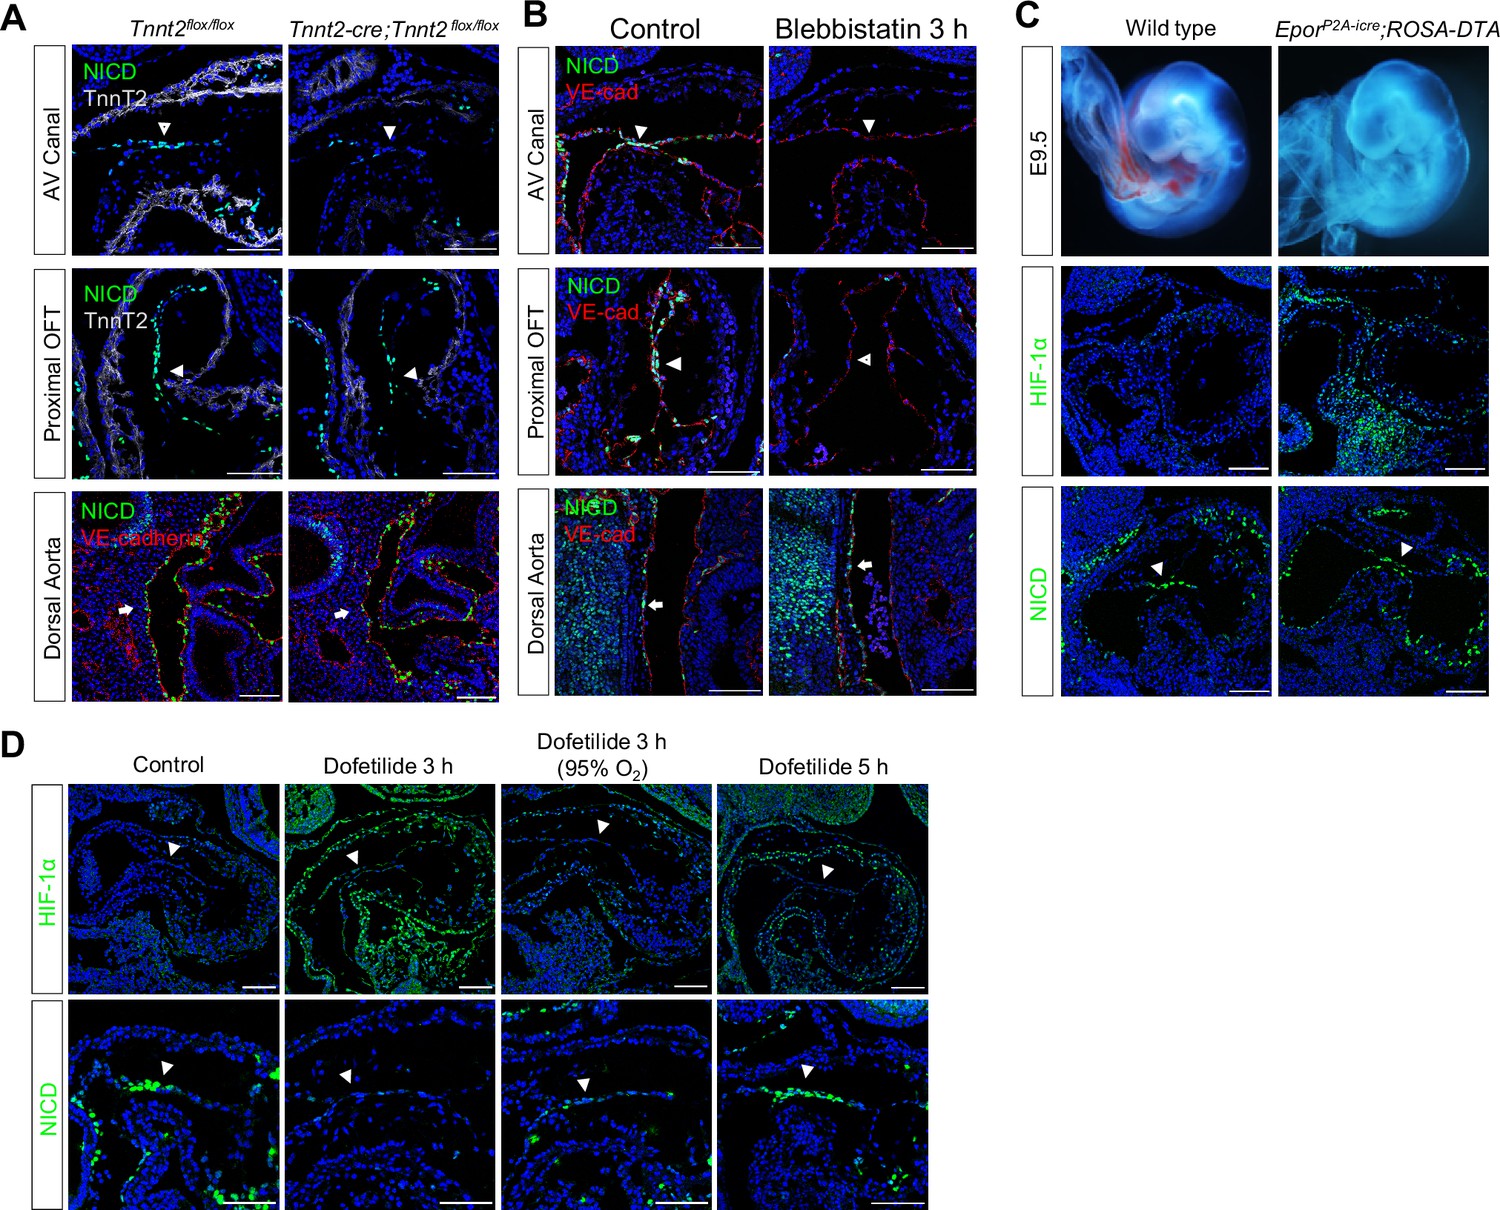
Notch inactivation in the cushion endocardium results from cardiac noncontraction rather than hypoxia.
(A) Representative images of NICD in myocardial-specific cardiac troponin T knockout mouse heart.(B) Representative images of NICD expression in atrioventricular (AV) canal, proximal outflow tract (OFT), and dorsal aorta after blebbistatin treatment (5 µM) for 3 hr. (C) HIF-1α and NICD in red blood cell depleted E9.5 mouse hearts. (D) Representative images of HIF-1α and NICD in E9.5 control, dofetilide-treated, and hyperoxia-treated mouse hearts. Arrow: dorsal aorta endothelium. Arrowhead: endocardium. Scale bars, 100 µm.
Figure 3 with 2 supplements
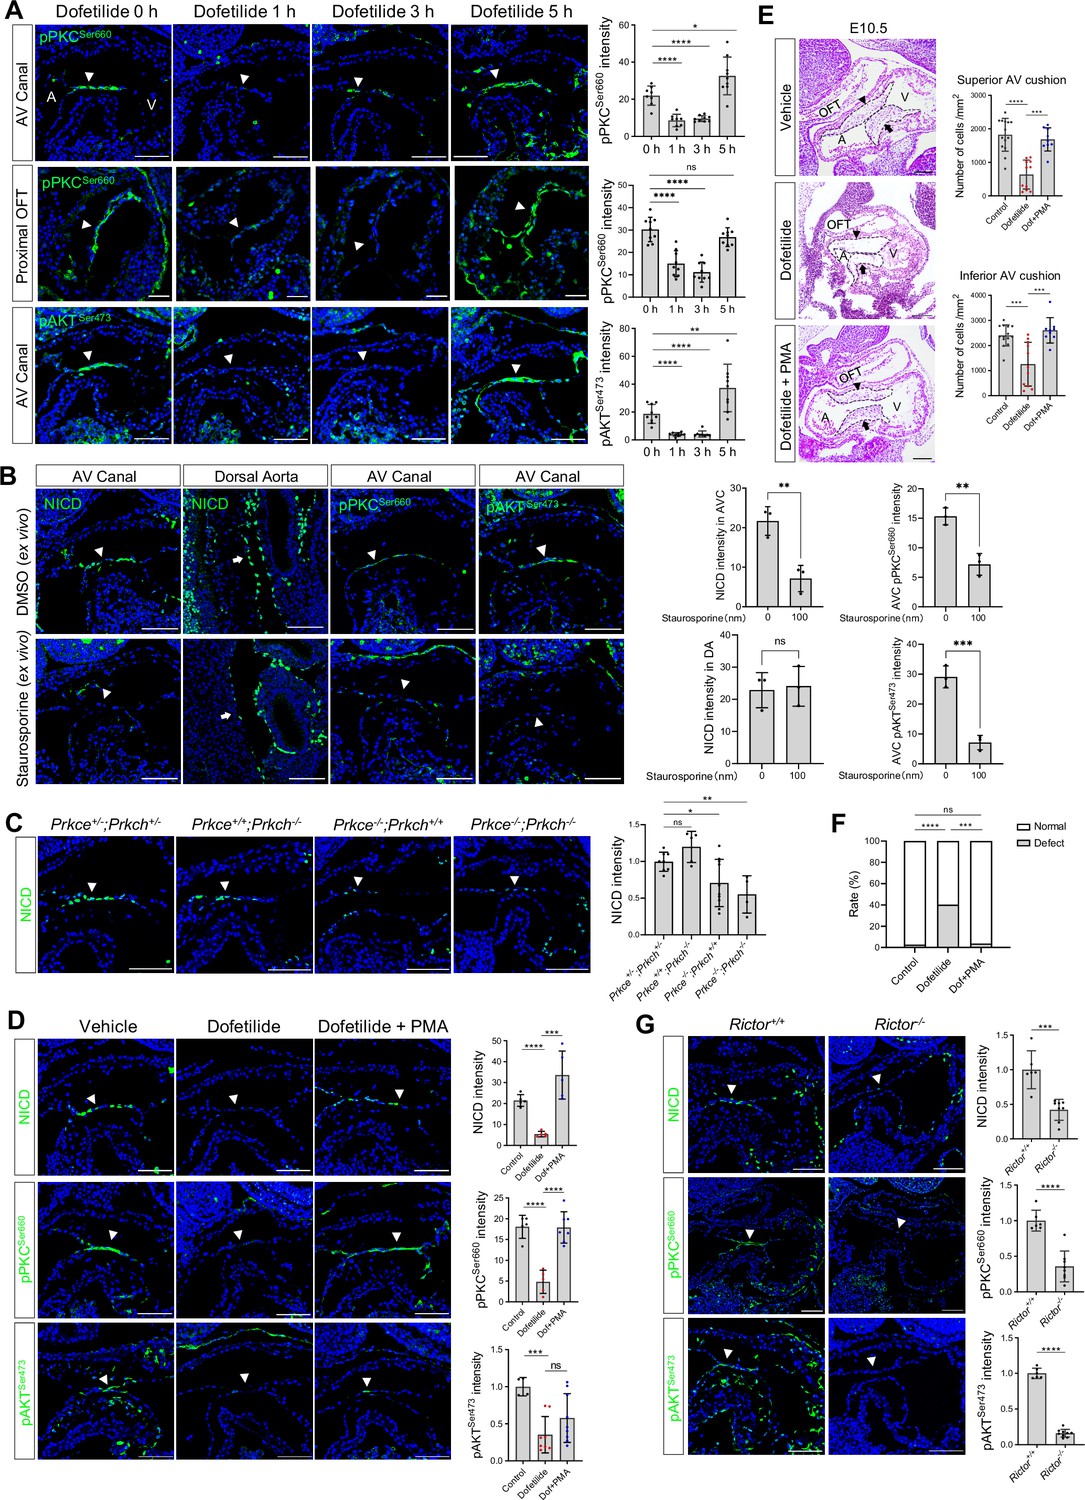
Flow-responsive mTORC2-PKCε activity is required for Notch activation in the cushion endocardium.
(A) Phospho-PKCSer660 and phospho-AKTSer473 levels in the atrioventricular (AV) canal endocardium and proximal outflow tract (OFT) endocardium (arrowhead) after dofetilide treatment. Each point in the quantification chart represents one embryo. (B) NICD, phospho-PKCSer660 and phospho-AKTSer473 expression in cultured E9.5 heart in response to ex vivo staurosporine treatment (100 nM). Each point in the quantification chart represents one embryo. (C) NICD expression in AV canal endocardium in Prkce and Prkch double heterozygous, single knockout and double knockout embryos. Each point in the quantification chart represents one embryo. (D) NICD, phospho-PKCSer660 and phospho-AKTSer473 staining in atrioventricular canal (AVC) endocardium (arrowhead) after dofetilide treatment and after rescue by phorbol 12-myristate 13-acetate (PMA). Each point in the quantification chart represents one embryo. (E) Sagittal E10.5 HE staining sections demonstrate acellularized superior (arrowhead) and inferior AV cushion (arrow) caused by dofetilide which were rescued by in PMA treatment (2 mg/kg). OFT, outflow tract; A, atrium; V, ventricle. Mesenchymal cell density was quantitated in superior and inferior AV cushions (Control: n=14 embryos; Dofetilide: n=11 embryos; Dofetilide + PMA: n=9 embryos). (F) Heart defect rate caused by maternal dofetilide and PMA treatment (Control: n=37; Dofetilide: n=62; Dofetilide + PMA: n=27). (G) NICD, phospho-PKCSer660, and phospho-AKTSer473 in AV canal endocardium (arrowhead) in wild-type and Rictor null mice (Rictor+/+: n=6; Rictor-/-: n=8). Scale bars, 100 µm. Differences between groups were analyzed by t-test (A-E, G) and Two-sided Fisher’s exact test (F). Data are expressed as the mean ± SD. *p<0.05, **p<0.01, ***p<0.001, ****p<0.0001, ns: non-significant.
Figure 3—figure supplement 1

phospho-PKCSer660 and phospho-AKTSer473 are undectable in E9.5 dorsal aorta endothelium.
(A) phospho-PKCSer660 and phospho-AKTSer473 in E9.5 mouse dorsal aorta endothelium. (B) phospho-ERK1/2 was not detectable in the atrioventricular (AV) canal endocardium. (C), NICD in cultured E9.5 heart in response to ex vivo wortmannin treatment (2 μM). Arrow: dorsal aorta endothelium. Arrowhead: endocardium. Scale bars, 100 µm.
Figure 3—figure supplement 2
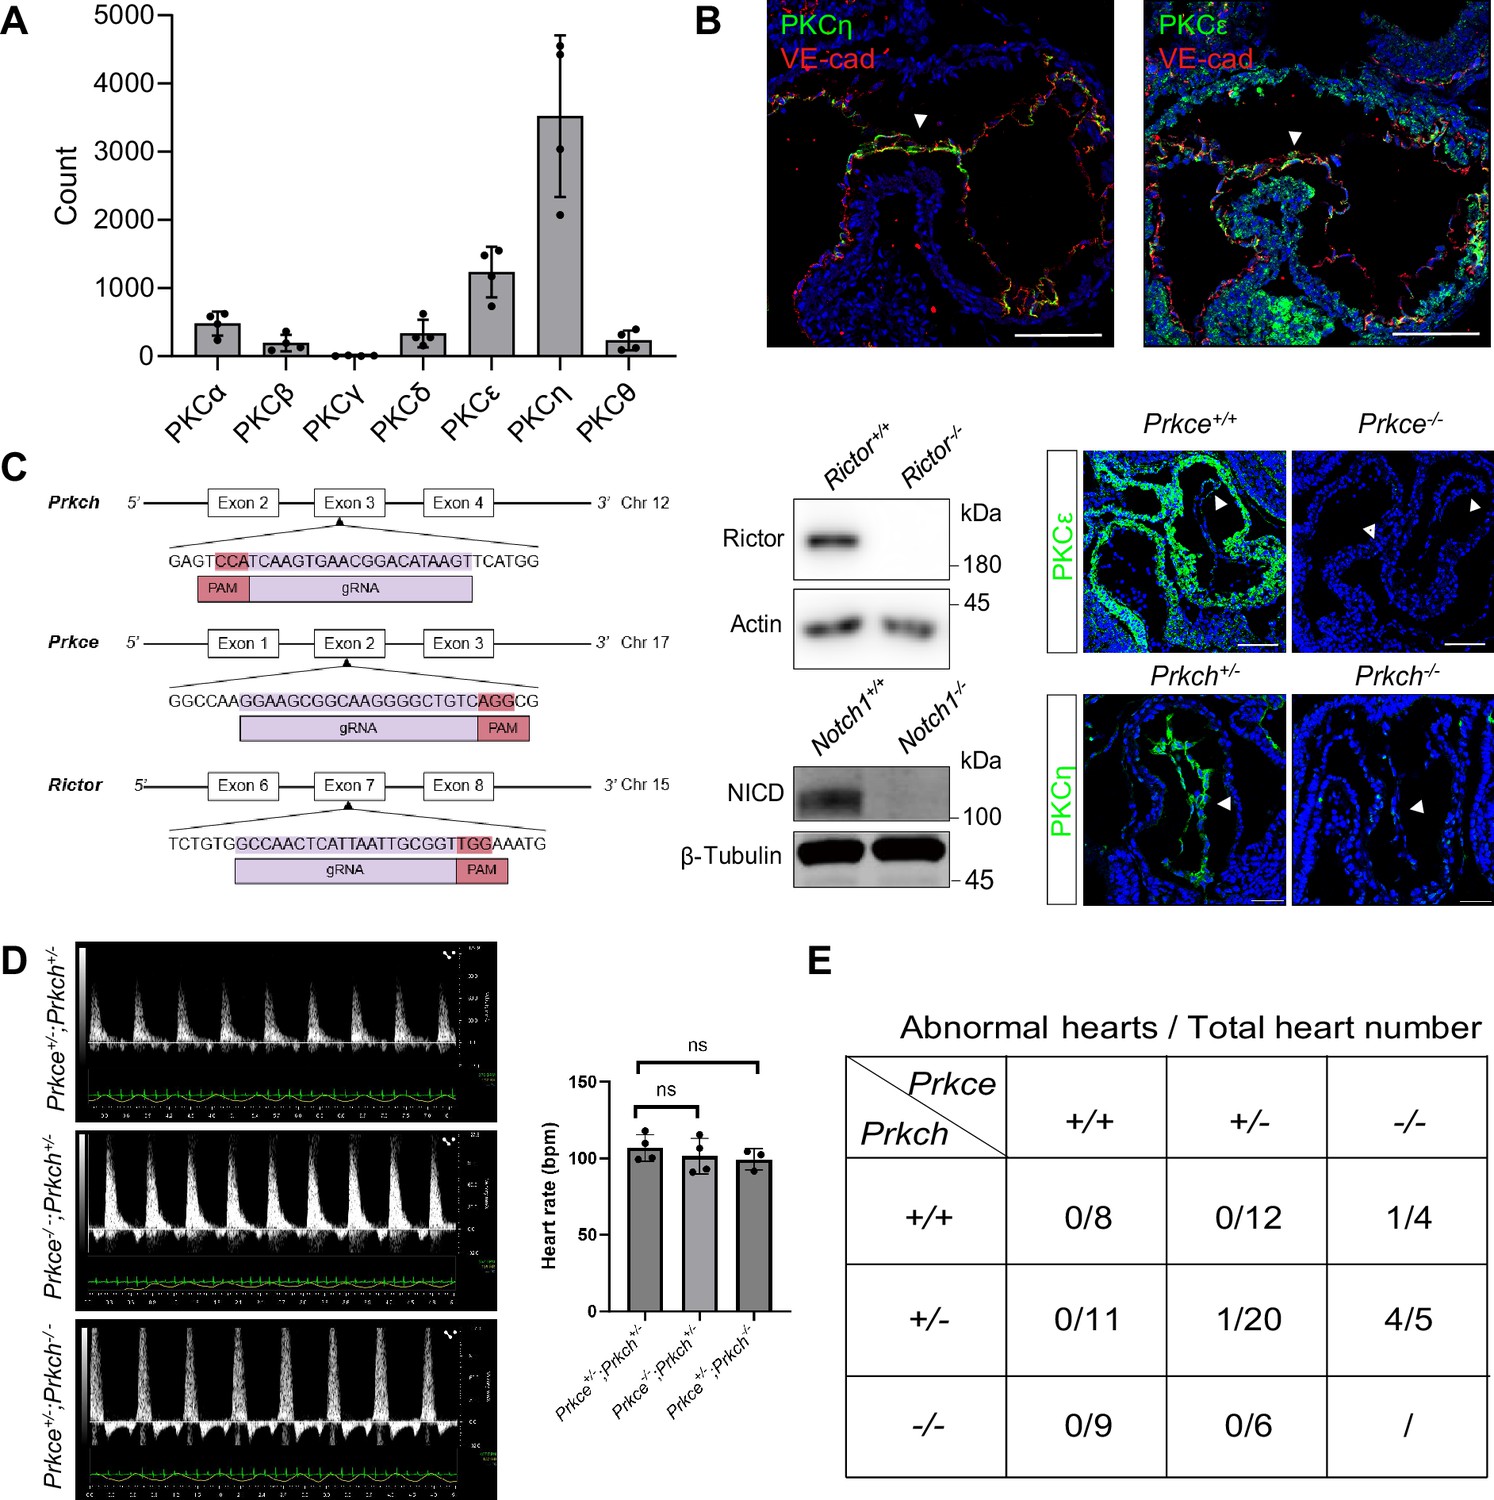
PKCε and PKCη are the most abundantly expressed PKC isoforms in the endocardium.
(A) Counts of conventional and novel PKC isoforms assessed by bulk RNA-seq of E9.5 embryonic endocardial cells. (n =4) (B) Immunofluorescence staining of PKCε and PKCη in E9.5 embryonic hearts. (C) Prkch, Prkce, and Rictor knockout mice strategies and western blot or immunofluorescence confirmation of KO. (D) Echocardiography of heterozygous Prkch, Prkce knockouts. (Prkce+/-;Prkch+/- and Prkce-/-;Prkch+/-: n=4, Prkce+/-;Prkch-/-: n=3). (E) Counts of abnormal hearts of the descendants of Prkch, Prkce double heterozygous intercrosses at E18.5. Scale bars, 100 µm. Differences between groups were analyzed by t-test. Data are expressed as the mean ± SD. ns: non-significant.
-
Figure 3—figure supplement 2—source data 1
RNA sequencing data of E9.5 embryonic endocardial cells.
- https://cdn.elifesciences.org/articles/97268/elife-97268-fig3-figsupp2-data1-v2.csv
Figure 4 with 1 supplement
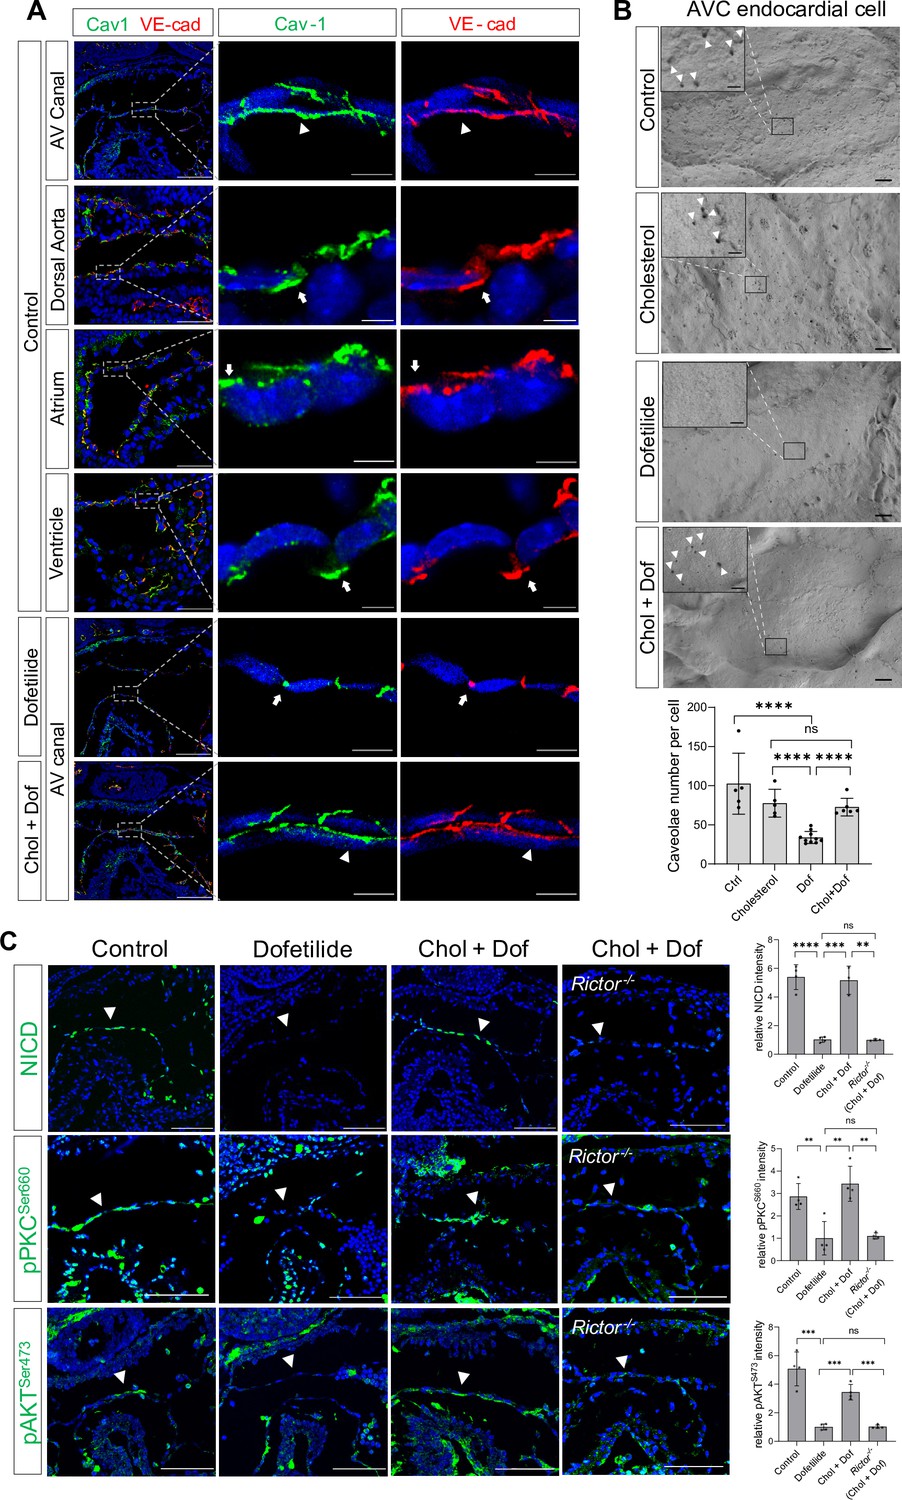
Shear stress-induced alteration of membrane lipid microstructure activated mTORC2-PKC-Notch signaling pathway.
(A) Caveolin-1 and VE-cadherin expression in mouse E9.5 atrioventricular (AV) canal, dorsal aorta, atrium, and ventricle endocardium, demonstrating luminal (arrowhead) and lateral (arrow) surface localization. Ex vivo dofetilide treatment (0.2 μg/ml) of cultured E9.5 embryos for 3 hr caused retraction of Caveolin-1 and VE-cadherin from the luminal surface of the atrioventricular canal (AVC) endocardial cells to the lateral cell adhesion sites which could be rescued by co-treatment with cholesterol (1 mg/ml). (B) Representative images and quantifications of scanning electron microscopy on E9.5 embryonic heart AV canal endocardial cells at their luminal surfaces, with caveolae structure presentively pointed by arrowhead. Each point in the quantification chart represents one embryo. (C) Loss of NICD, phospho-PKCSer660, and phospho-AKTSer473 in AVC endocardium (arrowhead) by ex vivo dofetilide treatment could be rescued by cholesterol. The rescue failed in Rictor null hearts. Each point in the quantification chart represents one embryo. Scale bars, 100 µm (A, C), 10 µm (A, zoom-in), 1 µm (B), 200nm (B, zoom-in). Differences between groups were analyzed by t-test. Data are expressed as the mean ± SD. **p<0.01, ***p<0.001, ****p<0.0001, ns: non-significant.
Figure 4—figure supplement 1
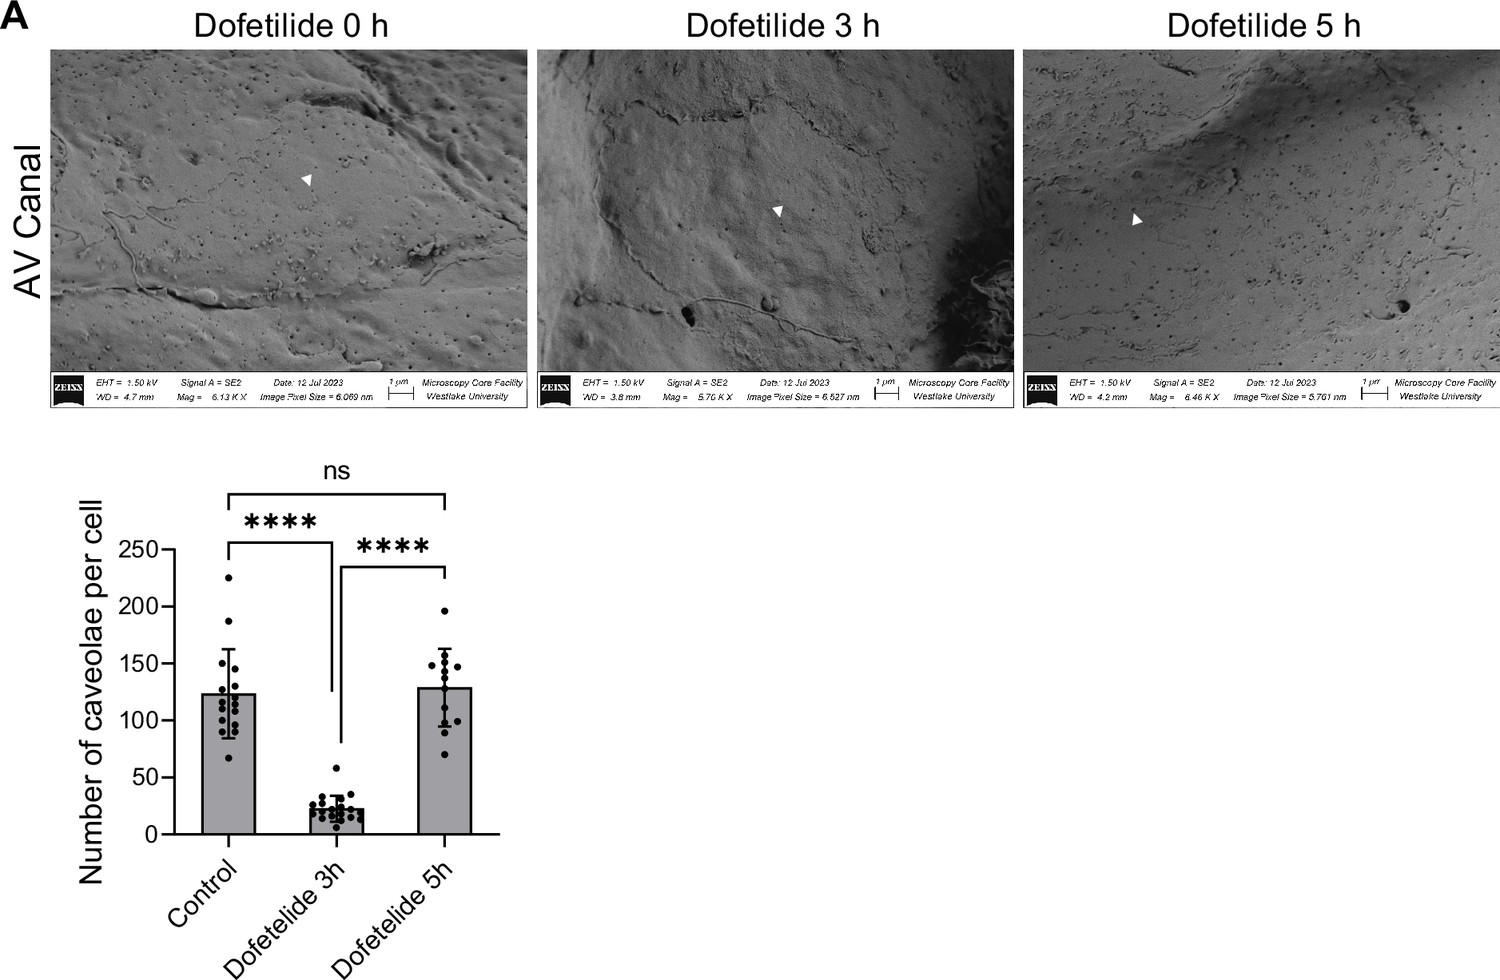
Dofetilide treatment reduced the caveolae structure in atrioventricular (AV) canal endocardial cells.
(A) Scanning electron microscopy of E9.5 embryonic heart in atrioventricular (AV) canal endocardial cells at their luminal surfaces after dofetilide treatment at 3 hr and 5 hr, with caveolae structure presentively pointed by arrowhead. Caveolae density was quantified. Each group has four embryos. Scale bars, 1 µm. Differences between groups were analyzed by t-test. Data are expressed as the mean ± SD. ****p<0.0001, ns: non-significant.
Figure 5
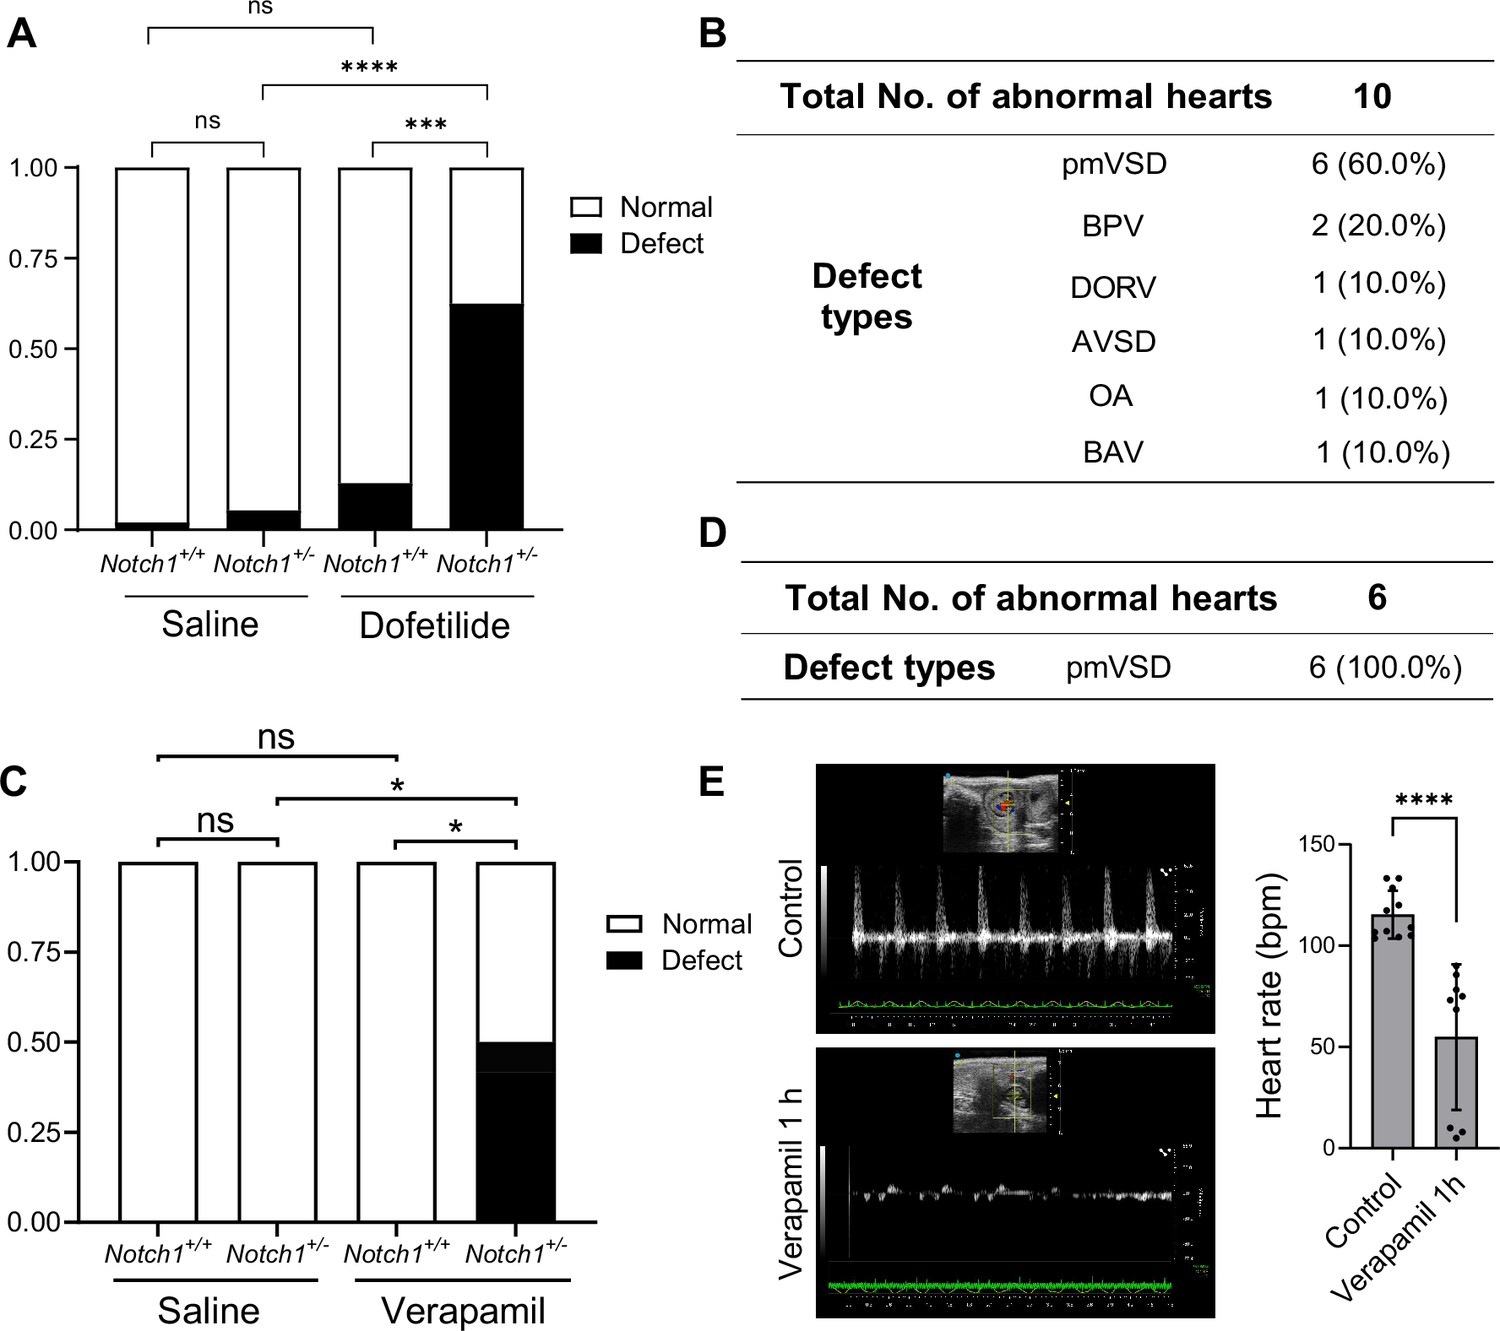
Pharmacogenetic interaction causing heart defects.
(A) Heart defect rate significantly increased in Notch1 heterozygous embryos treated with dofetilide (1.8 mg/kg) at E9.5. (Saline Notch1+/+: n=48, Saline Notch1+/-: n=37, Dofetilide Notch1+/+: n=31, Dofetilide Notch1+/-: n=16). Differences between groups were analyzed by Two-sided Fisher’s exact test. (B) Types of heart defects in the dofetilide and Notch1+/- combined group. (C) Heart defect rate significantly increased in Notch1 heterozygous embryos treated with Verapamil (15 mg/kg) at E9.5. (Saline Notch1+/+: n = 18, Saline Notch1+/-: n = 9, Verapamil Notch1+/+: n = 8, Verapamil Notch1+/-: n = 12). Differences between groups were analyzed by Two-sided Fisher’s exact test. (D) Type of heart defects in the verapamil combined with Notch1+/- group. (E) Representative echocardiography and quantifications of heartbeat in control and verapamil treated E9.5 embryos. Each point in the quantification chart represents one embryo. Differences between groups were analyzed by t-test. Data are expressed as the mean ± SD. *p<0.05, ***p<0.001, ****p<0.0001, ns: non-significant.
Figure 6
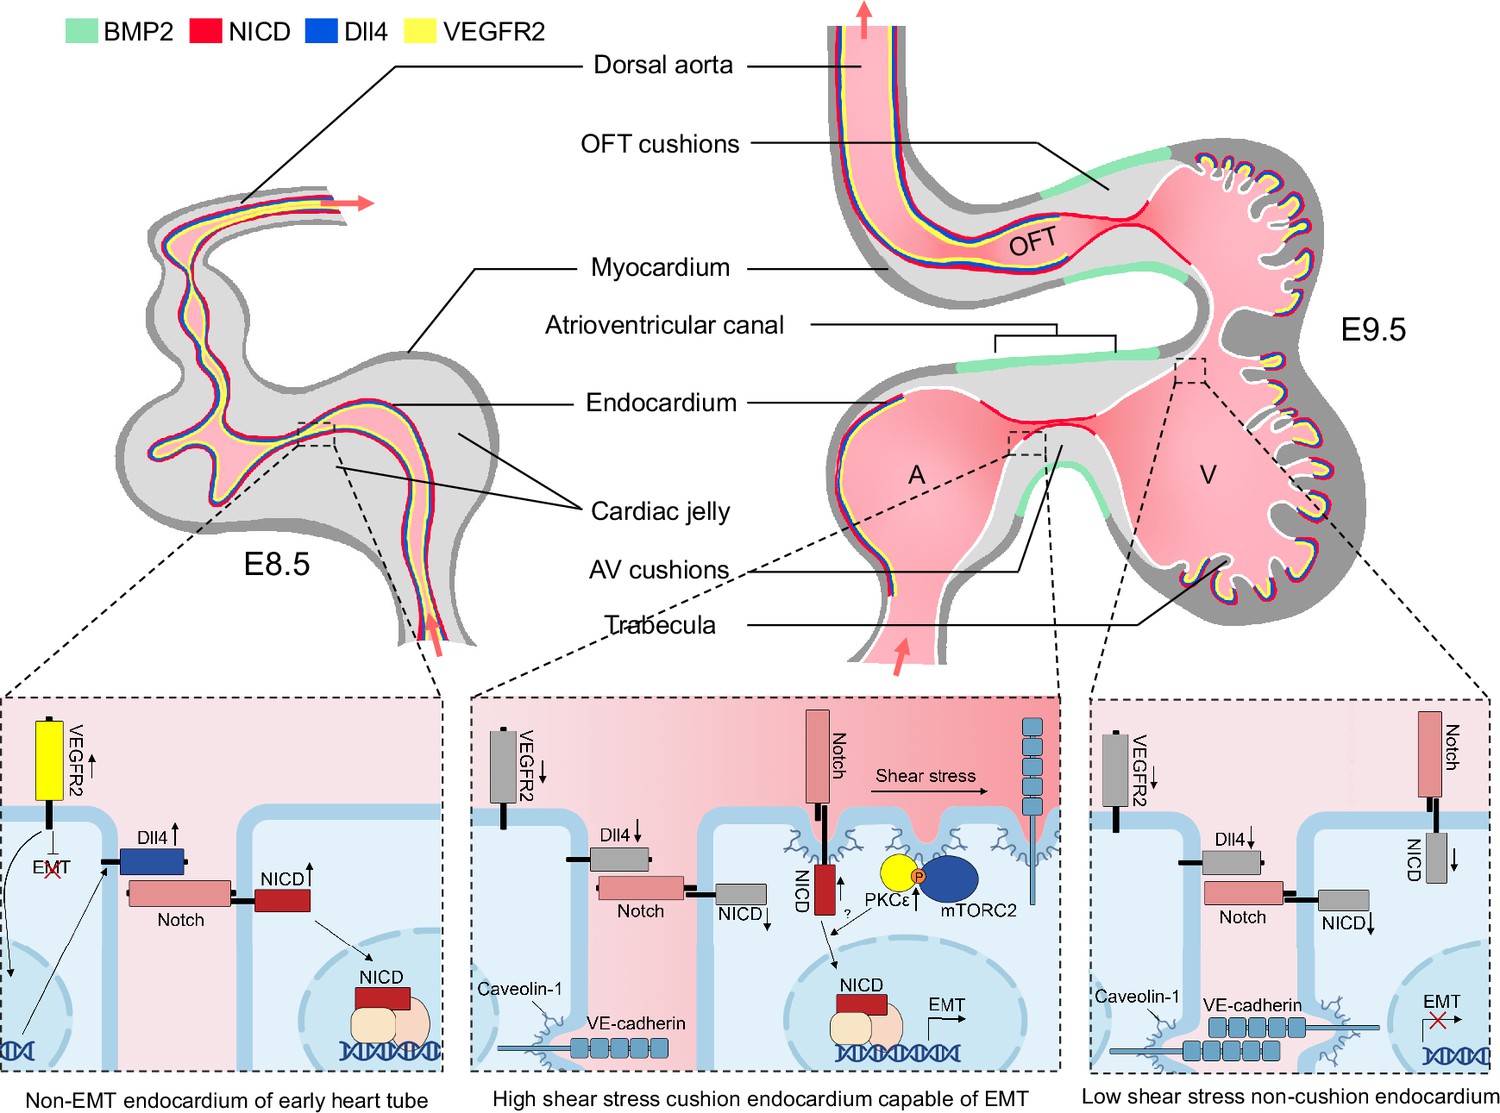
Working model of the establishment of Notch activation pattern by mechanical cues.
The establishment of a Notch activation pattern by mechanical cues involves a series of events in the developing heart tube. At E8.5, the arterial endothelium and non-EMT endocardium exhibit low shear stress, high VEGF, Dll4, and Notch signaling. One day later, the endocardium undergoes patterning and becomes capable of epithelial-to-mesenchymal transition (EMT) only in the atrioventricular canal (AVC) and proximal outflow tract (OFT) regions. This patterning is achieved through restricted expression of BMP2 and NICD in these specific areas. EMT requires the downregulation of VEGF signaling by the endocardium, enabling EMT to occur. Additionally, Dll4 is downregulated in the endocardium to prevent widespread Notch activation. Simultaneously, the high shear stress present in the AVC and proximal OFT regions leads to increased membrane lipid order, which activates the mTORC2-PKC-Notch pathway and promotes EMT. On the other hand, regions flanking these valve-forming areas experience lower shear stress, resulting in inactive Notch signaling and an inability to undergo EMT.
Videos
Video 1
E8.5 NICD whole mount staining.
NICD (green) whole-mount immunofluorescence staining of E8.5 mouse heart.
Video 2
E8.5 Dll4 in situ hybridization.
Whole-mount Dll4 (red) in situ hybridization staining of E8.5 mouse heart.
Video 3
E9.5 NICD whole mount staining.
NICD (green) whole-mount immunofluorescence staining of E9.5 mouse heart.
Video 4
E9.5 Dll4 in situ hybridization.
Whole-mount Dll4 (red) in situ hybridization staining of E9.5 mouse heart.
Video 5
E9.5 echo of a beating embryonic heart.
Echocardiography of a normal E9.5 mouse embryo in utero using color Doppler.
Video 6
E9.5 echo of a dofetilide-treated embryonic heart.
Echocardiography of a 1 hr after dofetilide-treated E9.5 mouse embryo in utero using color Doppler.
Video 7
E9.5 echo of Tnnt2-cre x Tnnt2 flox/flox beating with non-beating.
Echocardiography of two E9.5 embryos from Tnnt2-cre; Tnnt2 flox/+ x Tnnt2 flox/flox crossing. One embryo was genotyped to be Tnnt2flox/flox and the other Tnnt2-cre; Tnnt2flox/flox.
Tables
Key resources table
| Reagent type (species) or resource | Designation | Source or reference | Identifiers | Additional information |
|---|---|---|---|---|
| strain, strain background (M. musculus) | Dll4flox/flox | Cyagen | C57BL/6JCya-Dll4em1flox/Cya | |
| strain, strain background (M. musculus) | Tek-cre | GemPharmatech | C57BL/6JGpt-H11em1Cin(Tek-iCre)/Gpt | RRID:IMSR_GPT:T003764 |
| strain, strain background (M. musculus) | Tnnt2flox/flox | GemPharmatech | C57BL/6JGpt-Tnnt2em1Cflox/Gpt | RRID:IMSR_GPT:T013227 |
| strain, strain background (M. musculus) | Tnnt2-cre | Jax | STOCK Tg(Tnnt2-cre)5Blh/JiaoJ | RRID:IMSR_JAX:024240 |
| strain, strain background (M. musculus) | PrkceKO | This paper | The mouse line was generated in house using a sgRNA with the following target site GGAAGCGGCAAGGGGCTGTC. The sgRNA-cas9 ribonucleoprotein was injected to the zygotes to produce the mouse line with the following null allele NC_000083.7:g.86781801_86781811del. | |
| strain, strain background (M. musculus) | PrkchKO | This paper | Mouse line generated in house using a sgRNA with the following target site TCAAGTGAACGGACATAAGT. The sgRNA-cas9 ribonucleoprotein was injected to the zygotes to produce the mouse line with the following null allele NC_000078.7:g.73738396_73738411del. | |
| strain, strain background (M. musculus) | RictorKO | This paper | Mouse line generated in house using a sgRNA with the following target site GCCAACTCATTAATTGCGGT. The sgRNA-cas9 ribonucleoprotein was injected to the zygotes to produce the mouse line with the following null allele NC_000081.7:g.6785997_6785998ins AAACAGGTCAATTAATT. | |
| strain, strain background (M. musculus) | Notch1KO | This paper | Mouse line generated in house using a sgRNA with the following target site ATGTCTGTCAACAGCTGCAG. The sgRNA-cas9 ribonucleoprotein was injected to the zygotes to produce the mouse line with the following null allele NC_000068.8:g.26375459_26375768delinsTTGGG. | |
| strain, strain background (M. musculus) | EporP2A-icre | GemPharmatech | C57BL/6JGpt-Eporem1Cin(P2A-iCre-P2A-EGFP)/Gpt | RRID:IMSR_GPT:T052749 |
| strain, strain background (M. musculus) | ROSA-DTA | Jax | B6.129P2-Gt(ROSA)26Sortm1(DTA)Lky/J | RRID:IMSR_JAX:009669 |
| strain, strain background (M. musculus) | FVB | Beijing HFK | ||
| strain, strain background (M. musculus) | C57bl/6 | Shanghai Jihui Laboratory | ||
| antibody | Cleaved Notch (NICD) (Rabbit monoclonal) | Cell Signaling Technology | Cat# 4147, RRID:AB_2153348 | IF(1:400, TSA) |
| antibody | Phospho-AKT (Ser473) (D9E)(Rabbit monoclonal) | Cell Signaling Technology | Cat# 4060, RRID:AB_2315049 | IF(1:400, TSA) |
| antibody | Phospho-SMAD1/5 (Ser463/465) (41D10)(Rabbit monoclonal) | Cell Signaling Technology | Cat# 9516, RRID:AB_491015 | IF(1:400, TSA) |
| antibody | Phospho-PKC (pan) (βⅡSer660)(Rabbit monoclonal) | Cell Signaling Technology | Cat# 9371, RRID:AB_2168219 | IF(1:400, TSA) |
| antibody | Jagged1 (D4Y1R)(Rabbit monoclonal) | Cell Signaling Technology | Cat# 70109, RRID:AB_2799774 | IF(1:400, TSA) |
| antibody | VEGF receptor 2 (D5B1) (Rabbit monoclonal) | Cell Signaling Technology | Cat# 9698, RRID:AB_11178792 | IF(1:400) |
| antibody | PKCε (22B10)(Rabbit monoclonal) | Cell Signaling Technology | Cat# 2683, RRID:AB_2171906 | IF(1:400, TSA) |
| antibody | PKC eta (EPR18513)(Rabbit monoclonal) | Abcam | Cat# ab179524, RRID:AB_2892155 | IF(1:400, TSA) |
| antibody | Notch1 (EP1238Y)(Rabbit monoclonal) | Abcam | Cat# ab52627, RRID:AB_881725 | IF(1:400, TSA) |
| antibody | VE-Cadherin (Goat polyclonal) | R&D Systems | Cat# AF1002, RRID:AB_2077789 | IF(1:400) |
| antibody | Dll4 (Goat polyclona) | R&D Systems | Cat# AF1389, RRID:AB_354770 | IF(1:200) |
| antibody | Troponin T (RV-C2) (Rabbit monoclonal) | DSHB | Cat# RV-C2, RRID:AB_2240831 | IF(1:200) |
| antibody | Sox9 (SN74-09) (Rabbit monoclonal) | HuaBio | Cat# ET1611-56, RRID:AB_2924312 | IF(1:200) |
| antibody | Twist1 (Mouse monoclonal) | Abcam | Cat# ab50887, RRID:AB_883294 | IF(1:200) |
| antibody | HRP-Donkey Anti-Rabbit IgG (H+L) (Donkey polyclonal) | Jackson ImmunoResearch | Cat# 711-035-152, RRID:AB_10015282 | IF(1:500) |
| antibody | Peroxidase AffiniPure Donkey Anti-Mouse IgG (H+L) (Donkey polyclonal) | Jackson ImmunoResearch | Cat# 715-035-150, RRID:AB_2340770 | IF(1:500) |
| antibody | Peroxidase AffiniPure Donkey Anti-Goat IgG (H+L) (Donkey polyclonal) | Jackson ImmunoResearch | Cat# 705-035-003, RRID:AB_2340390 | IF(1:500) |
| antibody | Cy5 AffiniPure Donkey Anti-Goat IgG (H+L) (Donkey polyclonal) | Jackson ImmunoResearch | Cat# 705-175-147, RRID:AB_2340415 | IF(1:500) |
| antibody | Cy3 AffiniPure Donkey Anti-Goat IgG (H+L) (Donkey polyclonal) | Jackson ImmunoResearch | Cat# 711-165-152, RRID:AB_2307443 | IF(1:500) |
| antibody | Alexa Fluor 488 AffiniPure Donkey Anti-Mouse IgG (H+L) (Donkey polyclonal) | Jackson ImmunoResearch | Cat# 715-545-150, RRID:AB_2340846 | IF(1:500) |
| antibody | Cy3 Streptavidin | Jackson ImmunoResearch | Cat# 016-160-084, RRID:AB_2337244 | IF(1:500) |
| antibody | Alexa Fluor 488 Streptavidin | Jackson ImmunoResearch | Cat# 016-540-084, RRID:AB_2337249 | IF(1:500) |
| antibody | DAPI | Beyotime | Cat# C1002 | IF(1:500) |
| sequence-based reagent | Dll4flox/flox _F | This paper | PCR primers | CAACTGACCTAAAATGGGATGGTG |
| sequence-based reagent | Dll4flox/flox _R | This paper | PCR primers | GGTAACTACAAGGCAGAAAGAGGA |
| sequence-based reagent | Tnnt2flox/flox _F | This paper | PCR primers | GATCCTGCCTCCTTAGGTCTCAAGT |
| sequence-based reagent | Tnnt2flox/flox _R | This paper | PCR primers | CAAGTTCCTATGCCACATCTGCATG |
| sequence-based reagent | Tek-Cre _F | This paper | PCR primers | GCGGTCTGGCAGTAAAAACTATC |
| sequence-based reagent | Tek-Cre _R | This paper | PCR primers | GTGAAACAGCATTGCTGTCACTT |
| sequence-based reagent | Tnnt2-cre_F | This paper | PCR primers | GGACATGTTCAGGGATCGCCAGGCG |
| sequence-based reagent | Tnnt2-cre_R | This paper | PCR primers | GCATAACCAGTGAAACAGCATTGCTG |
| sequence-based reagent | PrkceKO _F | This paper | PCR primers | GAGTGTTCAGGGAGCGTATG |
| sequence-based reagent | PrkceKO _R | This paper | PCR primers | CAAGTAGGTGGCCATGAACTTG |
| sequence-based reagent | PrkchKO _F | This paper | PCR primers | GAGACCGCATCTTCAAGC |
| sequence-based reagent | PrkchKO _R | This paper | PCR primers | GTAGGTGGGCTGCCTC |
| sequence-based reagent | RictorKO _F | This paper | PCR primers | TCCTTCTCTGTTACAGATG |
| sequence-based reagent | RictorKO _R | This paper | PCR primers | ACCATTCTGTCTCGTTC |
| sequence-based reagent | Rosa-DTA_F | This paper | PCR primers | GTTATCAGTAAGGGAGCTGCAGTGG |
| sequence-based reagent | Rosa-DTA_wt_R | This paper | PCR primers | GGCGGATCACAAGCAATAATAACC |
| sequence-based reagent | Rosa-DTA_mt_R | This paper | PCR primers | AAGACCGCGAAGAGTTTGTCCTC |
| sequence-based reagent | EporP2A-icre_F | This paper | PCR primers | TCCCACTCCACCTCACTTGAAG |
| sequence-based reagent | EporP2A-icre _R | This paper | PCR primers | CTGACTTCATCAGAGGTGGCATC |
| sequence-based reagent | Notch1KO_F | This paper | PCR primers | AAGCTGGGAGAGAAAAGCAGACC |
| sequence-based reagent | Notch1KO_R | This paper | PCR primers | CACAACCTCCTATAGCCCTTACC |
| chemical compound, drug | Staruosporine | MCE | HY-15141 | |
| chemical compound, drug | Phorbol 12-myristate 13-acetate (PMA) | Sigma-Aldrich | P8139 | |
| chemical compound, drug | Dofetilide | Rhawn | R023594 | |
| chemical compound, drug | Wortmannin | Selleck | S2758 | |
| chemical compound, drug | Cholesterol-Water soluble | Sigma-Aldrich | C4951 | |
| chemical compound, drug | CMC-Na | Shyuanye | S14016 | |
| chemical compound, drug | Saline | Shyuanye | R27405 | |
| chemical compound, drug | Isoflurane | RWD | R510-22-10 | |
| chemical compound, drug | 10% neutral buffered formalin | Legene | DF0111 | |
| chemical compound, drug | Glutaraldehyde | Sigma-Aldrich | G7651 | |
| chemical compound, drug | Benzyl alcohol | Sinoreagent | 30020618 | |
| chemical compound, drug | Benzyl benzoate | Sinoreagent | 30020828 | |
| chemical compound, drug | Glycerol | Sinoreagent | 10010618 | |
| chemical compound, drug | Hanks buffer | Beyotime | C0218 | |
| chemical compound, drug | DMEM | Gibco | C11965500BT | |
| chemical compound, drug | DMSO | Macklin | D806645 | |
| chemical compound, drug | Triton X-100 | Macklin | I997471 | |
| chemical compound, drug | Fetal bovine sreum | Solarbio | S9030 | |
| chemical compound, drug | Verapamil | Selleck | S4202 | |
| software, algorithm | ImageJ 1.52i | ImageJ | RRID:SCR_003070 | |
| software, algorithm | Zen 2.3 | Zeiss | RRID:SCR_013672 | |
| software, algorithm | Imaris v9.1.1 | Oxford Instruments | RRID:SCR_007370 | |
| software, algorithm | Adobe Photoshop cc2019 | Adobe | RRID:SCR_014199 | |
| software, algorithm | Olympus OlyVIA 3.3 | Olympus | RRID:SCR_016167 | |
| software, algorithm | GraphPad Prism 8 | GraphPad | RRID:SCR_002798 | |
| software, algorithm | Vevo Lab 5.7.1 | FUJIFILM | RRID:SCR_022152 |
Additional files
Download links
A two-part list of links to download the article, or parts of the article, in various formats.
Downloads (link to download the article as PDF)
Open citations (links to open the citations from this article in various online reference manager services)
Cite this article (links to download the citations from this article in formats compatible with various reference manager tools)
Mechanical forces pattern endocardial Notch activation via mTORC2-PKC pathway
eLife 13:RP97268.
https://doi.org/10.7554/eLife.97268.3


