The autophagy protein ATG14 safeguards against unscheduled pyroptosis activation to enable embryo transport during early pregnancy
- Department of Pathology and Immunology, Baylor College of Medicine, United States
- Department Obstetrics and Gynecology, Washington University School of Medicine, United States
- Center for Reproductive Health Sciences, Washington University School of Medicine, United States
- Department of Molecular and Cellular Biology, Baylor College of Medicine, United States
- Department of Medicine and Department of Cell Biology, Washington University School of Medicine, United States
- Department of Host Defense, Research Institute for Microbial Diseases (RIMD), Japan
- Laboratory of Host Defense, World Premier Institute Immunology Frontier Research Center (WPI-IFReC), Osaka University, Japan
- Department of Molecular Virology and Microbiology, Baylor College of Medicine, United States
Figures
Figure 1 with 1 supplement
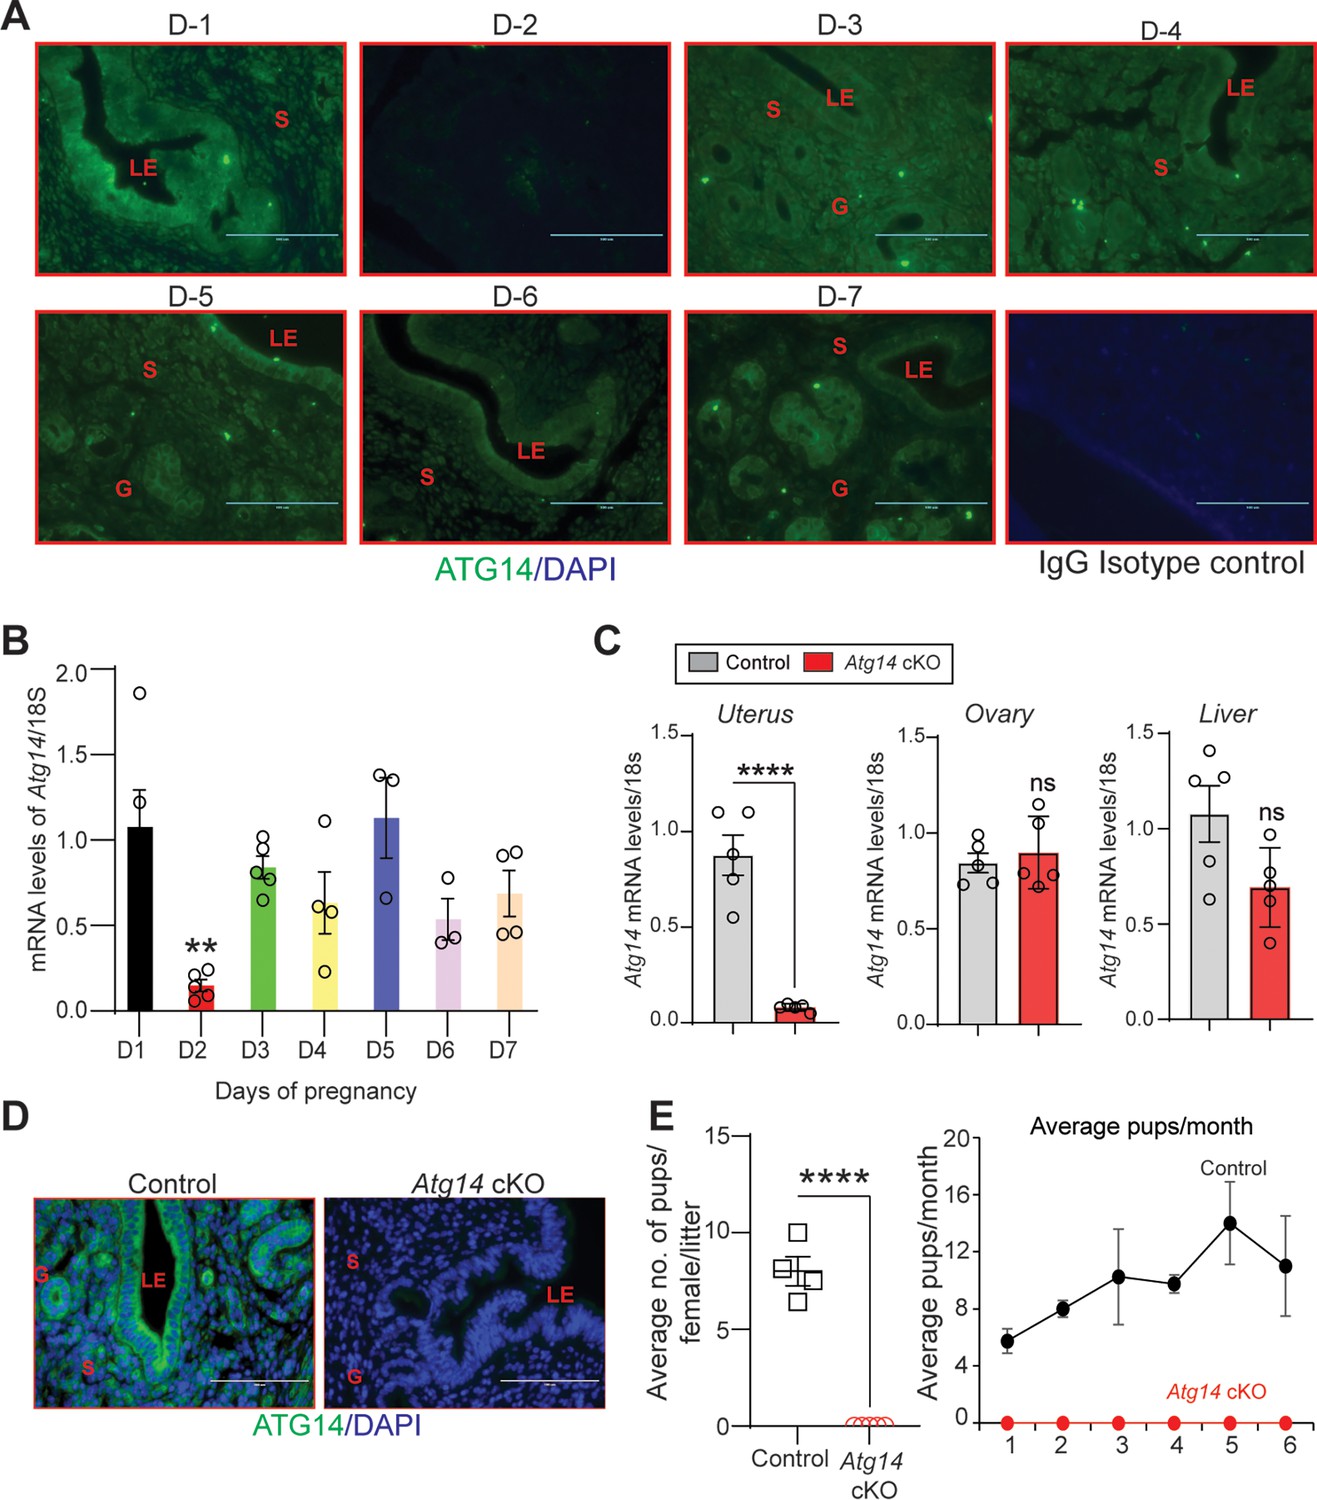
Atg14 loss in the female reproductive tract (FRT) results in infertility.
(A) Representative immunofluorescent images of uteri from pregnant mice (n = 3) at the indicated days of pregnancy stained with an ATG14-specific antibody (green). LE: luminal epithelium; G: glands; S: stroma, Scale bar: 100 µm. Rabbit IgG was used as an isotype control for staining. (B) Relative transcript levels of Atg14 mRNA in uteri from pregnant mice (n = 3–5) at indicated days of pregnancy. mRNA levels are normalized to levels of 18S m-RNA. Data are presented as mean ± SEM; **p<0.01, p>0.05, ns = nonsignificant. (C) Relative mRNA levels of Atg14 in 8-week-old virgin control and cKO mice uteri, ovary, and liver (n = 5). mRNA levels are normalized to levels of 18S mRNA. Data are presented as mean ± SEM; ***p<0.001, p>0.05, ns = nonsignificant. (D) Representative immunofluorescent images of ATG14 expression in different uterine compartments in control (n = 5) and Atg14 cKO mice (n = 5). LE: luminal epithelium; G: glands; S: stroma. (E) (Left panel) Relative number of pups/female/litter and (right panel) and relative number of total pups/months of Atg14 control (n = 4) and cKO mice (n = 5) sacrificed after the breeding trial. Data are presented as mean ± SEM; ***p<0.001; p>0.05, ns = nonsignificant.
Figure 1—figure supplement 1
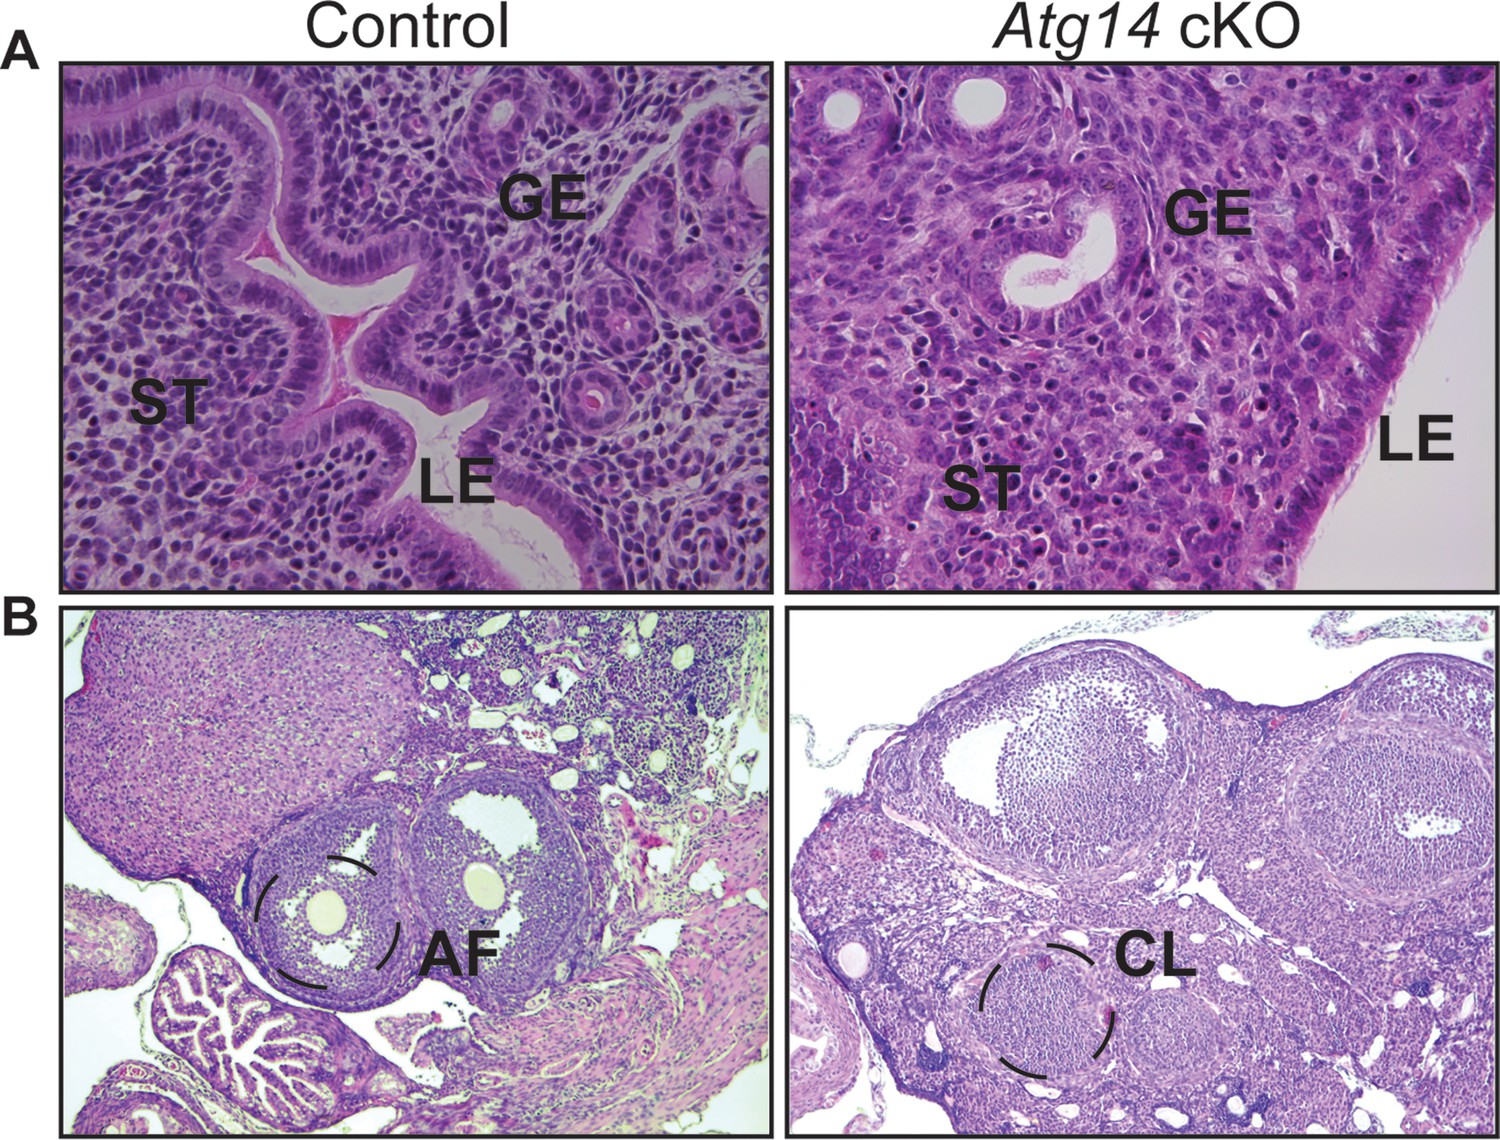
Atg14 cKO mice show normal gross morphology of the uterus and ovary (A, B).
Histological analysis using H&E staining of 8-week-old virgin Atg14 control and cKO mice uteri and ovary. LE: luminal epithelium; GE: glandular epithelium; ST: stroma; AF: antral follicle; CL: corpus luteum.
Figure 2
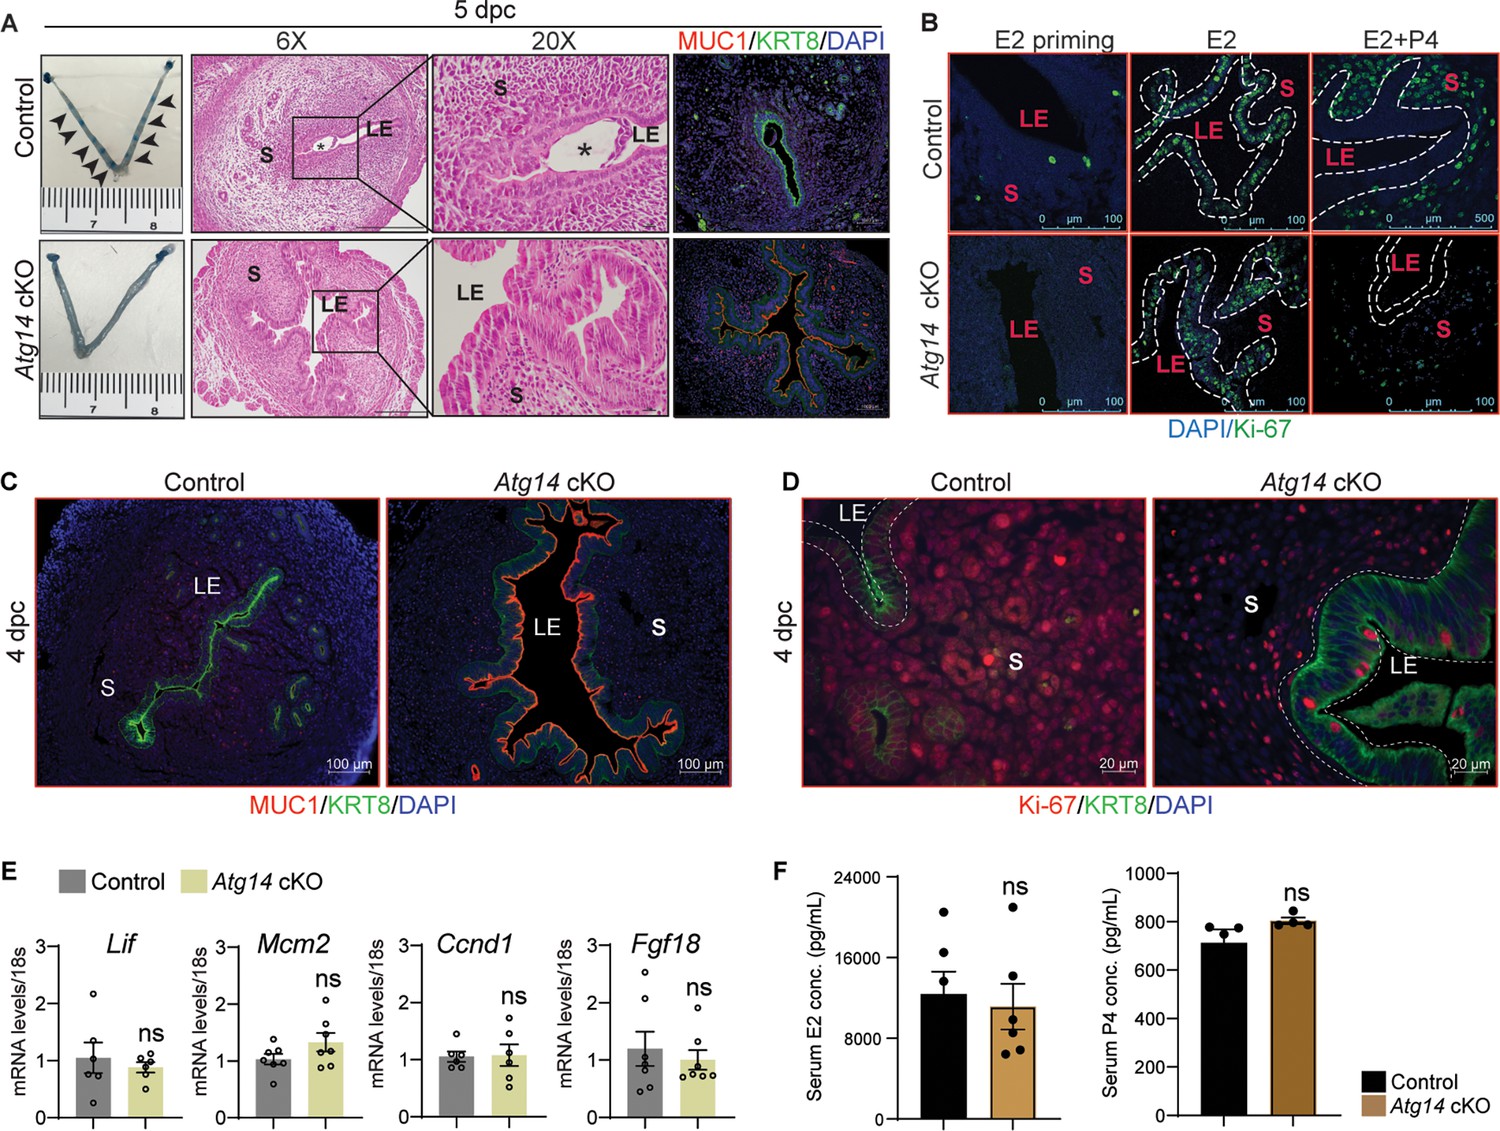
Atg14 is critical for embryo implantation and uterine receptivity.
(A) Gross images of 5.0 dpc uteri of control (n = 5) and Atg14 cKO mice (n = 5) injected with Chicago Sky Blue dye to visualize implantation sites (denoted by black arrows) (left panel). H&E-stained cross-sections (×6 and ×20) of 5.0 dpc uteri of control (n = 5) and Atg14 cKO (n = 5) mice to visualize embryo implantation (middle panel). The asterisk denotes the embryo. Immunofluorescence analysis of uterine tissues from control (n = 5) and Atg14 cKO mice (n = 5), stained with MUC1 and KRT8 (right panel). LE: luminal epithelium; G: glands; S: stroma. (B) Representative immunofluorescence images of uteri from control (n = 5) and Atg14 cKO mice (n = 5) stained for Ki-67 following Oil or E2 or E2 + P4 treatment (n = 5 mice/group); scale bar: 100 μm. LE: luminal epithelium; G: glands; S: stroma. (C) Immunofluorescence analysis of KRT8 (green), MUC1 (red), and (D) Ki-67 (red) in the uteri of 4 dpc control and Atg14 cKO mice; scale bars, 100 µm. (E) Relative transcript levels of Lif, Mcm2, Ccnd1, and Fgf18 in control and cKO uteri at 4 dpc. mRNA levels are normalized to levels of 18S m-RNA. Data are presented as mean ± SEM; ns = nonsignificant. (F) Levels of steroid hormones estradiol and progesterone from serum collected during euthanasia of 4 dpc control or cKO mice.
Figure 3 with 2 supplements
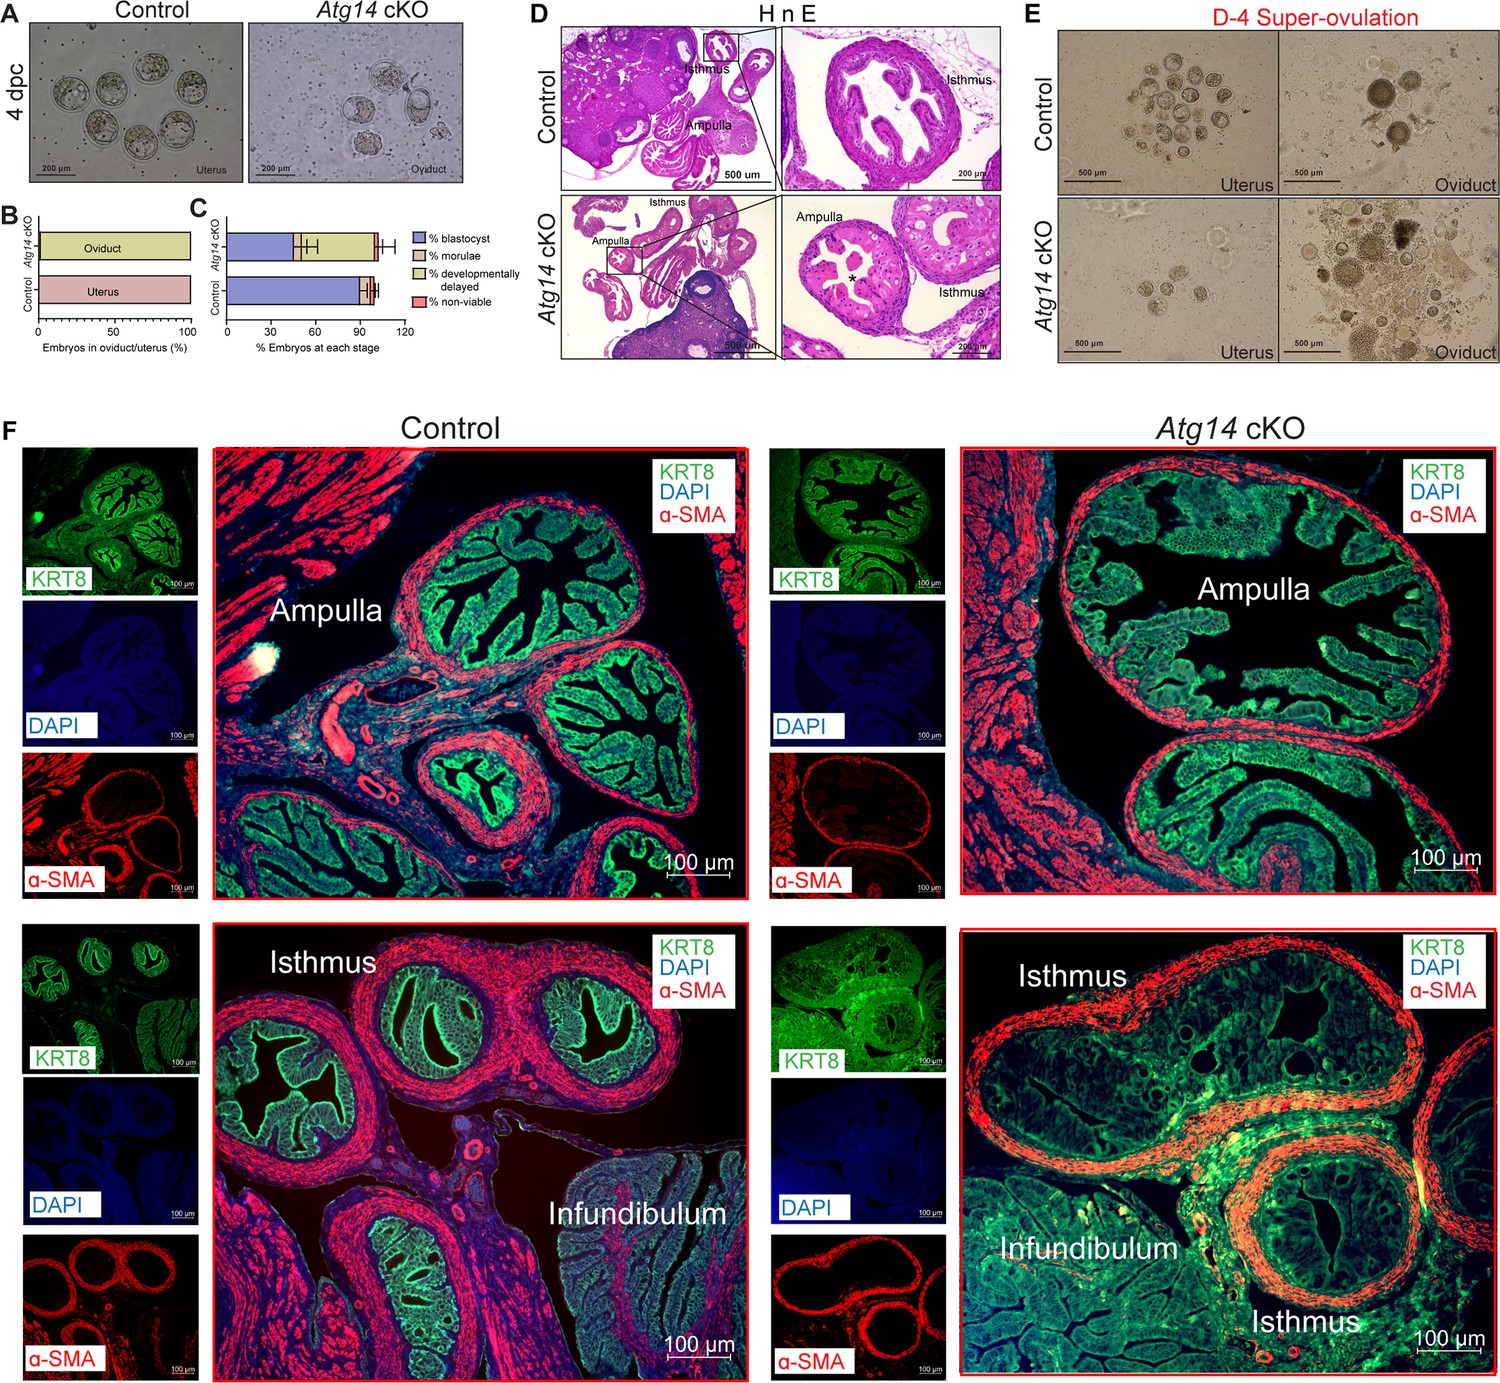
Atg14 is critical for embryo transport in oviduct.
(A) Representative images (upper panel) and (B) percentage of embryos (lower panel) collected at 4 dpc from the uteri or the oviducts of control (n = 6) or Atg14 cKO mice (n = 6–8). (C) Percentage of blastocysts, morulae, developmentally delayed or nonviable embryos collected from Atg14 control mice uteri and Atg14 cKO mice oviducts at 4 dpc. (D) Histological analysis using H&E staining of the ampullary and isthmic region of the oviduct from control and Atg14 cKO female mice at 4 dpc (n = 3 mice/genotype). (E) Embryos retrieved from the oviduct and uterus of super-ovulated Atg14 control or cKO mice at 4 dpc (n = 3 mice/genotype). (F) Immunofluorescence analysis of KRT8 (green), and α-SMA (red), in the oviduct of 4 dpc control (n = 5) and Atg14 cKO mice (n = 5) ampulla (upper panel) and isthmus (lower panel).
Figure 3—figure supplement 1
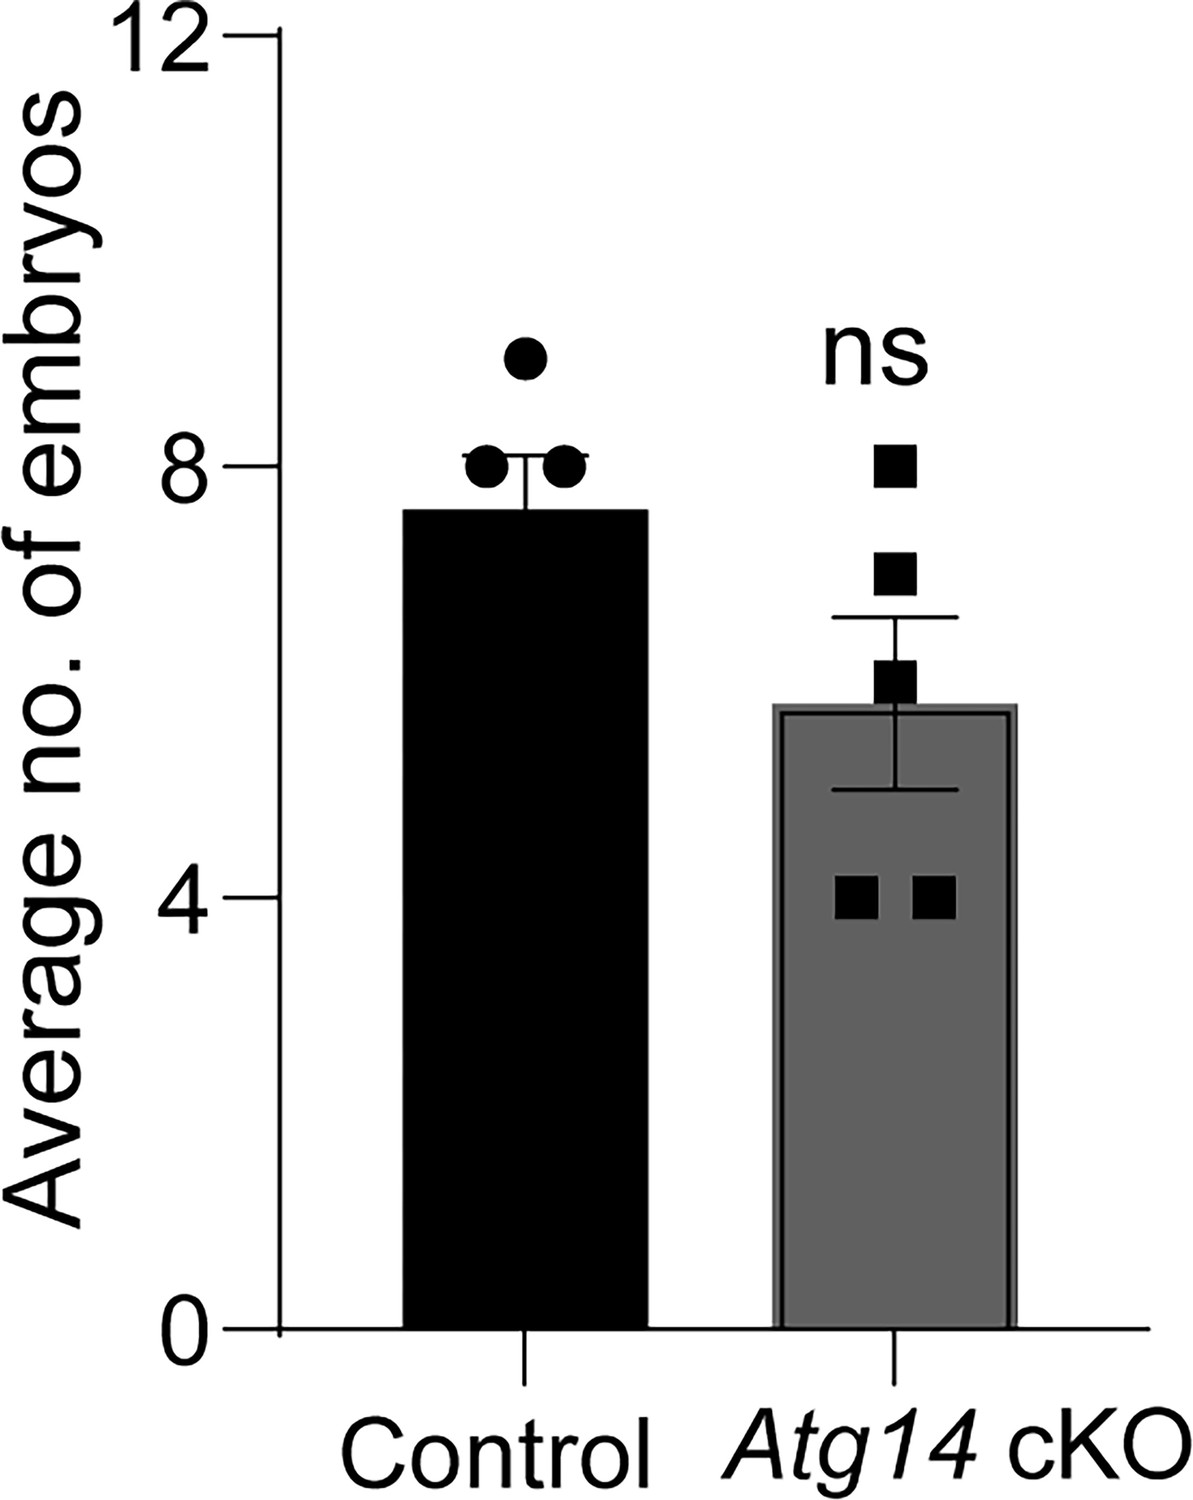
Average number of embryos are unaltered in control or Atg14 cKO D4 pregnant mice.
Average number of embryos retrieved from Atg14 cKO (n = 5) oviducts or control uteri (n = 5).
Figure 3—figure supplement 2
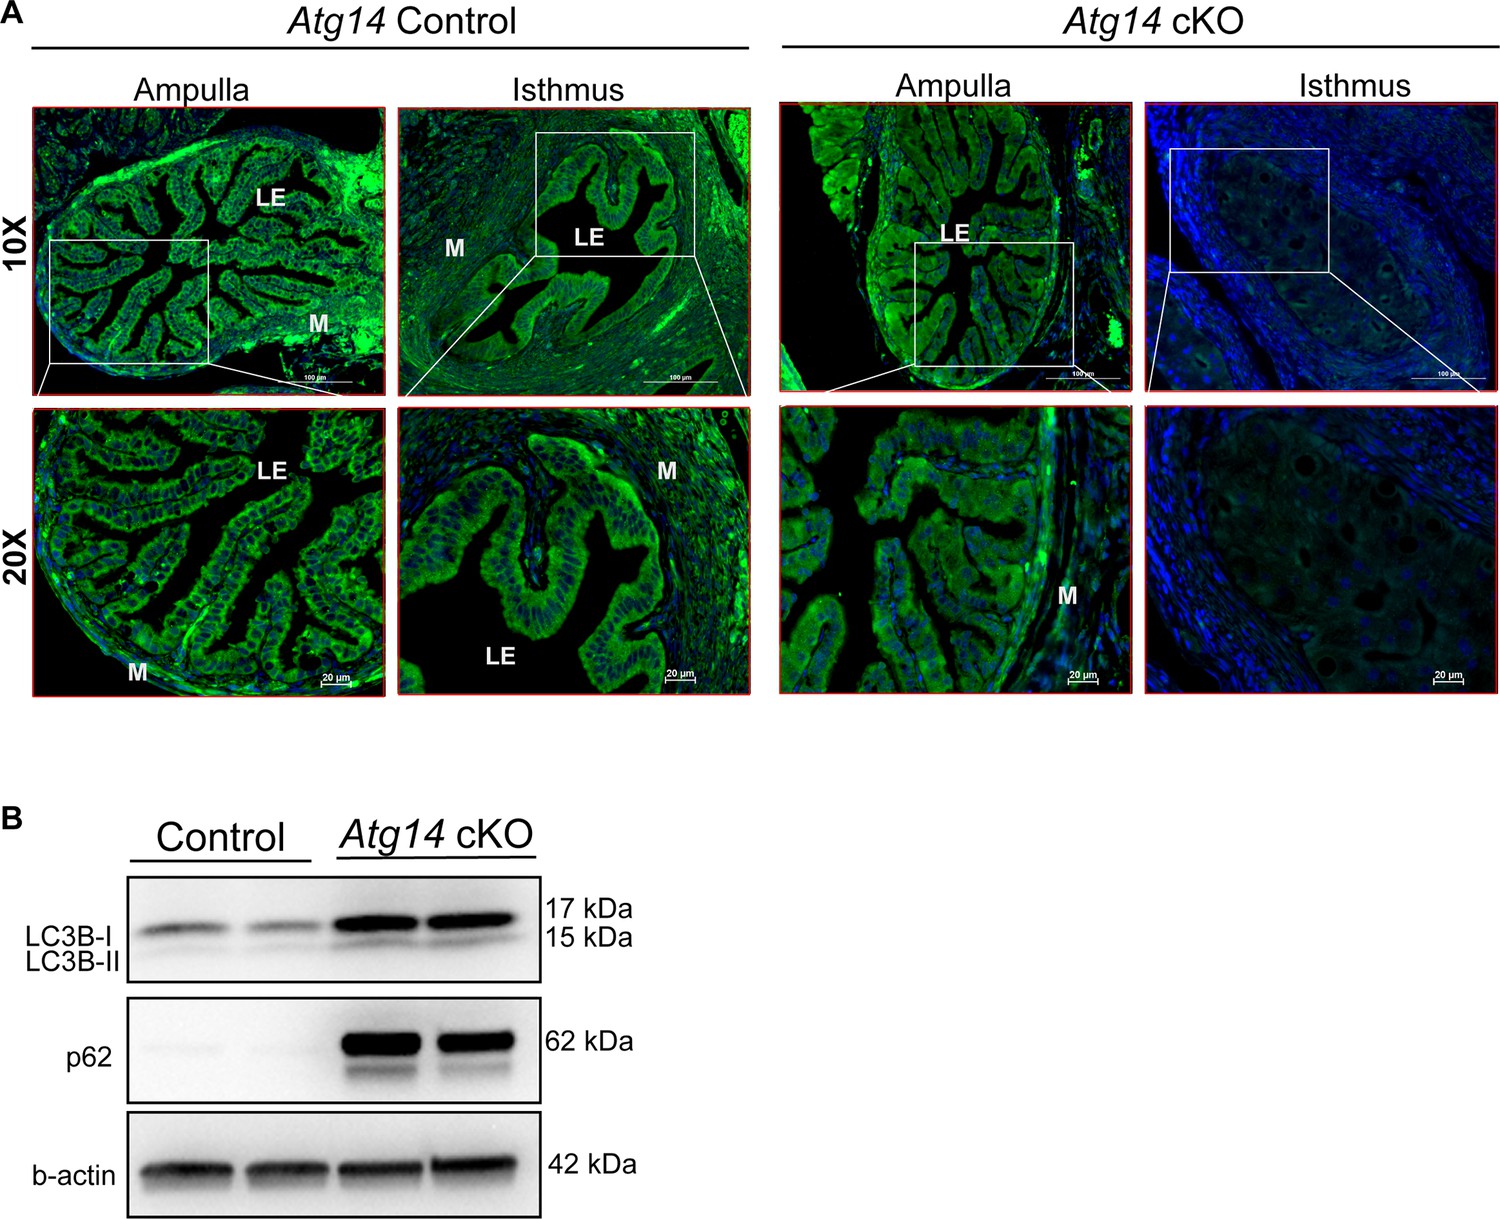
Atg14 cKO mice altered autophagy markers expression.
(A) Immunofluorescence analysis to show ATG14 expression in ampulla and isthmus regions of oviducts. LE: Luminal epithelium; M: smooth muscle. Scale bar: 100 µm; 20 µm. The upper panel shows the ×10 objective images and the lower panel shows the ×20 objective images. (B) Western blotting shows LC3B and p62 expression in control and cKO oviducts tissues. β-actin was used as a loading control.
-
Figure 3—figure supplement 2—source data 1
Original western blots for Figure 3—figure supplement 2, indicating the relevant bands and groups.
- https://cdn.elifesciences.org/articles/97325/elife-97325-fig3-figsupp2-data1-v1.zip
-
Figure 3—figure supplement 2—source data 2
Uncropped original labelled blots.
- https://cdn.elifesciences.org/articles/97325/elife-97325-fig3-figsupp2-data2-v1.zip
Figure 4 with 1 supplement
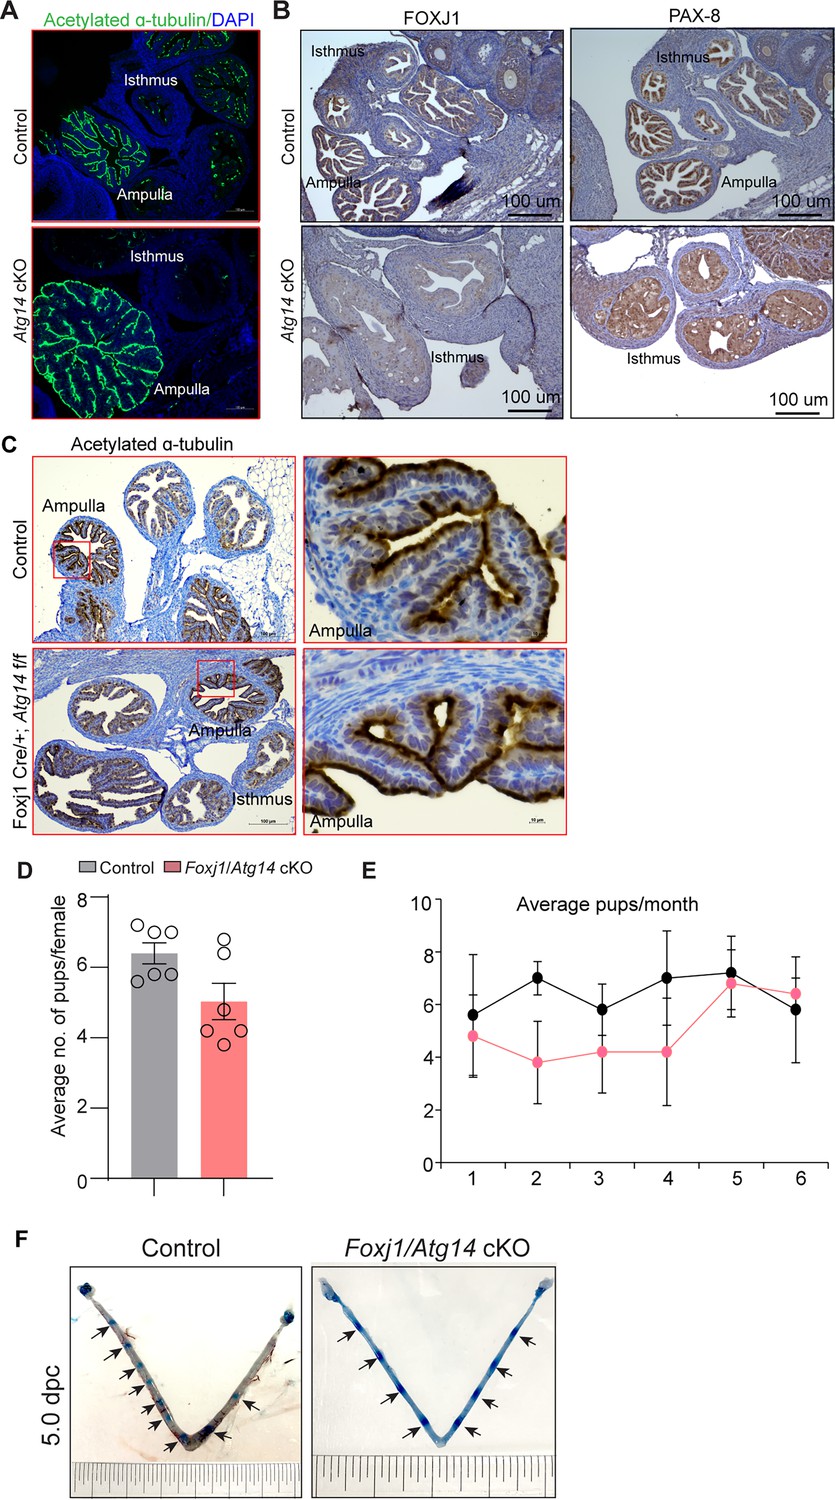
Atg14 loss in oviduct cilia is dispensable for embryo transport.
(A) Immunofluorescence analysis of acetylated α-tubulin (green), and DAPI (blue) in oviduct of 4 dpc control (n = 5) and Atg14 cKO mice (n = 5). (B) Immunohistochemical analysis of FOXJ1 and PAX8 at 4 dpc (n = 5). (C) Immunohistochemical analysis of acetylated α-tubulin in 8-week-old control (n = 5) and Foxj1/Atg14 cKO mice (n = 5). Images are taken at ×6 and ×40. Scale bar: 100 µm and 10 µm. (D, E) Relative number of pups/females/litter and relative number of total pups/months of control (n = 5) and Foxj1/Atg14 cKO mice (n = 5) sacrificed after the breeding trial. Data are presented as mean ± SEM; p>0.05, ns = nonsignificant. (F) Gross images of 5.0 dpc uteri of control (n = 3) and Foxj1/Atg14 cKO mice (n = 3) injected with Chicago Sky Blue dye to visualize implantation sites (denoted by black arrows).
Figure 4—figure supplement 1
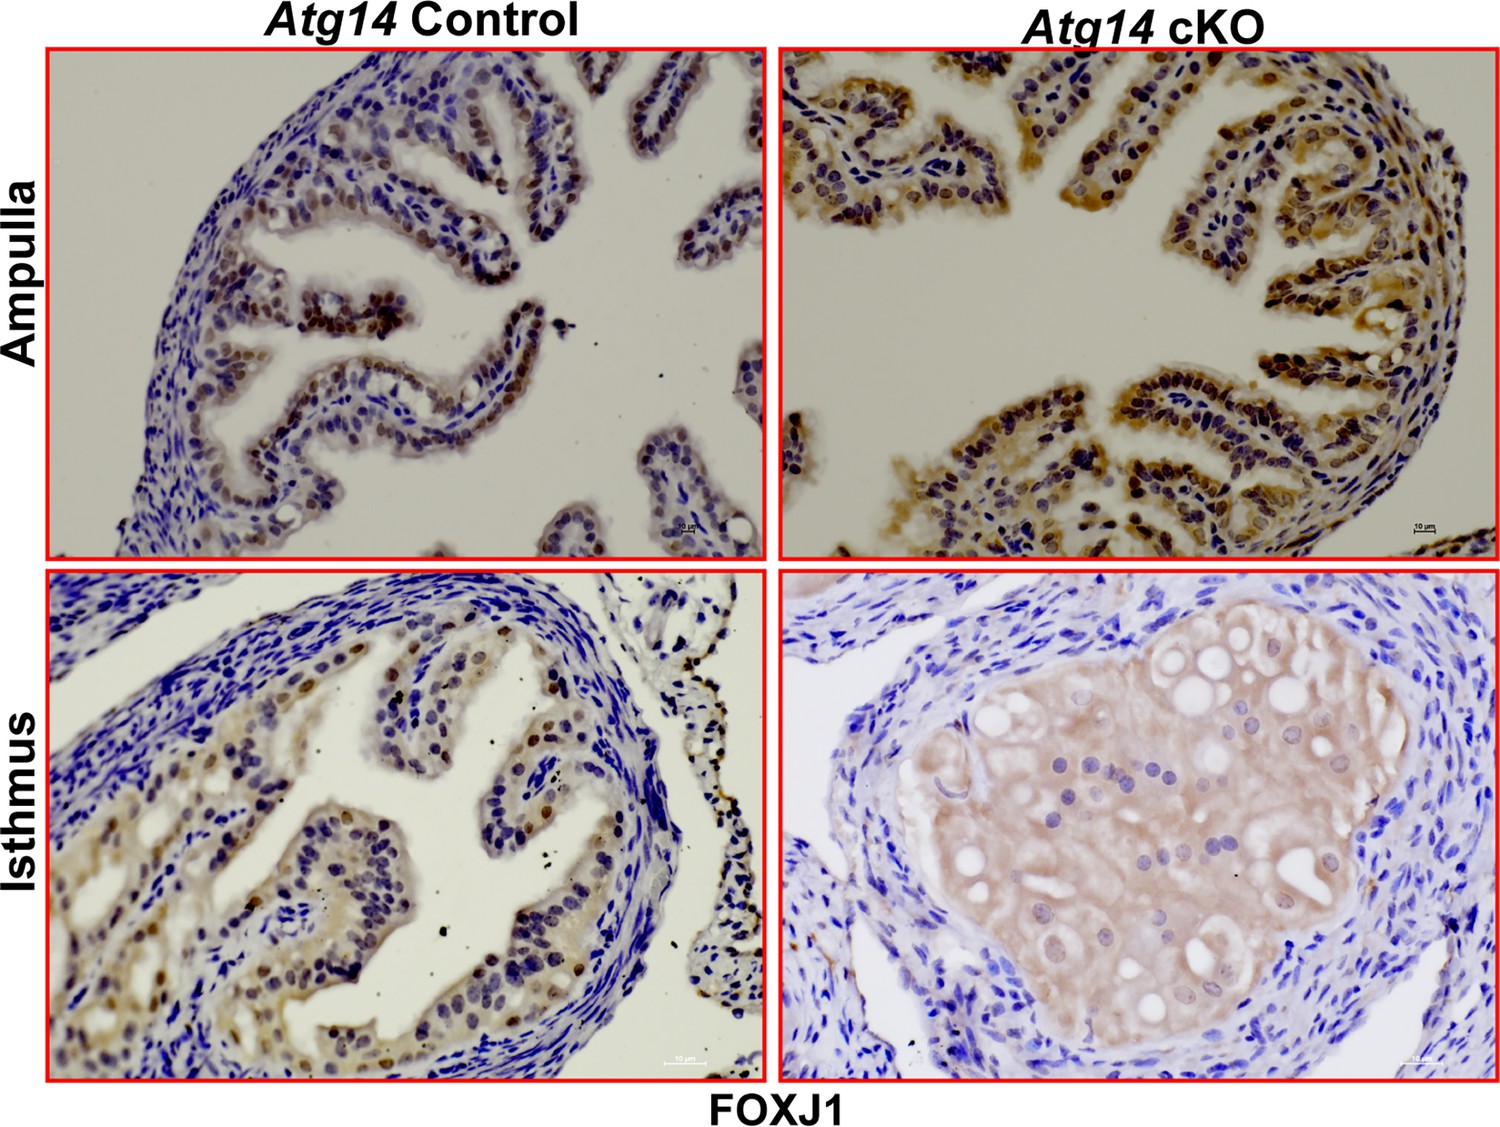
Atg14 cKO mice show a reduced number of FOXJ1-expressing ciliary epithelial cells.
Immunohistochemistry to show FoxJ1-positive staining in Atg14 control and cKO oviducts. The upper panel shows the ampullary section, and the lower panel shows the isthmus section. Images were taken at ×20. Scale bar: 10 µm.
Figure 5
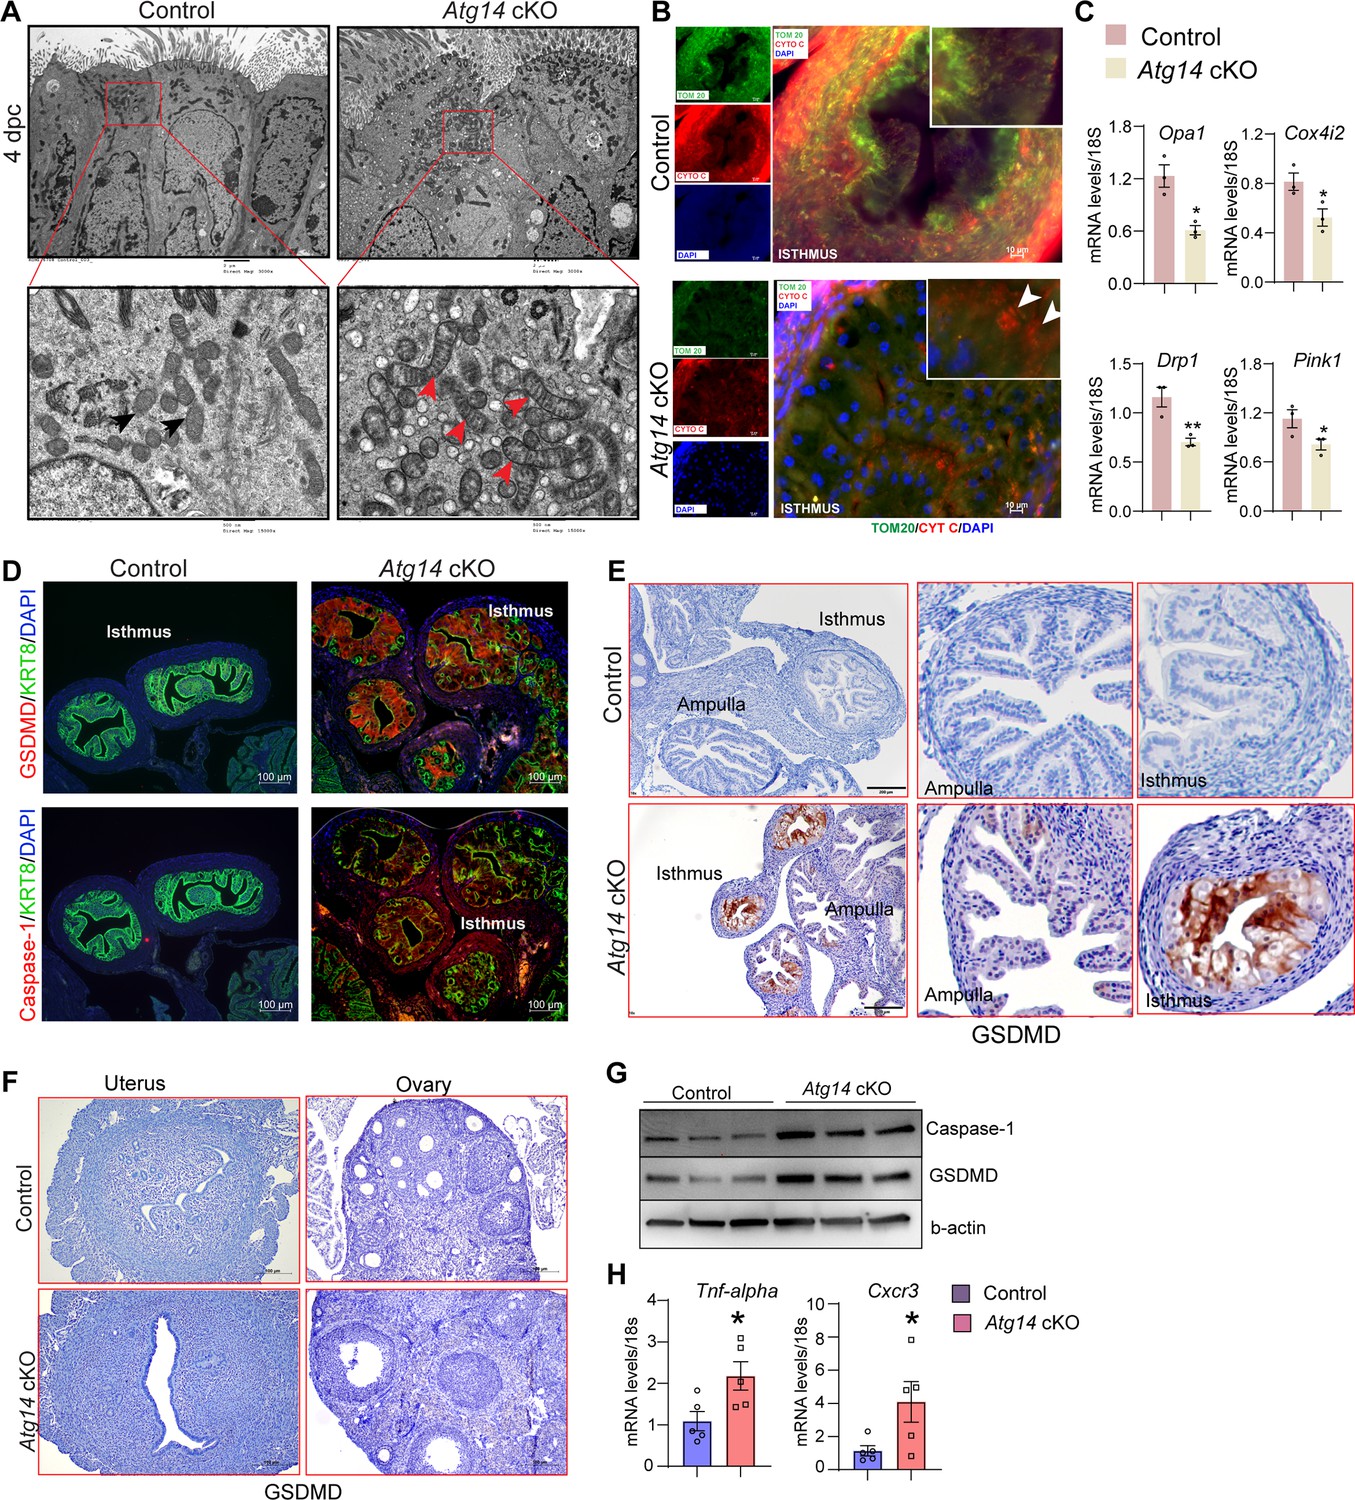
Atg14 facilitates embryo transport in the oviduct by preserving mitochondrial integrity and inhibiting the activation of pyroptosis.
(A) Transmission electron microscopy of oviducts at 4 dpc from control (n = 3) and Atg14 cKO (n = 3). Black arrowheads in control oviducts show small, compact mitochondria with tight cristae. Red arrowheads in cKO oviducts show abnormally enlarged mitochondria with loose cristae. (B) Immunofluorescence analysis of TOM20 (green) and cytochrome C (red) in Atg14 control and cKO oviducts cryo-sections. The inset shows the zoomed image of the selected area from control and cKO oviducts, Arrowheads in the cKO inset oviduct section show the leaked cytochrome C in the cytoplasm. Tissues were counterstained with DAPI (blue) to visualize nuclei; scale bars, 10 µm. (C) Relative transcript levels of Opa1, Cox4i2, Drp1, and Pink1 in oviduct tissues. Data are presented as mean ± SEM. *p<0.05; **p<0.01 compared with controls. 18S was used as an internal control. (D) Immunofluorescence analysis of GSDMD (red) + KRT8 (green), Caspase-1 (red) + KRT8 (green) in oviducts of adult control (n = 5), and Atg14 cKO mice (n = 5). Tissues were counterstained with DAPI (blue) to visualize nuclei; scale bars, 100 µm. (E) Immunohistochemical analysis of GSDMD expression in adult oviduct tissues (left panel). The middle and right panels show the zoom-in images to show the relative GSDMD expression in the ampulla and isthmus section from control and cKO oviducts. (F) Immunohistochemical analysis of GSDMD expression in adult uterus and ovary tissues. (G) Western blotting to show protein levels of Caspase-1 and GSDMD in oviduct tissues. β-actin is used as a loading control. (H) Relative transcript levels of Tnfa and Cxcr3 in oviduct tissues. Data are presented as mean ± SEM. *p<0.05; **p<0.01; ***p<0.001 compared with controls. 18S was used as an internal control.
-
Figure 5—source data 1
Original western blots for Figure 6G, indicating the relevant bands and groups.
- https://cdn.elifesciences.org/articles/97325/elife-97325-fig5-data1-v1.zip
-
Figure 5—source data 2
Uncropped labelled raw western blots.
- https://cdn.elifesciences.org/articles/97325/elife-97325-fig5-data2-v1.zip
Figure 6 with 1 supplement
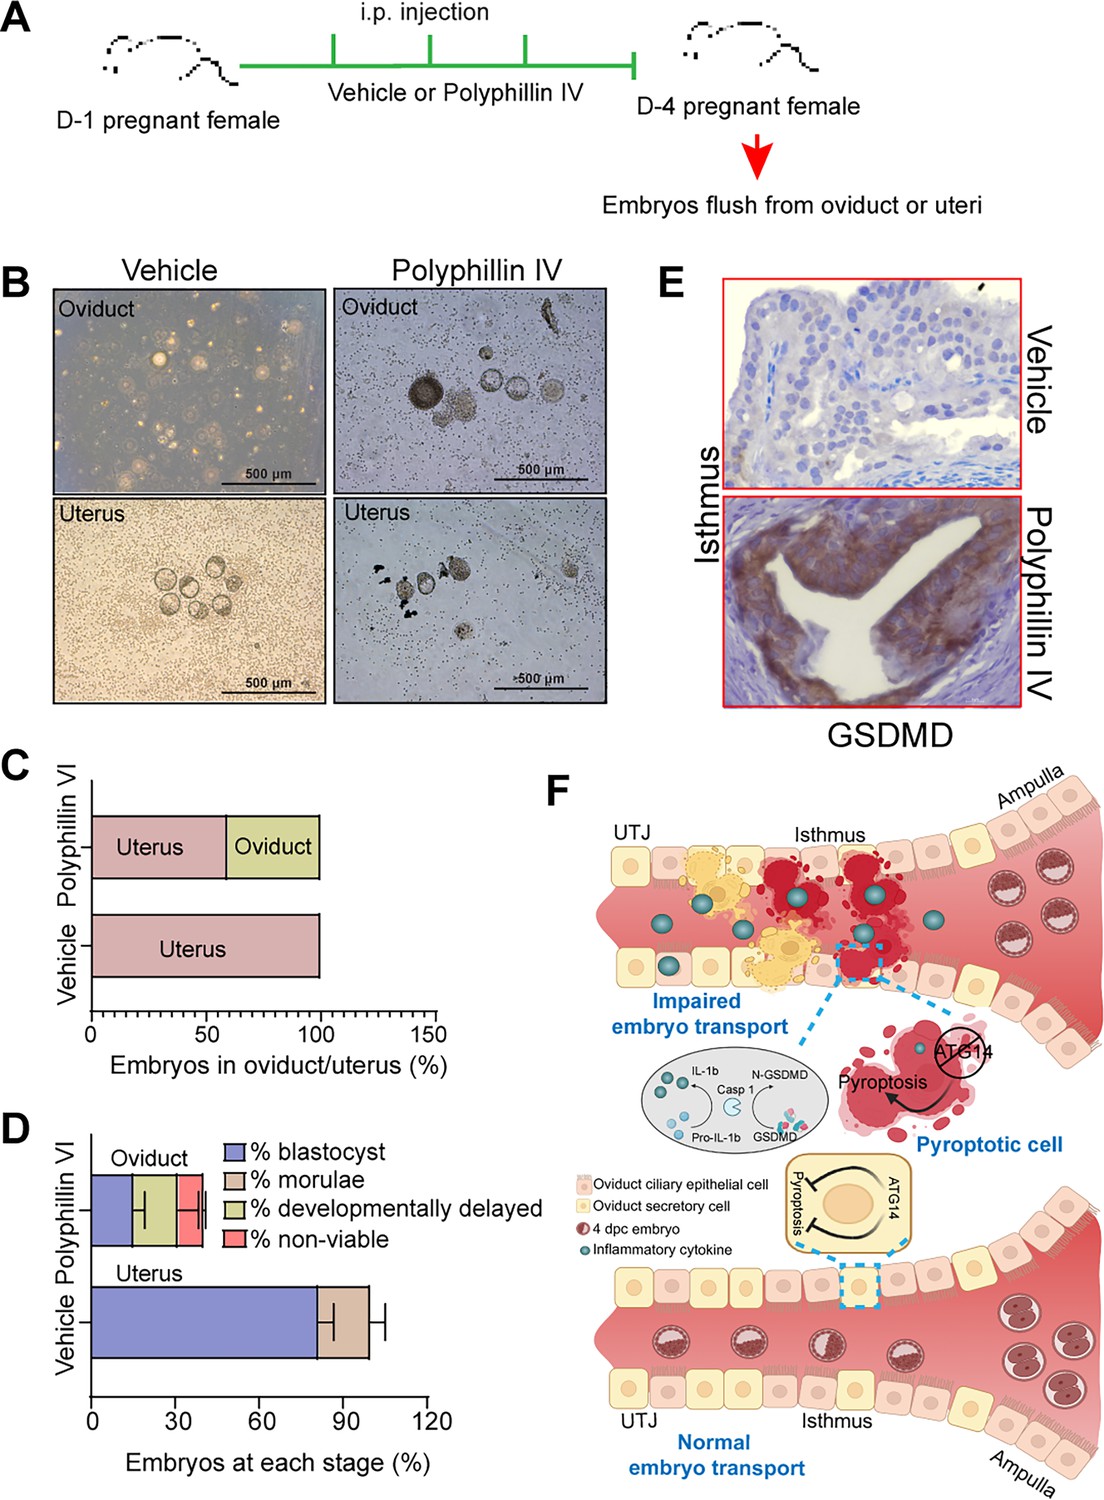
Pharmacological activation of pyroptosis in the oviduct inhibits embryo transport.
(A) Experimental strategy for pyroptosis activation in pregnant female mice. (B) Embryos flushed from the vehicle (n = 3) or polyphyllin VI-treated (n = 3) D4 pregnant females. (C) Percentage of embryos recovered from oviducts or uteri. (D) Percentage of blastocysts, morulae, developmentally delayed or nonviable embryos collected from vehicle uteri or polyphyllin IV oviducts at 4 dpc. (E) Immunohistochemistry to show GSDMD expression in the isthmus section of polyphyllin IV-treated and vehicle-treated mice. ×40 objective, Scale bar: 5 µm. (F) Graphical illustration to show embryo transport and pyroptosis regulation in the oviduct.
Figure 6—figure supplement 1
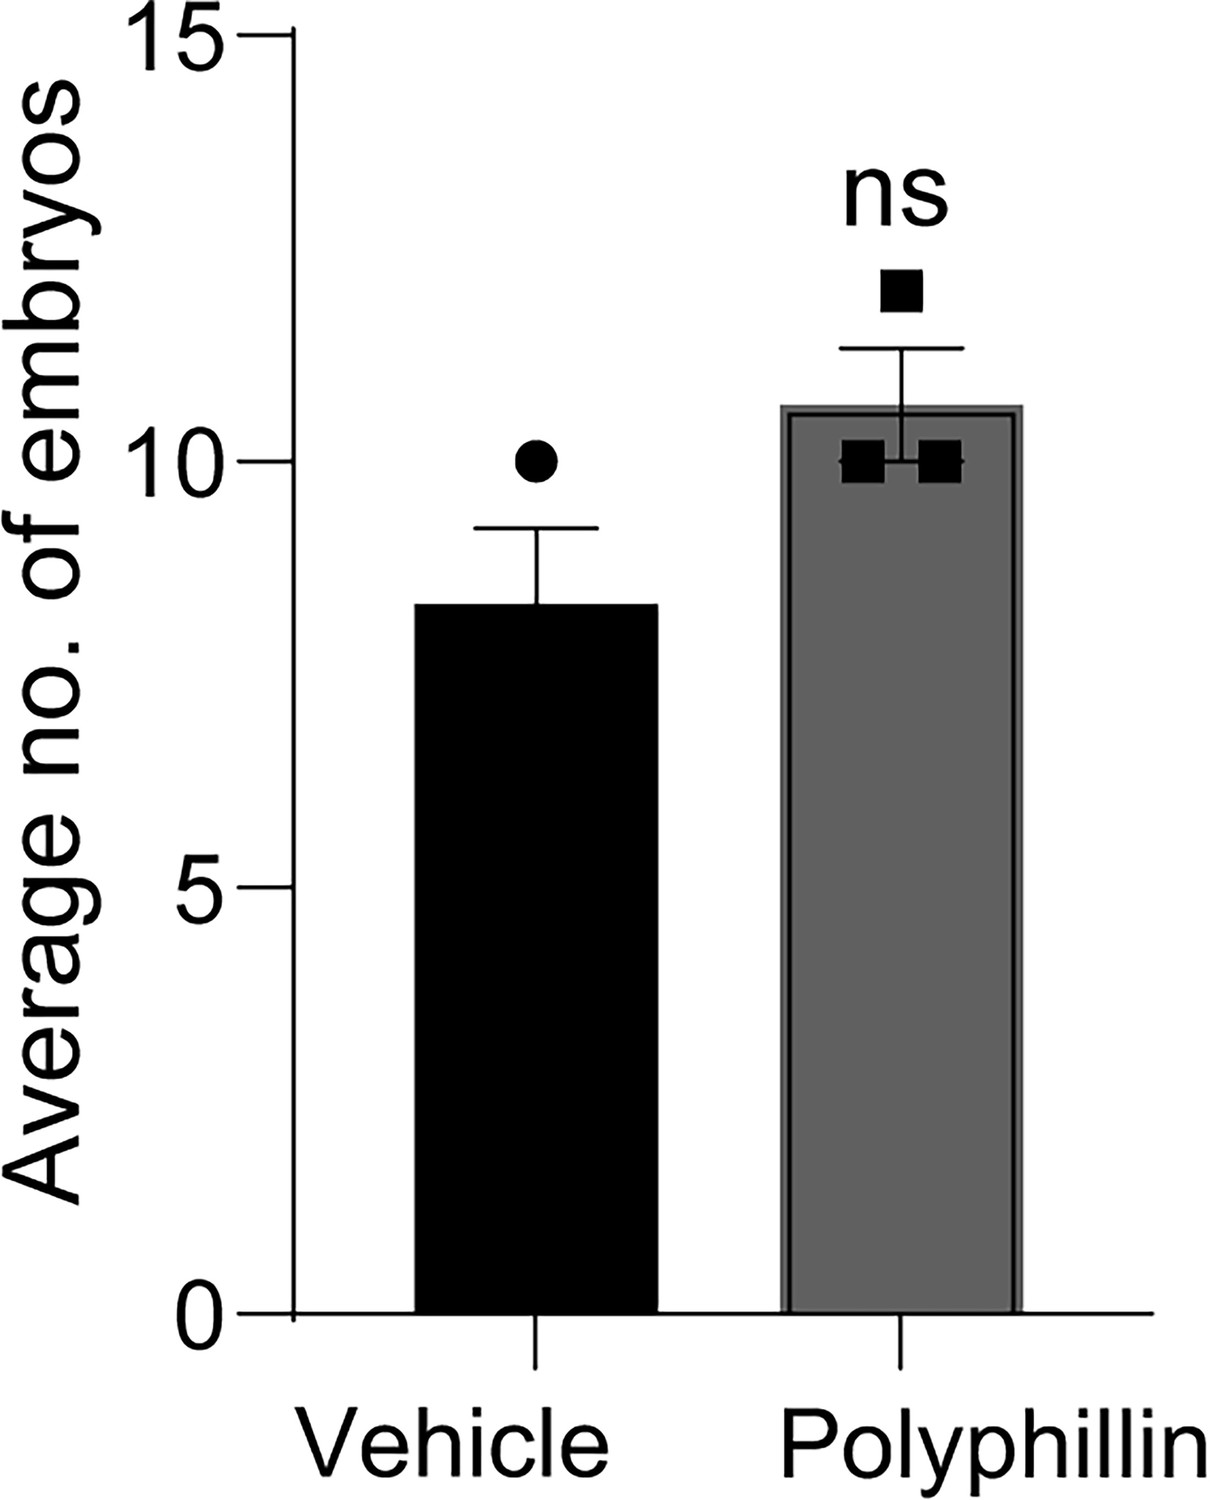
Average number of embryos are unaltered in vehicle or polyphyllin VI-treated D4 pregnant mice.
Average number of embryos retrieved from vehicle (n = 3) uteri and polyphyllin VI-treated (n = 3) D4 pregnant mice oviducts and uteri.
Tables
Table 1
Six-month breeding trial of Atg14 control and cKO females with wild-type males.
| Genotype | Females | Pups | Pups/female | Litters | Pups/litter |
|---|---|---|---|---|---|
| Control | n = 4 | 223 | 55.75 ± 7.32 | 28 | 7.96 ± 0.37 |
| Atg14 cKO | n = 6 | 0 | 0 | 0 | 0 |
Table 2
Six-month breeding trial of Foxj1/Atg14 control and cKO females with wild-type males.
| Genotype | Females | Pups | Pups/female | Litters | Pups/litter |
|---|---|---|---|---|---|
| Control | n = 5 | 192 | 38.4 ± 1.29 | 26 | 9.1 ± 1.29 |
| Foxj1/Atg14 cKO | n = 5 | 151 | 30.2 ± 1.46 | 24 | 7.6 ± 1.46 |
Additional files
-
MDAR checklist
- https://cdn.elifesciences.org/articles/97325/elife-97325-mdarchecklist1-v1.docx
-
Supplementary file 1
List of primers and TaqMan probes.
- https://cdn.elifesciences.org/articles/97325/elife-97325-supp1-v1.docx
-
Supplementary file 2
List of antibodies.
- https://cdn.elifesciences.org/articles/97325/elife-97325-supp2-v1.docx
Download links
A two-part list of links to download the article, or parts of the article, in various formats.
Downloads (link to download the article as PDF)
Open citations (links to open the citations from this article in various online reference manager services)
Cite this article (links to download the citations from this article in formats compatible with various reference manager tools)
The autophagy protein ATG14 safeguards against unscheduled pyroptosis activation to enable embryo transport during early pregnancy
eLife 13:RP97325.
https://doi.org/10.7554/eLife.97325.4


