Human immunodeficiency virus-1 induces host genomic R-loops and preferentially integrates its genome near the R-loop regions
- Center for RNA Research, Institute for Basic Science, Republic of Korea
- School of Biological Sciences, Seoul National University, Republic of Korea
- Bioinformatics Institute, Seoul National University, Republic of Korea
- BK21 FOUR Intelligence Computing, Seoul National University, Republic of Korea
- Department of Computer Science and Engineering, Seoul National University, Republic of Korea
- SNU Institute for Virus Research, Seoul National University, Republic of Korea
Figures
Figure 1 with 6 supplements

HIV-1 infection induces genomic R-loop accumulation in cells at early post-infection.
(A) Summary of experimental design for DNA-RNA immunoprecipitation followed by cDNA conversion coupled with high-throughput sequencing (DRIPc-seq) in HeLa cells, primary CD4+ T cells, and Jurkat cells infected with HIV-1. (B) Bar graphs indicating DRIPc-seq peak counts for HIV-1-infected HeLa cells, primary CD4+ T cells, and Jurkat cells harvested at the indicated hours post-infection (hpi). Pre-immunoprecipitated samples were untreated (−) or treated (+) with RNase H, as indicated. Each bar corresponds to pooled datasets from two biologically independent experiments. (C) All genomic loci overlapping a DRIPc-seq peak from HIV-1 infected HeLa cells, primary CD4+ T cells, and Jurkat cells in at least one sample are stacked vertically; the position of each peak in a stack is constant horizontally across samples. Each hpi occupies a vertical bar, as indicated. Each bar corresponds to pooled datasets from two biologically independent experiments. Common peaks for all samples are represented in black, and in dark gray for those common for at least two samples. The lack of a DRIP signal over a given peak in any sample is shown in light gray. The sample-unique peaks are colored blue, yellow, green, and red at 0, 3, 6, and 12 hpi, respectively. (D) Dot blot analysis of the R-loop in gDNA extracts from HIV-1 infected HeLa cells with multiplicity of infection (MOI) of 0.6 harvested at the indicated hpi. gDNAs were probed with anti-S9.6. gDNA extracts were incubated with or without RNase H in vitro before membrane loading (anti-RNA/DNA signal). Fold-induction was normalized to the value of harvested cells at 0 hpi by quantifying the dot intensity of the blots and calculating the ratios of the S9.6 signal to the total amount of gDNA (anti-ssDNA signal). (E) Representative images of the immunofluorescence assay of S9.6 nuclear signals in HIV-1 infected HeLa cells with MOI of 0.6 harvested at 6 hpi. The cells were pre-extracted from cytoplasm and co-stained with anti-S9.6 (red), anti-nucleolin antibodies (green), and DAPI (blue). The cells were incubated with or without RNase H in vitro before staining with anti-S9.6 antibodies, as indicated. Quantification of S9.6 signal intensity per nucleus after nucleolar signal subtraction for the immunofluorescence assay. The mean value for each data point is indicated by the red line. Statistical significance was assessed using one-way ANOVA (n >53).
-
Figure 1—source data 1
Original dot blots for Figure 1D, indicate the relevant dots and treatments.
- https://cdn.elifesciences.org/articles/97348/elife-97348-fig1-data1-v1.zip
-
Figure 1—source data 2
Original files for dot blot analysis are displayed in Figure 1D.
- https://cdn.elifesciences.org/articles/97348/elife-97348-fig1-data2-v1.zip
Figure 1—figure supplement 1
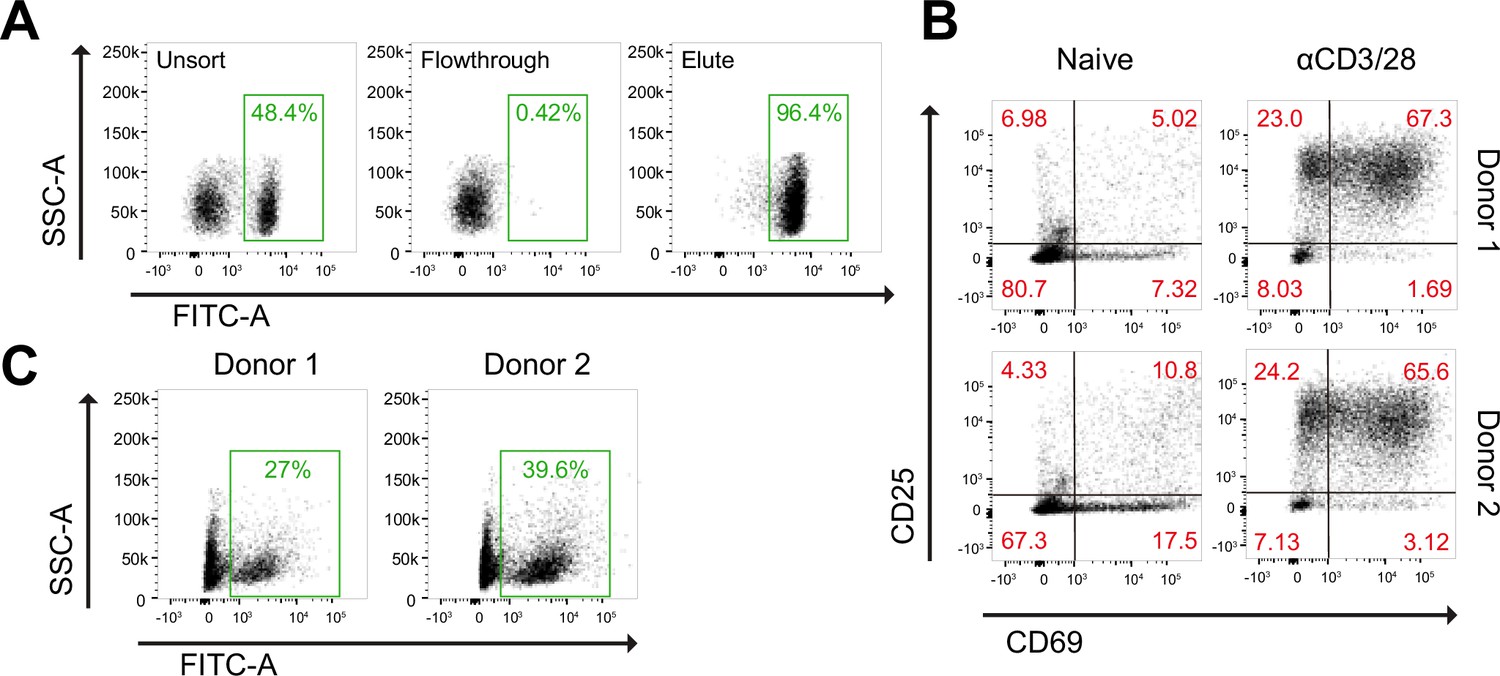
Primary CD4+ T cells sorting strategies and GFP-HIV-1 infection.
(A) Gating strategy used to determine the efficiency of CD4+ T cells sorting from human PBMC. Pre-sorted PBMCs were staining with FITC-conjugated anti-CD4 and subjected fto positive CD4+ T cell sorting. The percentages of FITC stained cell population at each step of cell sorting are as indicated. (B) Gating strategy was used to determine non-activated (Naïve) and activated cells (αCD3/28) with two markers, CD25 (FITC) and CD69 (APC), for each donor (upper panels, Donor 1; lower panels, Donor 2). (C) Gating strategy used to determine HIV-1-infectivity of CD4+ T cells from each donor infected with GFP reporter HIV-1 virus at 48 hpi. The percentages of GFP positive cell population at are as indicated.
Figure 1—figure supplement 2
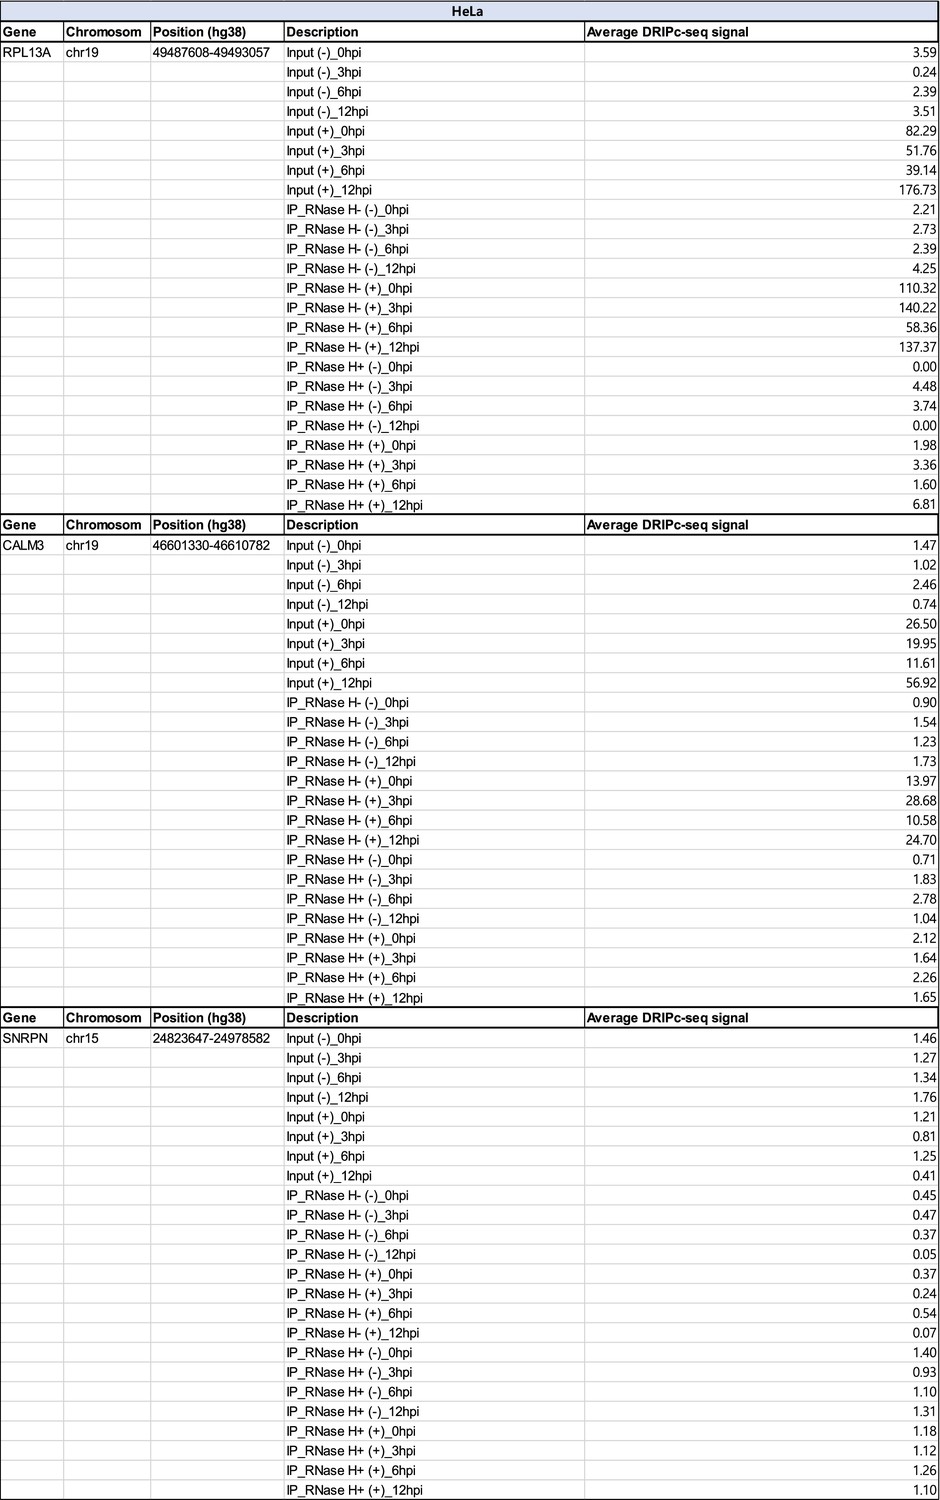
Chromosomal position and DNA-RNA immunoprecipitation followed by cDNA conversion coupled with high-throughput sequencing (DRIPc-seq) signal for referenced R-loop-positive and –negative regions in HIV-1 infected HeLa cells.
-
Figure 1—figure supplement 2—source data 1
- https://cdn.elifesciences.org/articles/97348/elife-97348-fig1-figsupp2-data1-v1.xlsx
Figure 1—figure supplement 3
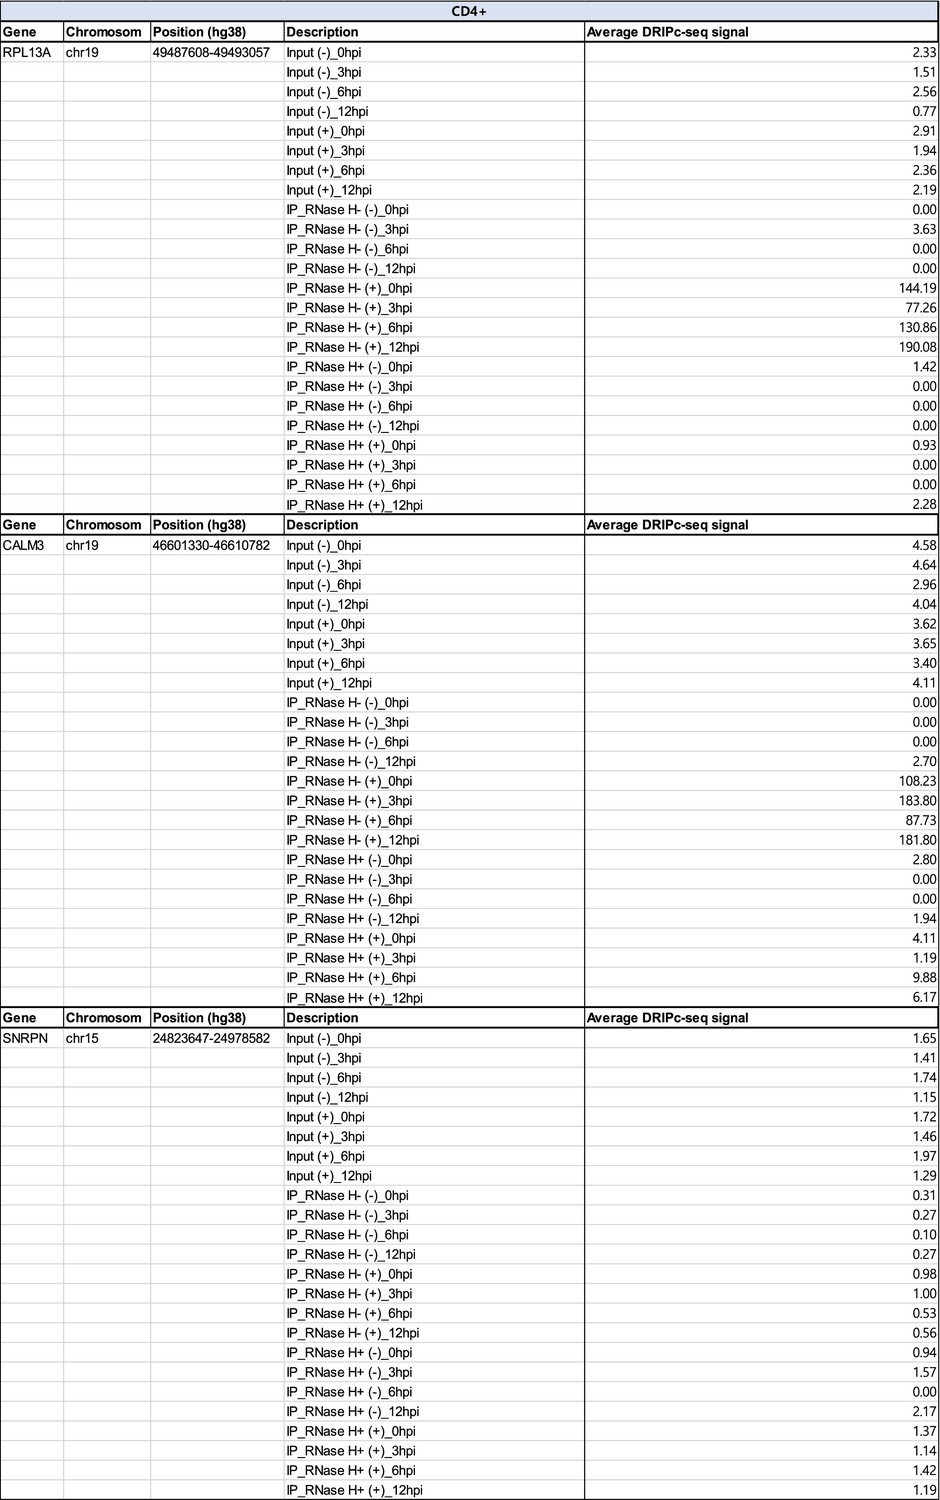
Chromosomal position and DNA-RNA immunoprecipitation followed by cDNA conversion coupled with high-throughput sequencing (DRIPc-seq) signal for referenced R-loop-positive and –negative regions in HIV-1 infected primary CD4+ T cells.
-
Figure 1—figure supplement 3—source data 1
- https://cdn.elifesciences.org/articles/97348/elife-97348-fig1-figsupp3-data1-v1.xlsx
Figure 1—figure supplement 4
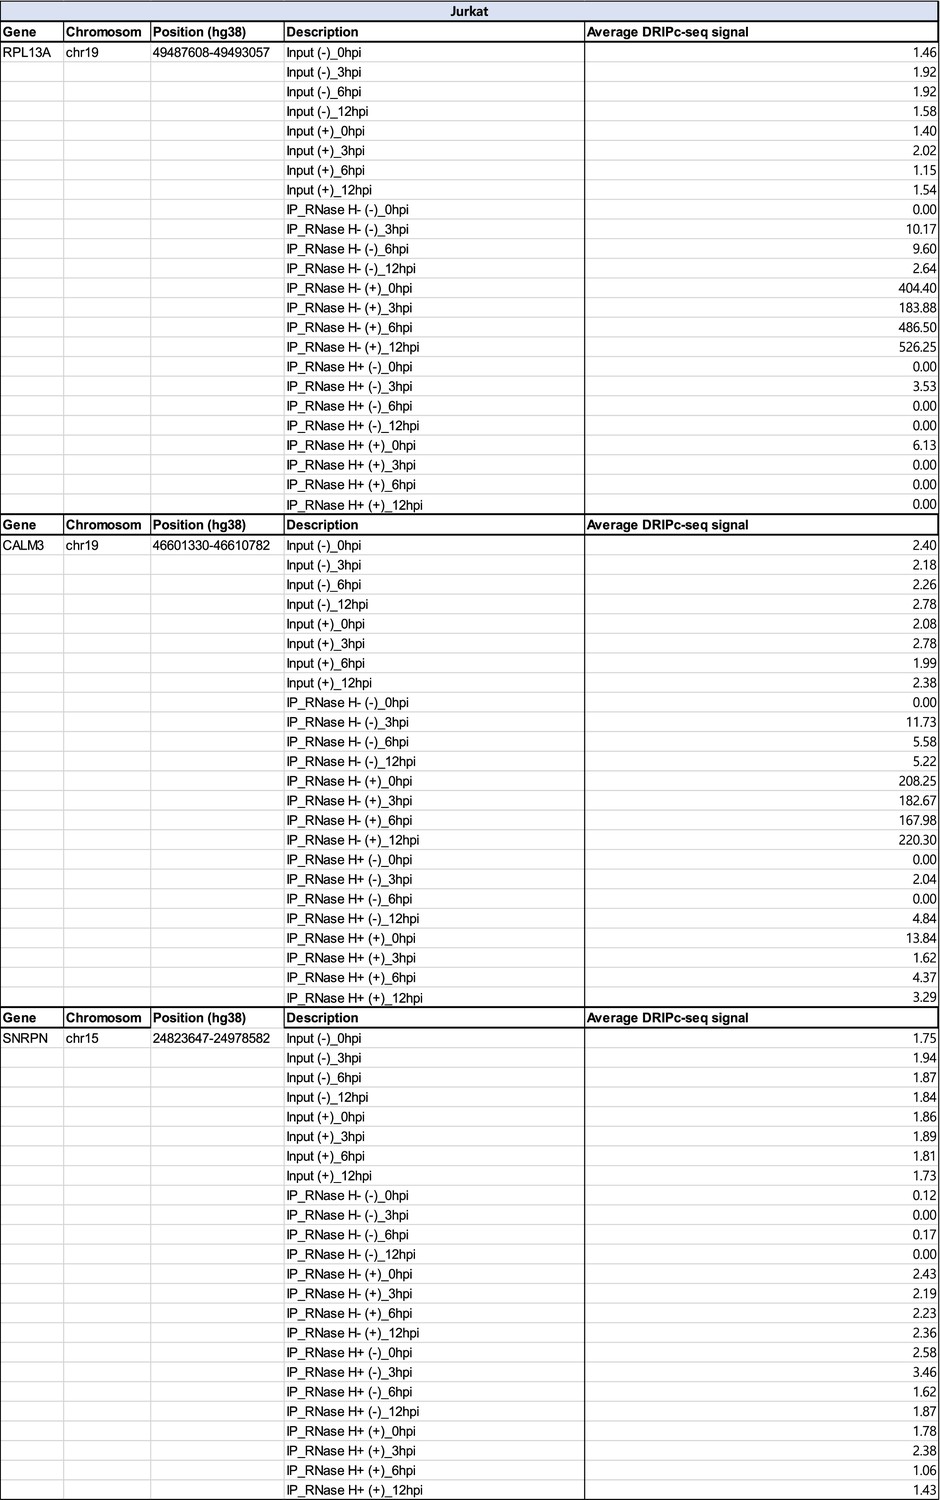
Chromosomal position and DNA-RNA immunoprecipitation followed by cDNA conversion coupled with high-throughput sequencing (DRIPc-seq) signal for referenced R-loop-positive and –negative regions in HIV-1 infected Jurkat cells.
-
Figure 1—figure supplement 4—source data 1
- https://cdn.elifesciences.org/articles/97348/elife-97348-fig1-figsupp4-data1-v1.xlsx
Figure 1—figure supplement 5
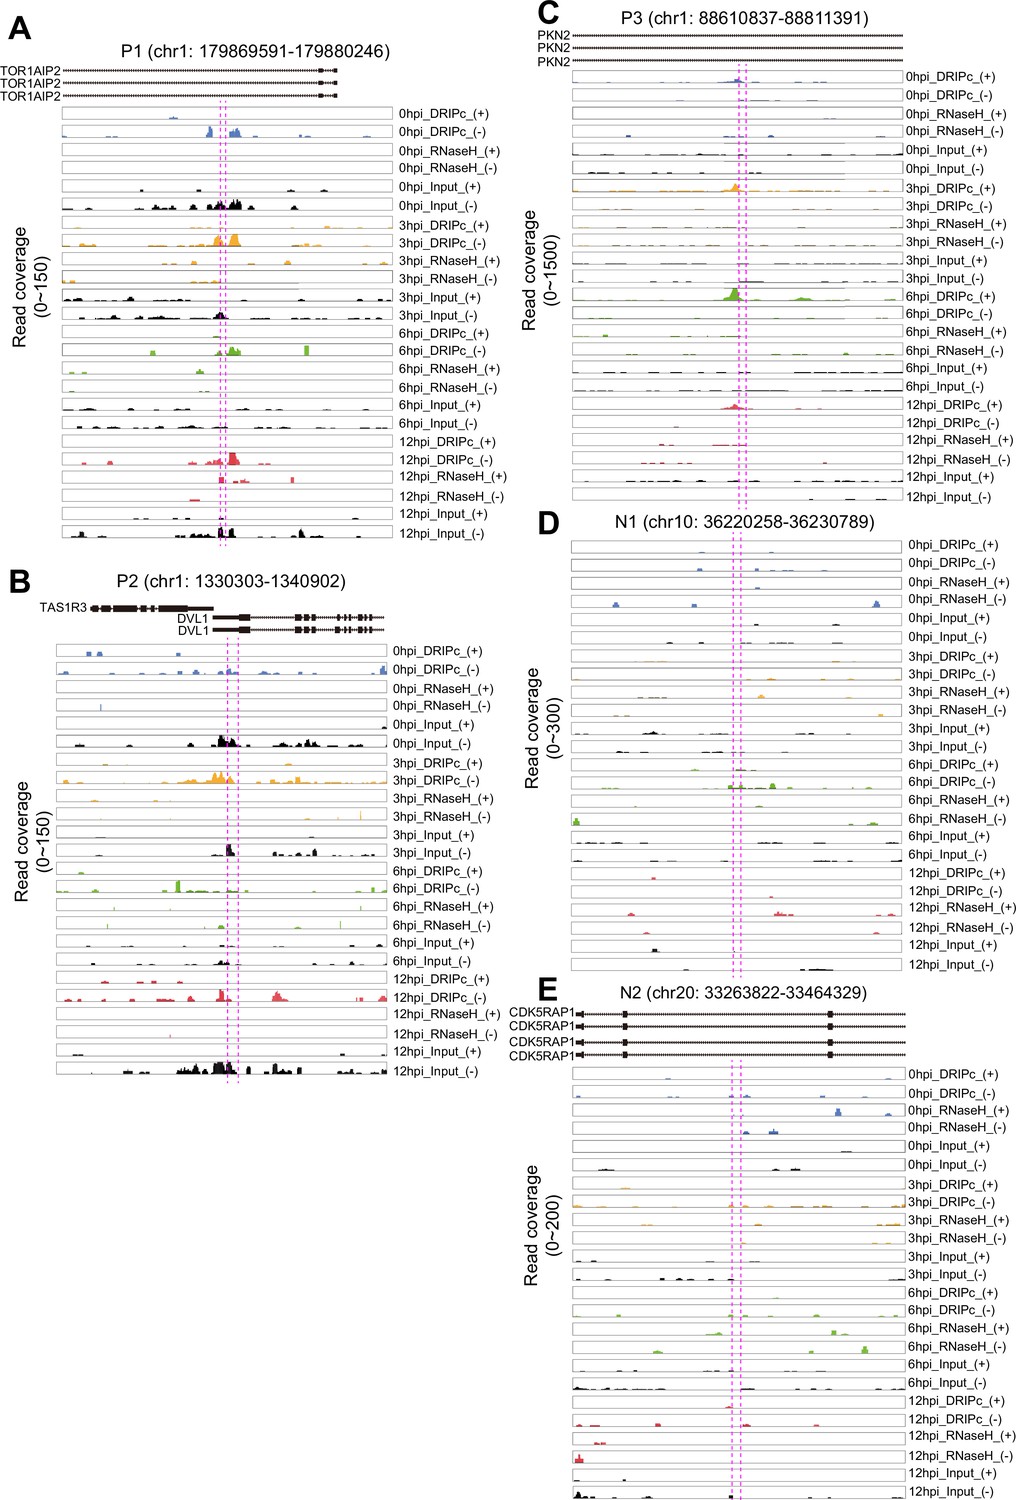
Genome browser screenshot over the HIV-1-induced R-loop forming positive or negative genomic regions.
(A–C), Genome browser screenshot over the P1 (A), P2 (B), and P3 (C) HIV-1 induced R-loop-positive chromosomal regions showing results from DNA-RNA immunoprecipitation followed by cDNA conversion coupled with high-throughput sequencing (DRIPc-seq) in HIV-1-infected HeLa cells blue, 0 hpi; yellow, 3 hpi; green, 6 hpi; red, 12 hpi; black, input signals for each indicated sample on plus (+) or minus (-) DNA strand. Magenta dotted lines represent primer binding sites in qPCR following DRIP. (D and E), Genome browser screenshot over the N1 (D), and N2 (E) HIV-1 induced R-loop-negative chromosomal regions showing results from DRIPc-seq in HIV-1-infected HeLa cells (blue, 0 hpi; yellow, 3 hpi; green, 6 hpi; red, 12 hpi; black, input signals for each indicated sample) on plus (+) or minus (-) DNA strand. Magenta dotted lines represent primer binding sites in qPCR following DRIP.
Figure 1—figure supplement 6
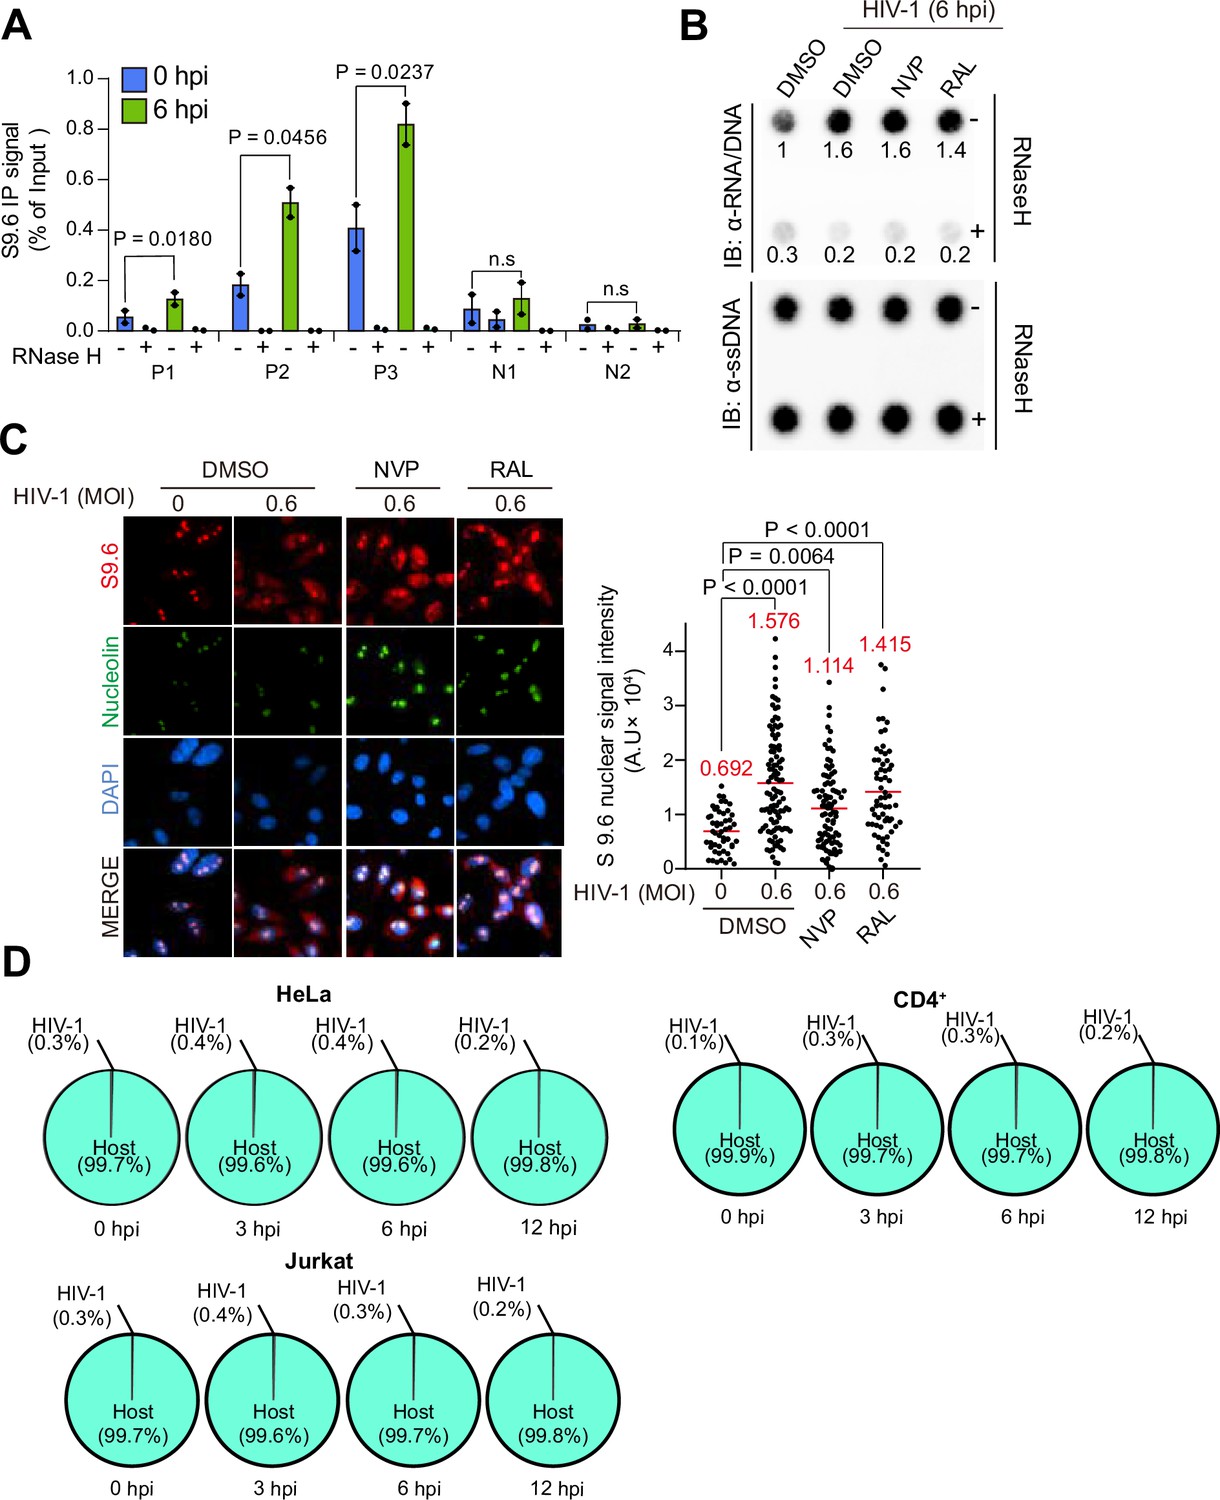
Host cellular R-loop induction by HIV-1 infection is host-genome specific.
(A) DRIP followed by real-time polymerase chain reaction (DRIP-qPCR) using the anti-S 9.6 antibody at P1, P2, P3, N1, and N2 in HIV-1-infected cells with multiplicity of infection (MOI) of 0.6 harvested at the indicated hpi (blue, 0 hpi; green, 6 hpi). Pre-immunoprecipitated materials were untreated (−) or treated (+) with RNase H, as indicated. Data are presented as the mean ± SEM; p-values were calculated using one-way ANOVA (n=2). (B) Dot blot analysis of the R-loop in gDNA extracts from HIV-1 infected HeLa cells with MOI of 0.6 harvested at 6hpi. The cells were treated with DMSO, 10uM of Nevirapine (NVP), or 10uM of Raltegravir (RAL) for 24 hr before infection, as indicated. gDNAs were probed with anti-S9.6. gDNA extracts were incubated with or without RNase H in vitro before membrane loading (anti-RNA/DNA signal). Fold-induction was normalized to the value of harvested cells at 0 hpi by quantifying the dot intensity of the blots and calculating the ratios of the S9.6 signal to the total amount of gDNA (anti-ssDNA signal). (C) Representative images of the immunofluorescence assay of S9.6 nuclear signals in HIV-1 infected HeLa cells with MOI of 0.6 at 6 hpi. The cells were pre-extracted from cytoplasm and co-stained with anti-S9.6 (red), anti-nucleolin antibodies (green), and DAPI (blue). The cells were treated with DMSO, 10uM of Nevirapine (NVP), or 10uM of Raltegravir (RAL) for 24 hr before infection, as indicated. Quantification of S9.6 signal intensity per nucleus after nucleolar signal subtraction for the immunofluorescence assay. The mean value for each data point is indicated by the red line. Statistical significance was assessed using one-way ANOVA (n >51). (D) Pie graphs indicating the percentage of DNA-RNA immunoprecipitation followed by cDNA conversion coupled with high-throughput sequencing (DRIPc-seq) reads aligned to the host cellular genome (aquamarine) or to HIV-1 viral genome (gray), out of the total consensus DRIPc-seq peaks from HIV-infected HeLa cells, primary CD4+ T cells, and Jurkat cells.
-
Figure 1—figure supplement 6—source data 1
Original dot blots for Figure 1—figure supplement 6B, indicating the relevant dots and treatments.
- https://cdn.elifesciences.org/articles/97348/elife-97348-fig1-figsupp6-data1-v1.zip
-
Figure 1—figure supplement 6—source data 2
Original files for dot blot analysis are displayed in Figure 1—figure supplement 6B.
- https://cdn.elifesciences.org/articles/97348/elife-97348-fig1-figsupp6-data2-v1.zip
Figure 2 with 2 supplements

HIV-1-induced R-loops are enriched at both transcriptionally active and silent regions.
(A) Distribution of DNA-RNA immunoprecipitation followed by cDNA conversion coupled with high-throughput sequencing (DRIPc-seq) peak lengths for HIV-1-infected HeLa cells, primary CD4+ T cells, and Jurkat cells harvested at the indicated time points (blue, 0 hpi; yellow, 3 hpi; green, 6 hpi; red, 12 hpi). (B) Stacked bar graphs indicating the proportion of DRIPc-seq peaks mapped for HIV-1-infected HeLa cells, primary CD4+ T cells, and Jurkat cells harvested at the indicated hpi over different genomic features. (C) Stacked bar graphs indicating the proportion of DRIPc-seq peaks mapped to indicated genomic compartments for HIV-1-infected HeLa cells, primary CD4+ T cells and Jurkat cells harvested at the 0, 3, 6, and 12 hpi. (D) Correlation between gene expression and DRIPc-seq signals of HIV-1-infected HeLa cells with multiplicity of infection (MOI) of 0.6 harvested at the indicated hpi. Statistical significance was assessed using Pearson’s r and p-values.
Figure 2—figure supplement 1
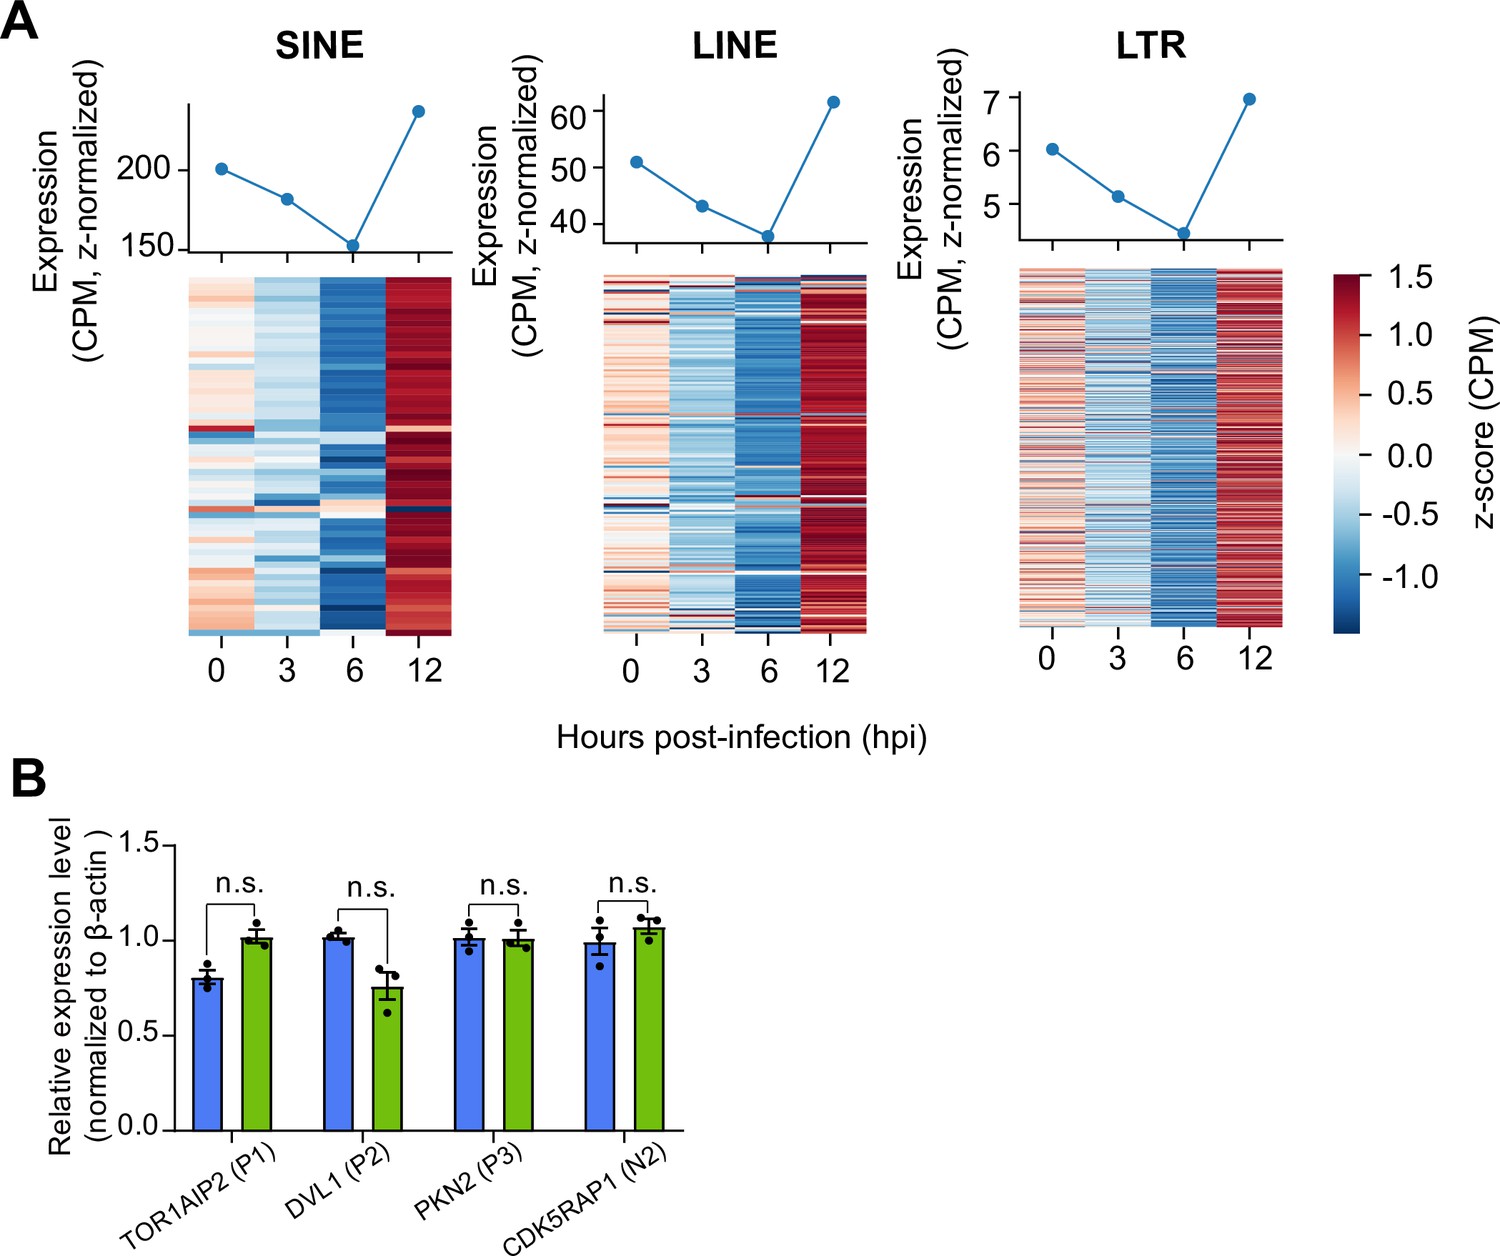
R-loop induction by HIV-1 infection does not follow transcriptome changes in HeLa cells.
(A) Line graphs and heat maps representing expression levels of indicated repetitive elements (SINE, right; LINE, middle; LTR, left) at the indicated hpi of HIV-1 in HeLa cells. Data are presented as the mean expression levels of two biologically independent experiments. (B) Indicated gene expression as measured by RT-qPCR in 0 or 6 hpi harvested HIV-1-infected HeLa cells. Data represent mean ± SEM, n=3, p-values were calculated according to a two-tailed Student’s t-test. p>0.05; n.s, not significant.
Figure 2—figure supplement 2
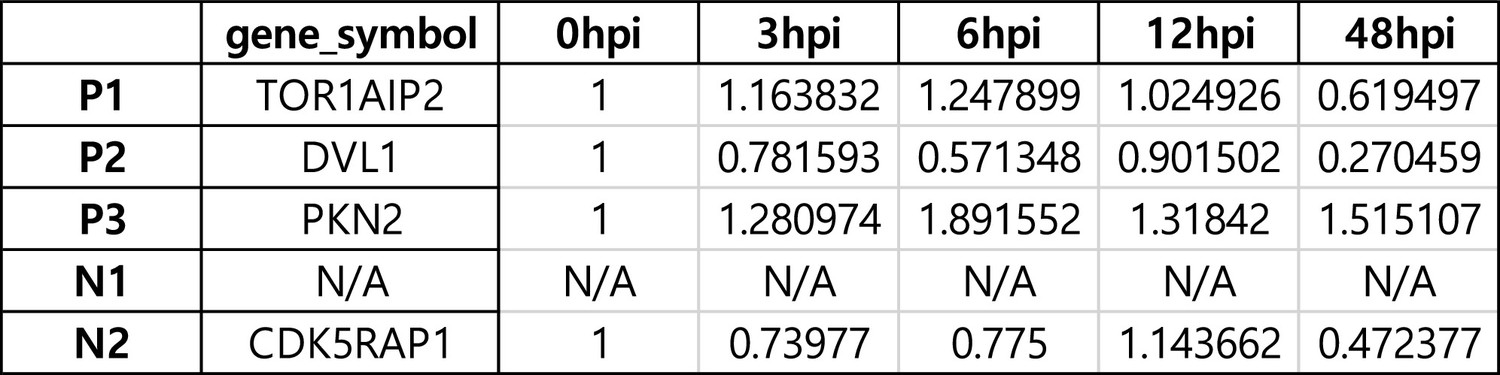
RNA-seq analysis of relative gene expression levels of P1-3 and N1,2 R-loop regions.
-
Figure 2—figure supplement 2—source data 1
- https://cdn.elifesciences.org/articles/97348/elife-97348-fig2-figsupp2-data1-v1.xlsx
Figure 3 with 1 supplement

R-loop inducible cell line model directly addresses R-loop-mediated HIV-1 integration site selection.
(A) Summary of the experimental design for R-loop inducible cell lines, pgR-poor and pgR-rich. (B) Gene expression of ECFP (gray) and mAIRN (red), as measured using RT-qPCR in pgR-poor or pgR-rich cells. Where indicated, the cells were incubated with 1 µg/ml DOX for 24 hr. Gene expression was normalized relative to β-actin. Data are presented as the mean ± SEM, n=3. (C) DRIP-qPCR using the anti-S9.6 antibody against ECFP and mAIRN in pgR-poor or pgR-rich cells. Where indicated, the cells were incubated with 1 µg/ml DOX for 24 hr. Pre-immunoprecipitated samples were untreated or treated with RNase H as indicated. Values are relative to those of DOX-treated (+) RNase H-untreated (−) pgR-poor cells. Data are presented as the mean ± SEM; statistical significance was assessed using two-way ANOVA (n = 2). (D) Bar graphs indicate luciferase activity at 48 hpi in pgR-poor or prR-rich cells infected with 100 ng/p24 capsid antigen of luciferase reporter HIV-1 virus per 1×10⁵ cells/mL. Data are presented as the mean ± SEM; p-values were calculated using one-way ANOVA (n=6). (E) Box graph indicating the quantified HIV-1 integration site sequencing read count across pgR-poor and pgR-rich transposon sequences in untreated (–) or DOX-treated (+) pgR-poor or pgR-rich cell line infected with 100 ng/p24 capsid antigen of luciferase reporter HIV-1 virus per 1×10⁵ cells/mL. Each bar corresponds to pooled datasets from three biologically independent experiments (n=3). In each boxplot, the centerline denotes the median, the upper and lower box limits denote the upper and lower quartiles, and the whiskers denote the 1.5x interquartile range. Statistical significance was assessed using a two-sided Mann–Whitney U test. (F and G) Heat maps representing the number of HIV-1 integration-seq mapped read across pgR-poor (F) or pgR-rich (G) transposon sequence in untreated (-) or DOX-treated (+) pgR-poor (F) or pgR-rich (G) cell line. Each rectangular box corresponds to the pooled the number of HIV-1 integration-seq mapped read from three biologically independent experiments (n=3) at the indicated position within pgR-poor (F) or pgR-rich (G) transposon vector. Each light blue box represents the actual position of the R-loop forming or non-R-loop forming sequence (ECFP or mAIRN) and the yellow stars indicate the TRE promoter position within a vector.
Figure 3—figure supplement 1
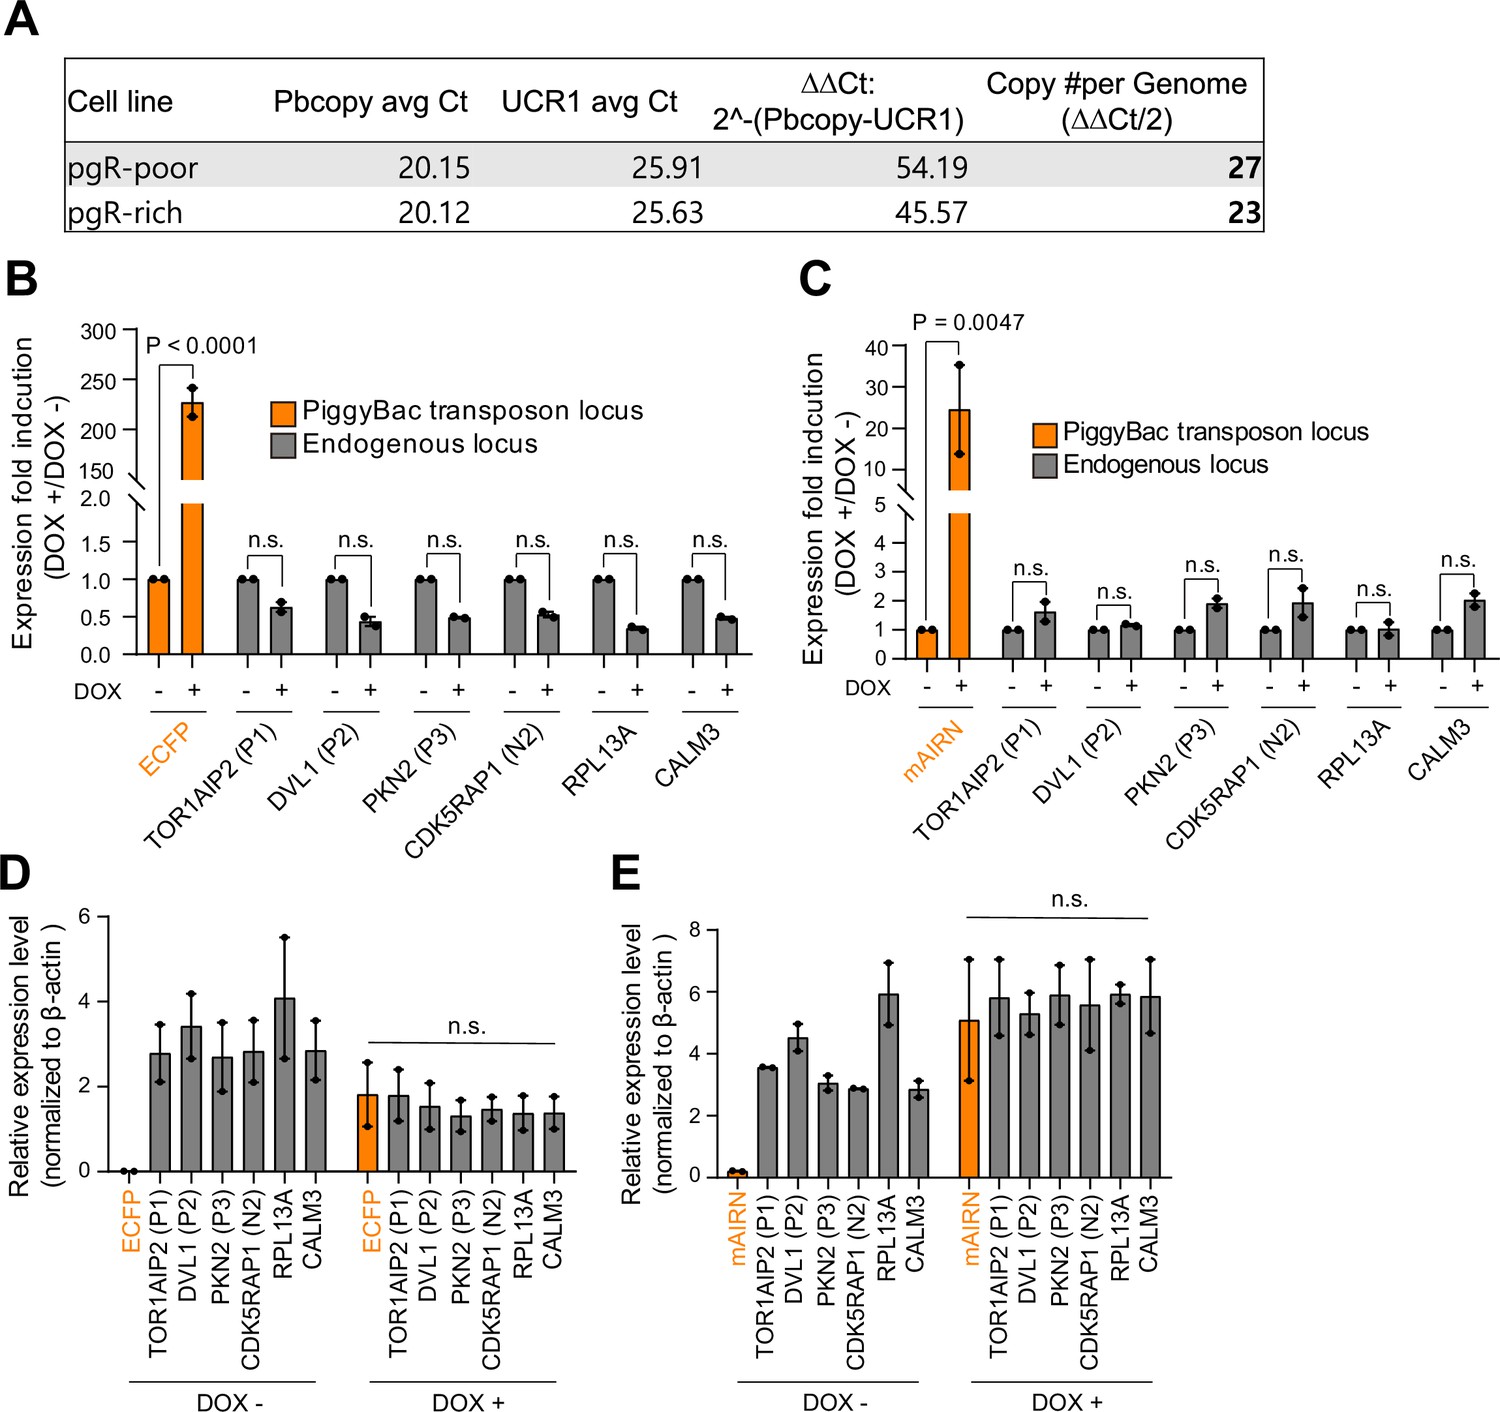
PiggyBac transposon-transposase insertion of R-loop forming and non-R-loop forming sequences in HeLa cells.
(A) Copy the number of piggyBac transposon inserts in each cell line constructed by transfecting the transposon vector and transposase-expressing vector. (B and C) Fold induction of gene expression for the indicated genes as measured by RT-qPCR. Fold induction was calculated by dividing the gene expression level of DOX-treated (+) by that of DOX-untreated (-) in pgR-poor cells (B) or pgR-rich cells (C). Data represent mean ± SEM, n=2, and p-values were calculated according to two-way ANOVA. p>0.05; n.s, not significant. (D and E) Relative gene expression of the indicated genes as measured by RT-qPCR in DOX-treated (+) or DOX-untreated (-) pgR-poor cells (D) or pgR-rich cells (E). Data represent mean ± SEM, n=2, and p- values were calculated according to two-way ANOVA. p>0.05; n.s, not significant.
Figure 4

HIV-1 prefers host genomic R-loop regions for its viral cDNA integration.
(A) Bar graphs showing the quantified number of HIV-1 integration sites per Mb pairs in total regions of 30 kb windows centered on DNA-RNA immunoprecipitation followed by cDNA conversion coupled with high-throughput sequencing (DRIPc-seq) peaks from HIV-1 infected HeLa cells, primary CD4+ T cells, and Jurkat cells (magenta) or non-R-loop region in the cellular genome (gray). (B) Proportion of integration sites within the 30-kb windows centered on DRIPc-seq peaks (magenta solid lines) or randomized DRIPc-seq peaks (gray dotted lines). Control comparisons between randomized integration sites with DRIPc-seq peaks and randomized DRIPc-seq peaks are indicated by black dotted lines and gray solid lines, respectively. (C and D) Superimpositions of HIV-1-induced R-loop positive chromatin regions, P1-P3 (C), and HIV-1-induced R-loop negative chromatin regions, N1 and N2 (D), on DRIPc-seq (blue, 0 hpi; yellow, 3 hpi; green, 6 hpi; red, 12 hpi) and the number of mapped read of HIV-1 integration-seq (integration, black). Magenta dotted lines represent primer binding sites in qPCR following DRIP.
Figure 5 with 1 supplement

HIV-1 integrase proteins directly bind to host genomic R-loops.
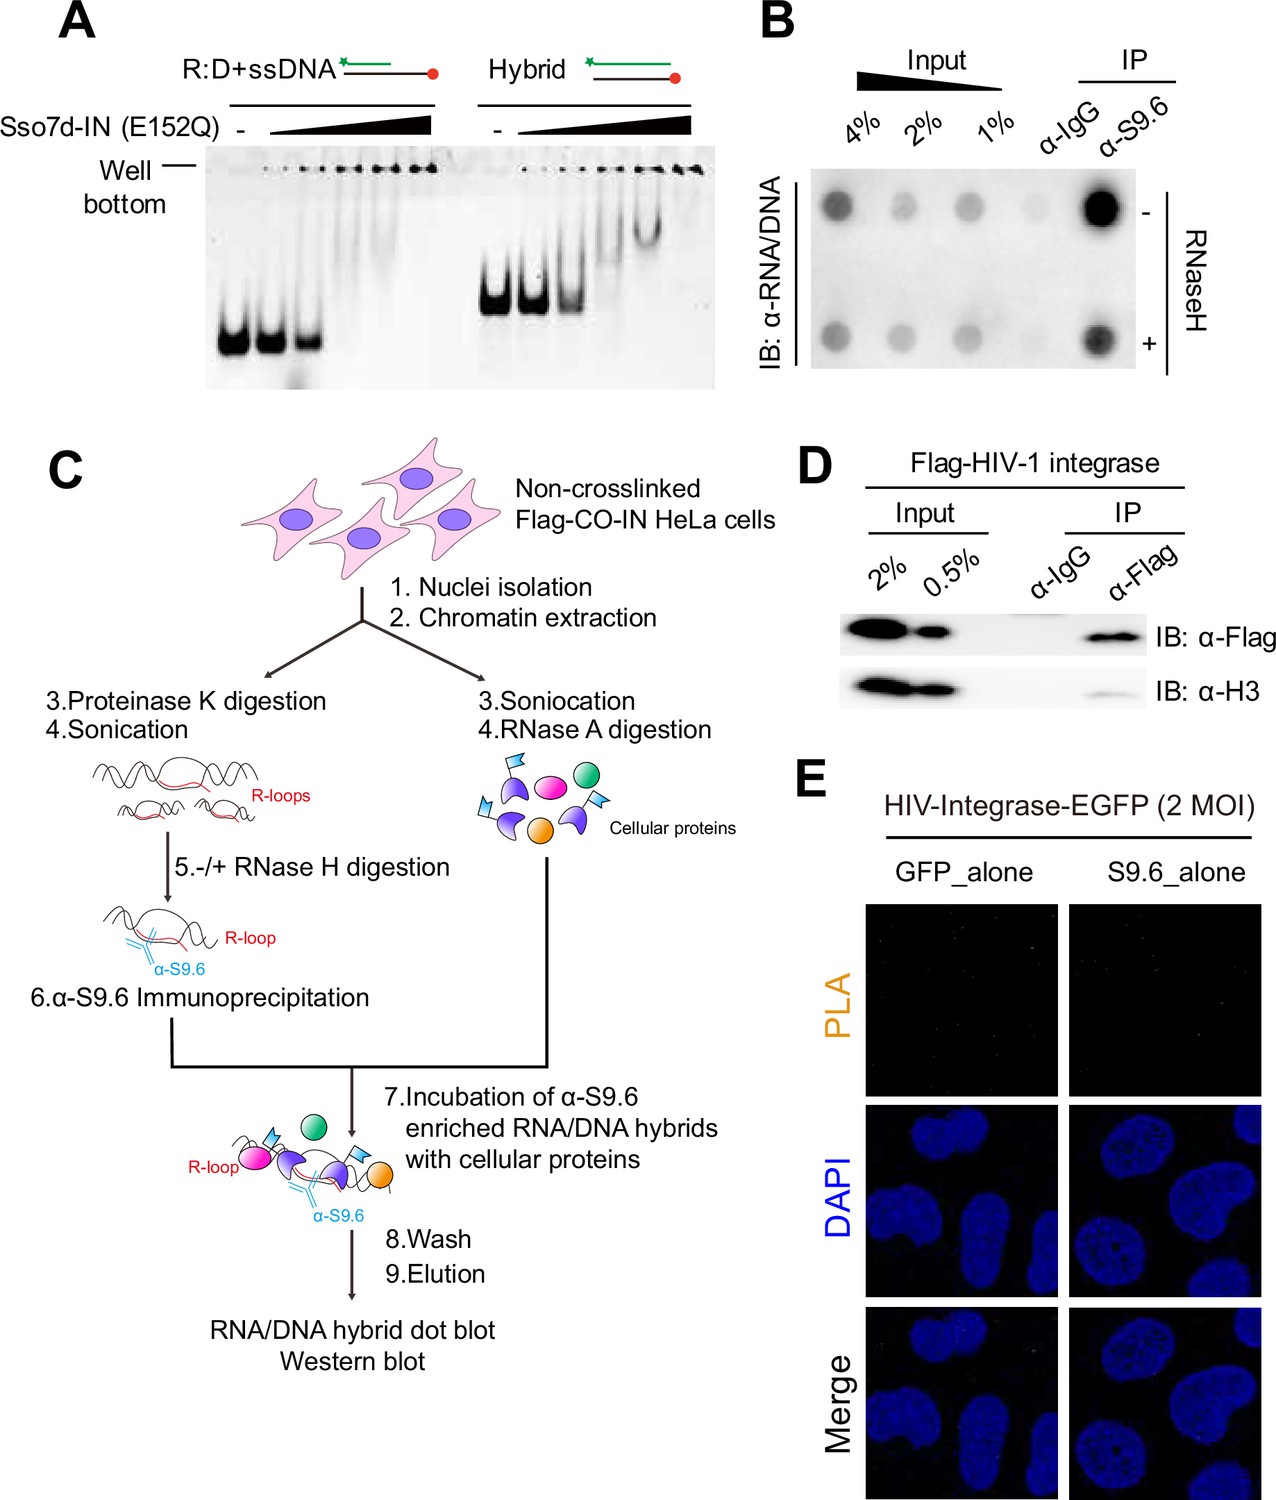
(A) Representative gel images for electrophoretic mobility shift assay (EMSA) of Sso7d-tagged HIV-1-integrase (E152Q) with R-loop and dsDNA, 10 nM nucleic acid substrate was incubated with Sso7d-tagged HIV-1-integrase (E152Q) at 0 nM, 20 nM, 50 nM, 100 nM, 200 nM, and 400 nM (left). Unbound fractions were quantified for EMSA of Sso7d-tagged HIV-1-integrase (E152Q) with different types of substrates (R-loop, dsDNA, R-loop, R:D+ssDNA and Hybrid). Data are presented as the mean ± SEM, n=3 (right). (B) Summary of the experimental design for R-loop immunoprecipitation using S9.6 antibody in FLAG-tagged HIV-1 integrase protein-expressing HeLa cells. (C) Western blotting for HIV-1 integrase protein, H3, and LaminA/C of DNA-RNA hybrid immunoprecipitation using the S9.6 antibody. (D) and (E) HeLa gDNA input was either untreated (–) or treated (+) with RNase H before enrichment for DNA-RNA hybrids using the S9.6 antibody. gDNA-RNA hybrids were incubated with nuclear extracts depleted of DNA-RNA hybrids with RNase A followed by S9.6 immunoprecipitation. DNA-RNA hybrid dot blot (D) and western blot of DNA-RNA hybrid immunoprecipitation, probed with the indicated antibodies (E). (F) DNA-RNA hybrid dot blot of FLAG antibody-immunoprecipitated nucleic acid extracts. Where indicated, nucleic acid extracts were untreated (–) or treated (+) with RNase H before probing with the S9.6 antibodies. (G) Representative images of the proximity-ligation assay (PLA) between GFP and S9.6 antibodies in HIV-IN-EGFP virion-infected HeLa cells at 6 hpi. Cells were subjected to PLA (orange) and co-stained with DAPI (blue). PLA puncta in the nucleus is indicated by the yellow arrows. Quantification analysis of the number of PLA foci per nucleus (left). GFP_alone and S9.6_alone were used as single-antibody controls from HIV-IN-EGFP virion-infected HeLa cells (right). The mean value for each data point is indicated by the red line. p-value was calculated using a two-tailed unpaired t-test (n>50).
-
Figure 5—source data 1
Original gel image for Figure 5A, indicating the relevant bands and treatments.
- https://cdn.elifesciences.org/articles/97348/elife-97348-fig5-data1-v1.zip
-
Figure 5—source data 2
Original files for electrophoretic mobility shift assay (EMSA) analysis are displayed in Figure 5A.
- https://cdn.elifesciences.org/articles/97348/elife-97348-fig5-data2-v1.zip
-
Figure 5—source data 3
Original western blots for Figure 5C, indicate the relevant bands and treatments.
- https://cdn.elifesciences.org/articles/97348/elife-97348-fig5-data3-v1.zip
-
Figure 5—source data 4
Original files for western blot analysis are displayed in Figure 5C.
- https://cdn.elifesciences.org/articles/97348/elife-97348-fig5-data4-v1.zip
-
Figure 5—source data 5
Original western blots for Figure 5D, indicate the relevant bands and treatments.
- https://cdn.elifesciences.org/articles/97348/elife-97348-fig5-data5-v1.zip
-
Figure 5—source data 6
Original files for western blot analysis are displayed in Figure 5D.
- https://cdn.elifesciences.org/articles/97348/elife-97348-fig5-data6-v1.zip
-
Figure 5—source data 7
Original western blots for Figure 5E, indicate the relevant bands and treatments.
- https://cdn.elifesciences.org/articles/97348/elife-97348-fig5-data7-v1.zip
-
Figure 5—source data 8
Original files for western blot analysis are displayed in Figure 5E.
- https://cdn.elifesciences.org/articles/97348/elife-97348-fig5-data8-v1.zip
-
Figure 5—source data 9
Original dot blots for Figure 5F, indicate the relevant dots and treatments.
- https://cdn.elifesciences.org/articles/97348/elife-97348-fig5-data9-v1.zip
-
Figure 5—source data 10
Original files for dot blot analysis are displayed in Figure 5F.
- https://cdn.elifesciences.org/articles/97348/elife-97348-fig5-data10-v1.zip
Figure 5—figure supplement 1
HIV-1 integrase proteins directly bind to host genomic R-loops.
(A) Representative gel images for electrophoretic mobility shift assay (EMSA) of Sso7d-tagged HIV-1-integrase (E152Q) with different types of nucleic acids substrates (R:D+ssDNA and Hybrid). 100 nM nucleic acid substrate was incubated with Sso7d-tagged HIV-1-integrase (E152Q) at 0 nM, 20 nM, 50 nM, 100 nM, 200 nM, and 400 nM (n=3). (B) Nucleic acid extracts from FLAG-HIV-1-integrase-expressing cells were immunoprecipitated using S9.6 antibody. gDNA was precipitated from the elutes of immunoprecipitation and subjected to DNA-RNA hybrid dot blotting. Where indicated, the gDNA extracts were either untreated (–) or treated (+) with RNase H after elution of immunoprecipitated materials. (C) Summary of the experimental design for R-loop immunoprecipitation using S9.6 antibody in FLAG-tagged HIV-1 integrase protein-expressing HeLa cells with pre-immunoprecipitation in vitro RNase H treatment. (D) Protein extracts from FLAG-HIV-1-integrase-expressing cells were immunoprecipitated using an anti-FLAG antibody. Western blot of FLAG immunoprecipitation was probed with anti-FLAG or anti-H3 antibodies. (E) Representative images of the proximity-ligation assay (PLA) using a single antibody (anti-GFP or anti-S9.6) in HIV-IN-EGFP virion-infected HeLa cells at 6 hpi, as PLA signal negative controls. Cells were subjected to PLA (orange) and co-stained with DAPI (blue) (n>50).
-
Figure 5—figure supplement 1—source data 1
Original dot blots for Figure 5—figure supplement 1B, indicating the relevant dots and treatments.
- https://cdn.elifesciences.org/articles/97348/elife-97348-fig5-figsupp1-data1-v1.zip
-
Figure 5—figure supplement 1—source data 2
Original files for dot blot analysis are displayed in Figure 5—figure supplement 1B.
- https://cdn.elifesciences.org/articles/97348/elife-97348-fig5-figsupp1-data2-v1.zip
-
Figure 5—figure supplement 1—source data 3
Original western blots for Figure 5—figure supplement 1D, indicating the relevant bands and treatments.
- https://cdn.elifesciences.org/articles/97348/elife-97348-fig5-figsupp1-data3-v1.zip
-
Figure 5—figure supplement 1—source data 4
Original files for western blot analysis are displayed in Figure 5—figure supplement 1D.
- https://cdn.elifesciences.org/articles/97348/elife-97348-fig5-figsupp1-data4-v1.zip
Author response image 1
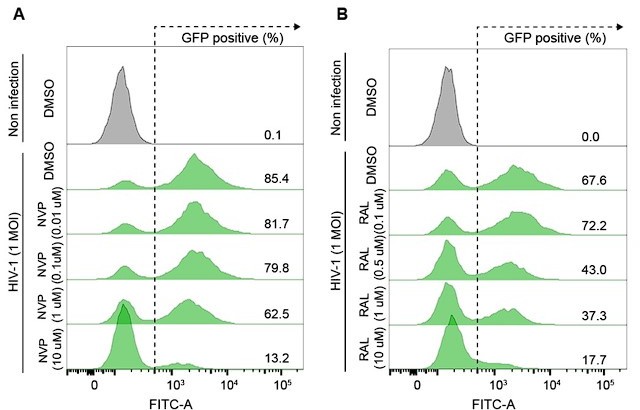
Representative flow cytometry histograms of VSV-G-pseudotyped HIV-1-EGFP-infected HeLa cells at an MOI of 1, harvested at 48 hpi.
The cells were treated with DMSO, the indicated doses of nevirapine (NVP) (A) or indicated doses of raltegravir (RAL) (B) for 24 h before infection.
Author response image 2

Genome browser screenshot over the chromosomal regions in 20-kb windows centered on human AIRN showing results from DRIPc-seq in the indicated HIV-1-infected cells (blue, 0 hpi; yellow, 3 hpi; green, 6 hpi; red, 12 hpi).
Author response image 3

Dot blot analysis of cellular R-loops in cells infected with different virus particles.
(A) Dot blot analysis of the R-loop in gDNA extracts from HIV-1 infected U2OS cells with MOI of 0.6 harvested at 6 hpi. The gDNA extracts were incubated with or without RNase H in vitro before membrane loading (anti-S9.6 signal). (B) Dot blot analysis of the R-loop in gDNA extracts from HeLa cells infected with 0.3 MOI of indicated viruses. The infected cells were harvested at 6 hpi. The gDNA extracts were incubated with or without RNase H in vitro before membrane loading (anti-S9.6 signal).
Author response image 4

Gating strategy used to determine HIV-1-infectivity in HeLa cells at 48 hpi.
Cells were infected with a known p24 antigen content in the stock of the VSV-G-pseudotyped HIV-1-EGFP-virus. The percentages of GFP-positive cell population are indicated.
Author response image 5

Bar graph indicating DRIPc-seq peak counts for HIV-1-infected primary CD4+ T cells harvested at the indicated hours post infection (hpi).
Pre-immunoprecipitated samples were untreated (−) or treated (+) with RNase H, as indicated. Each dot corresponds to an individual data set from two biologically independent experiments.
Author response image 6

Bar graphs showing the quantified number of HIV-1 integration sites per Mb pair in total regions of 30-kb windows centered on DRIPc-seq peaks from HIV-1 infected HeLa cells and primary CD4+ T cells (magenta) or non-R-loop region in the cellular genome (gray).
Each dot corresponds to an individual data set from two biologically independent experiments.
Tables
Appendix 1—key resources table
| Reagent type (species) or resource | Designation | Source or reference | Identifiers | Additional information |
|---|---|---|---|---|
| Sequence-based reagent | P1 Fwd | This paper | TTATAAGTCAGCCTCCAGGATCAA | |
| Sequence-based reagent | P1 Rev | This paper | TTCAGGTCTAGGCAGTCTGA | |
| Sequence-based reagent | P2 Fwd | This paper | GGACAGATGACAGGGTCGC | |
| Sequence-based reagent | P2 Rev | This paper | ATGAGGAAGACCCCCTCGG | |
| Sequence-based reagent | P3 Fwd | This paper | CTCTGTGTAACGCTGGTGCT | |
| Sequence-based reagent | P3 Rev | This paper | ACACGCTTCTGACCACTAAGG | |
| Sequence-based reagent | N1 Fwd | This paper | TTGGCCCTACTGAATGATTGGT | |
| Sequence-based reagent | N1 Rev | This paper | TTAAGGCATGCTCAGGCGA | |
| Sequence-based reagent | N2 Fwd | This paper | TGAGATTTCAGGTTCCATGATTTG | |
| Sequence-based reagent | N2 Rev | This paper | TGCTCAGTGTTCTAATTTCCCTGT | |
| Sequence-based reagent | β-actin Fwd | This paper | AGAGCTACGAGCTGCCTGAC | |
| Sequence-based reagent | β-actin Rev | This paper | AGCACTGTGTTGGCGTACAG | |
| Sequence-based reagent | SH49 (ECFP Fwd) | Hamperl et al., 2017 | TGGTTTGTCCAAACTCATCAA | |
| Sequence-based reagent | SH40 (mAIRN Fwd) | Hamperl et al., 2017; | CGAGAGAGGCTAAGGGTGAA | |
| Sequence-based reagent | SH21 (ECFP/mAIRN Rev) | Hamperl et al., 2017; Braun, 2018 | ACATGGTCCTGCTGGAGTTC | |
| Sequence-based reagent | RT-qPCR P1 (TOR1AIP2) Fwd | This paper | CCTTGGTCTTTCCCACTTGAGTG | |
| Sequence-based reagent | RT-qPCR P1 (TOR1AIP2) Rev | This paper | GCAGGGTTAAAACCAGCTACTCG | |
| Sequence-based reagent | RT-qPCR P2 (DVL1) Fwd | This paper | GCATAACCGACTCCACCATGTC | |
| Sequence-based reagent | RT-qPCR P2 (DVL1) Rev | This paper | GATGGAGCCAATGTAGATGCCG | |
| Sequence-based reagent | RT-qPCR P3 (PKN2) Fwd | This paper | GCATCACCAACACTAAGTCCACG | |
| Sequence-based reagent | RT-qPCR P3 (PKN2) Rev | This paper | GCTTTTGACCGTCCAGGGACAT | |
| Sequence-based reagent | RT-qPCR N2 (CDK5RAP1) Fwd | This paper | AGAGTGGAAGCAGCCGTGTGTT | |
| Sequence-based reagent | RT-qPCR N2 (CDK5RAP1) Rev | This paper | GATCTTCCTCCGTCTCACCACA | |
| Sequence-based reagent | PCR primer 1.0 P5 | Sanz and Chédin, 2019 | AATGATACGGCGACCACCGAGATCTACACTCTTTCCCTACACGA | |
| Sequence-based reagent | PCR primer 2.0 P7 | Sanz and Chédin, 2019 | CAAGCAGAAGACGGCATACGAGAT | |
| Sequence-based reagent | Index Adapter 1 | Illumina | HeLa 0hpi Input replicate 1; Jurkat 0hpi Input replicate 1 | GATCGGAAGAGCACACGTCTGAACTCCAGTCACATCACGATCTCGTATGCCGTCTTCTGCTTG |
| Sequence-based reagent | Index Adapter 2 | Illumina | HeLa 3hpi Input replicate 1; Jurkat 3hpi Input replicate 1 | GATCGGAAGAGCACACGTCTGAACTCCAGTCACCGATGTATCTCGTATGCCGTCTTCTGCTTG |
| Sequence-based reagent | Index Adapter 3 | Illumina | HeLa 6hpi Input replicate 1; Jurkat 6hpi Input replicate 1 | GATCGGAAGAGCACACGTCTGAACTCCAGTCACTTAGGCATCTCGTATGCCGTCTTCTGCTTG |
| Sequence-based reagent | Index Adapter 4 | Illumina | HeLa 12hpi Input replicate 1; Jurkat 12hpi Input replicate 1 | GATCGGAAGAGCACACGTCTGAACTCCAGTCACTGACCAATCTCGTATGCCGTCTTCTGCTTG |
| Sequence-based reagent | Index Adapter 5 | Illumina | HeLa 0hpi RNH-IP replicate 1; Jurkat 0hpi RNH-IP replicate 1 | GATCGGAAGAGCACACGTCTGAACTCCAGTCACACAGTGATCTCGTATGCCGTCTTCTGCTTG |
| Sequence-based reagent | Index Adapter 6 | Illumina | HeLa 3hpi RNH-IP replicate 1; Jurkat 3hpi RNH-IP replicate 1 | GATCGGAAGAGCACACGTCTGAACTCCAGTCACGCCAATATCTCGTATGCCGTCTTCTGCTTG |
| Sequence-based reagent | Index Adapter 7 | Illumina | HeLa 6hpi RNH-IP replicate 1; Jurkat 6hpi RNH-IP replicate 1 | GATCGGAAGAGCACACGTCTGAACTCCAGTCACCAGATCATCTCGTATGCCGTCTTCTGCTTG |
| Sequence-based reagent | Index Adapter 8 | Illumina | HeLa 12hpi RNH-IP replicate 1; Jurkat 12hpi RNH-IP replicate 1 | GATCGGAAGAGCACACGTCTGAACTCCAGTCACACTTGAATCTCGTATGCCGTCTTCTGCTTG |
| Sequence-based reagent | Index Adapter 9 | Illumina | HeLa 0hpi RNH +IP replicate 1; Jurkat 0hpi RNH +IP replicate 1 | GATCGGAAGAGCACACGTCTGAACTCCAGTCACGATCAGATCTCGTATGCCGTCTTCTGCTTG |
| Sequence-based reagent | Index Adapter 10 | Illumina | HeLa 3hpi RNH +IP replicate 1; Jurkat 3hpi RNH +IP replicate 1 | GATCGGAAGAGCACACGTCTGAACTCCAGTCACTAGCTTATCTCGTATGCCGTCTTCTGCTTG |
| Sequence-based reagent | Index Adapter 11 | Illumina | HeLa 6hpi RNH +IP replicate 1; Jurkat 6hpi RNH +IP replicate 1 | GATCGGAAGAGCACACGTCTGAACTCCAGTCACGGCTACATCTCGTATGCCGTCTTCTGCTTG |
| Sequence-based reagent | Index Adapter 12 | Illumina | HeLa 12hpi RNH +IP replicate 1; Jurkat 12hpi RNH +IP replicate 1 | GATCGGAAGAGCACACGTCTGAACTCCAGTCACCTTGTAATCTCGTATGCCGTCTTCTGCTTG |
| Sequence-based reagent | Index Adapter 13 | Illumina | Jurkat 0hpi Input replicate 2 | GATCGGAAGAGCACACGTCTGAACTCCAGTCACAGTCAAATCTCGTATGCCGTCTTCTGCTTG |
| Sequence-based reagent | Index Adapter 14 | Illumina | Jurkat 3hpi Input replicate 2 | GATCGGAAGAGCACACGTCTGAACTCCAGTCACAGTTCCATCTCGTATGCCGTCTTCTGCTTG |
| Sequence-based reagent | Index Adapter 15 | Illumina | Jurkat 6hpi Input replicate 2 | GATCGGAAGAGCACACGTCTGAACTCCAGTCACATGTCAATCTCGTATGCCGTCTTCTGCTTG |
| Sequence-based reagent | Index Adapter 16 | Illumina | Jurkat 12hpi Input replicate 2 | GATCGGAAGAGCACACGTCTGAACTCCAGTCACCCGTCCATCTCGTATGCCGTCTTCTGCTTG |
| Sequence-based reagent | Index Adapter 17 | Illumina | Jurkat 0hpi RNH-IP replicate 2 | GATCGGAAGAGCACACGTCTGAACTCCAGTCACGTAGAGATCTCGTATGCCGTCTTCTGCTTG |
| Sequence-based reagent | Index Adapter 18 | Illumina | Jurkat 3hpi RNH-IP replicate 2 | GATCGGAAGAGCACACGTCTGAACTCCAGTCACGTCCGCATCTCGTATGCCGTCTTCTGCTTG |
| Sequence-based reagent | Index Adapter 19 | Illumina | Jurkat 6hpi RNH-IP replicate 2 | GATCGGAAGAGCACACGTCTGAACTCCAGTCACGTGAAAATCTCGTATGCCGTCTTCTGCTTG |
| Sequence-based reagent | Index Adapter 20 | Illumina | Jurkat 12hpi RNH-IP replicate 2 | GATCGGAAGAGCACACGTCTGAACTCCAGTCACGTGGCCATCTCGTATGCCGTCTTCTGCTTG |
| Sequence-based reagent | Index Adapter 21 | Illumina | Jurkat 0hpi RNH +IP replicate 2 | GATCGGAAGAGCACACGTCTGAACTCCAGTCACGTTTCGATCTCGTATGCCGTCTTCTGCTTG |
| Sequence-based reagent | Index Adapter 22 | Illumina | Jurkat 3hpi RNH +IP replicate 2 | GATCGGAAGAGCACACGTCTGAACTCCAGTCACCGTACGATCTCGTATGCCGTCTTCTGCTTG |
| Sequence-based reagent | Index Adapter 23 | Illumina | Jurkat 6hpi RNH +IP replicate 2 | GATCGGAAGAGCACACGTCTGAACTCCAGTCACGAGTGGATCTCGTATGCCGTCTTCTGCTTG |
| Sequence-based reagent | Index Adapter 24 | Illumina | Jurkat 12hpi RNH +IP replicate 2 | GATCGGAAGAGCACACGTCTGAACTCCAGTCACGGTAGCATCTCGTATGCCGTCTTCTGCTTG |
| Sequence-based reagent | Index Adapter 25 | Illumina | CD4 0hpi Input donor 1 | GATCGGAAGAGCACACGTCTGAACTCCAGTCACACTGATATCTCGTATGCCGTCTTCTGCTTG |
| Sequence-based reagent | Index Adapter 26 | Illumina | CD4 3hpi Input donor 1 | GATCGGAAGAGCACACGTCTGAACTCCAGTCACATGAGCATCTCGTATGCCGTCTTCTGCTTG |
| Sequence-based reagent | Index Adapter 27 | Illumina | CD4 6hpi Input donor 1 | GATCGGAAGAGCACACGTCTGAACTCCAGTCACATTCCTATCTCGTATGCCGTCTTCTGCTTG |
| Sequence-based reagent | Index Adapter 28 | Illumina | HeLa 0hpi Input replicate 2; CD4 12hpi Input donor 1 | GATCGGAAGAGCACACGTCTGAACTCCAGTCACCAAAAGATCTCGTATGCCGTCTTCTGCTTG |
| Sequence-based reagent | Index Adapter 29 | Illumina | HeLa 3hpi Input replicate 2; CD4 0hpi RNH-IP donor 1 | GATCGGAAGAGCACACGTCTGAACTCCAGTCACCAACTAATCTCGTATGCCGTCTTCTGCTTG |
| Sequence-based reagent | Index Adapter 30 | Illumina | HeLa 6hpi Input replicate 2; CD4 3hpi RNH-IP donor 1 | GATCGGAAGAGCACACGTCTGAACTCCAGTCACCACCGGATCTCGTATGCCGTCTTCTGCTTG |
| Sequence-based reagent | Index Adapter 31 | Illumina | HeLa 12hpi Input replicate 2; CD4 6hpi RNH-IP donor 1 | GATCGGAAGAGCACACGTCTGAACTCCAGTCACCACGATATCTCGTATGCCGTCTTCTGCTTG |
| Sequence-based reagent | Index Adapter 32 | Illumina | HeLa 0hpi RNH-IP replicate 2; CD4 12hpi RNH-IP donor 1 | GATCGGAAGAGCACACGTCTGAACTCCAGTCACCACTCAATCTCGTATGCCGTCTTCTGCTTG |
| Sequence-based reagent | Index Adapter 33 | Illumina | HeLa 3hpi RNH-IP replicate 2; CD4 0hpi RNH +IP donor 1 | GATCGGAAGAGCACACGTCTGAACTCCAGTCACCAGGCGATCTCGTATGCCGTCTTCTGCTTG |
| Sequence-based reagent | Index Adapter 34 | Illumina | HeLa 6hpi RNH-IP replicate 2; CD4 3hpi RNH +IP donor 1 | GATCGGAAGAGCACACGTCTGAACTCCAGTCACCATGGCATCTCGTATGCCGTCTTCTGCTTG |
| Sequence-based reagent | Index Adapter 35 | Illumina | HeLa 12hpi RNH-IP replicate 2; CD4 6hpi RNH +IP donor 1 | GATCGGAAGAGCACACGTCTGAACTCCAGTCACCATTTTATCTCGTATGCCGTCTTCTGCTTG |
| Sequence-based reagent | Index Adapter 36 | Illumina | HeLa 0hpi RNH +IP replicate 2; CD4 12hpi RNH +IP donor 1 | GATCGGAAGAGCACACGTCTGAACTCCAGTCACCCAACAATCTCGTATGCCGTCTTCTGCTTG |
| Sequence-based reagent | Index Adapter 37 | Illumina | HeLa 3hpi RNH +IP replicate 2; CD4 0hpi Input donor 2 | GATCGGAAGAGCACACGTCTGAACTCCAGTCACCGGAATATCTCGTATGCCGTCTTCTGCTTG |
| Sequence-based reagent | Index Adapter 38 | Illumina | HeLa 6hpi RNH +IP replicate 2; CD4 3hpi Input donor 2 | GATCGGAAGAGCACACGTCTGAACTCCAGTCACCTAGCTATCTCGTATGCCGTCTTCTGCTTG |
| Sequence-based reagent | Index Adapter 39 | Illumina | HeLa 12hpi RNH +IP replicate 2; CD4 6hpi Input donor 2 | GATCGGAAGAGCACACGTCTGAACTCCAGTCACCTATACATCTCGTATGCCGTCTTCTGCTTG |
| Sequence-based reagent | Index Adapter 40 | Illumina | CD4 12hpi Input donor 2 | GATCGGAAGAGCACACGTCTGAACTCCAGTCACCTCAGAATCTCGTATGCCGTCTTCTGCTTG |
| Sequence-based reagent | Index Adapter 41 | Illumina | CD4 0hpi RNH-IP donor 2 | GATCGGAAGAGCACACGTCTGAACTCCAGTCACGACGACATCTCGTATGCCGTCTTCTGCTTG |
| Sequence-based reagent | Index Adapter 42 | Illumina | CD4 3hpi RNH-IP donor 2 | GATCGGAAGAGCACACGTCTGAACTCCAGTCACTAATCGATCTCGTATGCCGTCTTCTGCTTG |
| Sequence-based reagent | Index Adapter 43 | Illumina | CD4 6hpi RNH-IP donor 2 | GATCGGAAGAGCACACGTCTGAACTCCAGTCACTACAGCATCTCGTATGCCGTCTTCTGCTTG |
| Sequence-based reagent | Index Adapter 45 | Illumina | CD4 12hpi RNH-IP donor 2 | GATCGGAAGAGCACACGTCTGAACTCCAGTCACTCATTCATCTCGTATGCCGTCTTCTGCTTG |
| Sequence-based reagent | Index Adapter 46 | Illumina | CD4 0hpi RNH +IP donor 2 | GATCGGAAGAGCACACGTCTGAACTCCAGTCACTCCCGAATCTCGTATGCCGTCTTCTGCTTG |
| Sequence-based reagent | Index Adapter 47 | Illumina | CD4 3hpi RNH +IP donor 2 | GATCGGAAGAGCACACGTCTGAACTCCAGTCACTCGAAGATCTCGTATGCCGTCTTCTGCTTG |
| Sequence-based reagent | Index Adapter 48 | Illumina | CD4 6hpi RNH +IP donor 2 | GATCGGAAGAGCACACGTCTGAACTCCAGTCACTCGGCAATCTCGTATGCCGTCTTCTGCTTG |
| Sequence-based reagent | Index Adapter 49 | Illumina | CD4 12hpi RNH +IP donor 2 | GATCGGAAGAGCACACGTCTGAACTCCAGTCACAACAACATCTCGTATGCCGTCTTCTGCTTG |
| Sequence-based reagent | AE5316 | Achuthan et al., 2018 | First round LTR primer | TGTGACTCTGGTAACTAGAGATCCCTC |
| Sequence-based reagent | AE6380 | Achuthan et al., 2018 | HeLa replicate 1 5dpi Linker short / HeLa replicate 1 pgR-poor DOX- Linker short / CD4 +donor 1 Linker short | TAGTCCCTTAAGCGGAG-NH2 |
| Sequence-based reagent | AE6381 | Achuthan et al., 2018 | HeLa replicate 1 5dpi Linker long / HeLa replicate 1 pgR-poor DOX- Linker long / CD4 +donor 1 Linker long | GTAATACGACTCACTATAGGGCCTCCGCTTAAGGGAC |
| Sequence-based reagent | AE6382 | Achuthan et al., 2018 | HeLa replicate 1 5dpi Linker primer / HeLa replicate 1 pgR-poor DOX- Linker primer / CD4 +donor 1 Linker primer | CAAGCAGAAGACGGCATACGAGATCGGTCTCGGCATTCCTGCTGAACCGCTCTTCCGATCTGTAATACGACTCACTATAGGGC |
| Sequence-based reagent | AE6404 | Achuthan et al., 2018 | HeLa replicate 1 5dpi Second round LTR primer / HeLa replicate 1 pgR-poor DOX- Second round LTR primer / CD4 +donor 1 Second round LTR primer | AATGATACGGCGACCACCGAGATCTACACTCTTTCCCTACACGACGCTCTTCCGATCTCGATGTGAGATCCCTCAGACCCTTTTAGTCAG |
| Sequence-based reagent | AE6380 | Achuthan et al., 2018 | HeLa replicate 2 5dpi Linker short / HeLa replicate 2 pgR-poor DOX +Linker short | TAGTCCCTTAAGCGGAG-NH2 |
| Sequence-based reagent | AE6381 | Achuthan et al., 2018 | HeLa replicate 2 5dpi Linker long /HeLa replicate 2 pgR-poor DOX +Linker long | GTAATACGACTCACTATAGGGCCTCCGCTTAAGGGAC |
| Sequence-based reagent | AE6382 | Achuthan et al., 2018 | HeLa replicate 2 5dpi Linker primer / HeLa replicate 2 pgR-poor DOX +Linker prime | CAAGCAGAAGACGGCATACGAGATCGGTCTCGGCATTCCTGCTGAACCGCTCTTCCGATCTGTAATACGACTCACTATAGGGC |
| Sequence-based reagent | AE6404-1 | This paper | HeLa replicate 2 5dpi Second round LTR primer / HeLa replicate 2 pgR-poor DOX +Second round LTR primer | AATGATACGGCGACCACCGAGATCTACACTCTTTCCCTACACGACGCTCTTCCGATCTTTAGGCGAGATCCCTCAGACCCTTTTAGTCAG |
| Sequence-based reagent | AE6386 | Achuthan et al., 2018 | HeLa replicate 1 pgR-rich DOX- Linker short / CD4 +donor 2 Linker short | TACTATGACGGTGACGC-NH2 |
| Sequence-based reagent | AE6387 | Achuthan et al., 2018 | HeLa replicate 1 pgR-rich DOX- Linker long / CD4 +donor 2 Linker long | GAGAATCCATGAGTATGCTCACGCGTCACCGTCATAG |
| Sequence-based reagent | AE6388 | Achuthan et al., 2018 | HeLa replicate 1 pgR-rich DOX- Linker primer / CD4 +donor 2 Linker primer | CAAGCAGAAGACGGCATACGAGATCGGTCTCGGCATTCCTGCTGAACCGCTCTTCCGATCTGAGAATCCATGAGTATGCTCAC |
| Sequence-based reagent | AE6406 | Achuthan et al., 2018 | HeLa replicate 1 pgR-rich DOX- Second round LTR primer / CD4 +donor 2 Second round LTR primer | AATGATACGGCGACCACCGAGATCTACACTCTTTCCCTACACGACGCTCTTCCGATCTACAGTGGAGATCCCTCAGACCCTTTTAGTCAG |
| Sequence-based reagent | AE6456 | Achuthan et al., 2018 | HeLa replicate 1 pgR-poor DOX +Linker short | TAGACTGACGCAGTCTG-NH2 |
| Sequence-based reagent | AE6457 | Achuthan et al., 2018 | HeLa replicate 1 pgR-poor DOX +Linker long | GACGTACATACTGATCGCATAGCAGACTGCGTCAGTC |
| Sequence-based reagent | AE6458 | Achuthan et al., 2018 | HeLa replicate 1 pgR-poor DOX +Linker primer | CAAGCAGAAGACGGCATACGAGATCGGTCTCGGCATTCCTGCTGAACCGCTCTTCCGATCTGACGTACATACTGATCGCATAG |
| Sequence-based reagent | AE6405 | Achuthan et al., 2018 | HeLa replicate 1 pgR-poor DOX +Second round LTR primer | AATGATACGGCGACCACCGAGATCTACACTCTTTCCCTACACGACGCTCTTCCGATCTTGACCAGAGATCCCTCAGACCCTTTTAGTCAG |
| Sequence-based reagent | AE6386 | Achuthan et al., 2018 | HeLa replicate 2 pgR-rich DOX +Linker short | TACTATGACGGTGACGC-NH2 |
| Sequence-based reagent | AE6387 | Achuthan et al., 2018 | HeLa replicate 2 pgR-rich DOX +Linker long | GAGAATCCATGAGTATGCTCACGCGTCACCGTCATAG |
| Sequence-based reagent | AE6388 | Achuthan et al., 2018 | HeLa replicate 2 pgR-rich DOX +Linker primer | CAAGCAGAAGACGGCATACGAGATCGGTCTCGGCATTCCTGCTGAACCGCTCTTCCGATCTGAGAATCCATGAGTATGCTCAC |
| Sequence-based reagent | AE6406-1 | This paper | HeLa replicate 2 pgR-rich DOX +Second round LTR primer | AATGATACGGCGACCACCGAGATCTACACTCTTTCCCTACACGACGCTCTTCCGATCTGCCAATGAGATCCCTCAGACCCTTTTAGTCAG |
| Sequence-based reagent | AE6456 | Achuthan et al., 2018 | HeLa replicate 3 pgR-rich DOX- Linker short | TAGACTGACGCAGTCTG-NH2 |
| Sequence-based reagent | AE6457 | Achuthan et al., 2018 | HeLa replicate 3 pgR-rich DOX- Linker long | GACGTACATACTGATCGCATAGCAGACTGCGTCAGTC |
| Sequence-based reagent | AE6458 | Achuthan et al., 2018 | HeLa replicate 3 pgR-rich DOX- Linker primer | CAAGCAGAAGACGGCATACGAGATCGGTCTCGGCATTCCTGCTGAACCGCTCTTCCGATCTGACGTACATACTGATCGCATAG |
| Sequence-based reagent | AE6411 | Achuthan et al., 2018 | HeLa replicate 3 pgR-rich DOX- Second round LTR primer | AATGATACGGCGACCACCGAGATCTACACTCTTTCCCTACACGACGCTCTTCCGATCTAGTTCCGAGATCCCTCAGACCCTTTTAGTCAG |
| Sequence-based reagent | R-loop oligo1* | Kang et al., 2021 | R-loop; R:D+ssDNA | 5’-[Cy3]-GCC AGG GAC GAG GTG AAC CTG CAG GTG GGC GGC TAC TAC TTA GAT GTC ATC CGA GGC TTA TTG GTA GAA TTC GGC AGC GTC ATG C GA CGG C-3’ |
| Sequence-based reagent | R-loop oligo2* | Kang et al., 2021 | R-loop; dsDNA | 5’-GCC GTC GCA TGA CGC TGC CGA ATT CTA CCA CGC GAT TCA TAC CTG TCG TGC CAG CTG CTT TGC CCA CCT GCA GGT TCA CCT CGT CCC TGG C-3’ |
| Sequence-based reagent | R-loop RNA | Kang et al., 2021 | R-loop; R:D+ssDNA | 5’-[Cy5]-GCA GCU GGC ACG ACA GGU AUG AAU C-3’ |
| Sequence-based reagent | Homoduplex | Kang et al., 2021 | dsDNA | 5’-[Cy3]-GCC AGG GAC GAG GTG AAC CTG CAG GTG GGC AAA GCA GCT GGC ACG ACA GGT ATG AAT CGC GTG GTA GAA TTC GGC AGC GTC ATG CGA CGG C-3’ |
| Sequence-based reagent | Hybrid DNA | Kang et al., 2021 | Hybrid | 5’-CCC ATA CCG TAT AAC CAT TTG GCT GTC CAA GCT CCG GGT-3’ |
| Sequence-based reagent | Hybrid RNA | Kang et al., 2021 | Hybrid | 5’-[Cy5]-ACC CGG AGC UU G GAC AGC CAA AUG GU U AUA CGG UAU GGG-3’ |
| Sequence-based reagent | oligo 5 | Kang et al., 2021 | R:D+ssDNA | 5′GCAGTAGCATGACGCTGCTGAATTCTACCACGCTATGCT CTCGTCTAGGTTCACTCCGT CCCTGCGATTCATACCTGTCGTGCCAGCTGC |
| Other | Jurkat integration site | Li et al., 2020b | SRR12322252 | Source data |
| Other | TSA-seq_SPAD | Chen et al., 2018 | SRR3538917, SRR3538918, SRR3538919, SRR3538920 | Source data |
| Other | SPIN (Spatial Position Inference of the Nuclear genome) annotation of speckle | Wang et al., 2020 | https://github.com/ma-compbio/SPIN; ma-compbio, 2020 | Source data |
| Other | LADs | Meuleman et al., 2013 | GSE22428 | Source data |
Author response table 1
DRIPc-seq peak length and Chi-square p-value in CD4+ T cells from individual donor 1 and 2.
| Total DRIPc-seq peak length (replicate 1, bp) | Total DRIPc-seq peak length (replicate 2, bp) | Total DRIPc-seq peak length (overalp, bp) | Chi-square p-value | |
|---|---|---|---|---|
| Ohpi | 1910609 | 4722514 | 540640 | p < 1e-308 |
| 3hpi | 3630859 | 3308270 | 835457 | p < 1e-308 |
| 6hpi | 4195887 | 8496266 | 1485568 | p < 1e-308 |
| 12hpi | 4323824 | 13714402 | 1903473 | p < 1e-308 |
Additional files
Download links
A two-part list of links to download the article, or parts of the article, in various formats.
Downloads (link to download the article as PDF)
Open citations (links to open the citations from this article in various online reference manager services)
Cite this article (links to download the citations from this article in formats compatible with various reference manager tools)
Human immunodeficiency virus-1 induces host genomic R-loops and preferentially integrates its genome near the R-loop regions
eLife 13:RP97348.
https://doi.org/10.7554/eLife.97348.3


