An Intranet of Things approach for adaptable control of behavioral and navigation-based experiments
- Department of Neuroscience, Columbia University, United States
- Mortimer B. Zuckerman Mind Brain Behavior Institute, Columbia University, United States
- Department of Neurobiology, University of Utah, United States
- Aquabyte, United States
- Doctoral Program in Neurobiology and Behavior, Columbia University, United States
- Brain Mind Institute, École polytechnique fédérale de Lausanne, Switzerland
Figures
Figure 1
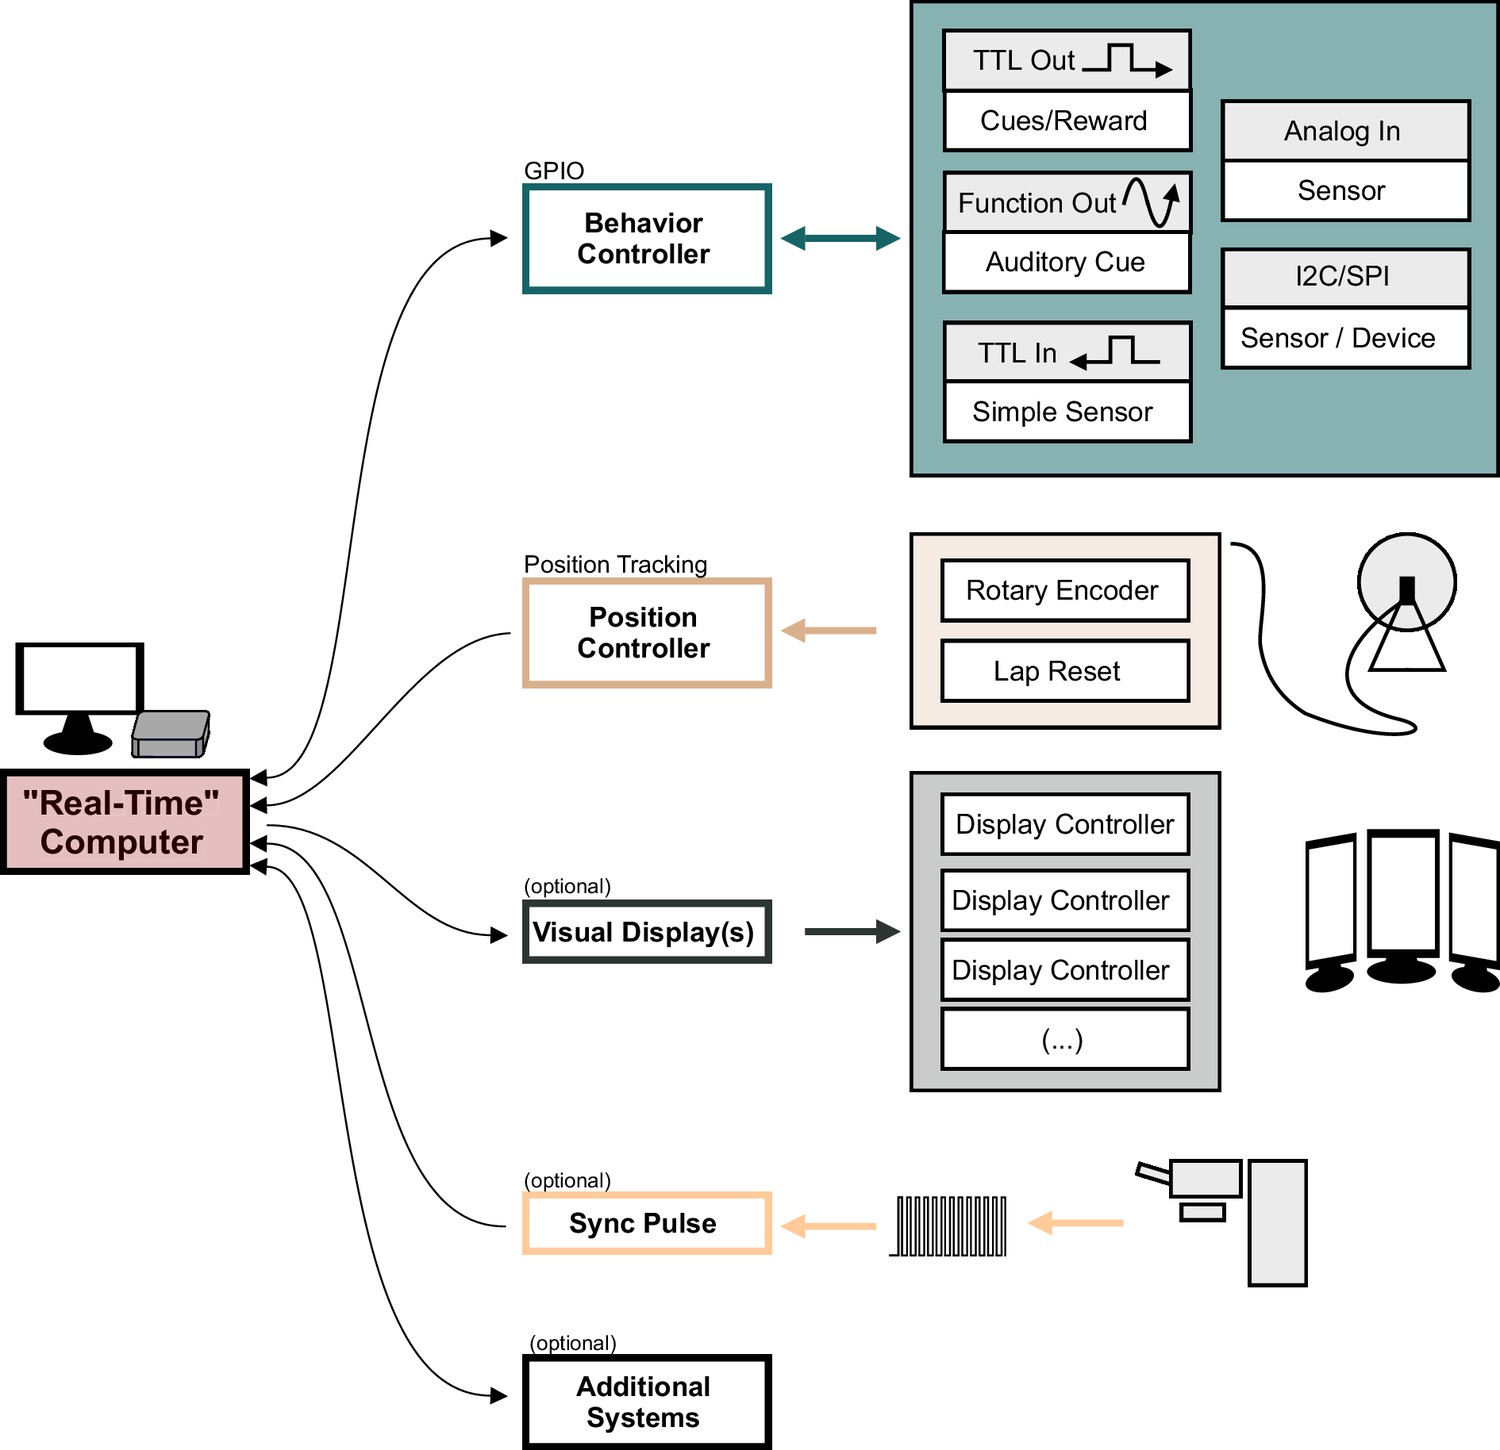
Overview of the behaviorMate system with optional components.
Diagram shows the modular components behaviorMate can interact with the colored arrows show the direction of information flow. For example, the Position Controller module only receives position updates and forwards them to the computer. The Visual Display module sends data to the Display Controllers to render the scene. The Behavior Controller performs a general-purpose input/output (GPIO) function and may both send and receive data to and from the Computer. An optional external Sync Pulse is shown to demonstrate that behaviorMate will log any UDP received UDP packets, such as timestamped sync-signals which could be beneficial in certain setups to synchronize neural data with behavior. Additional Systems may also be implemented on the behaviorMate intranet, taking advantage of the flexible UDP messaging scheme.
Figure 2
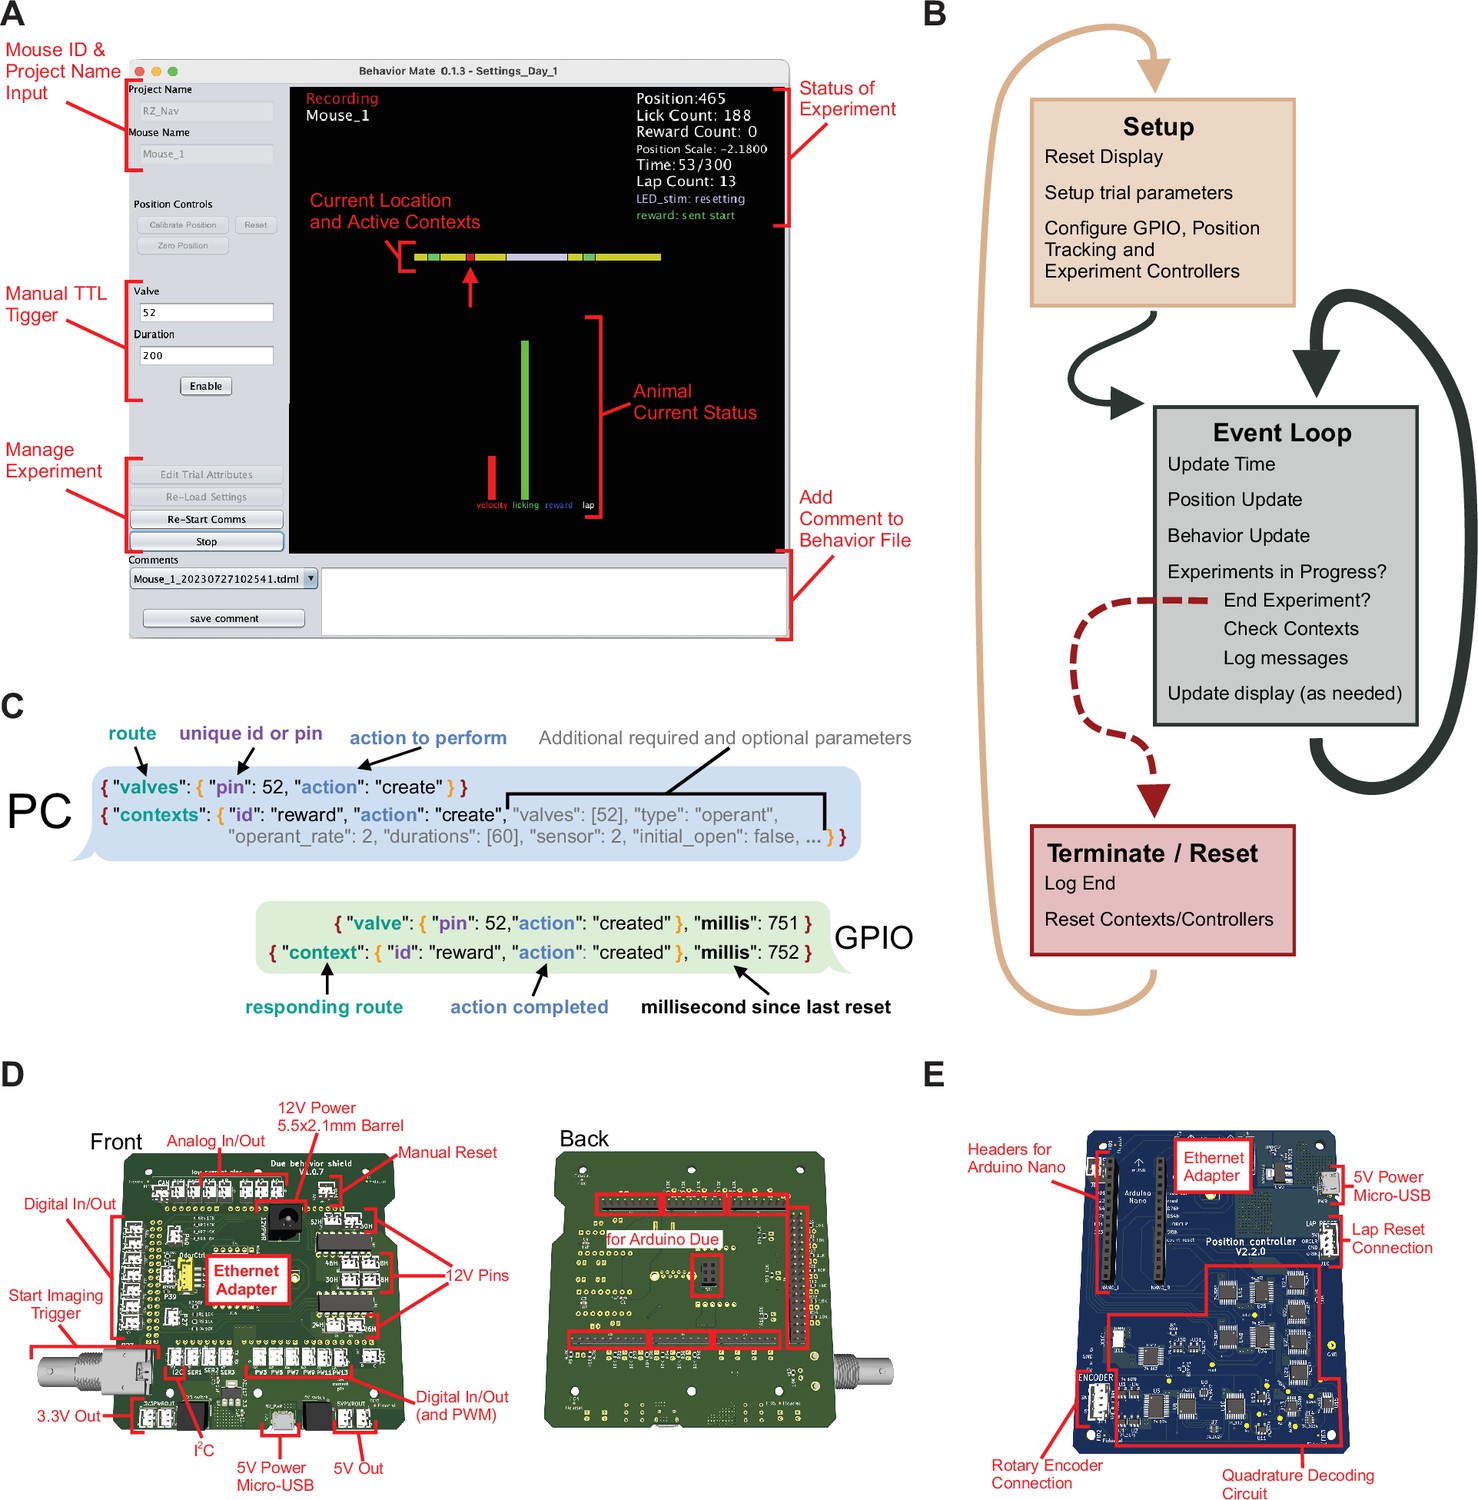
Details of user interface (UI) function.
(A) Screenshot of the UI. The interface provides a snapshot of the animal’s current status (center) as well as cumulative information about the current experiment (upper-left). The control panel along the left side provide: Top, an input for a project name and mouse id, which control where the resulting behavior file will be saved (these boxes are disabled when an experiment is currently running); Middle, controls to trigger the general-purpose input/output (GPIO) to send a transistor–transistor logic (TTL) pulse that is to issue a water reward or turn on an LED; and Bottom, controls to start/stop experiments as well as to load settings files. (B) Details of UI event loop. The UI is continuously executing an event loop on every update step which checks for messages, writes the behavior file and updates the display. (C) JSON-formatted message passing. The PC sends and receives JSON-formatted messages via UDP to active components of the system. Messages have a nested structure to allow for internal routing and subsequent actions to be taken. (D) Rendering of the GPIO circuit used. Left: JST headers connected to I/O pins and pull-down resisters to allow for easy connections with peripheral devices that can be activated by TTL pulses (both at 3.3 and 12 V, depending on the pins used). Additionally, power connections and a BNC output trigger are provided. Right: This board attaches to an Arduino Due microcontroller. (E) Updates to the position have a dedicated circuit for decoding quadrature information and sending updates to the PC. Connections for a quadrature-based rotary encoder, power, and Ethernet are provided. Additionally, an input for a ‘Lap Reset’ sensor is provided and headers to interface with an Arduino Mini.
Figure 3
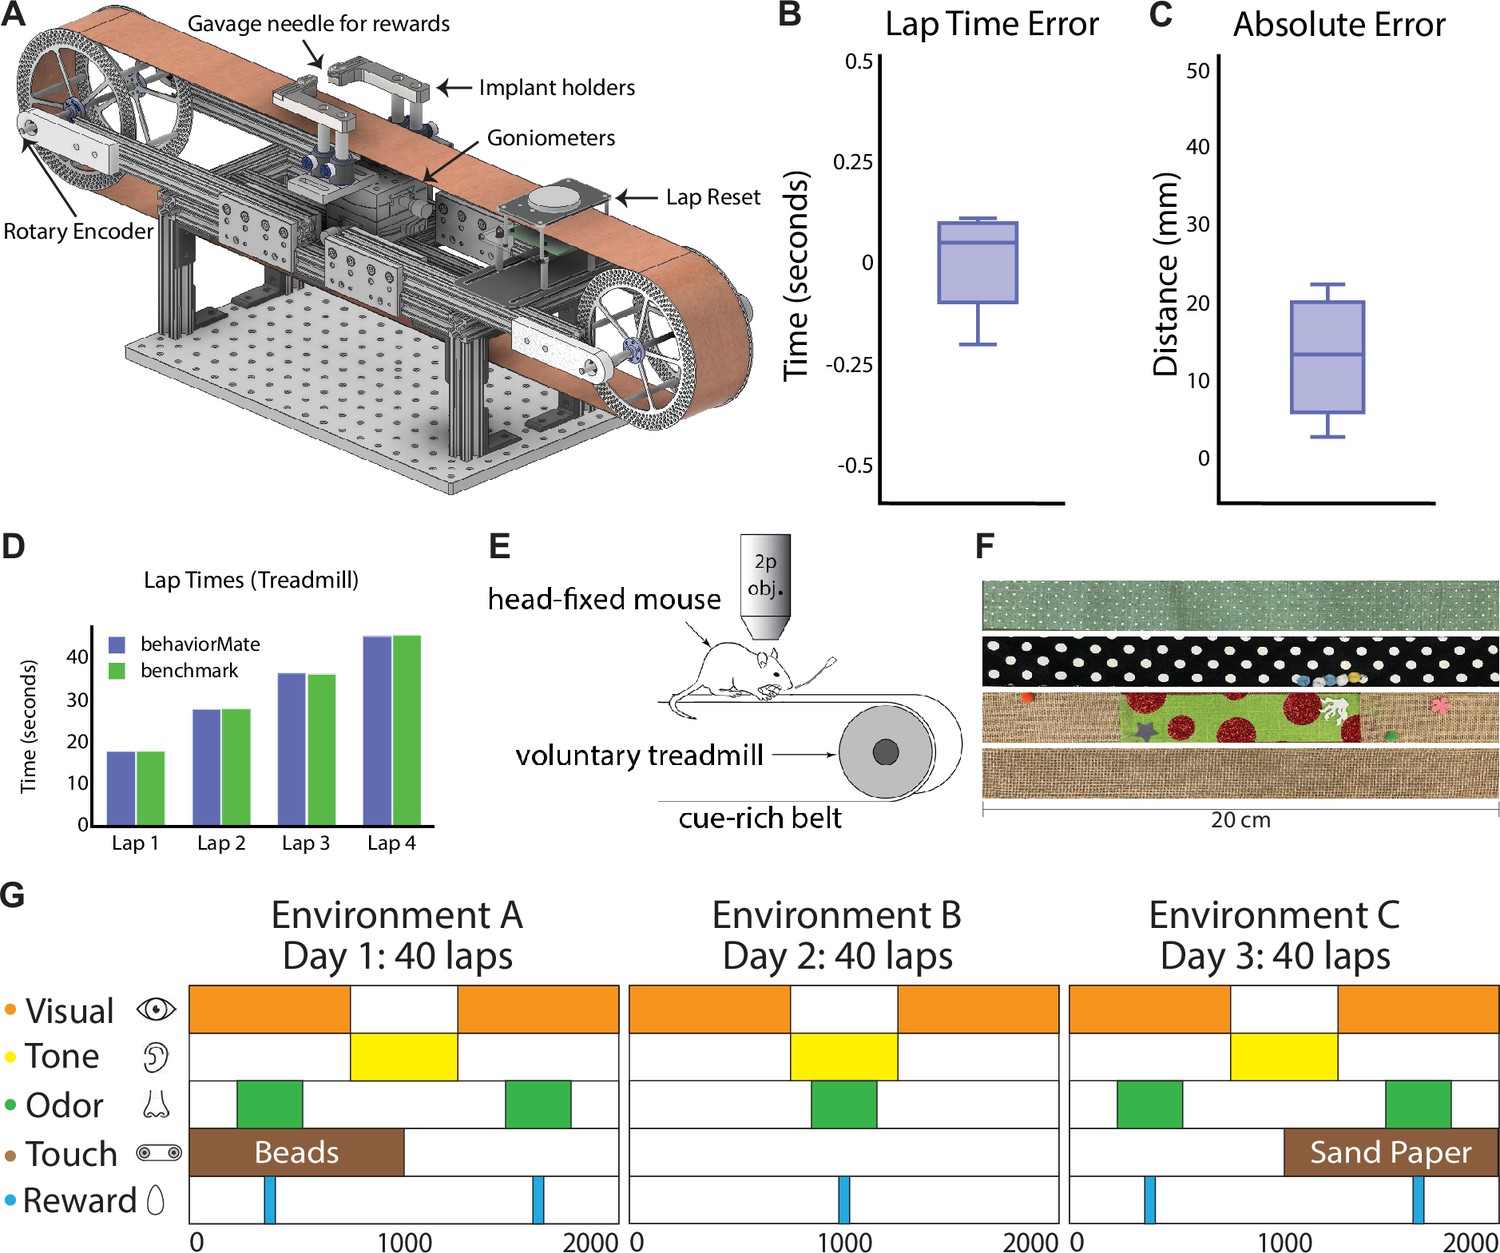
Details of treadmill system.
(A) CAD model of voluntary treadmill that can expand or contract to accommodate different sized running belts. Implant holders sit on goniometers to allow mouse head angle to be adjusted. (B) Lap time error is defined for each lap (full turn of the treadmill belt) as the difference between the time recorded by behaviorMate and the computer vision benchmark in second (, mean ± std). (C) Absolute error is defined for each lap as the difference between the position in behaviorMate and the benchmark position in millimeters (, mean ± std). (D) The time to complete a lap according to behaviorMate and the benchmark were nearly identical. (E) Schematic of head-fixed behavioral task. Two-photon objective. (F) Cue-rich belts for treadmill behavioral tasks. Belts are easily interchangeable. (G) Example test condition spanning 3 days and involving five sensory cues. Each row represents a sensory modality (visual, auditory, etc.). Cues are tied to locations on the belt or wheel as indicated by the colored rectangles. Locations and durations of cue presentations can be changed across trials.
Figure 4 with 1 supplement
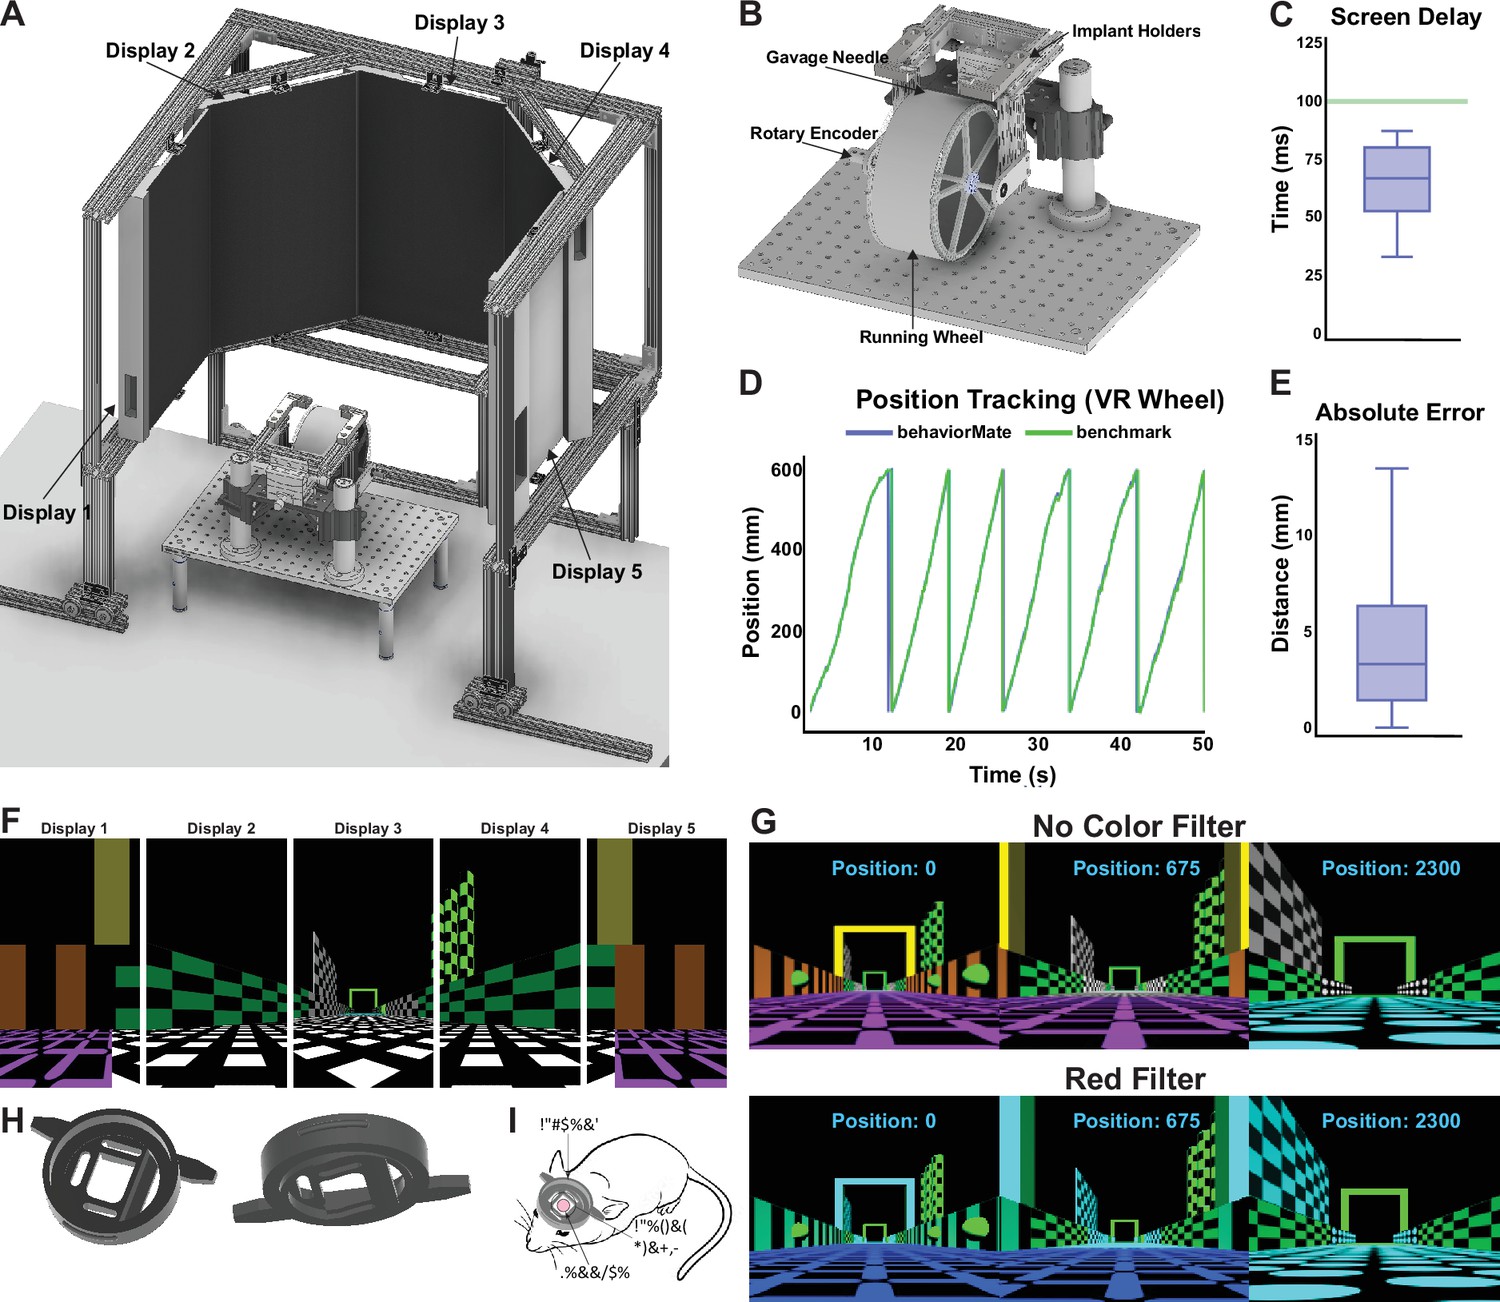
Details of virtual reality (VR) system.
(A) The complete assembly. Five monitors are suspended in an octagonal pattern in front of the subject and display the virtual scenes. (B) A running wheel attached to a goniometer to allow for angle of subject’s head to be adjusted. Placed directly underneath the objective. (C) Box plot describing the delay between when the running wheel is moved and when the virtual scene is updated to reflect the new position (, mean ± std). (D) Plot showing the difference between the position of the animal computed by behaviorMate and the ground-truth position tracked using computer vision. (E) Box plot describing the absolute difference between the current position of the mouse according to behaviorMate and the computer vision benchmark at each point in time (, mean ± std). (F) A 2D projection of the displays which will resemble what the test animal will see. When viewed on the actual monitors, the scene will appear more immersive. (G) A virtual reality (VR) scene as the subject moves down the virtual track. Modifying a few numerical parameters in the settings files allows one to change the appearance and view angle of a scene. Bottom: A scene with all red color shaders removed. (H) Left: Top view of implant. This side will make contact with microscope objective. Right: Bottom view. This side will make contact with the mouse’s brain. (I) Sketch of how the implant will appear after being surgically attached to skull.
Figure 4—figure supplement 1
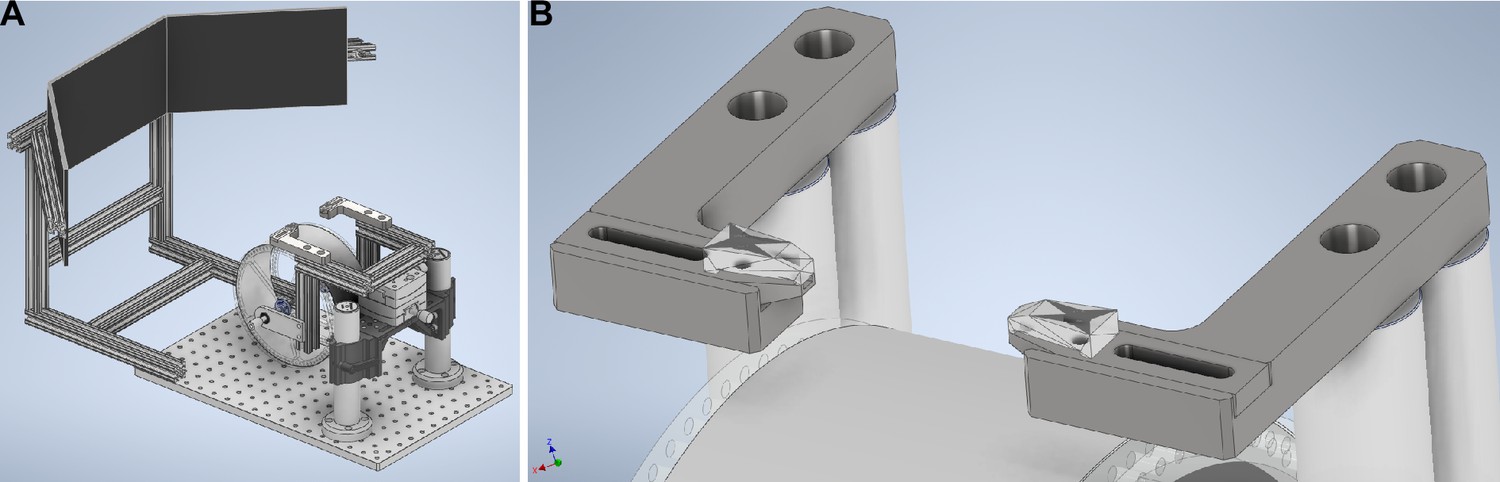
Alternative virtual reality (VR) system.
(A) A version of the VR system that can better fit in tight spaces. Can be made to be self-contained in the event it needs to be moved or swapped with other systems. (B) Fixes the position of the mouse’s head by tightly clamping onto each side of the bar implanted into its skull. The screws used to close the two clamps are not shown.
Figure 5 with 2 supplements
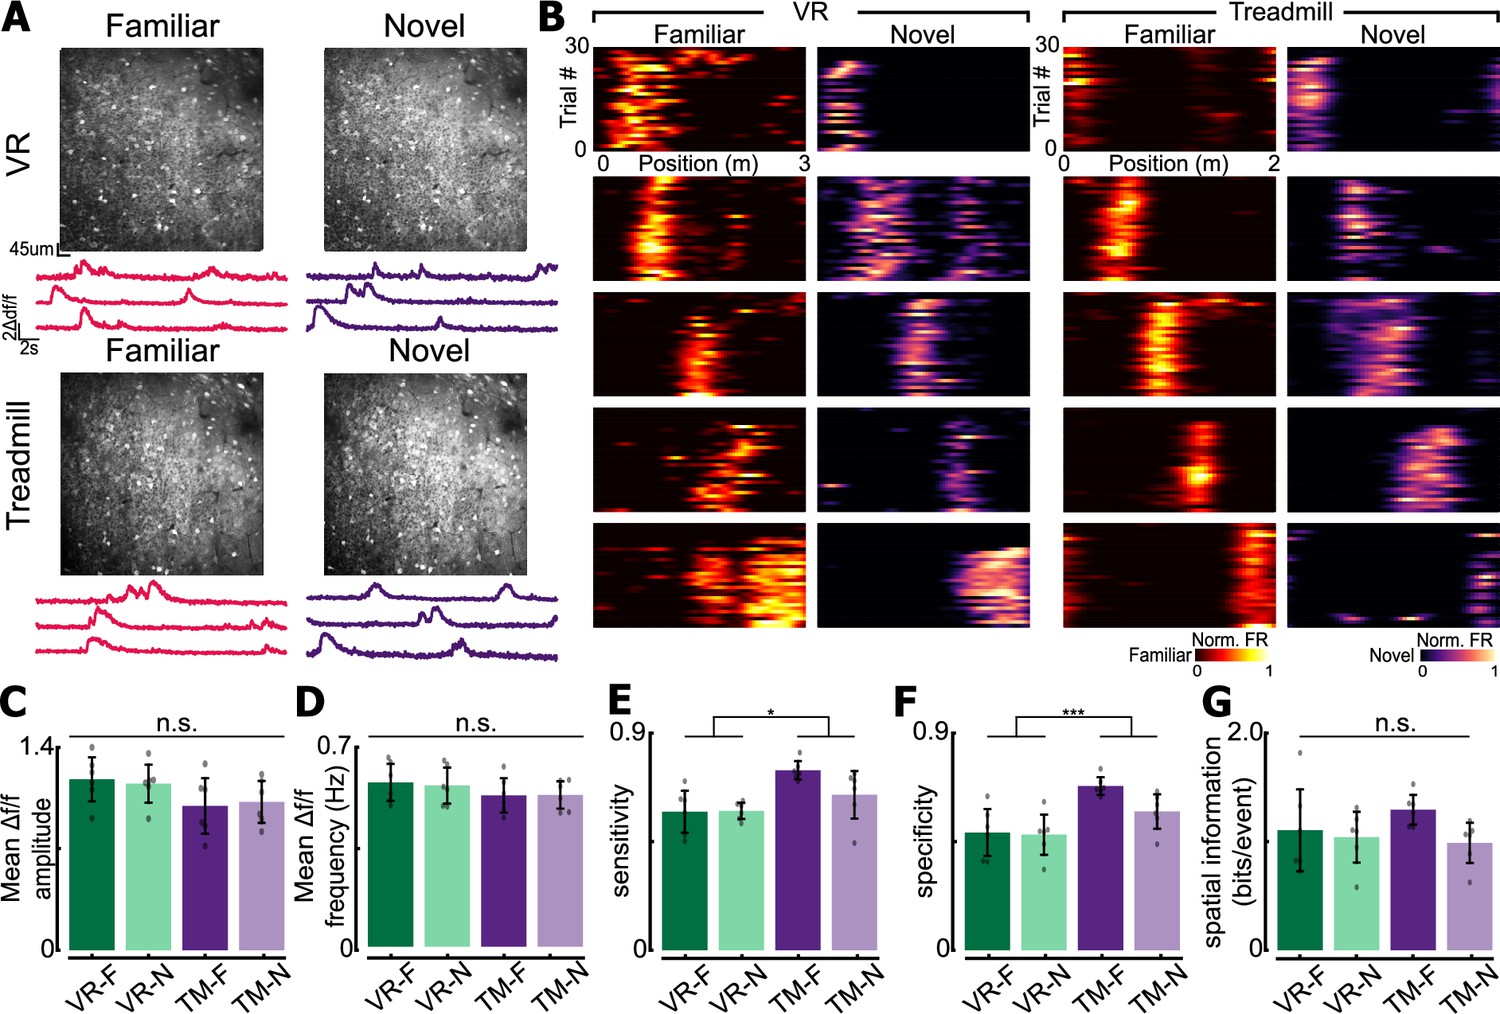
Two-photon imaging of CA1 population for experimental validation.
(A) Field of view obtained from virtual reality (VR) and treadmill (TM). (B) Examples of place cells recorded using VR or TM. In both familiar and novel contexts, place cells encoding different locations on the track are found. Note that they are different place cells from individual animals. (C) Mean Δf/f amplitude of place cells recorded each context–environment pair (F = familiar context, N = novel context). (D) Mean Δf/f frequency of place cells. For (C, D), only significant Δf/f events were used. See methods for details. (E) Place sensitivity in each context–environment pair. Significant main effect of environment (VR vs. TM, p = 0.0257). (F) Place cell specificity in each context–environment pair. Significant main effect of environment (VR vs. TM, p = 0.008). (G) Spatial information (bits/event) in each context–environment pair. Two-way repeated measures of ANOVA were used unless otherwise stated. Refer to Table Figure 5—figure supplement 2 for ANOVA table. For panels C–G, n = 6 mice (all mice were recorded in both VR and TM systems), 3253 cells in VR classified as significantly tuned place cells VR, and 6101 tuned cells in TM. For all panels, n.s. = non-significant, *p < 0.05, ***p < 0.001.
Figure 5—figure supplement 1
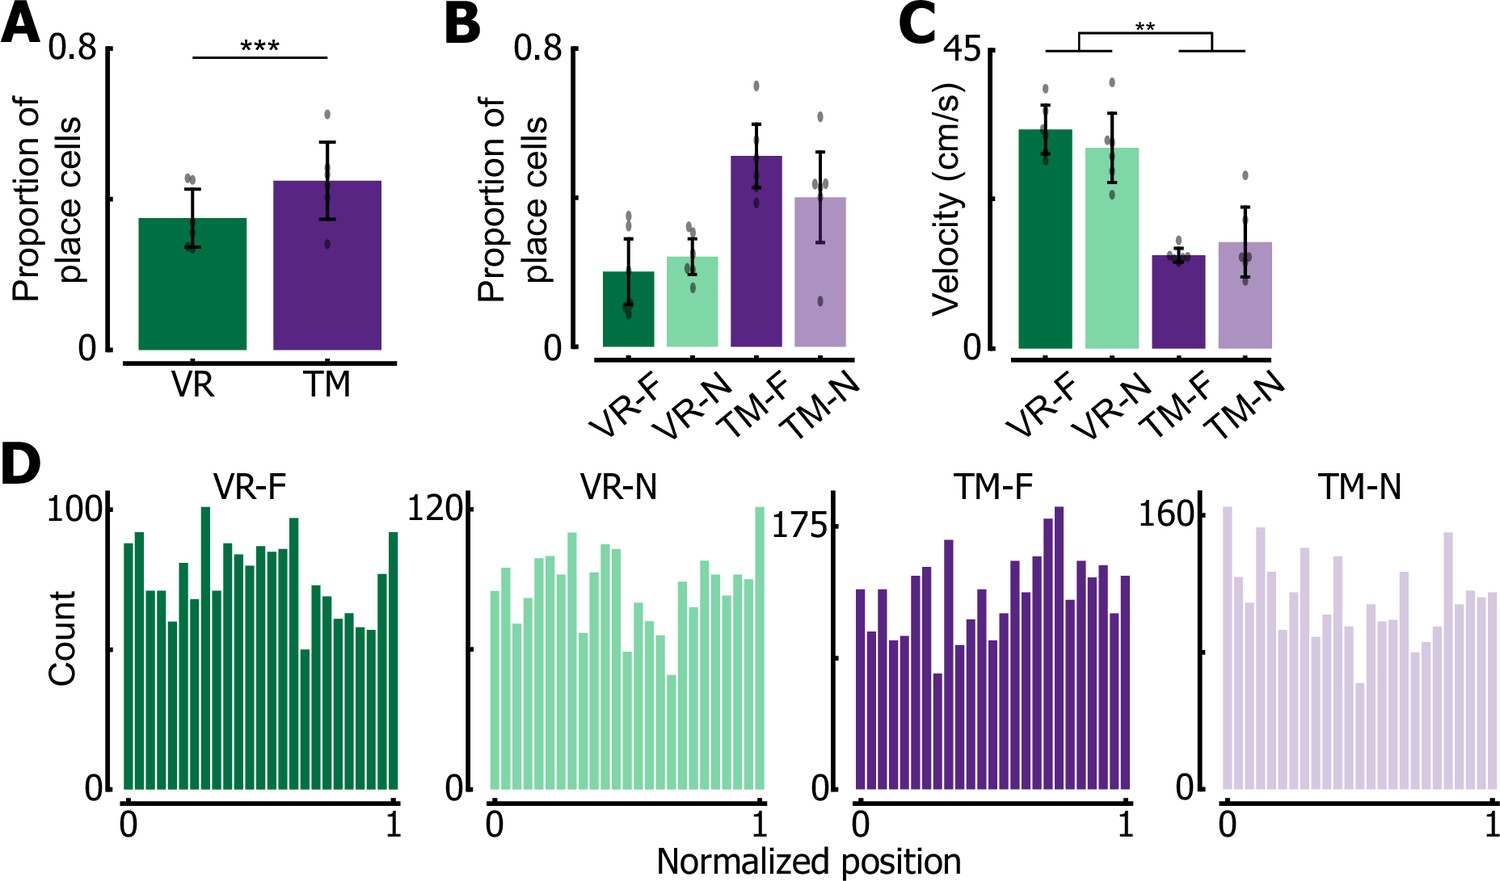
Additional place cell properties.
(A) Proportion of place cells in virtual reality (VR) and treadmill (TM). VR had significantly less regions of interest (ROIs) that were classified as a place cell compared to TM (two sample z-test, F = 14.96, p = 1.27e−50). (B) Proportion of place cells in each context–environment pair. (C) Mean velocity per lap in each context–environment pair. Significant main effect of environment (F(1,5) = 35.95, p = 0.0019). (D) Peak location of place cells recorded in each context–environment pair. Note that place cells tile entire track in all pairs. For all panels, **p < 0.01 ***p < 0.001.
Figure 5—figure supplement 2
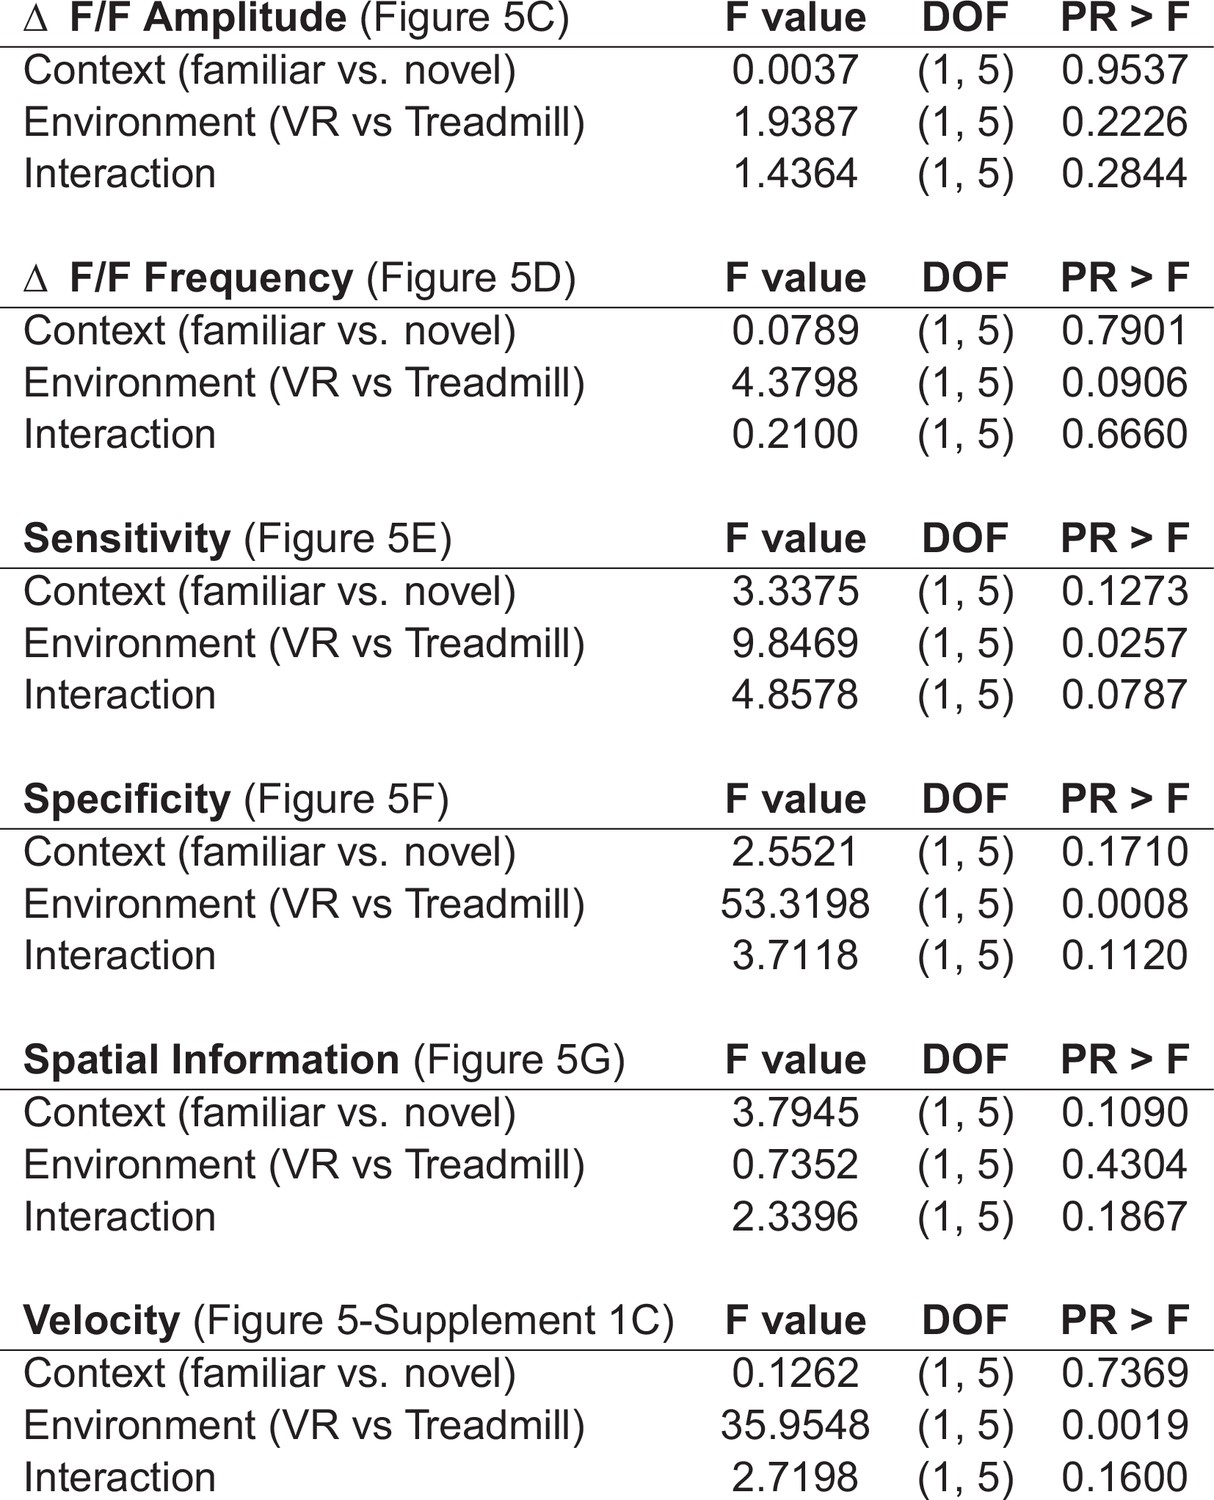
ANOVA results table of ANOVA results relating to Figure 5, Figure 5—figure supplement 1.
-
Figure 5—figure supplement 2—source data 1
Data file containing a digital copy of the information presented in Figure 5—figure supplement 2.
- https://cdn.elifesciences.org/articles/97433/elife-97433-fig5-figsupp2-data1-v1.xlsx
Figure 6
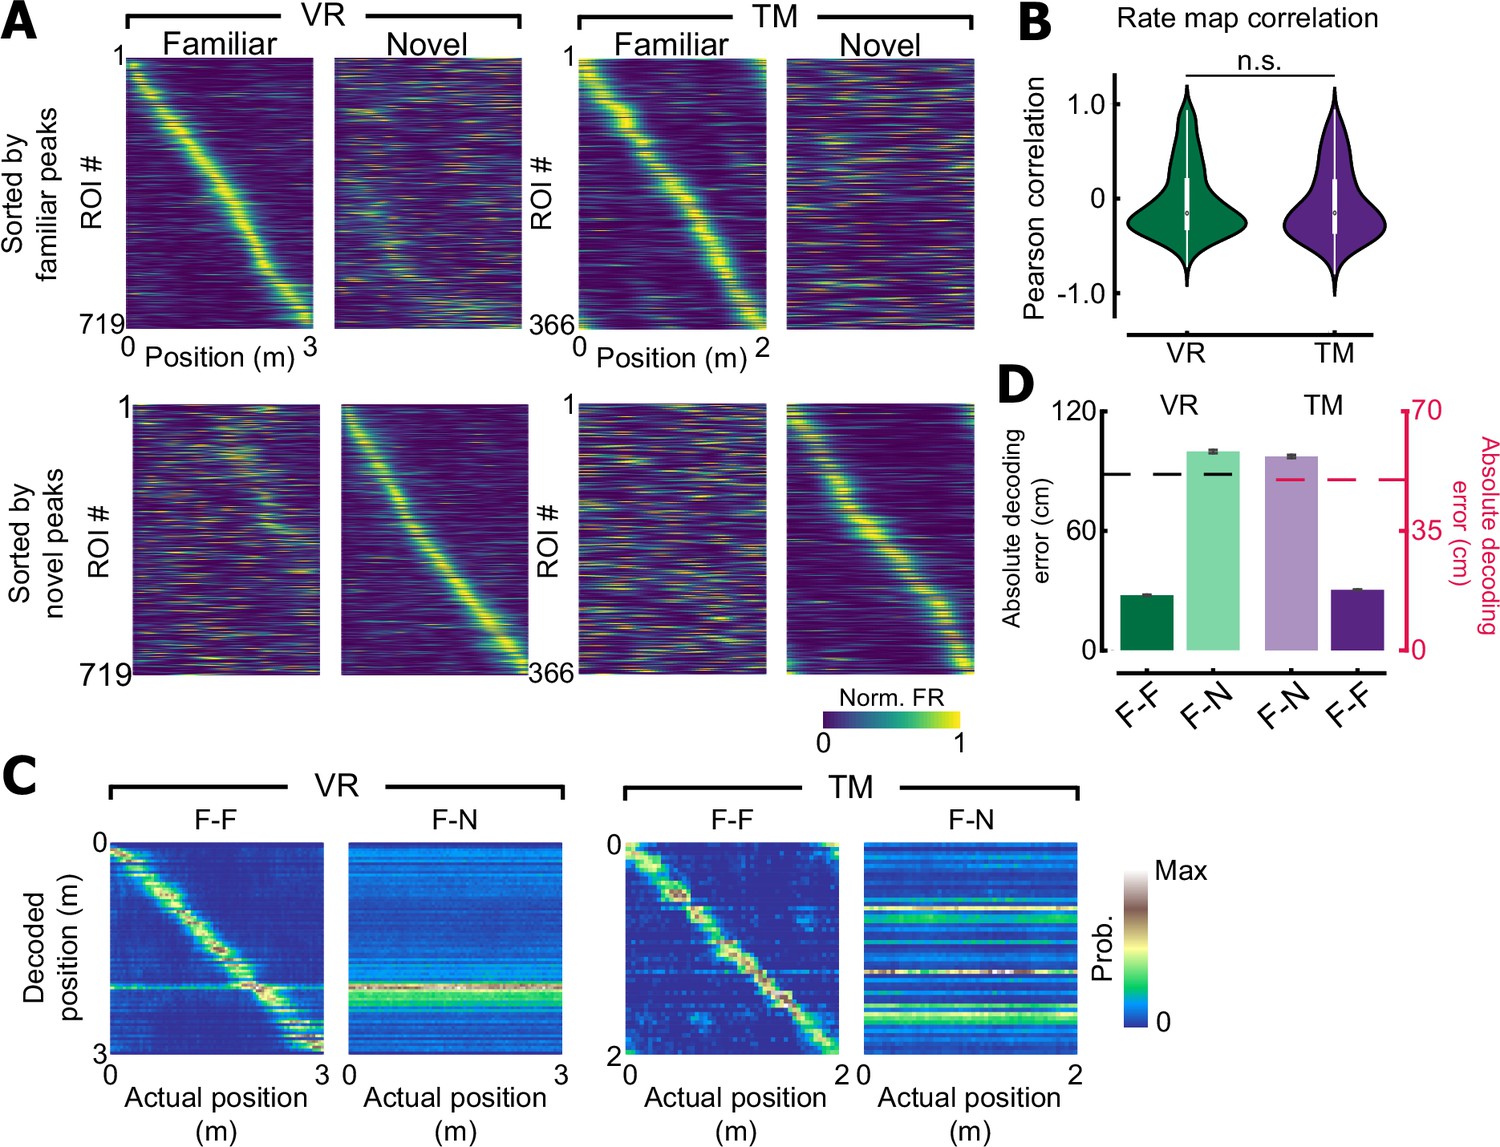
Place cells remap in both environments.
(A) Place cells recorded in virtual reality (VR) or treadmill (TM) sorted by their familiar peak (top) or novel peak (bottom) locations. A subset of CA1 neurons remaps when exposed to novel context in both VR and TM. (B) Rate map correlation of individual place cells between familiar and novel contexts. No difference was observed between VR and TM (Wilcoxon rank-sum test, F = 1.38, p = 0.17). (C) Confusion matrices of the Bayesian decoder for VR and TM. F–F indicates a model trained and tested with trials from the familiar context. F–N is a model trained with trials from familiar context, and tested with a novel trial. (D) Absolute decoding error for the maximum likelihood estimator. A dashed line indicates a chance level (88 ± 1.96 cm for VR/ 50 cm for TM, see methods). Note that when the decoder is trained and tested with familiar context trials, absolute decoding accuracy is below chance in both VR and TM (VR: 27.62 ± 1.44 cm, p < 0.01, TM: 17.78 ± 0.44 cm, p < 0.01, permutation test). However, when the decoder is trained with familiar context trials, but tested with novel context trials, decoding accuracy was increased to the chance level (VR: 99.80 ± 3.95 cm, p = 1.00, TM: 56.82 ± 2.46 cm, p = 1.00).
Additional files
Download links
A two-part list of links to download the article, or parts of the article, in various formats.
Downloads (link to download the article as PDF)
Open citations (links to open the citations from this article in various online reference manager services)
Cite this article (links to download the citations from this article in formats compatible with various reference manager tools)
An Intranet of Things approach for adaptable control of behavioral and navigation-based experiments
eLife 13:RP97433.
https://doi.org/10.7554/eLife.97433.3


