High-frequency terahertz stimulation alleviates neuropathic pain by inhibiting the pyramidal neuron activity in the anterior cingulate cortex of mice
- Department of Biochemistry and Molecular Biology, School of Basic Medicine, The Fourth Military Medical University, China
- Department of Anatomy, Histology and Embryology and K.K. Leung Brain Research Centre, The Fourth Military Medical University, China
- Laboratory of Optical Technology and Instrument for Medicine, Ministry of Education, College of Optical-Electrical and Computer Engineering, University of Shanghai for Science and Technology, China
- Innovation Laboratory of Terahertz Biophysics, National Innovation Institute of Defense Technology, China
- Information Materials and Intelligent Sensing Laboratory of Anhui Province, Anhui University, China
- School of Electronic and Information Engineering, Anhui University, China
- School of Physics, Peking University, China
Figures
Figure 1 with 1 supplement
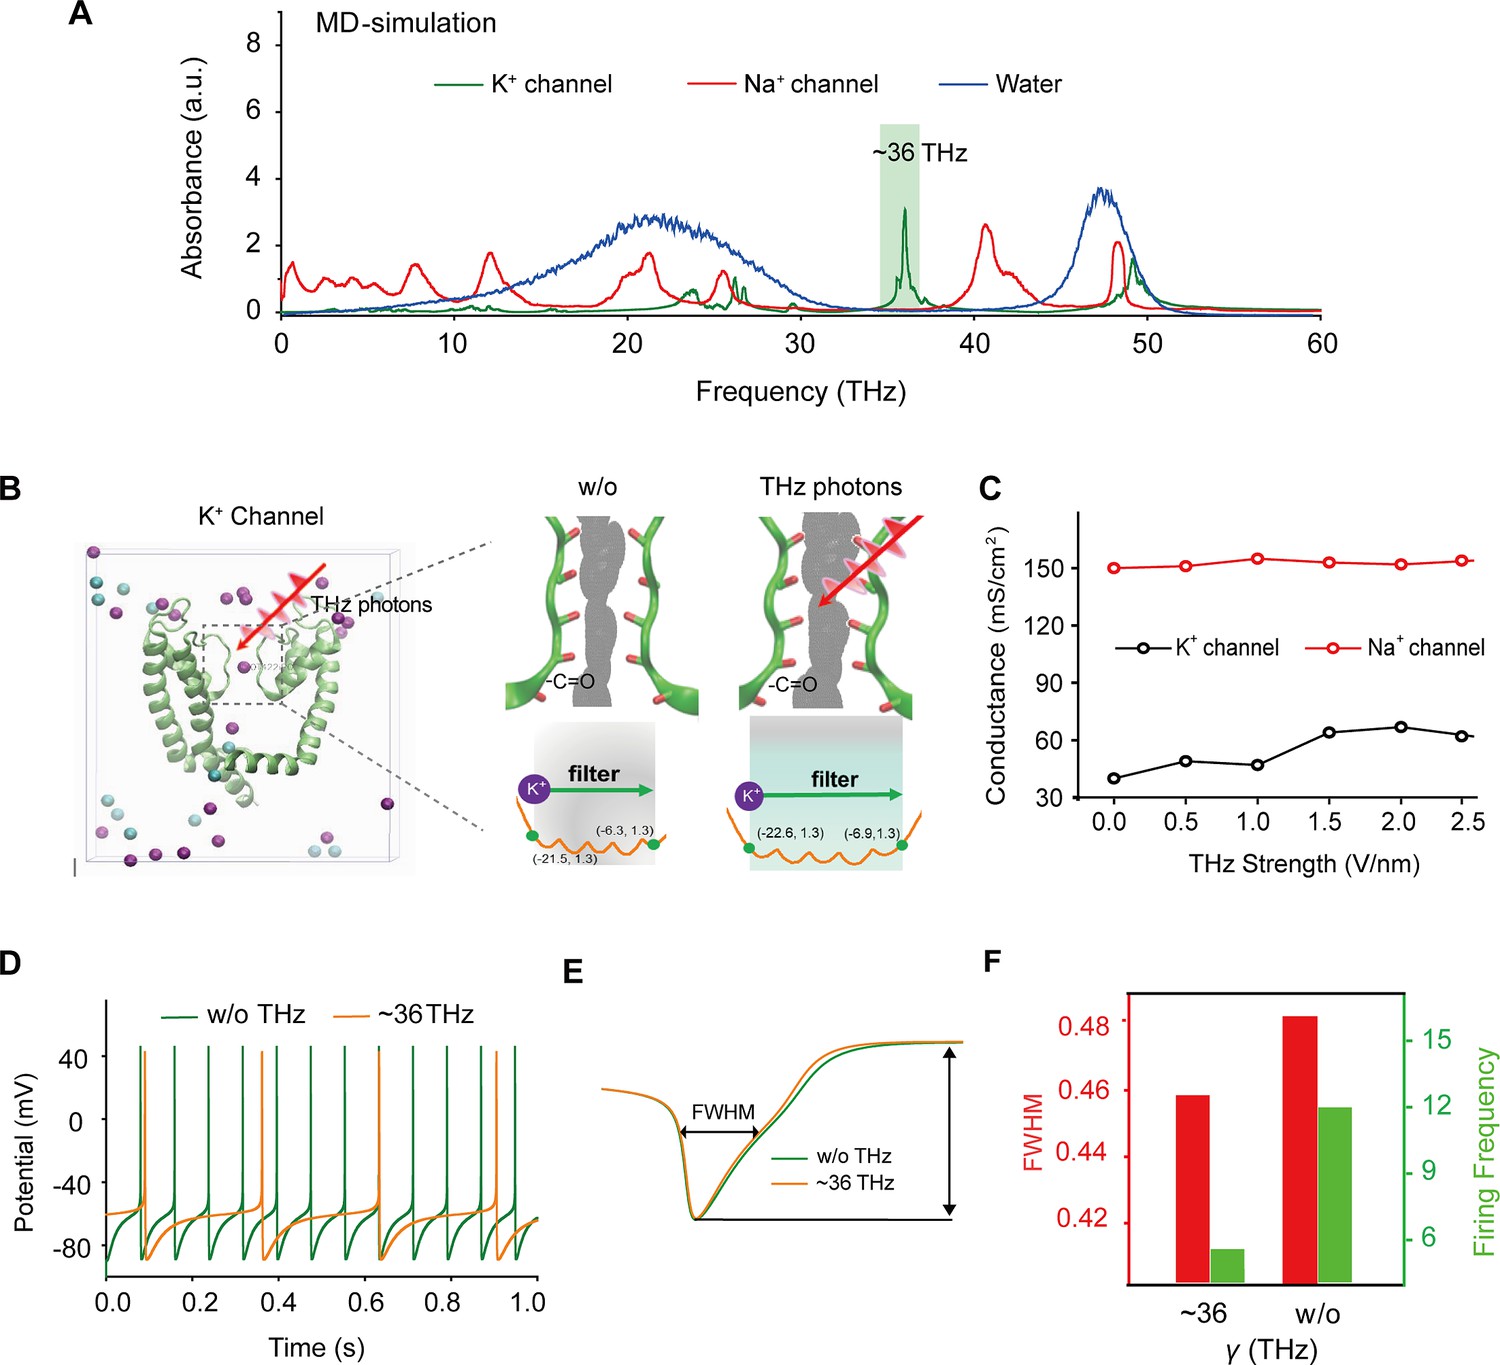
Specific frequency terahertz (THz) photons resonate the voltage-dependent potassium (Kv) channel and decrease the AP firing rate in cortical neurons through molecular dynamics simulation.
(a) Absorbance spectra of voltage-gated potassium/sodium ion channels and the bulk water. (b) The dynamic attributes of the Kv1.2 filter structure in pre- and post-exposure to HFTS. Purple balls represent the K+, and blue balls represent the Cl-. (c) The alterations in potassium/sodium ion conductance are consequent to the influence of HFTS. (d) Changes in the firing rate of APs of cortical neuron models before and after HFTS. (e) The FWHM of an AP pre- and post-HFTS. (f) Changes in FWHM and firing frequency with or without HFTS. HFTS, high-frequency terahertz stimulation. AP, action potential. FWHM, Full Wide of Half Maximum.
-
Figure 1—source data 1
Shows the videos of Kv channel transporting K+ with and without HFTS.
- https://cdn.elifesciences.org/articles/97444/elife-97444-fig1-data1-v1.zip
Figure 1—figure supplement 1
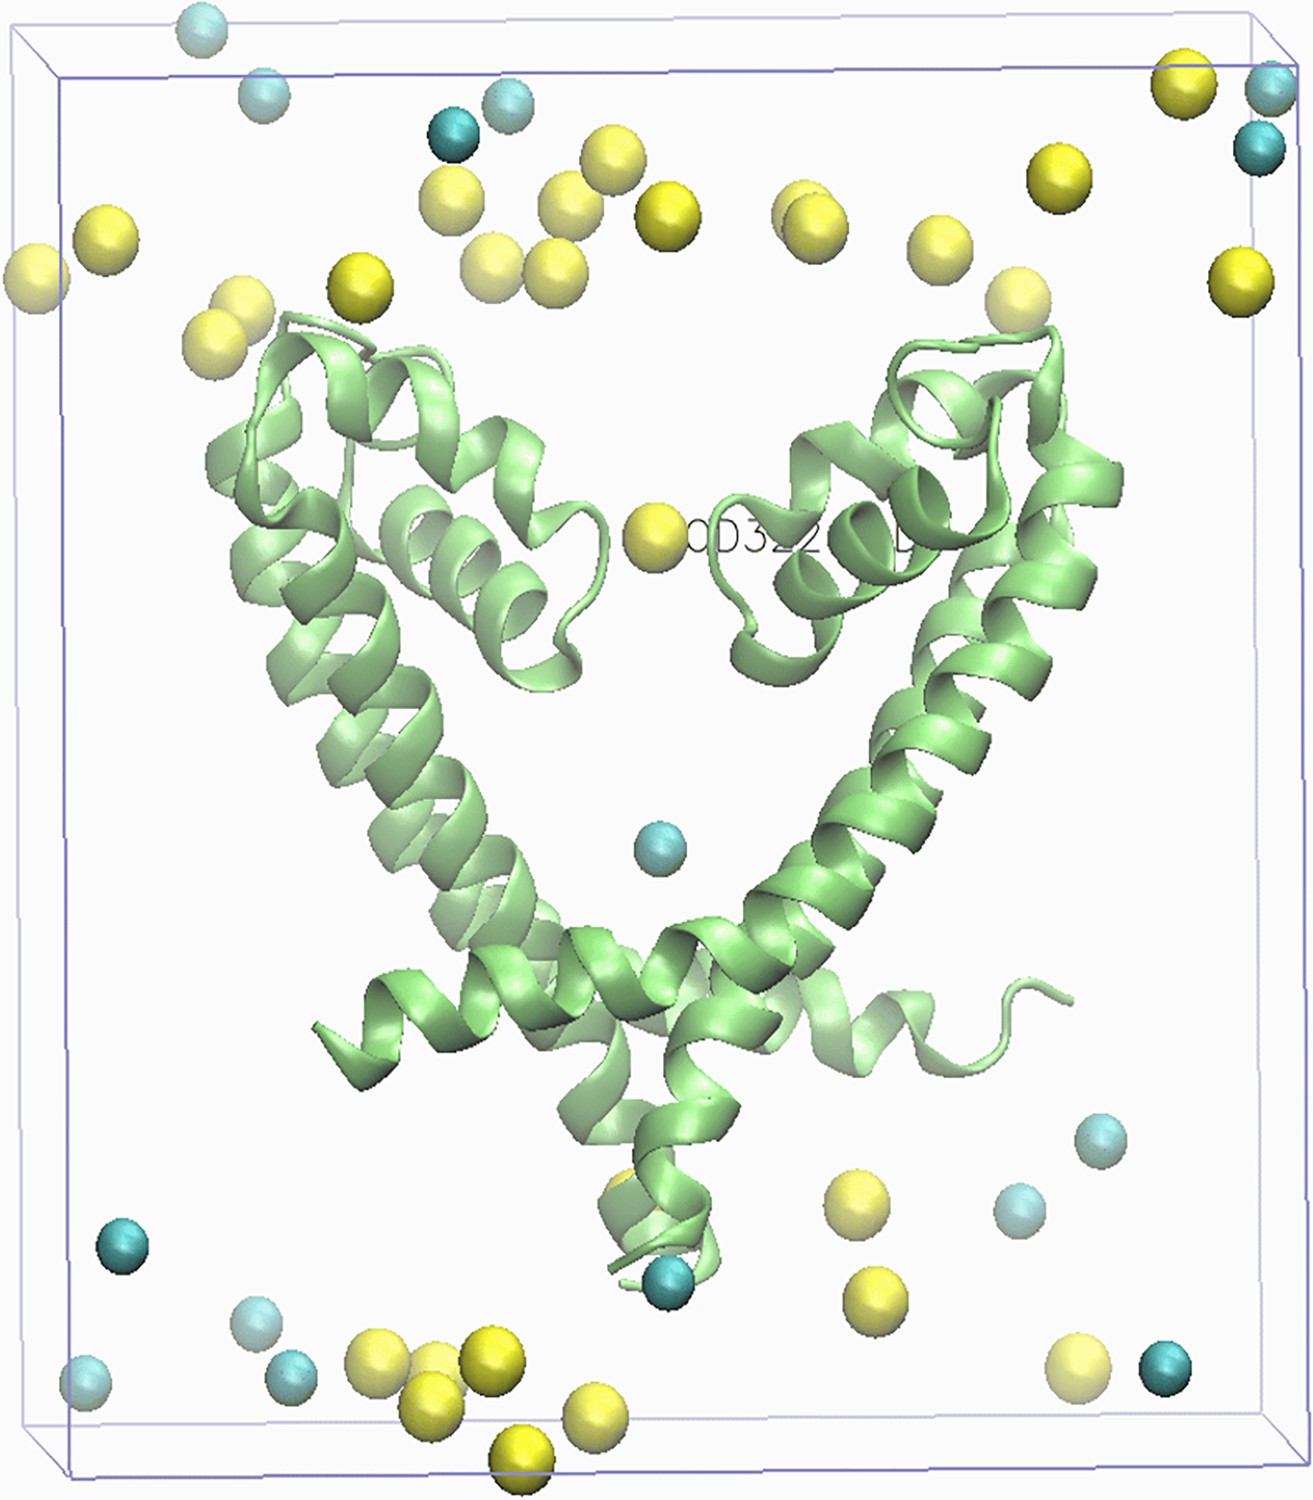
Sodium (Na+) channels (PDB ID: 3RVY) developed in this study with a clean view.
Yellow balls represent the Na+, and blue balls represent the Cl-.
Figure 2
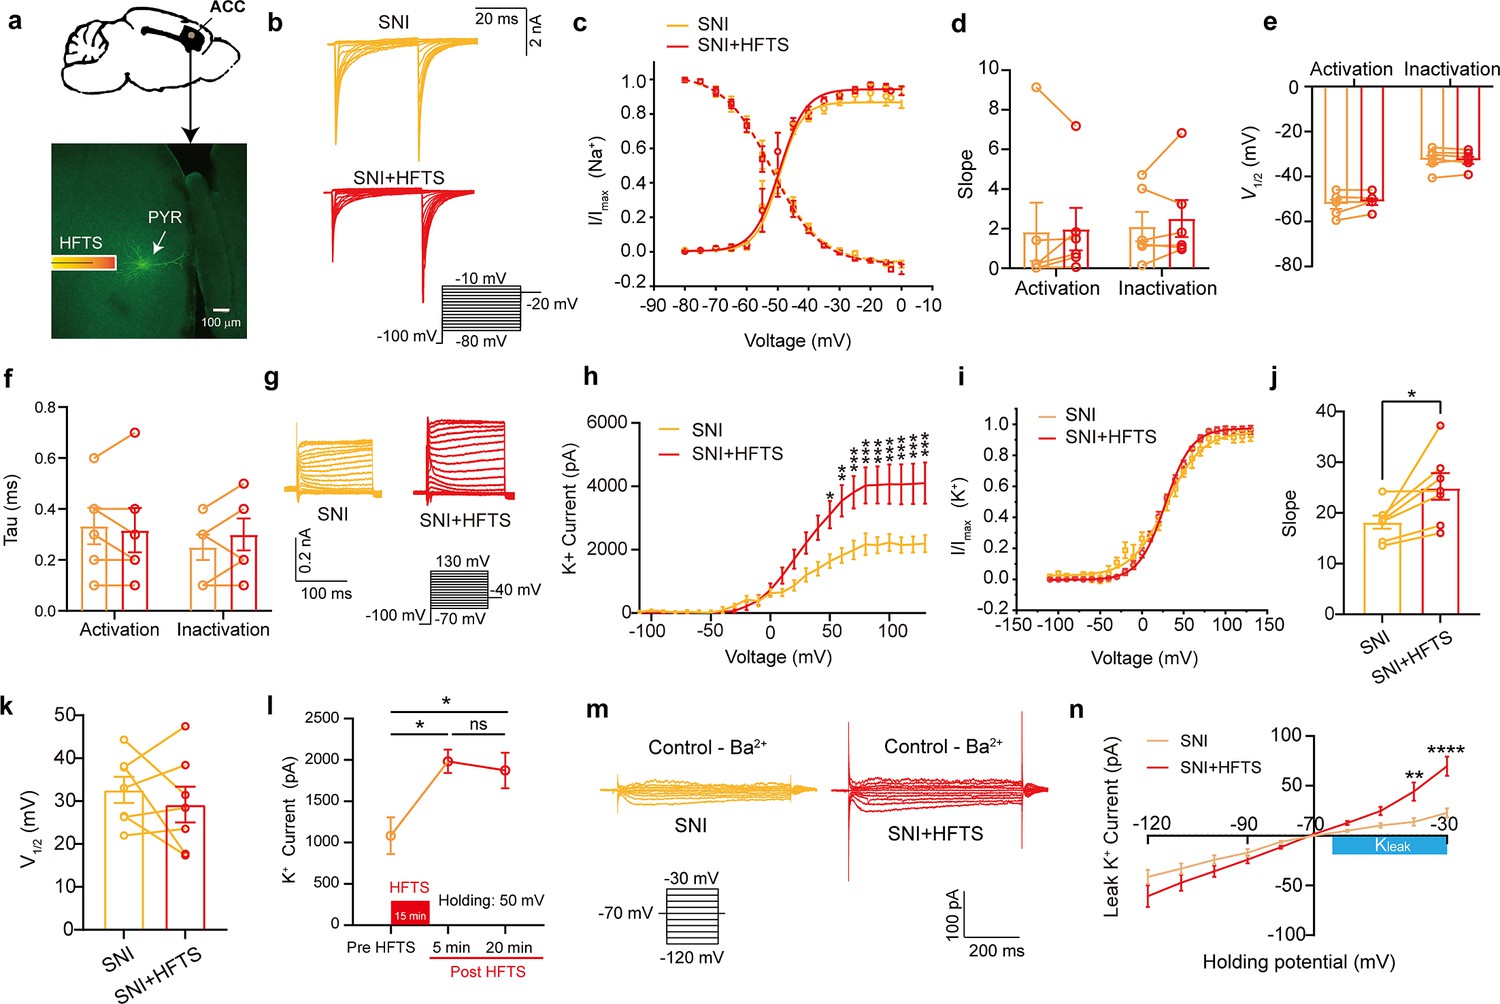
High-frequency terahertz stimulation (HFTS) enhances voltage-dependent potassium (Kv) channels and KLeak currents of pyramidal neurons in spared nerve injury (SNI) mouse in vitro.
(a) Anatomical location of ACC region in mice and a recorded pyramidal (PYR) neuron (biocytin-labeled, green). (b) Representative Nav currents without (orange) or with HFTS (red) under the given step voltage protocol. (c) The activation and inactivation curves of Nav currents with and without HFTS. (d-f) The corresponding slopes of the activation and inactivation curves (d), the comparison of the half-activation and inactivation voltages (e), and the time constants (tau) of half-activation voltage/half-inactivation voltage (f). (g) Representative Kv currents are evoked by a series of step voltages (inset) without (orange) or with HFTS (red). (h) I-V plots constructed from the values of traces shown in (g). (SNI vs. SNI +HFTS: F(1, 10)=6.846, p<0.0001, nSNI = 6, nSNI+HFTS = 6; Two-way ANOVA followed by post hoc comparison using the Šídák’s multiple comparisons test). (i) The activation curves of the Kv currents with and without HFTS. (j) The corresponding slopes of the activation curves (SNI vs. SNI +HFTS: t=5.872, p=0.0011, n=7, unpaired t-test. **p<0.01, ****p<0.0001). (k) The half-activation voltages of the activation curves. (l) Changes in the impact of Kv current post-HFTS. (F(4, 15)=4.19, p=0.0178, n=4; One-way ANOVA followed by post hoc comparison using the Šídák’s multiple comparisons test). (m) Representative KLeak currents evoked by a series of step voltages (inset) without (orange) or with HFTS (red). (n) I-V plots constructed from the values of traces shown in (m). (SNI vs. SNI +HFTS: F(1, 12)=1.688, p=0.2182, nSNI = 7, nSNI+HFTS = 7; Two-way ANOVA followed by post hoc comparison using the Šídák’s multiple comparisons test).
-
Figure 2—source data 1
Original data for Figure 2.
- https://cdn.elifesciences.org/articles/97444/elife-97444-fig2-data1-v1.zip
Figure 3
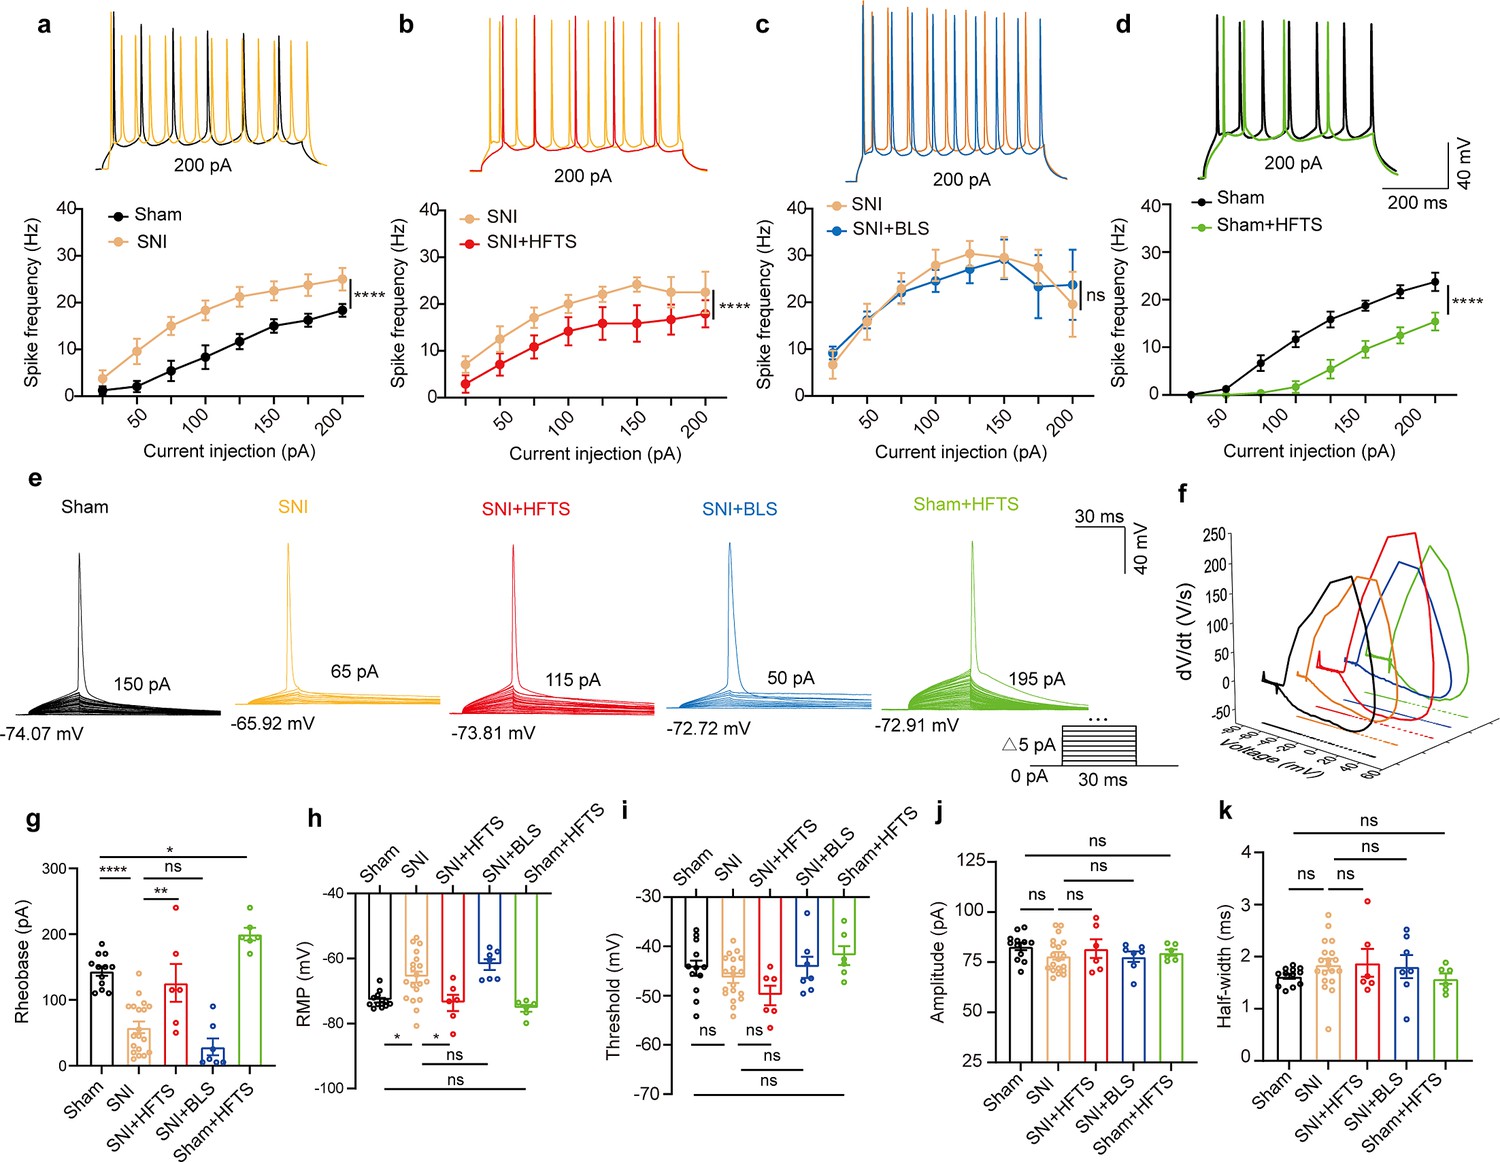
High-frequency terahertz stimulation (HFTS) reduces the action potentials (APs) firing rate of pyramidal neurons in spared nerve injury (SNI) and sham mice in vitro.
(a–d) Representative traces (upper panels) and line charts (lower panels) show the changes of evoked spikes of pyramidal neurons in different groups. (Sham vs. SNI: F(1, 40)=124.2, p<0.001, nsham = 6, nSNI = 6; SNI vs. SNI + HFTS: F(1, 40)=23.13, p<0.0001, nSNI = 6, nSNI+HFTS=6; SNI vs. SNI + BLS: F(1, 40)=0.1401, p=0.7101, nSNI = 6, nSNI+BLS = 6; Sham vs. Sham + HFTS: F(1, 40)=87.29, p<0.0001, nSham = 6, nSham+HFTS = 6. Two-way ANOVA followed by post hoc comparison using the Šídák’s multiple comparisons test). (e) Superimposed traces showing the single AP evoked by threshold current stimulation in different groups. (f) Phase plots of AP traces in each group. (g) Histograms show the statistical comparison of rheobase in each group. (Sham vs. SNI: q=8.456, p<0.0001, nsham = 12, nSNI = 19; SNI vs. SNI + HFTS: q=5.264, p<0.01, nSNI = 19, nSNI+HFTS = 6; Sham vs. Sham + HFTS: q=4.098, p<0.05, nSNI = 19, nSNI+HFTS = 6. one-way ANOVA followed by post hoc comparison using the Tukey’s multiple comparisons test). (h) The resting membrane potential (RMP) in each group (Sham vs. SNI: q=4.887, p<0.05, nsham = 12, nSNI = 19; SNI vs. SNI +HFTS: q=4.29, p<0.05, nSNI = 19, nSNI+HFTS = 6; Sham vs. Sham + HFTS: q=1.261, p>0.05, nSNI = 19, nSNI+HFTS = 6. one-way ANOVA followed by post hoc comparison using the Tukey’s multiple comparisons test). (i–k) HFTS has no significant effect on the threshold, amplitude, and half-width of APs in pyramidal neurons.*p<0.05, **p<0.01, ***p<0.001, ****p<0.0001, ns, p>0.05. BLS, blue light stimulation.
-
Figure 3—source data 1
Original data for Figure 3.
- https://cdn.elifesciences.org/articles/97444/elife-97444-fig3-data1-v1.zip
Figure 4 with 1 supplement
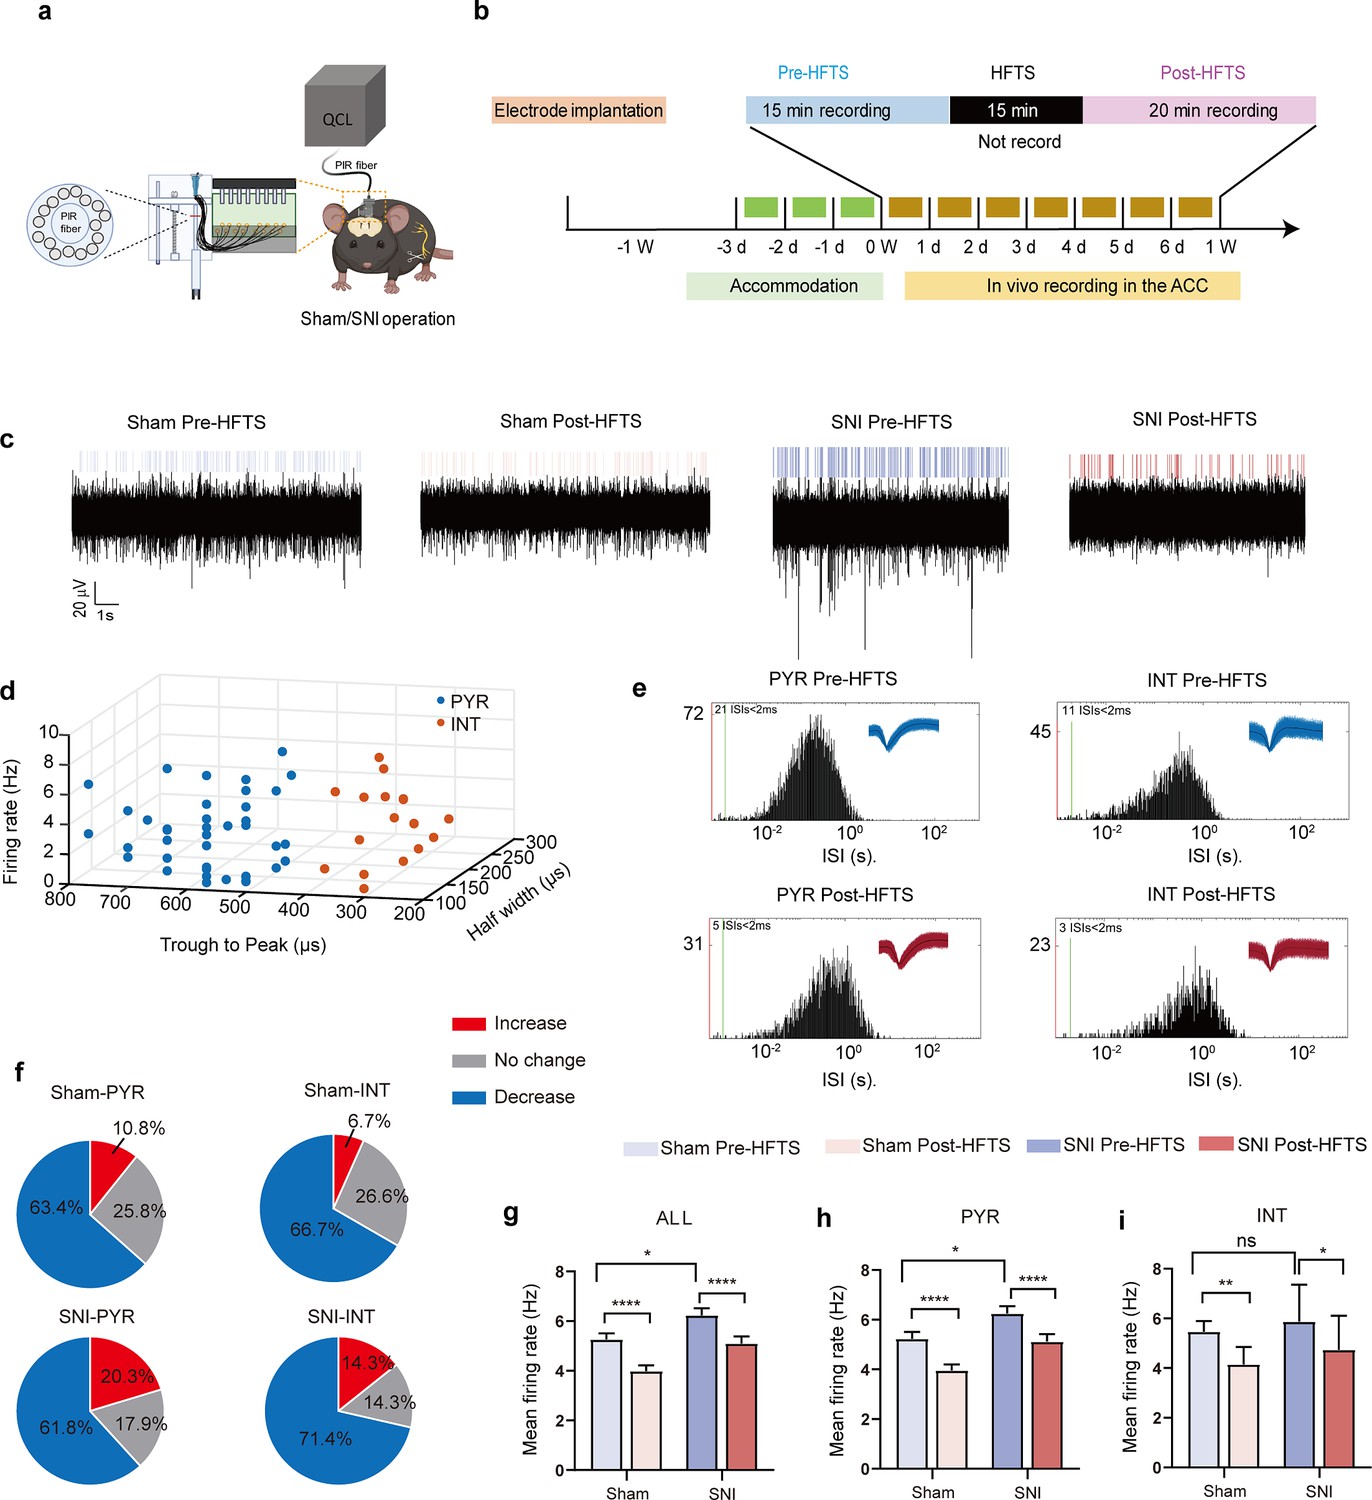
High-frequency terahertz stimulation (HFTS) decreases the mean firing rate of pyramidal neurons in the anterior cingulate cortex (ACC) in both sham and spared nerve injury (SNI) awake mice.
(a) Schematic diagram of the single-unit recording of the ACC using an in vivo multi-channel recording technique. (b) The timeline and the stimulating pattern of HFTS on an awake mouse. (c) Example recording signals of ACC neurons before and after HFTS application in sham and SNI groups, respectively. (d) ACC neurons are classified as pyramidal (PYR) cells and interneurons (INT) using k-means cluster-separation algorithm based on their electrophysiological properties. (e) Histograms of the inter-spike intervals (ISI) from the spikes of a PYR and an INT in pre-and post-HFTS recording period. Insets at the top right corner show the waveforms of the detected single unit. (f) Pie charts summarize the changes in the firing rate of PYR and INT in sham and SNI groups. Pre vs. post-HFTS, Wilcoxon rank-sum test. (g) The mean firing rate of all recorded neurons in sham and SNI groups before and after HFTS. Sham group (p<0.0001, n=108, Wilcoxon matched-paired signed rank test), SNI group (p<0.0001, n=130, Wilcoxon matched-paired signed rank test), SNI pre-HFTS vs. Sham pre-HFTS (p=0.0447, Mann-Whitney test). (h) The mean firing rate of PYR neurons in sham and SNI groups before and after HFTS. Sham group (p<0.0001, n=93, Wilcoxon matched-paired signed rank test), SNI group (p<0.0001, n=123, Wilcoxon matched-paired signed rank test), SNI pre-HFTS vs. Sham pre-HFTS (p=0.0274, Mann-Whitney test). (i) The mean firing rate of INT neurons in sham and SNI groups before and after HFTS. Sham group (p=0.0084, n=15, Wilcoxon matched-paired signed rank test), SNI group (p=0.0313, n=7, Wilcoxon matched-paired signed rank test), SNI pre-HFTS vs. Sham pre-HFTS (p=0.3322, Mann-Whitney test). *p<0.05, **p<0.01, ****p<0.0001, ns, p>0.05.
-
Figure 4—source data 1
Shows the original data from Figure 4.
- https://cdn.elifesciences.org/articles/97444/elife-97444-fig4-data1-v1.zip
Figure 4—figure supplement 1
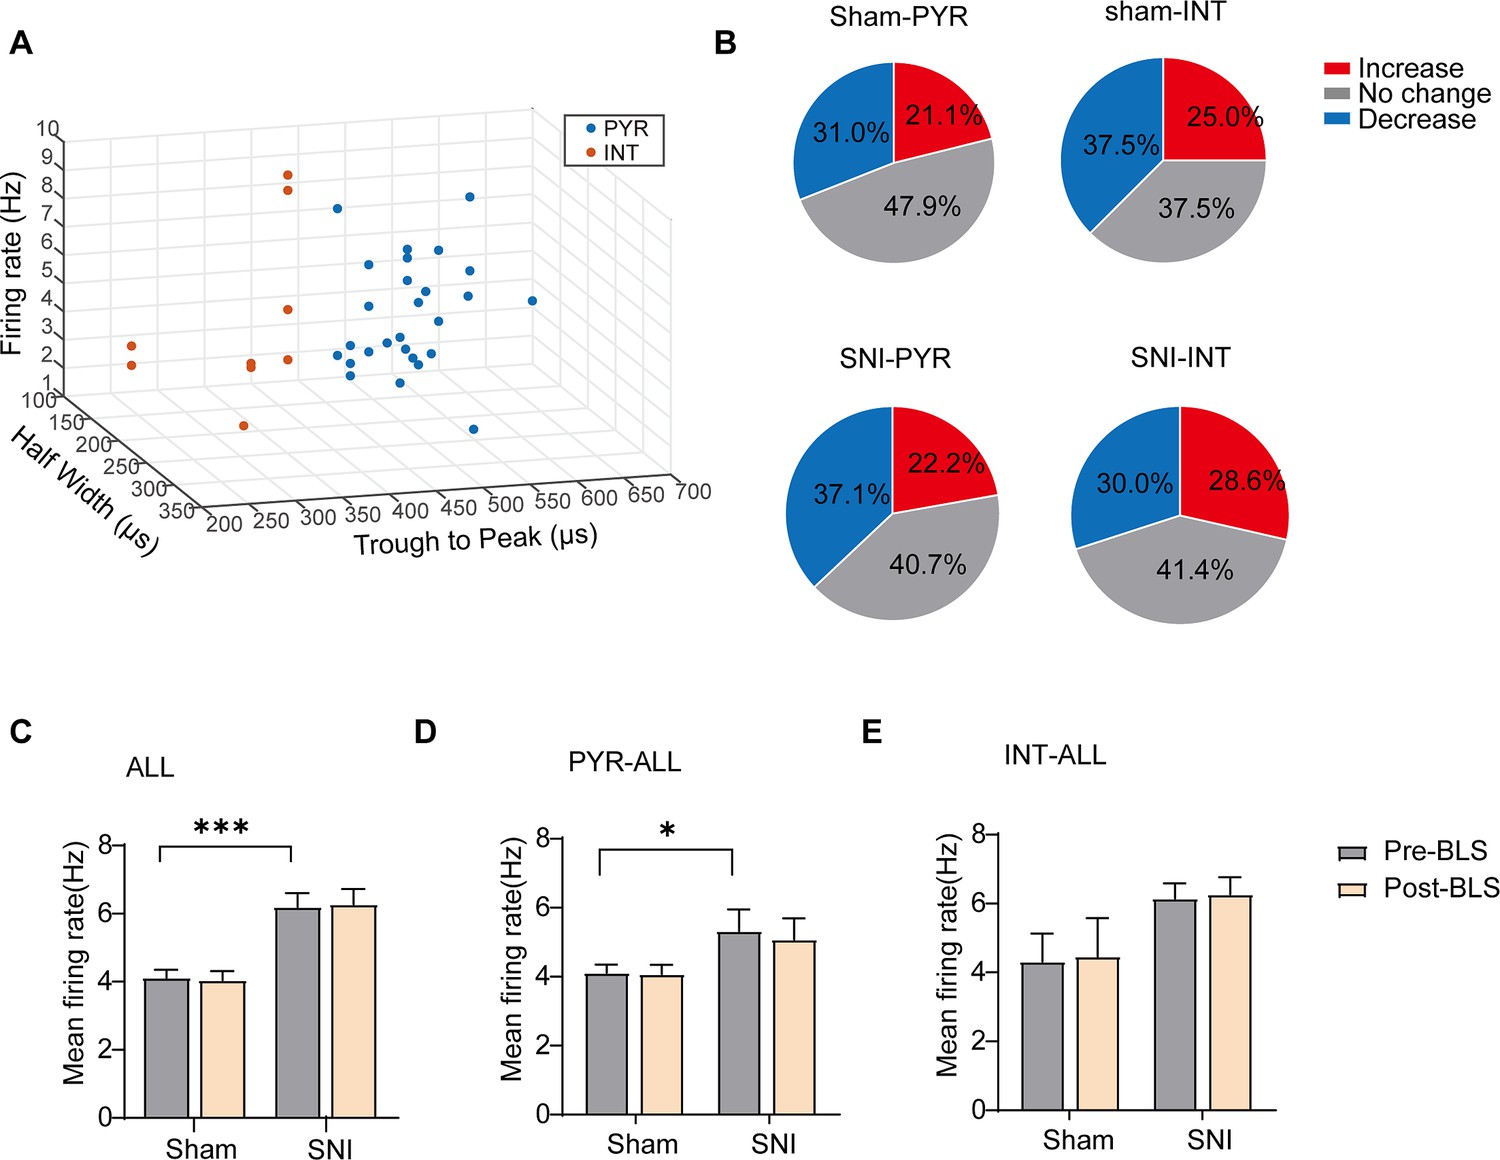
Blue light stimulation (BLS) has no effect on the mean firing rate on anterior cingulate cortex (ACC) neurons in both sham and SNI mice.
(a) Partially recorded ACC neurons were classified as pyramidal (PYR) cells and interneurons (INT) using a k-means cluster-separation algorithm based on their electrophysiological properties.(b) Pie charts summarize the changes in the firing rate of PYR (70/78, 27/97) and INT (n=8/78, 70/97) in sham (n=78) and SNI (n=97) groups Pre vs. post-BLS, Wilcoxon rank-sum test and paired t-test.(c) The mean firing rate of all neurons in sham and SNI groups before and after BLS. Sham group (p0.05, Wilcoxon matched-paired signed rank test), SNI group (p>0.05, Wilcoxon matched-paired signed rank test), SNI pre-HFTS vs. Sham pre-HFTS (p<0.001, Mann-Whitney test). (d) The mean firing rate of PYR neurons in sham and SNI groups before and after BLS. Sham group (p>0.05, Wilcoxon matched-paired signed rank test), SNI group (p>0.05, Wilcoxon matched-paired signed rank test), SNI pre-HFTS vs. Sham pre-HFTS (p<0.05, Mann-Whitney test).(e) The mean firing rate of INT neurons in sham and SNI groups before and after BLS. Sham group (p>0.05, Wilcoxon matched-paired signed rank test), SNI group (p>0.05, Wilcoxon matched-paired signed rank test). SNI pre-HFTS vs. Sham pre-HFTS (p>0.05, Mann-Whitney test).*p<0.05,****p<0.0001, ns, p>0.05. PYR, pyramidal neurons. SNI, spared nerve injury.
Figure 5
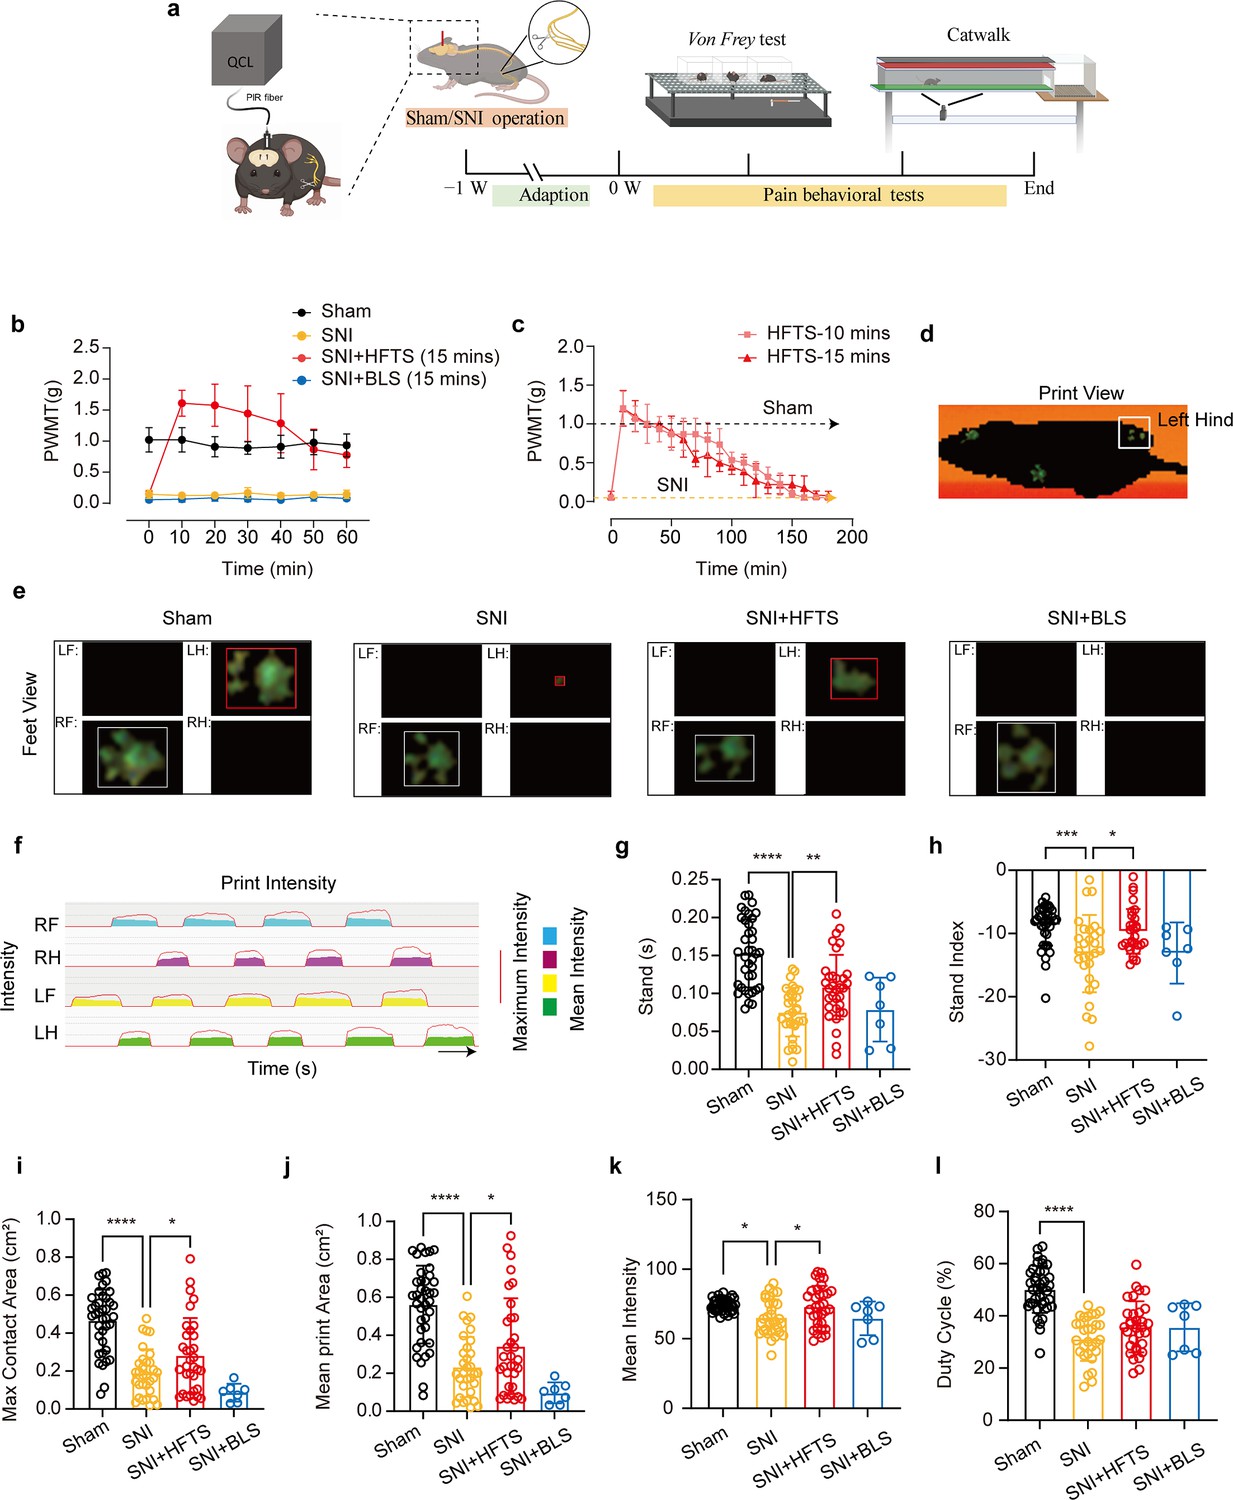
High-frequency terahertz stimulation (HFTS) alleviates neuropathic pain of spared nerve injury (SNI) mice through pain behavior tests.
(a) Schematic of the establishment of neuropathic pain (NP) model, the application of HFTS in anterior cingulate cortex (ACC) region, and the following behavior tests including Von Frey test and Catwalk analysis. (b) HFTS increases the paw withdrawal mechanical thresholds (PWMTs) compared to the SNI model (F(18, 140)=12.65. p<0.0001. Sham vs. SNI: p<0.0001; SNI vs. SNI + HFTS: p<0.0001; n=6 in each group. Two-way ANOVA repeated measures followed by post hoc comparison using the Šídák’s multiple comparisons test). (c) Duration of the analgesic effect with HFTS for 10 mins and 15 min. (d) The print view of a mouse. (e) The feet view of the left front (LF), left hind (LH), right front (RF), and right hind (RH) in the groups of sham, SNI, SNI + HFTS, and SNI + BLS, respectively. (f) The step sequence of a sham mouse who passing through the glass pane, the red line represents the maximum intensity of each foot, and the color box represents the mean intensity of the corresponding print during walking. (g) HFTS increases the LH stand time of SNI mice (sham vs. SNI: p<0.0001; SNI vs. SNI + HFTS: p<0.01). (h) HFTS increases the LH stand index of SNI mice (sham vs. SNI: p<0.001; SNI vs. SNI + HFTS: p<0.05). (i) HFTS increases the LH max contact area of SNI mice (sham vs. SNI: p<0.0001; SNI vs. SNI + HFTS: p<0.05). (j) HFTS increases the LH mean print area of SNI mice (sham vs. SNI: p<0.0001; SNI vs. SNI + HFTS: p<0.05; SNI vs. SNI + BLS: p<0.05). (k) HFTS increases the LH mean intensity of SNI mice (sham vs. SNI: p<0.05; SNI vs. SNI + HFTS: p<0.05). (l) HFTS has no significance for the pain behavior parameter of the duty cycle. *p<0.05, **p<0.01, ***p<0.001, ****p<0.0001. One-way ANOVA (f–k) followed by post hoc comparison using the Tukey’s multiple comparisons test. nSham = 38, nSNI = 35, nSNI+HFTS = 34, nSNI+BLS = 9.
-
Figure 5—source data 1
Provides videos of the behavioral results in mice from each group.
- https://cdn.elifesciences.org/articles/97444/elife-97444-fig5-data1-v1.zip
Figure 6
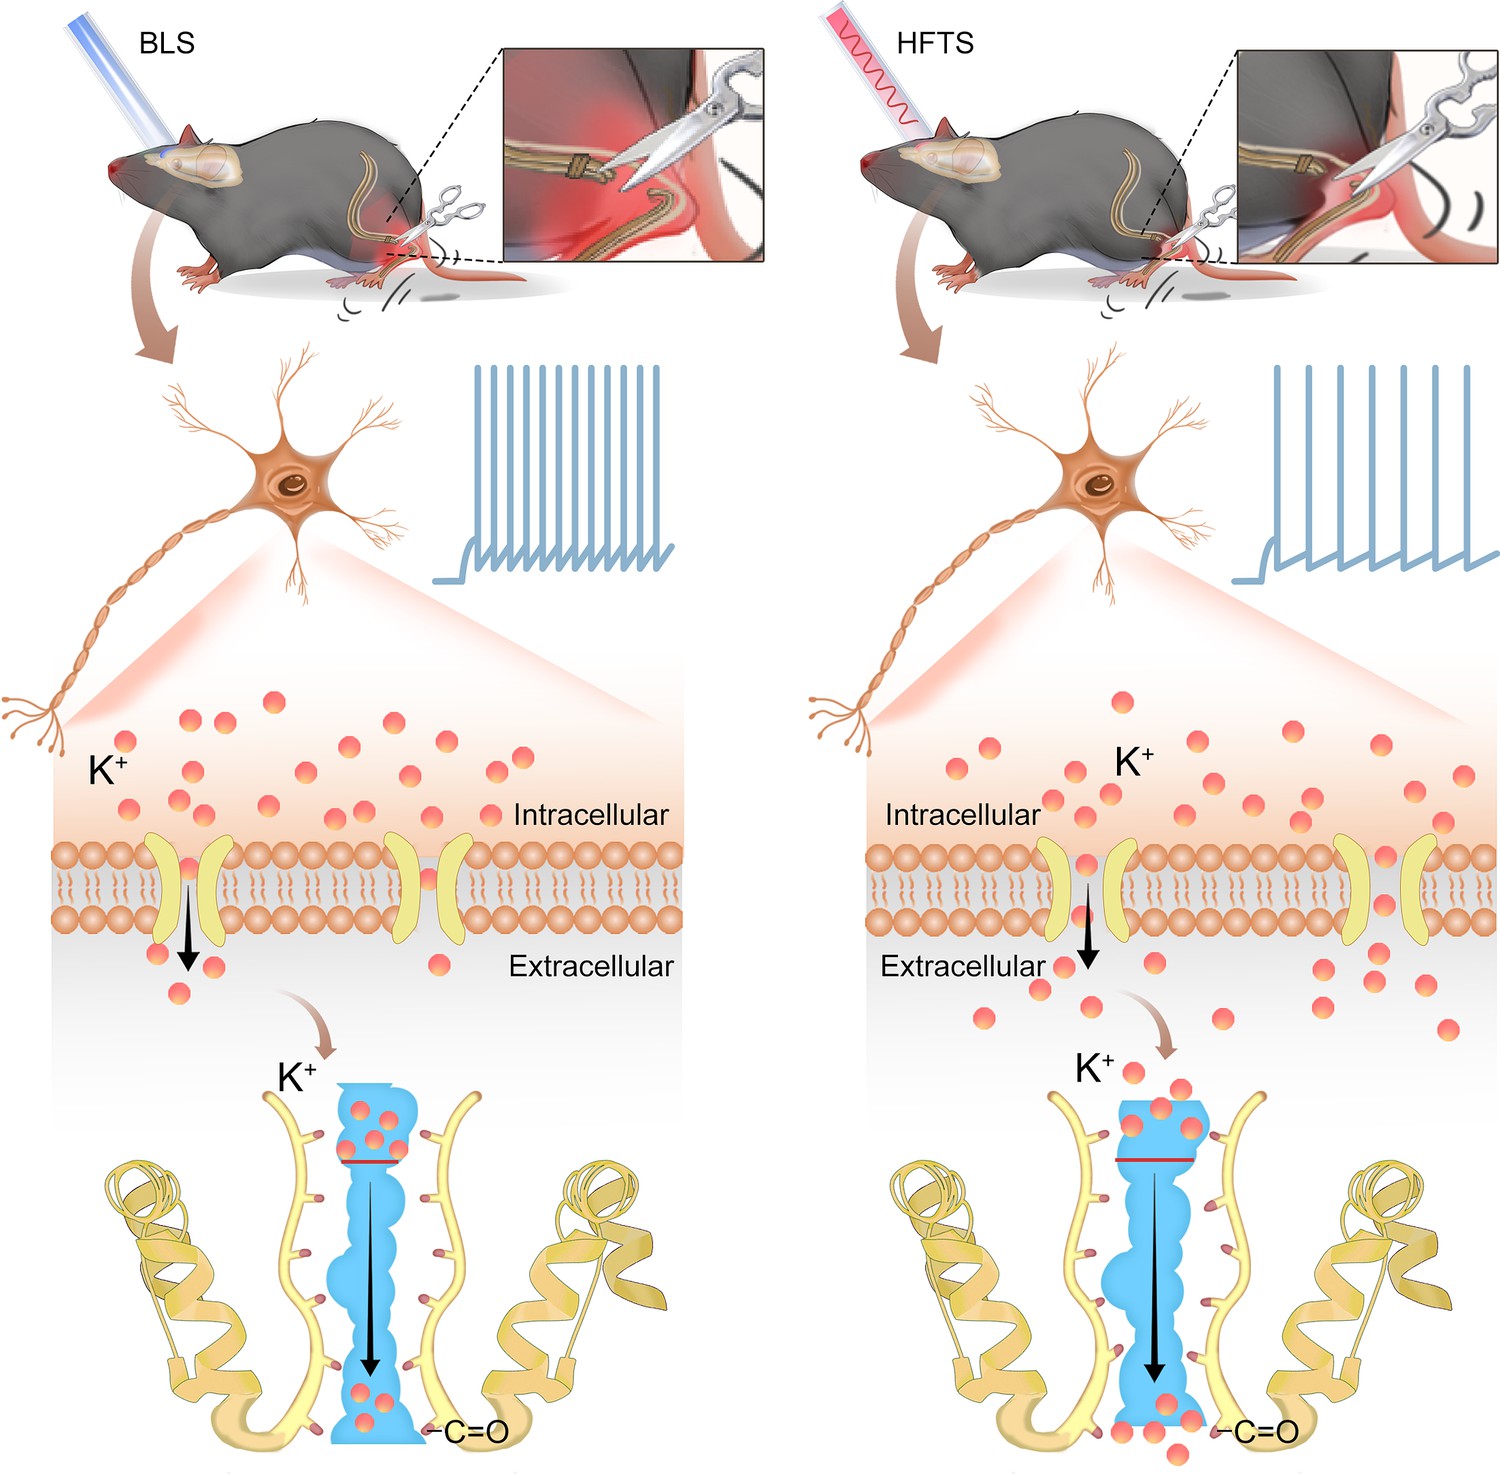
Schematic diagram shows the mechanism of high-frequency terahertz stimulation (HFTS) in alleviating neuropathic pain.
The left panel shows the group with blue light stimulation (BLS) and the right panel shows the group with HFTS.
Additional files
-
Supplementary file 1
Statistical data for Figure 2.
(a) The Kv current to different voltage in PYR of SNI mice before and after HFTS. (b) Changes of the Kv current impact by HFTS over time. (c) The Kleakcurrent to different voltage in PYR of SNI mice before and after HFTS
- https://cdn.elifesciences.org/articles/97444/elife-97444-supp1-v1.docx
-
Supplementary file 2
Statistical data for Figure 3.
(a) The spike frequency in pyramidal (PYR) of anterior cingulate cortex (ACC) before and after spared nerve injury (SNI). (b) The spike frequency in PYR of SNI mice before and after high-frequency terahertz stimulation (HFTS). (c) The spike frequency in PYR of spared nerve injury (SNI) mice before and after blue light stimulation (BLS). (d) The spike frequency in PYR of Sham mice before and after HFTS
- https://cdn.elifesciences.org/articles/97444/elife-97444-supp2-v1.docx
-
MDAR checklist
- https://cdn.elifesciences.org/articles/97444/elife-97444-mdarchecklist1-v1.pdf
-
Source code 1
Processing in vivo electrophysiological data code.
- https://cdn.elifesciences.org/articles/97444/elife-97444-code1-v1.zip
Download links
A two-part list of links to download the article, or parts of the article, in various formats.
Downloads (link to download the article as PDF)
Open citations (links to open the citations from this article in various online reference manager services)
Cite this article (links to download the citations from this article in formats compatible with various reference manager tools)
High-frequency terahertz stimulation alleviates neuropathic pain by inhibiting the pyramidal neuron activity in the anterior cingulate cortex of mice
eLife 13:RP97444.
https://doi.org/10.7554/eLife.97444.3


