Target-specific requirements for RNA interference can arise through restricted RNA amplification despite the lack of specialized pathways
- Department of Cell Biology and Molecular Genetics, Biological Sciences Graduate Program, University of Maryland, United States
Figures
Figure 1 with 2 supplements
RNA interference (RNAi) of two somatic targets shows stark differences in their requirements for MUT-16 and RDE-10.
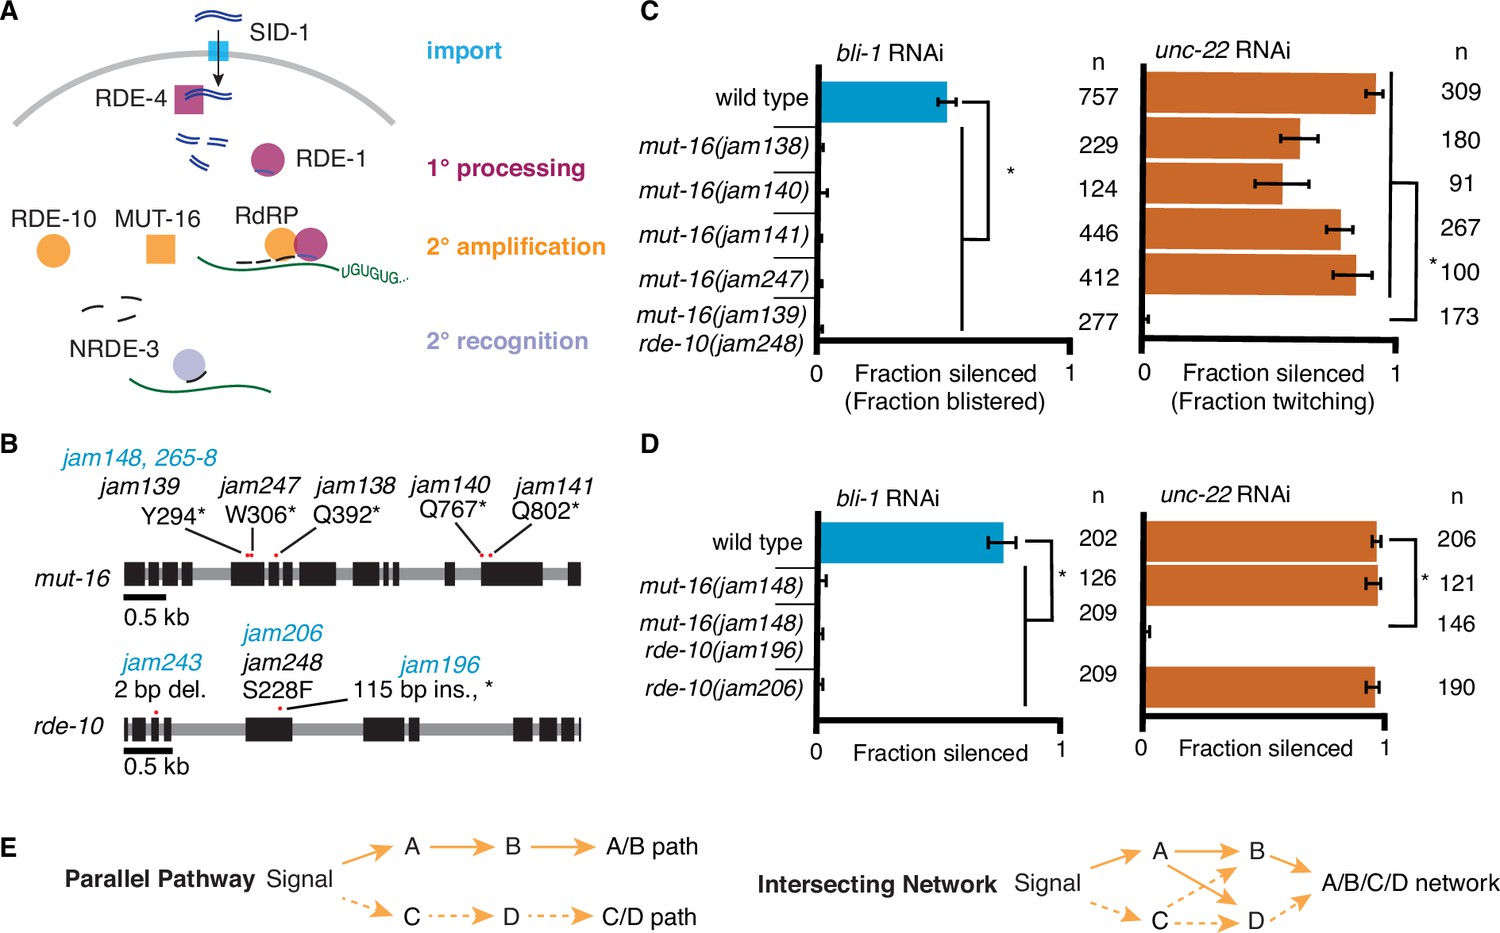
(A) Overview of RNAi in somatic cells. Double-stranded RNA (dsRNA, blue) enters the cell through the importer SID-1 (import, teal), after which it is processed by the dsRNA-binding protein RDE-4 and the endonuclease Dicer into 1° short interfering RNAs (siRNAs) that are bound by the primary Argonaute RDE-1 (1° processing, pink). mRNA transcripts (green) recognized by these 1° siRNAs are modified after cleavage by the 3′ addition of UG repeats (pUG RNA) and act as templates for the amplification of 2° siRNAs aided by the intrinsically disordered protein MUT-16, the Maelstrom domain-containing protein RDE-10, and RNA-dependent RNA polymerases (2° amplification, orange). These 2° siRNAs can bind secondary Argonaute(s) (e.g., NRDE-3), which can then recognize additional complementary targets (2° recognition) and cause gene silencing. See text for details. (B) Gene schematics depicting the mutant alleles found in a genetic screen (black) and/or created using genome editing (blue). Black boxes indicate exons and red dots indicate locations of mutations. Allele names (e.g., jam139) and expected amino acid change in the corresponding proteins (e.g., mutation of a tyrosine codon to a stop codon, Y294*) are indicated. See Figure 1—figure supplement 1 for details of genetic screen. (C, D) Response to bli-1 or unc-22 RNAi in different mutants. For each mutant, the fraction of animals that showed bli-1 silencing or unc-22 silencing (fraction silenced) and the numbers of animals scored (n) are shown. Asterisks indicate p < 0.05 for each comparison (brackets) using Wilson’s estimates with continuity correction and error bars represent 95% confidence interval. (C) Of five isolates with a mutation in mut-16, four (jam138, jam140, jam141, and jam247) failed to silence bli-1 (blue) but retained unc-22 silencing (orange). The other mutant failed to silence both genes and additionally had a mutation in rde-10 (mut-16(jam139) rde-10(jam248)). (D) Mutants created using genome editing recapitulated the selective silencing of unc-22 in mut-16(−) single mutants (mut-16(jam148)) and the failure to silence both genes in mut-16(−) rde-10(−) double mutants (mut-16(jam148) rde-10(jam206)). Using genome editing to recreate the jam248 mutation, which is expected to make a mutant protein (RDE-10(S228F)) that disrupts the Maelstrom domain (see Figure 1—figure supplement 1), resulted in animals (rde-10(jam196)) that showed unc-22 silencing but not bli-1 silencing. (E) Selective requirement for a regulator could reflect two underlying mechanisms of RNA silencing: (1) Two parallel pathways (left, A/B path vs C/D path) that are differentially used for different target genes; or (2) One intersecting network (right, A/B/C/D network) with quantitative contributions by all regulators along with different thresholds for each target gene.
-
Figure 1—source data 1
Excel sheet containing raw data from RNA interference (RNAi) feed depicted in Figure 1B.
- https://cdn.elifesciences.org/articles/97487/elife-97487-fig1-data1-v1.csv
-
Figure 1—source data 2
Excel sheet containing raw data from RNA interference (RNAi) feed depicted in Figure 1D.
- https://cdn.elifesciences.org/articles/97487/elife-97487-fig1-data2-v1.xlsx
Figure 1—figure supplement 1
A forward-genetic screen identifies a mutation that is expected to disrupt the Maelstrom domain of RDE-10.
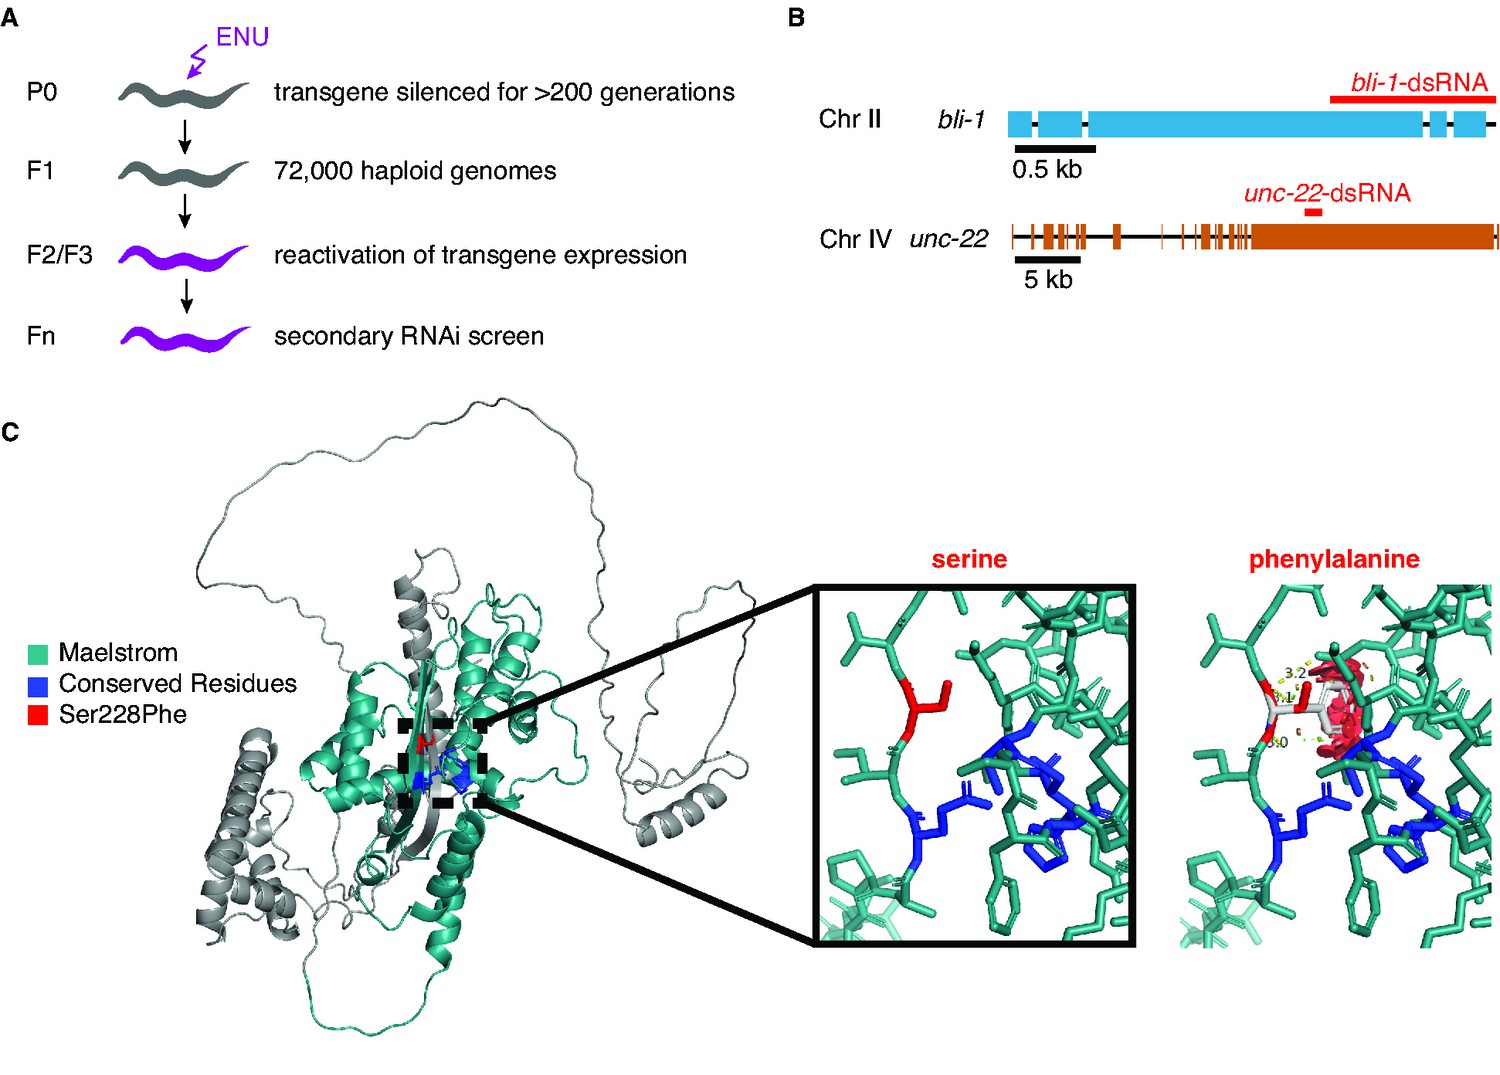
(A) Schematic depicting the screen. Males containing a transgene (mex-5p::mCherry::h2b::tbb-2 3′utr::gpd-2 operon::gfp::h2b::cye-1 3′utr) were mated to wild-type hermaphrodites, and progeny that showed silencing of the transgene were isolated. Animals that had been thus silenced for over 200 generations were mutagenized with N-ethyl-N-nitrosourea (ENU). Homozygous mutants that showed a re-activation of the transgene expression were isolated, and then subjected to a secondary feeding RNA interference (RNAi) screen where the ability to silence two targets (bli-1 and unc-22) was tested. (B) Schematics depicting the genes that were targeted by feeding RNAi. Black boxes, indicating exons, and regions that share homology with the double-stranded RNA (dsRNA) (blue, bli-1; orange, unc-22) are shown. (C) Predicted structure of RDE-10 showing the expected steric hinderance caused by the Ser228Phe mutation isolated in the screen. (Left) The structure predicted by AlphaFold (Jumper et al., 2021; Varadi et al., 2022) contains a Maelstrom domain (teal; Pfam: PF13017). Ser228 (red) and the conserved ECHC motif that can bind zinc (dark blue) are highlighted. (Middle and right) Closeup of residue 228, showing the wild-type Ser (middle) and one orientation of Phe (right), which highlights the expected steric hinderance (red).
Figure 1—figure supplement 2
The predicted structure of the Maelstrom domain of RDE-10 is similar to that of the 3′–5′ exonuclease ERI-1.
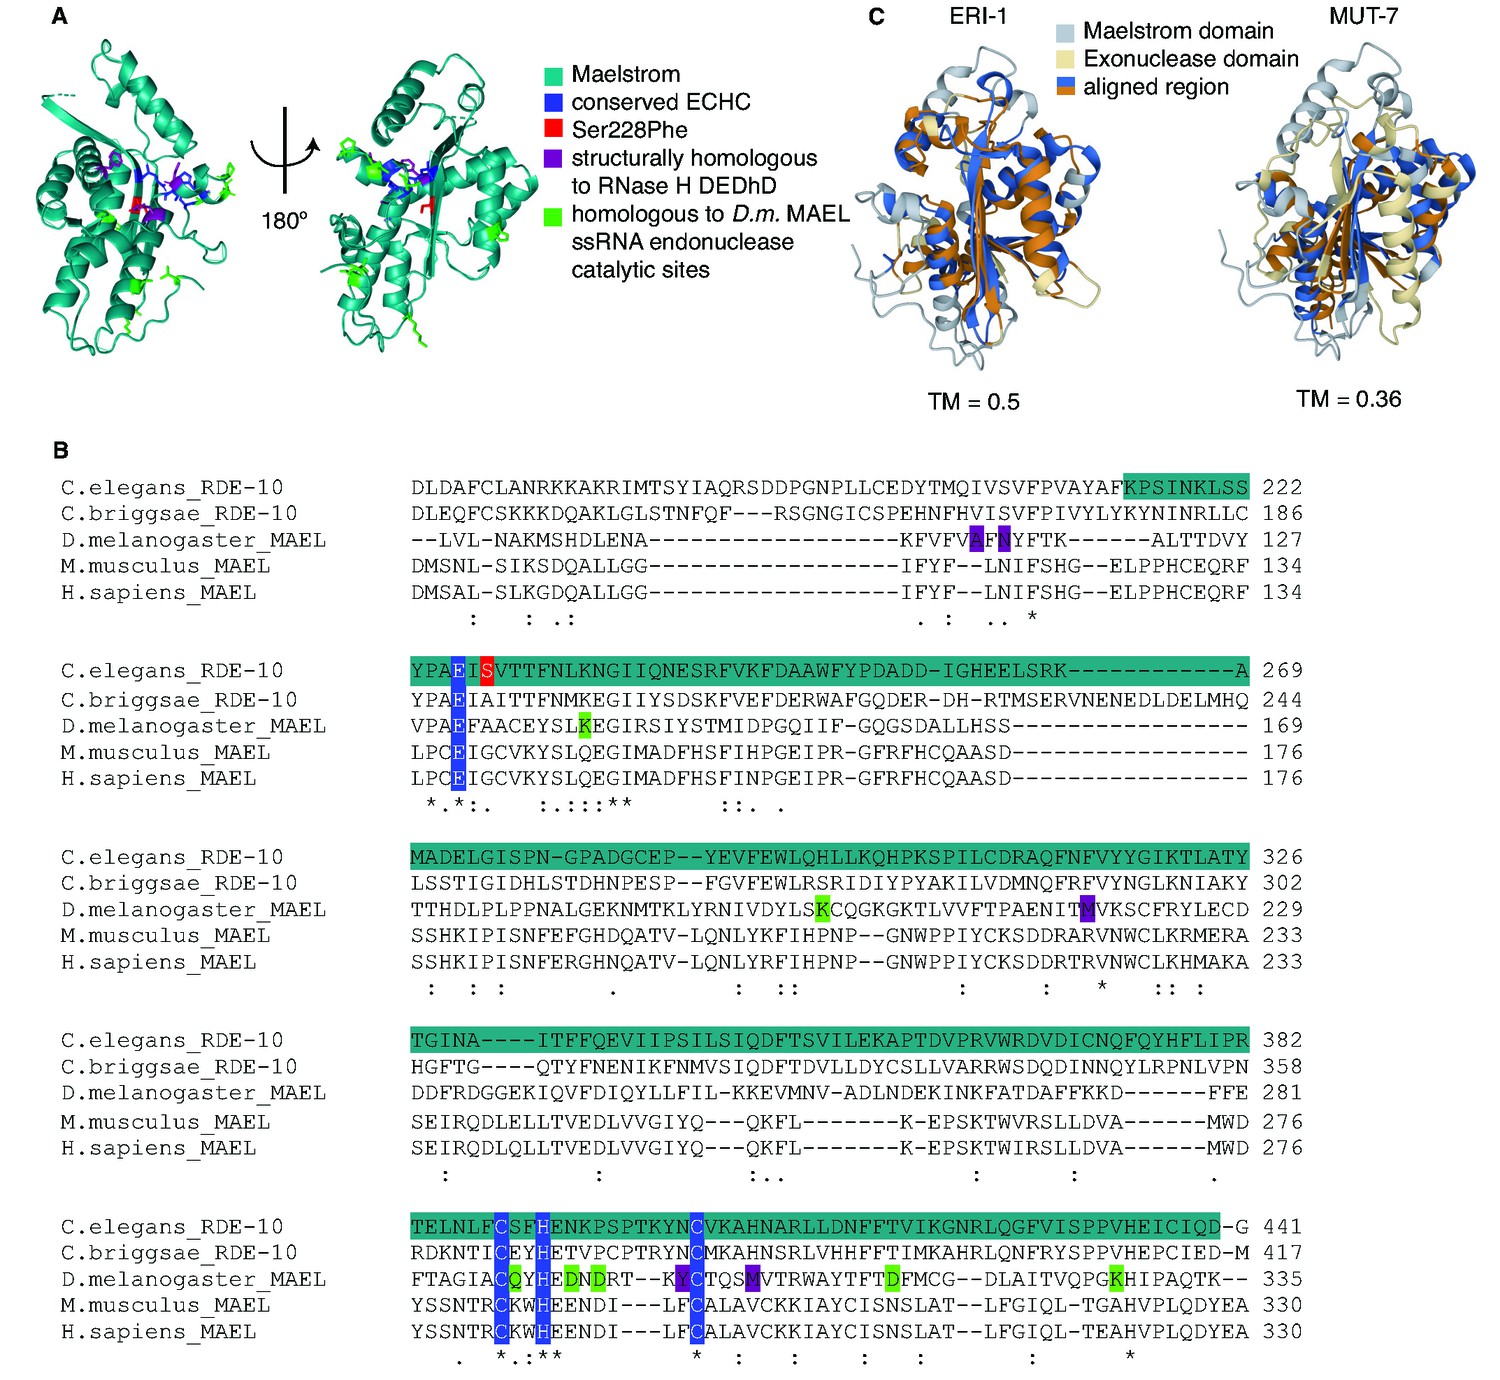
(A) Predicted structure of the Maelstrom domain (teal; Pfam: PF13017) of RDE-10. RDE-10 residues were colored based on studies of the Drosophila MAEL protein (Matsumoto et al., 2015). The zinc-binding ECHC motif (dark blue), the Serine residue mutated in rde-10(jam248) (red), residues homologous to the catalytic residues of the Lassa virus exonuclease (purple), and residues homologous to those required for single-stranded RNA endonuclease activity (green) are shown. (B) Alignment of Maelstrom domain-containing proteins from multiple species. Asterisks indicate conserved residues, colon indicates residues with strongly similar properties, and a period indicates residues with weakly similar properties (Zhang and Skolnick, 2005). Residues of interest are shaded as in (A). (C) Structural alignments of the Maelstrom domain of RDE-10 with the 3′–5′ exonuclease domains of ERI-1 (left) and MUT-7 (right). Template modeling scores (TM = 0.5 for ERI-1 and TM = 0.36 for MUT-7) and regions of high homology (blue and orange) are shown.
Figure 2 with 1 supplement
Gene-specific requirements and complex redundancy can arise from a single RNA regulatory network.
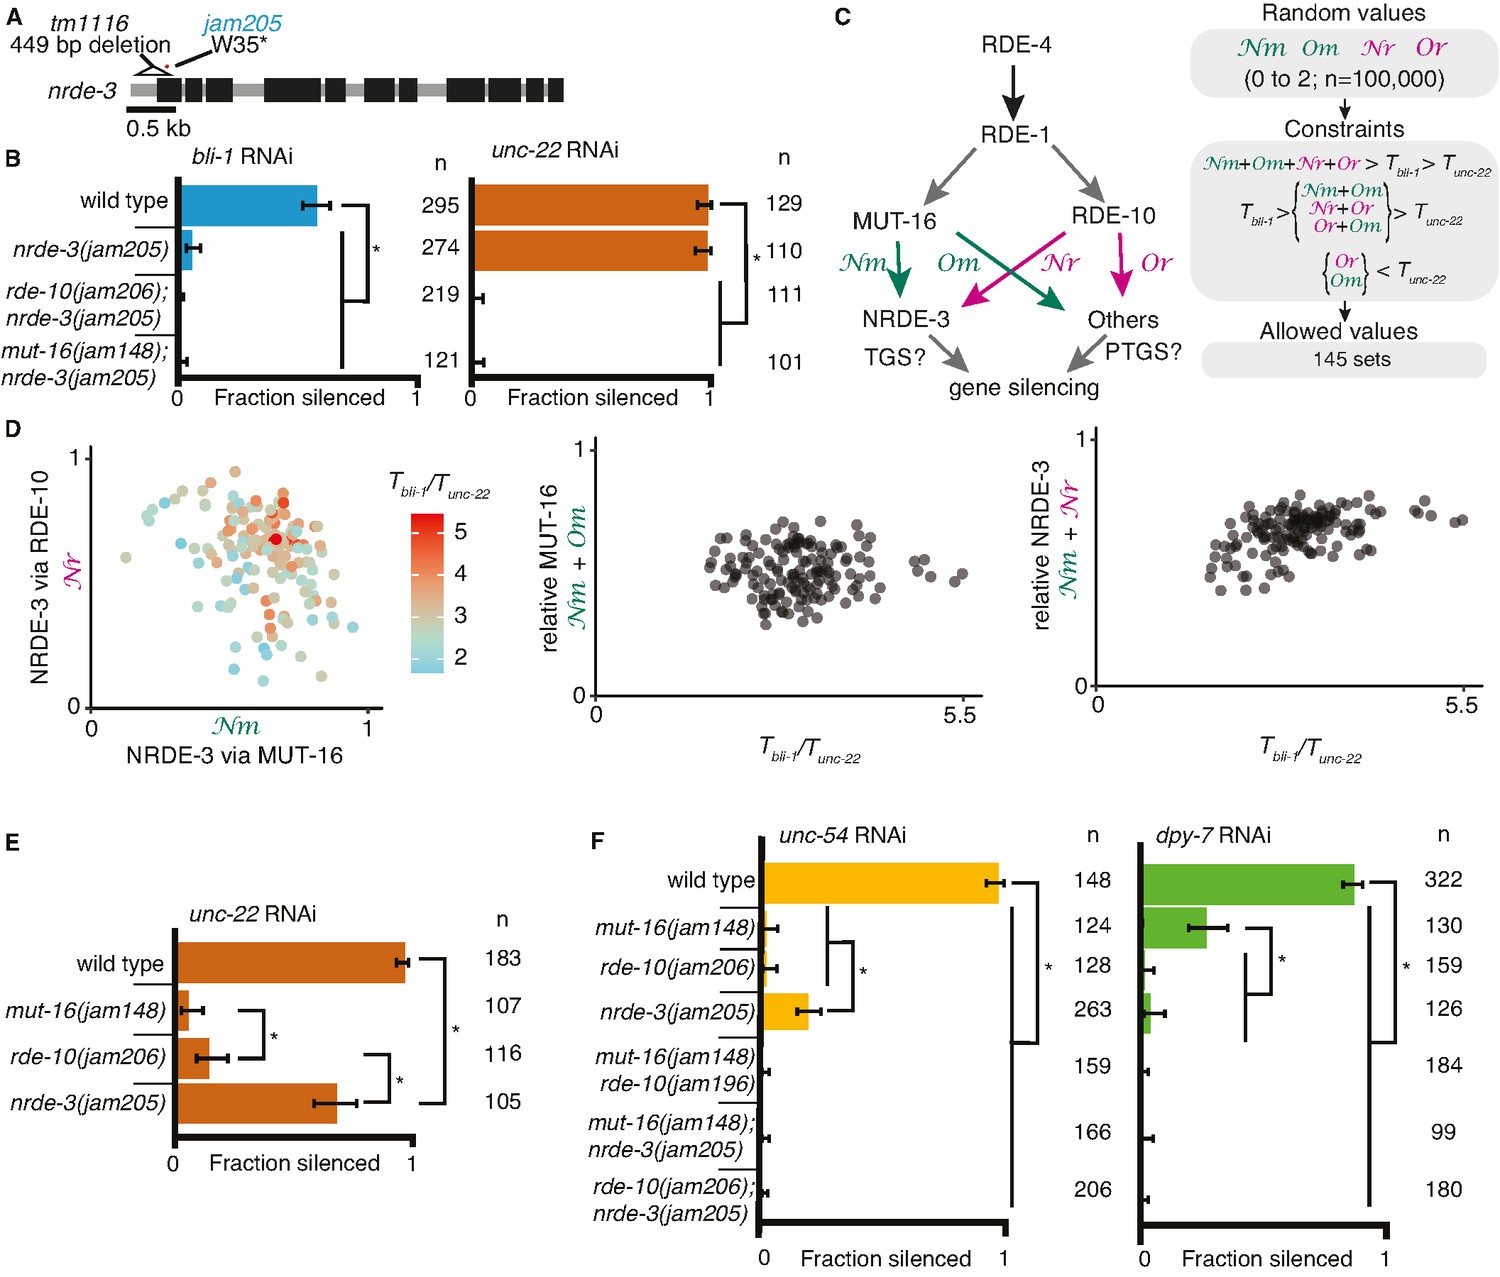
(A) Schematic (as in Figure 1) depicting nrde-3 alleles. (B) Feeding RNA interference (RNAi) of bli-1 and unc-22. Fractions silenced, numbers scored, comparisons, asterisks, and error bars are as in Figure 1. Single mutants lacking NRDE-3 (nrde-3(jam205)) fail to silence bli-1 but not unc-22. Double mutants fail to silence both targets. (C, D) Mutual constraints among parameters required for a single RNA regulatory network to support experimental results. (C, left) Model for a single network of interactors that regulate all RNAi targets in somatic cells. All targets require import (SID-1) and processing (RDE-4 and RDE-1) of double-stranded RNA (dsRNA). Branching after 1° short interfering RNA (siRNA) processing results in four distinct paths (Nm, Or, Nm, Or) that together contribute to gene silencing, which could occur through co-transcriptional gene silencing (TGS) and/or post-transcriptional gene silencing (PTGS) mechanisms. (C, right) Representation of simulation workflow. First, random values between 0 and 2 were drawn for each of the four variables (Nm, Or, Nm, Or). Second, constraints were added based on the experimental results in (B) and Figure 1D. Third, allowed values that satisfied all experimental conditions were culled. Of 100,000 sets of random values simulated (0–2 for Nm, Or, Nm, Or and 0–100 for the ratio of thresholds Tbli-1/Tunc-22), 145 were consistent with all observed responses to RNAi. These allowed numbers reveal the domain of parameter values that support the observed range of gene silencing outcomes using feeding RNAi. (D, left) The contribution of NRDE-3 via MUT-16 (Nm) versus that via RDE-10 (Or) for different ratios of thresholds for bli-1 versus unc-22 silencing (Tbli-1/Tunc-22) are shown. (D, center and right) The relative contributions to silencing that require MUT-16 (Nm+ Nm, D, center) or NRDE-3 (Nm + Or, D, right) do not frequently take extreme values and both support a low value for the ratio of thresholds (Tbli-1/Tunc-22 <~5.5 despite allowed values of up to 100). (E) Feeding RNAi of unc-22 assayed as in Figure 1, but using aged plates, resulting in weaker RNAi. Animals that lack MUT-16 (mut-16(jam148)) have the most severe defect, followed by animals lacking RDE-10 (rde-10(jam206)), which is followed by animals lacking NRDE-3 (nrde-3(jam205)). (F) Feeding RNAi of unc-54 or dpy-7. Fractions silenced, numbers scored, comparisons, asterisks, and error bars are as in Figure 1. Silencing of unc-54 showed a partial dependency on NRDE-3, while silencing of dpy-7 showed a partial dependency on MUT-16, suggesting that the quantitative requirement for a regulator can differ depending on the target.
-
Figure 2—source data 1
Excel sheet containing raw data from RNA interference (RNAi) feed depicted in Figure 2B.
- https://cdn.elifesciences.org/articles/97487/elife-97487-fig2-data1-v1.xlsx
-
Figure 2—source data 2
Excel sheet containing raw data from RNA interference (RNAi) feed depicted in Figure 2E.
- https://cdn.elifesciences.org/articles/97487/elife-97487-fig2-data2-v1.csv
-
Figure 2—source data 3
Excel sheet containing raw data from RNA interference (RNAi) feed depicted in Figure 2F, left (unc-54).
- https://cdn.elifesciences.org/articles/97487/elife-97487-fig2-data3-v1.csv
-
Figure 2—source data 4
Excel sheet containing raw data from RNA interference (RNAi) feed depicted in Figure 2F, right (dpy-7).
- https://cdn.elifesciences.org/articles/97487/elife-97487-fig2-data4-v1.csv
Figure 2—figure supplement 1
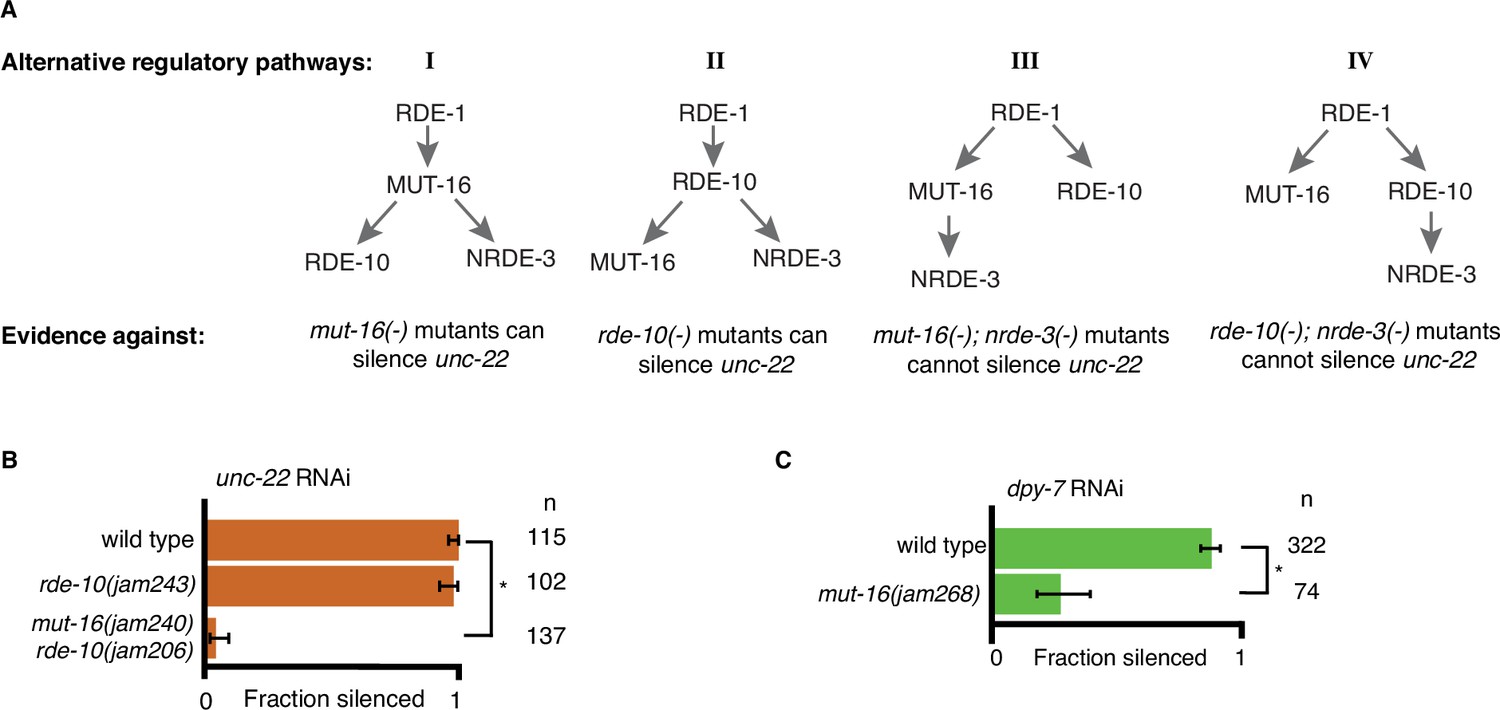
Support for an intersecting regulatory network.
(A) Alternative regulatory pathways excluded by data. Four plausible alternative models of the one presented in Figure 2C along with the experimental evidence from Figures 1 and 2 are shown. (B, C) Feeding RNA interference (RNAi) of unc-22 or dpy-7. Fractions silenced, numbers scored, comparisons, asterisks and error bars are as in Figure 1. (B) An allele of rde-10 that results in a premature stop codon (jam243) is still capable of silencing unc-22 to near wild-type levels. A newly created premature stop codon in mut-16(−) (jam240) created in the background of the RDE-10(Ser228Phe) mutant (jam206) fails to silence unc-22, supporting the findings in Figure 1D. (C) An additional allele of mut-16(−) (jam268) shows about 25% silencing in response to dpy-7 RNAi, supporting the findings in Figure 2E.
-
Figure 2—figure supplement 1—source data 1
Excel sheet containing raw data from RNA interference (RNAi) feed depicted in Figure 2—figure supplement 1B.
- https://cdn.elifesciences.org/articles/97487/elife-97487-fig2-figsupp1-data1-v1.csv
-
Figure 2—figure supplement 1—source data 2
Excel sheet containing raw data from RNA interference (RNAi) feed depicted in Figure 2—figure supplement 1C.
- https://cdn.elifesciences.org/articles/97487/elife-97487-fig2-figsupp1-data2-v1.csv
Figure 3 with 1 supplement

Gene-specific requirements for NRDE-3 can be bypassed in two ways.
(A) Gene schematics (as in Figure 1) of rde-4 and eri-1. (B, C) Loss of ERI-1 can bypass the NRDE-3 requirements for silencing bli-1 but not the other requirements for silencing bli-1 or unc-22. Feeding RNA interference (RNAi) targeting bli-1 (B) or unc-22 (C) with fractions silenced, numbers scored, comparisons, asterisks, and error bars as in Figure 1. (B) Loss of ERI-1 (mg366, jam263, and jam264 alleles) can compensate for the role of NRDE-3 (tm1116 and jam205 alleles) but not of RDE-10 (jam206 allele) or MUT-16 (jam148, jam265, jam266, jam267, and jam268 alleles) in bli-1 silencing. See Table 3 for additional information. (C) Silencing of unc-22 is not restored by loss of ERI-1 (mg366, jam260, jam261, and jam262 alleles) in mutants that also lack any two of mut-16 (jam148 and jam240 alleles), rde-10 (jam196 and jam206 alleles), or nrde-3 (jam205 allele). See Table 3 for additional information. (D, E) Overexpression of RDE-4 in the hypodermis can bypass the requirement for NRDE-3 in bli-1 silencing. (D) Minimal amounts of RDE-4 are sufficient for somatic silencing. (Top) Schematic depicting generation of male progeny with paternal inheritance of a single-copy transgene (Si[…]) that expresses rde-4(+) or rde-1(+) under the control of the mex-5 promoter (mex-5p) in the germline (green) of rde-4(−) or rde-1(−) animals, respectively (germline- and intestine-enriched RDE, based on rescue of RNAi in rde-1(−) animals (39)). (Bottom) Male cross progeny with the transgene were scored after feeding only F1 animals, showing that unlike animals with germline- and intestine-enriched RDE-1, animals with similarly enriched RDE-4 can rescue both unc-22 and bli-1 silencing. Thus, small amounts of RDE-4 potentially mis-expressed in the hypodermis or a non-autonomous effect of RDE-4 from the germline or intestine is sufficient for silencing in the muscle and hypodermis. † indicates p < 0.05 when compared to either wild type or the rde-4(−) mutant and other symbols are as in (B). (E) Silencing of bli-1 is restored in nrde-3(tm1116); rde-4(ne301) double mutants when rde-4(+) is overexpressed in the hypodermis (Si[nas-9p::rde-4(+)]). (F) Silencing of bli-1 is not restored in animals lacking MUT-16 or RDE-10, despite the overexpression of RDE-4 in the hypodermis and/or the loss of ERI-1. (G) Summary depicting the bypass of NRDE-3 when ERI-1 is eliminated and/or RDE-4 is overexpressed. The increase in double-stranded RNA (dsRNA) processing increases the contributions of NRDE-3-independent paths to silencing.
-
Figure 3—source data 1
Excel sheet containing raw data from RNA interference (RNAi) feed depicted in Figure 3B.
- https://cdn.elifesciences.org/articles/97487/elife-97487-fig3-data1-v1.xlsx
-
Figure 3—source data 2
Excel sheet containing raw data from RNA interference (RNAi) feed depicted in Figure 3C.
- https://cdn.elifesciences.org/articles/97487/elife-97487-fig3-data2-v1.xlsx
-
Figure 3—source data 3
Excel sheet containing raw data from RNA interference (RNAi) feed depicted in Figure 3D.
- https://cdn.elifesciences.org/articles/97487/elife-97487-fig3-data3-v1.xlsx
-
Figure 3—source data 4
Excel sheet containing raw data from RNA interference (RNAi) feed depicted in Figure 3E.
- https://cdn.elifesciences.org/articles/97487/elife-97487-fig3-data4-v1.csv
-
Figure 3—source data 5
Excel sheet containing raw data from RNA interference (RNAi) feed depicted in Figure 3F.
- https://cdn.elifesciences.org/articles/97487/elife-97487-fig3-data5-v1.csv
Figure 3—figure supplement 1

Overexpressing RDE-4 in the hypodermis.
Semiquantitative RT-PCR of rde-4 mRNA and tbb-2 mRNA (control) in wild-type animals, rde-4(−) animals, or rde-4(−) animals expressing rde-4(+) in the hypodermis using a single-copy transgene (Si(nas-9p)).+RT and −RT indicate whether reverse transcriptase was used. The normalized mRNA abundance in rde-4(−) animals was subtracted from all lanes. With the observation in Figure 3E and abundance of rde-4 transcripts in the germline in wild-type animals (in situ data from NEXTDB), expression at ~30% of wild type is expected to be an overexpression in the hypodermis.
-
Figure 3—figure supplement 1—source data 1
Unlabeled gel image of semi-quantitative polymerase chain reaction (PCR) for rde-4 with the addition of reverse transcriptase – depicted in the first row of Figure 3—figure supplement 1.
- https://cdn.elifesciences.org/articles/97487/elife-97487-fig3-figsupp1-data1-v1.tif
-
Figure 3—figure supplement 1—source data 2
Unlabeled gel image of semi-quantitative polymerase chain reaction (PCR) for rde-4 without the addition of reverse transcriptase – depicted in the second row of Figure 3—figure supplement 1.
- https://cdn.elifesciences.org/articles/97487/elife-97487-fig3-figsupp1-data2-v1.tif
-
Figure 3—figure supplement 1—source data 3
Unlabeled gel image of semi-quantitative polymerase chain reaction (PCR) for tbb-2 with the addition of reverse transcriptase – depicted in the third row of Figure 3—figure supplement 1.
- https://cdn.elifesciences.org/articles/97487/elife-97487-fig3-figsupp1-data3-v1.tif
-
Figure 3—figure supplement 1—source data 4
Unlabeled gel image of semi-quantitative polymerase chain reaction (PCR) for tbb-2 without the addition of reverse transcriptase – depicted in the fourth row of Figure 3—figure supplement 1.
- https://cdn.elifesciences.org/articles/97487/elife-97487-fig3-figsupp1-data4-v1.tif
-
Figure 3—figure supplement 1—source data 5
Labeled images of all gels used in Figure 3—figure supplement 1.
- https://cdn.elifesciences.org/articles/97487/elife-97487-fig3-figsupp1-data5-v1.ai
-
Figure 3—figure supplement 1—source data 6
Excel sheet with quantifications of bands depicted in Figure 3—figure supplement 1 to obtain the numbers depicted below the cropped gel.
- https://cdn.elifesciences.org/articles/97487/elife-97487-fig3-figsupp1-data6-v1.xlsx
Figure 4 with 2 supplements
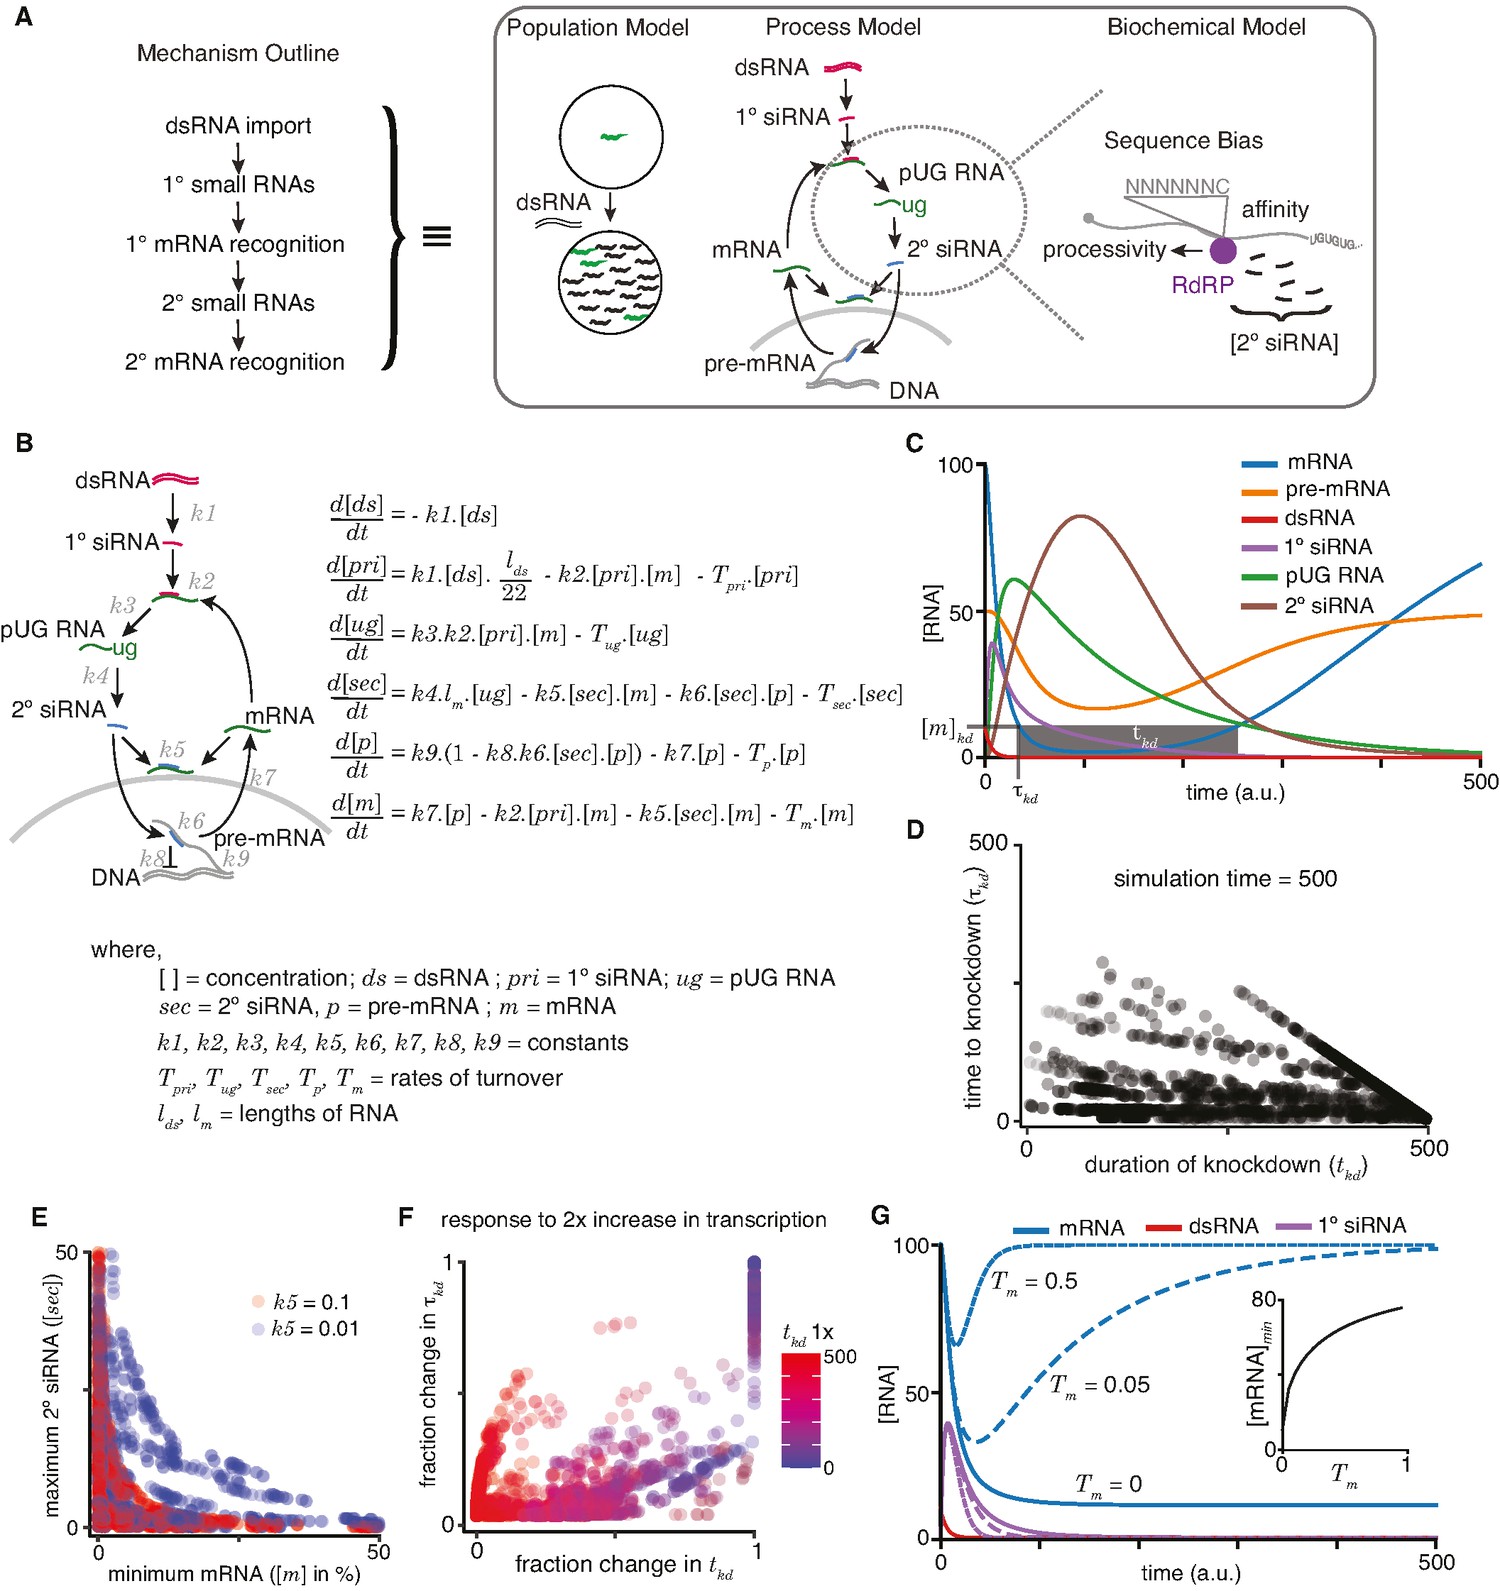
A quantitative model allows exploration of parameters for RNA interference (RNAi) in C. elegans.
(A) An outline of the mechanism of RNAi (left) has been deduced from experiments dissecting the response of animal populations, changes in RNA populations, and biochemical sub-steps (e.g., 2° short interfering RNA [siRNA] production using pUG RNA), each of which can be separately modeled (right). The modeling in this study focuses on the overall RNA-mediated processes that accompany RNAi. (B) Schematic (left) and ordinary differential equations (right) describing the production and turnover of different RNA species. Rate constant for 1° siRNA processing from double-stranded RNA (dsRNA) (k1), binding constant for 1° siRNA-binding target mRNA (k2), rate constant for pUG RNA production (k3), rate constant for 2° siRNA production (k4), binding constant for 2° siRNAs binding mRNA (k5) or pre-mRNA (k6), rate constant for export and splicing of transcripts from the nucleus (k7), rate constant for repression of transcription (k8), and rate constant for new transcript production (k9). Other terms are described in the figure. (C) Relative changes in the concentrations of each RNA ([RNA] vs time in a.u.; dsRNA, mRNA, pre-mRNA, pUG RNA, 1° siRNA, and 2° siRNA) for an example set of parameters (all turnover rates = 0.05, k1 = 1, k2 = 0.01, k3 = 1, k4 = 0.05*lm = 0.5, k5 = 0.01, k6 = 0.01, k7 = 0.1, k8 = 0.05, k9 = 7.5) are illustrated. A reduction to 10% of initial mRNA concentration is designated as the threshold for detecting a defect upon knockdown ([m]kd), the time needed to reach the threshold (τkd) and the time for which mRNA levels remain below the threshold (tkd) are also indicated. (D) Relationship between the duration of knockdown and the time to knockdown (tkd and τkd are as in (C)). (E) Relationship between mRNA concentration and 2° siRNA accumulation. The minimum mRNA concentrations and maximum 2° siRNA concentrations reached for different transcripts with two different binding constants of 2° siRNAs binding to mRNA (k5 = 0.1, red and k5 = 0.01, blue) are plotted. Also see Figure 4—figure supplement 2. (F) Impact of doubling transcription on transcripts with different knockdown parameters. Each transcript is colored based on its initial duration of knockdown (tkd, blue to red gradient) before a twofold increase in the rate constant for transcription (k9) and the resultant fractional change in the duration of knockdown tkd is plotted against that in the time to knockdown τkd. (G) Genes with higher turnover are harder to knockdown. Response of mRNAs and their respective 1° siRNA with the same steady-state concentrations but with different rates of mRNA turnover (solid lines: Tm = 0, large dashes: Tm = 0.05, small dashes: Tm = 0.5) upon addition of 10 molecules of dsRNA are shown. (Inset) Relationship of the minimum concentration of mRNA ([mRNA]min) with its Tm in response to a fixed amount of dsRNA.
Figure 4—figure supplement 1
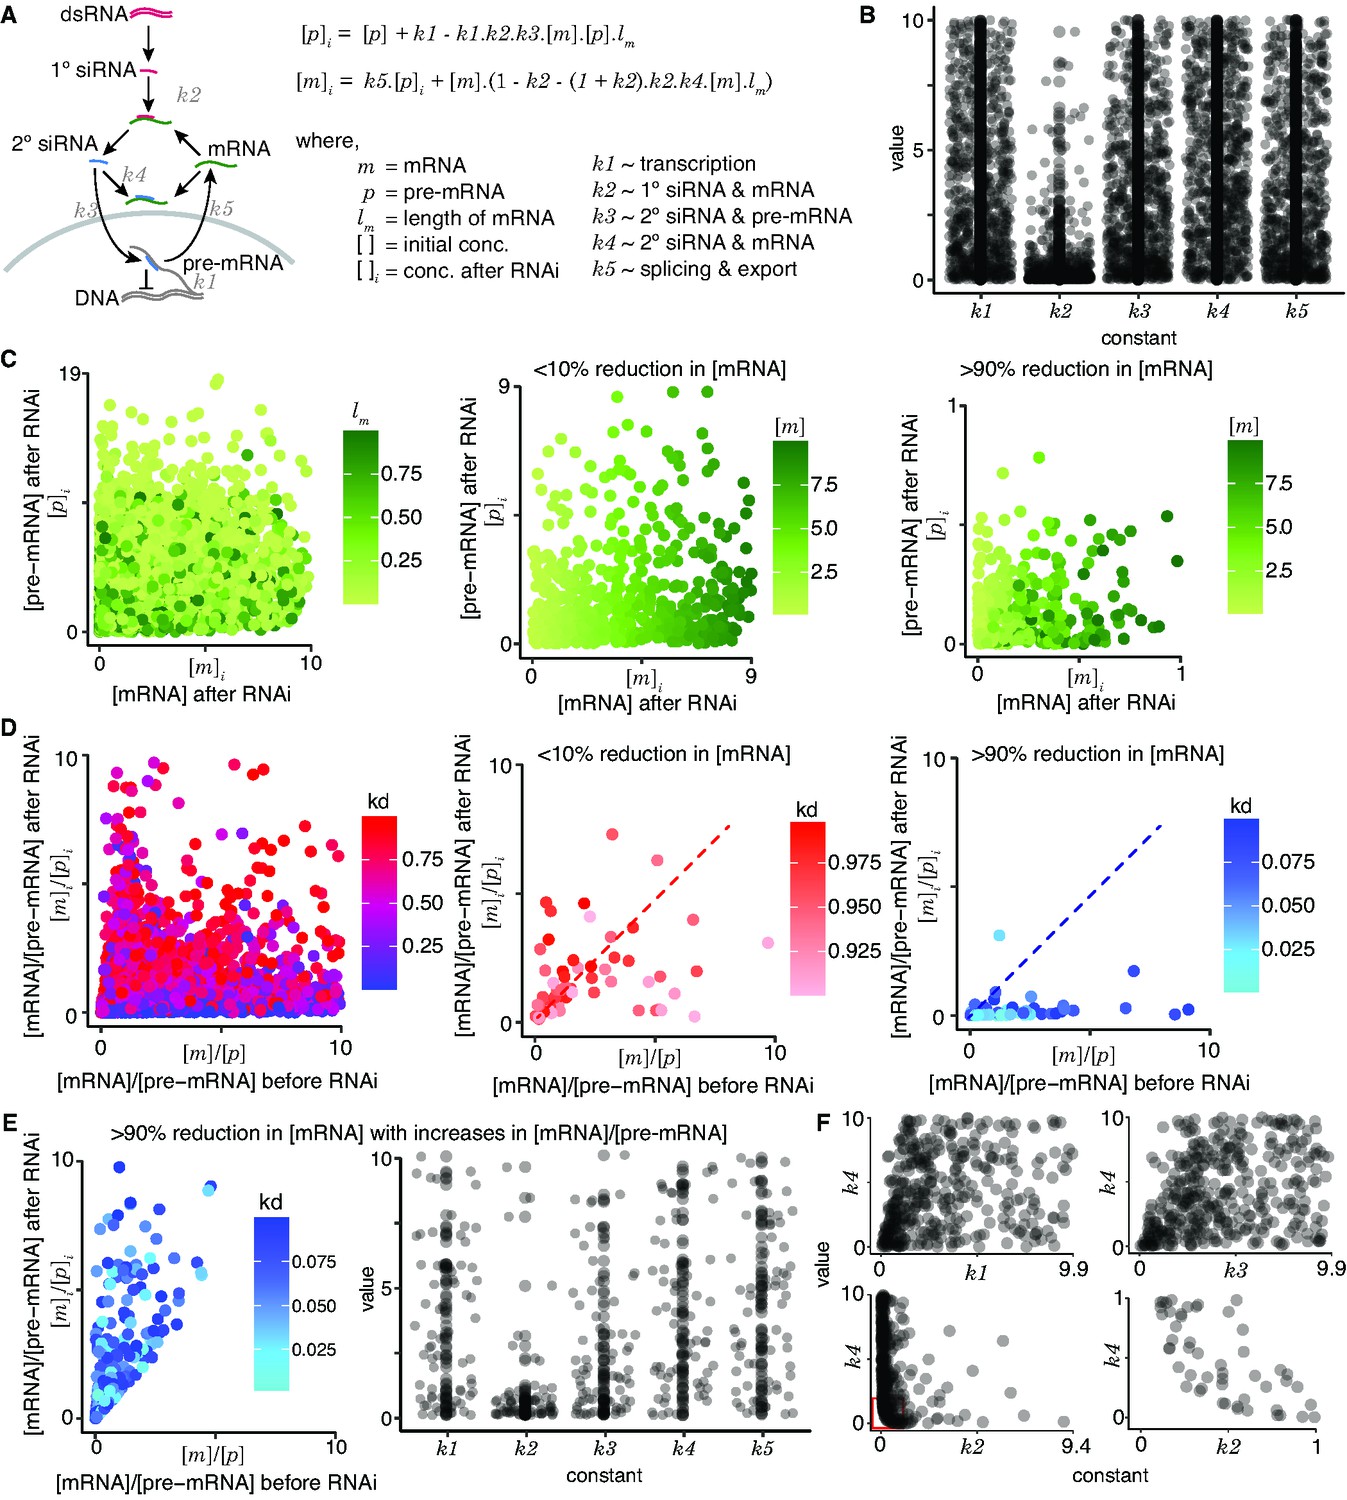
An equilibrium model for RNA interference (RNAi).
(A) Model highlighting different RNA species and their interactions during RNA interference. Left, Schematic showing downstream events upon processing of intracellular double-stranded RNA (dsRNA). Right, Equations for the pre-mRNA ([p]i) and mRNA ([m]i) concentrations after RNAi in terms of the concentrations before RNAi ([p] and [m]) and the length of the transcript (lm). Rate constants for transcription (k1), binding constants for complex formation (1° short interfering RNA [siRNA]–mRNA (k2), 2° siRNA–pre-mRNA (k3), and 2° siRNA–mRNA (k4)), and rate constants for splicing followed by export out of the nucleus (k5) were considered. (B) Distributions of allowed values for all constants that are consistent with knockdown. One million random sets of values from 1 to 10 were assigned for all constants and the 790 sets that supported knockdown ([m]i < [m]) and residual presence of pre-mRNA and mRNA ([m]i > 0 and [p]i > 0) were selected and plotted. Most values of k2 were small as expected to satisfy the [m]i > 0 constraint because its square is subtracted in the equation for [m]i. (C) RNAi can result in a variety of residual concentrations of pre-mRNA and mRNA. Left, Different ratios of residual mRNA and pre-mRNA ([m]i/[p]i) are possible for a given length of the target mRNA (lm: 0–1). Middle and right, Impact of [m] on [m]i and [p]i. Middle, When the knockdown is poor (<10%), the concentrations of mRNA after RNAi ([m]i) remain close to concentrations before RNAi ([m]) as expected for all levels of residual pre-mRNA ([p]i) as evidenced by the graded levels of [m]i that mirror the graded levels of [m]. Right, When the knockdown is strong (>90%), the low concentrations of mRNA after RNAi ([m]i) can be associated with a range of values for [p]i. (D) RNAi can alter the ratios of pre-mRNA and mRNA. Left, Changes in the ratios of mRNA to pre-mRNA upon RNAi ([m]/[p] before to [m]i/[p]i after) are possible for a variety of extents of knockdown (kd = [m]i/[m]: 0–1). Middle and right, Impact of kd on [m]/[p] versus [m]i/[p]i. Increases and decreases in the ratios of mRNA to pre-mRNA (above vs below the dotted line) can occur in response to both poor (<10% with 0.9 < kd < 1.0, middle) and good (>90% with 0.0 < kd < 0.1, right) knockdown. While it appears that most cases of efficient knockdown are associated with a decrease in the ratio of mRNA to pre-mRNA (i.e., only one point above dotted line in right), increasing the numbers of parameter sets explored could reveal additional examples. (E) (Left) Same as in (D, right) except only values that were to the left and above the dotted line. Instead of 1 million simulated values, 100 million values were simulated to better examine the range of possible values in this group. (Center) Same as in (B) but for the values culled in (E, left). (F) Constants (k1–k5) do not appear to show strong correlations with one another, except for k2 and k4. The lack of values in the bottom left corner comparing k2–k4 (bottom graphs) reflects the expectation that efficient silencing is not possible when both the primary and secondary binding constants are low.
Figure 4—figure supplement 2
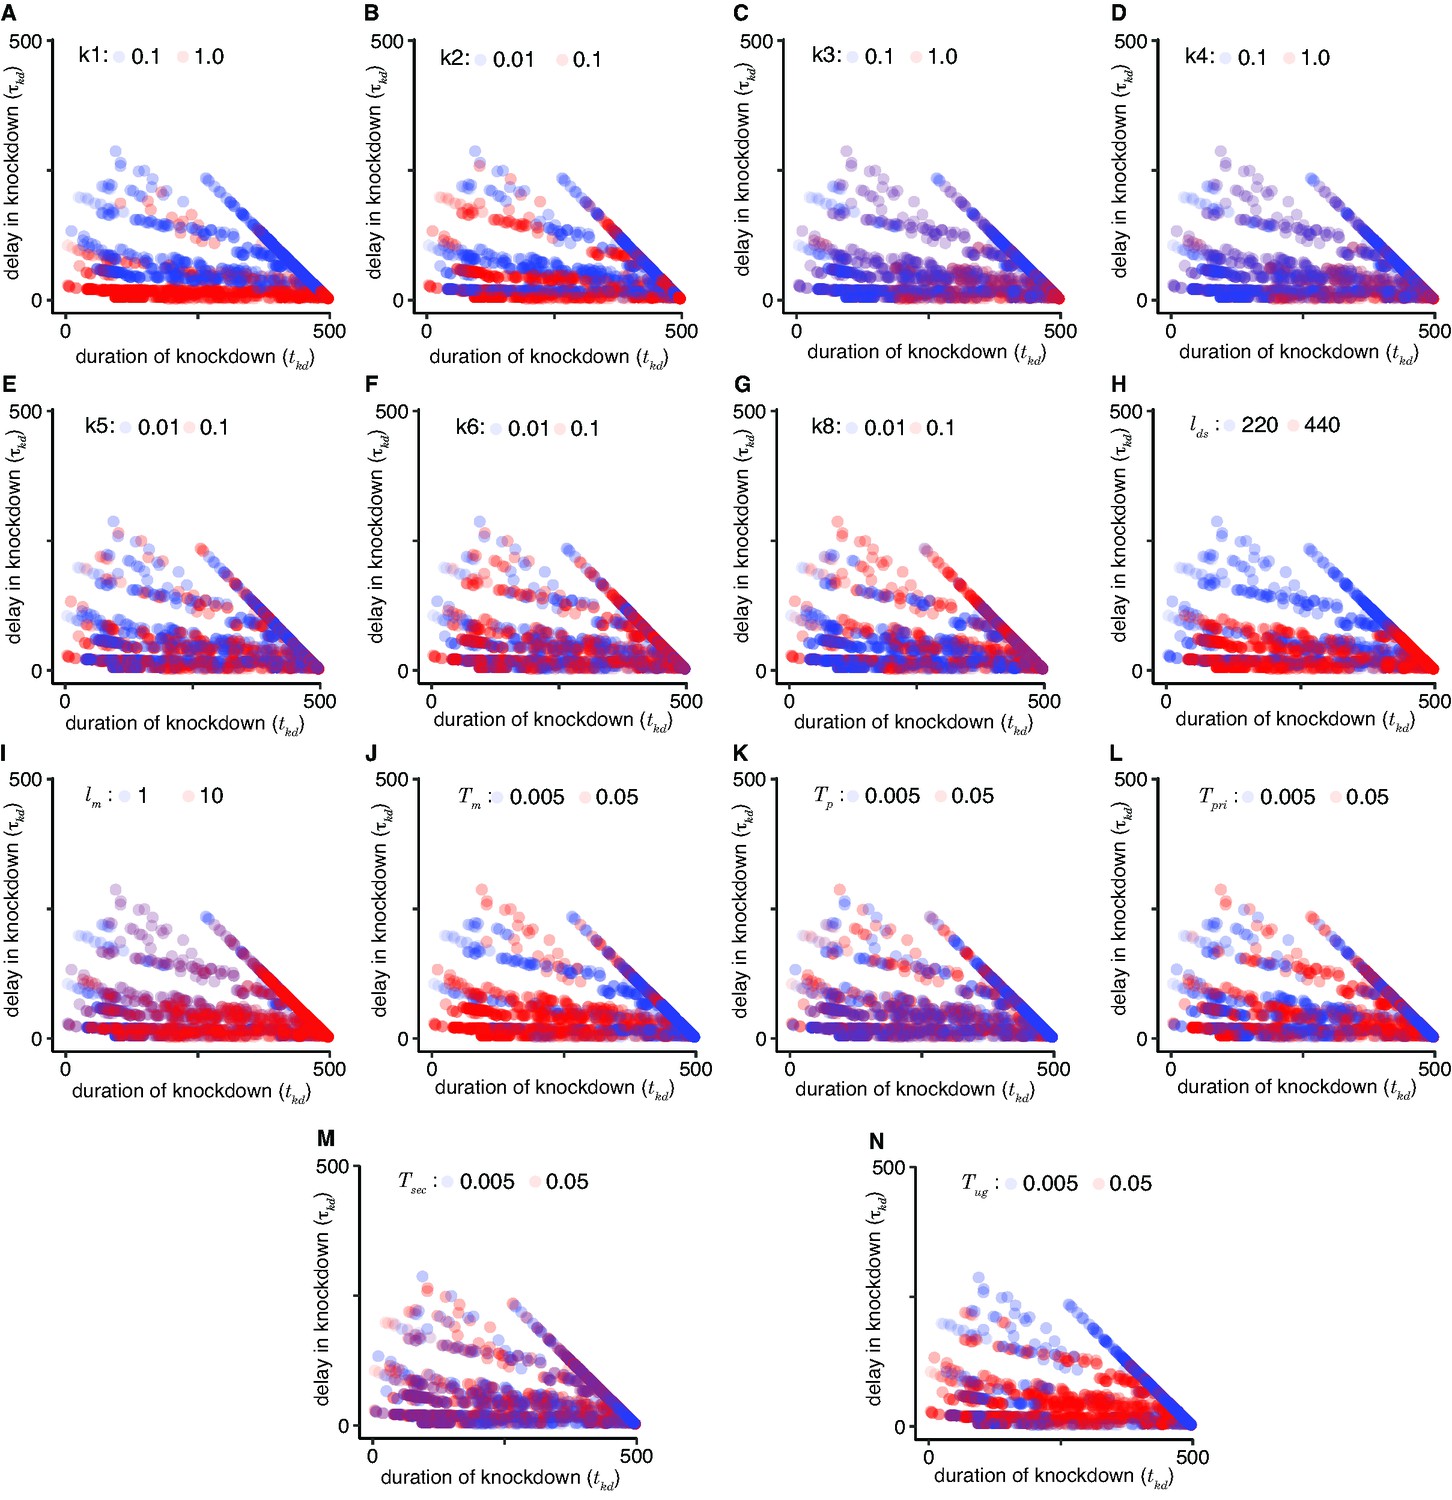
Impact of model parameters on the time to knockdown (τkd) and the duration of knockdown (tkd).
A low (blue) and high (red) value was selected for each parameter and the τkd and tkd that result upon similarly varying all other parameters were plotted. Comparisons for 1° short interfering RNA (siRNA) production ((A), k1 = 0.1 vs 1.0), recognition of transcripts and1° siRNAs ((B), k2 = 0.01 vs 0.1), pUG RNA production ((C), k3 = 0.1 vs 1.0), 2° siRNA production ((D), k4 = 0.1 vs 1.0), binding of transcripts and 2° siRNAs ((E), k5 = 0.01 vs 0.1), transcript maturation, that is, splicing and export out of the nucleus ((F), k6 = 0.01 vs 0.1), downregulation of transcription ((G), k8 = 0.01 vs 0.1), length of double-stranded RNA (dsRNA) ((H), lds = 220 vs 440), length of target mRNA ((I), lm = 1 vs 10), mRNA turnover ((J), Tm = 0.005 vs 0.05), pre-mRNA turnover ((K), Tp = 0.005 vs 05), 1° siRNA turnover ((L), Tpri = 0.005 vs 0.05), 2° siRNA turnover ((M), Tsec = 0.005 vs 0.05), and pUG RNA turnover ((N), Tug = 0.005 vs 0.05) are shown.
Figure 5 with 1 supplement
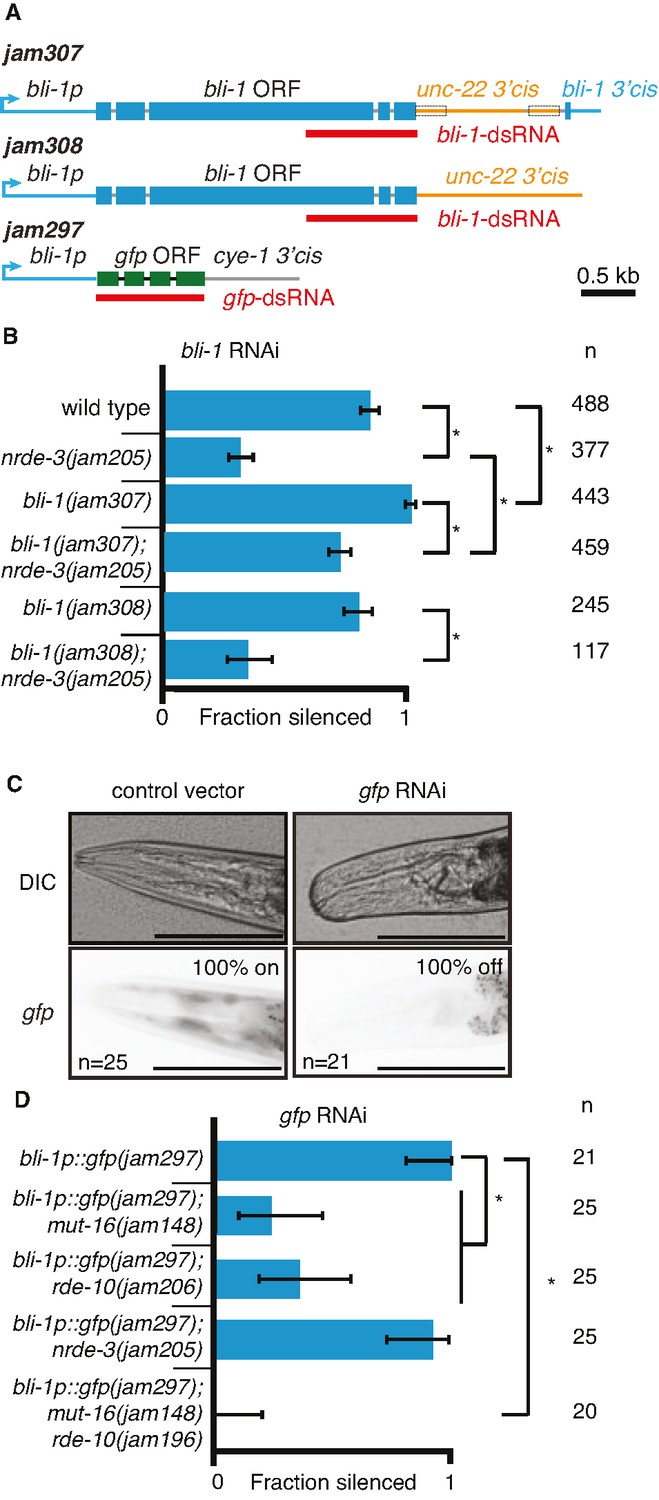
Changing cis-regulatory regions or open reading frames can alter the observed dependence on NRDE-3 for silencing by double-stranded RNA (dsRNA).
(A) Schematics (as in Figure 1) of the hybrid genes created to test the role of 3′ and 5′ cis-regulatory sequences in the response to dsRNA (see Methods for details). (B) The need for NRDE-3 to cause silencing using bli-1-dsRNA is reduced when the 3′ cis-regulatory sequences of bli-1 are replaced with that of unc-22 (bli-1(jam307)). Fractions silenced, numbers scored, comparisons, asterisks, and error bars are as in Figure 1 (C) Representative images (DIC, top; GFP fluorescence, bottom) of the head region of bli-1p::gfp::cye-1 3′cis animals either in response to a control vector (pL4440, left) or in response to gfp-dsRNA (right). The presence or absence of gfp in the head region was used to score the fraction silenced in (D). Scale bar = 100 µm. (D) Use of the bli-1 promoter alone does not confer the genetic requirements for silencing bli-1. Silencing of GFP expressed from the bli-1p::gfp::cye-1 3′cis transgene (bli-1p::gfp(jam297)) by gfp-dsRNA was measured in a wild-type background, in animals lacking NRDE-3 (nrde-3(jam205)), in animals lacking RDE-10 (rde-10(jam206)), in animals lacking MUT-16 (mut-16(jam148)), and in animals lacking both MUT-16 and RDE-10 (mut-16(jam148) rde-10(jam196)). Fractions silenced, numbers scored, comparisons, asterisks, and error bars are as in Figure 1.
-
Figure 5—source data 1
Excel sheet containing raw data from RNA interference (RNAi) feed depicted in Figure 5B.
- https://cdn.elifesciences.org/articles/97487/elife-97487-fig5-data1-v1.csv
-
Figure 5—source data 2
Representative images of bli-1p::gfp transgenic worms in response to control or gfp RNA interference (RNAi) in Figure 5C (subset from images in Figure 5—source data 4).
- https://cdn.elifesciences.org/articles/97487/elife-97487-fig5-data2-v1.zip
-
Figure 5—source data 3
Excel sheet containing raw data from RNA interference (RNAi) feed depicted in Figure 5D.
- https://cdn.elifesciences.org/articles/97487/elife-97487-fig5-data3-v1.csv
-
Figure 5—source data 4
All images used to score the RNA interference (RNAi) feed depicted in Figure 5D.
Images are labeled by the strain that was assayed and the RNAi vector which was plated (L4440 or gfp).
- https://cdn.elifesciences.org/articles/97487/elife-97487-fig5-data4-v1.zip
Figure 5—figure supplement 1

Replacing the unc-22 3′cis-regulatory sequence with that of bli-1 results in defects that show a NRDE-3-dependent enhancement when exposed to unc-22-dsRNA.
(A) Schematic depicting the removal of the endogenous unc-22 3′ cis-regulatory region and the addition of the bli-1 3′ cis-regulatory region. (B) Silencing in response to unc-22-dsRNA (orange) or the control vector (gray). Fractions silenced, numbers scored, comparisons, asterisks and error bars are as in Figure 1. Disruption of the unc-22 3′ cis-regulatory region results in animals that show twitching in 3 mM levamisole even without the addition of unc-22-dsRNA. Addition of unc-22-dsRNA resulted in significantly more animals with altered cis-regulatory regions (unc-22(jam300), unc-22(jam301)) showing twitching. This enhancement was not observed in animals that also lack NRDE-3 (unc-22(jam300); nrde-3(jam205)). Given the low effect size for NRDE-3 dependence, we do not interpret these results as conclusive, but rather present the data for completeness.
-
Figure 5—figure supplement 1—source data 1
Excel sheet containing raw data from RNA interference (RNAi) feed depicted in Figure 5—figure supplement 1B.
- https://cdn.elifesciences.org/articles/97487/elife-97487-fig5-figsupp1-data1-v1.csv
Figure 6

Animals recover from a pulse of RNA interference (RNAi) and production of pUG RNAs is restricted despite continuous exposure to double-stranded RNA (dsRNA).
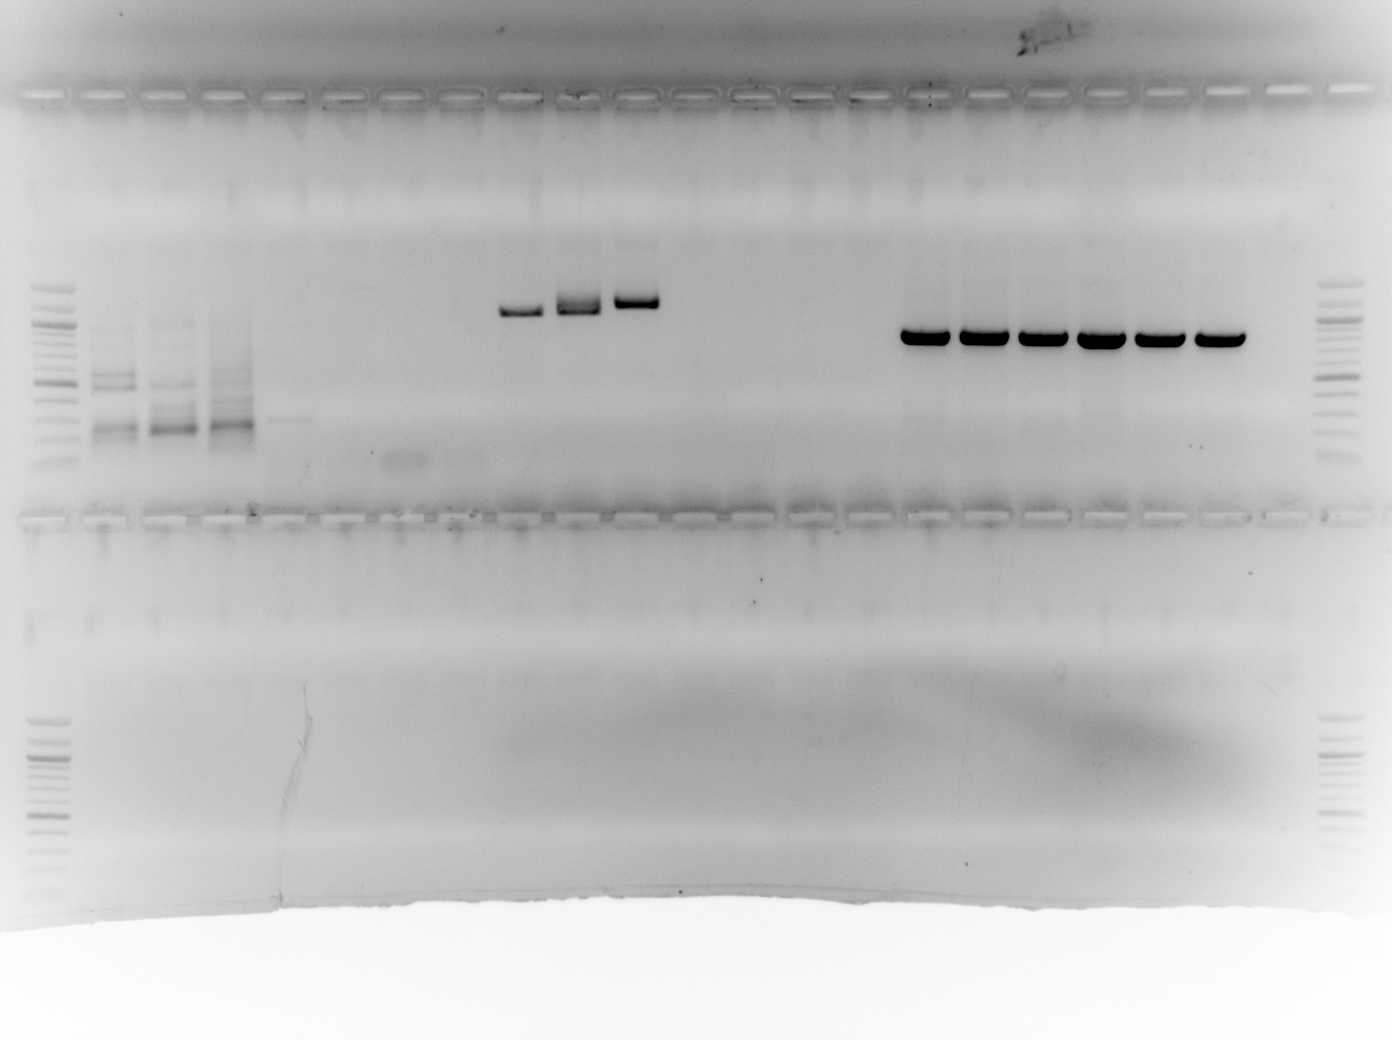
(A) Response to a pulse of feeding RNAi. (Top) Schematic of assay. Animals were exposed to unc-22 RNAi for 1 hr and then returned to OP50 plates. (Bottom) A separate cohort of animals was scored for silencing after each subsequent 24 hr period. Fractions silenced, numbers scored, comparisons, asterisks, and error bars are as in Figure 1. A weak Unc-22 defect indicates animals that were nearly completely still except for a slight twitch of the head or of the tail. (B) pUG RNA production in response to continuous exposure to unc-22 dsRNA. (Top) Schematic depicting the polymerase chain reaction (PCR) primers used for the RT-PCR to detect pUG RNAs. Two sets of primers (0 kb, purple; 1 kb, blue) positioned 5′ of the unc-22-dsRNA (orange), combined with an RT primer that contains nine CA repeats were used. (Bottom) Populations of small RNAs that might be detected by pUG-PCR as above. Population I would suggest that amplified 2° short interfering RNAs (siRNAs) in addition to 1° siRNAs are capable of guiding target mRNA cleavage and poly-UG addition. Population II would suggest only 1° siRNAs can initiate pUG RNA production. (C) (Left) Distribution of DNA amplified from pUG RNAs. Lanes with PCR products amplified from total RNA of animals fed unc-22 dsRNA (unc-22) or L4440 dsRNA (control) isolated from three biological replicates each (1–3), or a no-template control (NTC) with no added RNA (−) are shown. Different bands are detected for each primer set (0 kb, top vs 1 kb, bottom). A gene with a poly-UG sequence encoded in the genome (gsa-1) serves as a loading control. (Right) Schematic of siRNA production in somatic cells. Successive rounds of amplified small RNAs would map progressively closer to the 5′ end of the target transcript. Since we did not detect poly-UG addition upstream of the region homologous to the dsRNA trigger, it is unlikely that 3° siRNAs are being produced.
-
Figure 6—source data 1
Excel sheet containing raw data from RNA interference (RNAi) feed depicted in Figure 6A.
- https://cdn.elifesciences.org/articles/97487/elife-97487-fig6-data1-v1.xlsx
-
Figure 6—source data 2
Original, unlabeled image of gel cropped and shown in Figure 6C.
- https://cdn.elifesciences.org/articles/97487/elife-97487-fig6-data2-v1.png
-
Figure 6—source data 3
Complete gel image with annotations to show samples and conditions before being cropped and depicted in Figure 6C.
- https://cdn.elifesciences.org/articles/97487/elife-97487-fig6-data3-v1.ai
Figure 7

Overview of findings.
(Left) Amplification of small RNAs occurs through an intersecting network of regulators (orange arrows) and in response to somatic RNA interference (RNAi), the addition of poly-UG repeats (green) is restricted to a ‘pUG zone’ (red) that is homologous to the double-stranded RNA (dsRNA) trigger. (Right) In response to a pulse of dsRNA (red), levels of the target mRNA (blue) recover, suggesting that the RNA silencing intermediates (1° short interfering RNAs [siRNAs], purple; pUG RNAs, green; 2° siRNAs, brown) undergo turnover.
Author response image 1

Expression data for unc-22.
Author response image 2

Expression data for bli-1.
Tables
Key resources table
| Reagent type (species) or resource | Designation | Source or reference | Identifiers | Additional information |
|---|---|---|---|---|
| Software, algorithm | Python | https://www.python.org/downloads/release/python-385/ | ||
| Software, algorithm | R | https://cran.r-project.org/bin/macosx/ | ||
| Strains (C. elegans) | Please see Table 1 for complete list | Please see Table 1 for complete list | Please see Table 1 for complete list | Please see Table 1 for complete list |
Table 1
Strains used in this study.
| Strain name | Genotype |
|---|---|
| N2 | Wild type |
| AMJ174 | oxSi487[mex-5p::mCherry::H2B::tbb-2 3'UTR::gpd-2 operon::GFP::H2B::cye-1 3'UTR + unc-119(+)] dpy-2(jam29) II; unc-119(ed3)? III; lin-2(jam30) X |
| AMJ183 | rde-4(ne301) III; nrde-3(tm1116) X |
| AMJ285 | jamSi1 [mex-5p::rde-4(+)] II; rde-4(ne301) III |
| AMJ345 | jamSi2 [mex-5p::rde-1(+)] II; rde-1(ne219) V |
| AMJ422 | jamSi6 [nas-9p::rde-4(+)] II; unc-119(ed) III |
| AMJ489 | nrde-3(tm1116) X; eri-1(mg366) IV |
| AMJ565 AMJ611 | jamSi6 [Pnas-9::rde-4(+)::rde-4 3’UTR] II; unc-119(ed3) III rde-4(ne301) III jamSi6 [nas-9p::rde-4(+)::rde-4 3’UTR] II; rde-4(ne301) III; nrde-3(tm1116) X |
| AMJ1023 | mut-16(jam138) I; oxSi487 dpy-2(jam29) II; unc-119(ed3)? III; lin-2(jam30) X |
| AMJ1025 | mut-16(jam139) rde-10(jam248) I; oxSi487 dpy-2(jam29) II; unc-119(ed3)? III; lin-2(jam30) X |
| AMJ1035 | mut-16(jam140) I; oxSi487 dpy-2(jam29) II; unc-119(ed3)? III; lin-2(jam30) X |
| AMJ1042 | mut-16(jam141) I; oxSi487 dpy-2(jam29) II; unc-119(ed3)? III; lin-2(jam30) X |
| AMJ1091 | mut-16(jam247) I; oxSi487 dpy-2(jam29) II; unc-119(ed3)? III; lin-2(jam30) X |
| AMJ1195 | jamSi59 [Pmex-5::gfp::cye-1 3’UTR + unc-119(+)] II; unc-119(ed3) III |
| AMJ1397 | mut-16(jam148) I |
| AMJ1470 | mut-16(jam148) rde-10(jam196) I |
| AMJ1489 | rde-10(jam206) I |
| AMJ1510 | nrde-3(jam205) X |
| AMJ1545 | mut-16(jam148) I; nrde-3(jam205) X |
| AMJ1568 | rde-10(jam206) I; nrde-3(jam205) X |
| AMJ1611 | mut-16(jam240) rde-10(jam206) I |
| AMJ1614 | rde-10(jam243) I |
| AMJ1621 | eri-1(mg366) IV; nrde-3(jam205) X |
| AMJ1622 | rde-10(jam206) I; eri-1(mg366) IV |
| AMJ1623 | rde-10(jam206) I; eri-1(mg366) IV |
| AMJ1624 | rde-10(jam206) I; eri-1(mg366) IV; nrde-3(jam205) X |
| AMJ1625 | rde-10(jam206) I; eri-1(mg366) IV; nrde-3(jam205) X |
| AMJ1631 | mut-16(jam148) I; eri-1(mg366) IV; nrde-3(jam205) X |
| AMJ1632 | mut-16(jam148) I; eri-1(mg366) IV; nrde-3(jam205) X |
| AMJ1657 | mut-16(jam240) rde-10(jam206) I; eri-1(jam260) IV |
| AMJ1658 | mut-16(jam240) rde-10(jam206) I; eri-1(jam261) IV |
| AMJ1659 | mut-16(jam240) rde-10(jam206) I; eri-1(jam262) IV |
| AMJ1660 | eri-1(jam263) IV |
| AMJ1661 | eri-1(jam264) IV |
| AMJ1672 | mut-16(jam265) I; eri-1(jam263) IV |
| AMJ1673 | mut-16(jam266) I; eri-1(jam264) IV |
| AMJ1674 | mut-16(jam267) I; eri-1(jam264) IV |
| AMJ1675 | mut-16(jam268) I |
| AMJ1709 | jam297[bli-1p::gfp::cye-1 3'utr + unc-119(+)] II; unc-119(ed3) III |
| AMJ1721 | mut-16(jam148) I; jamSi6 [nas-9p::rde-4(+)] II; unc-119(ed)? III |
| AMJ1722 | mut-16(jam148) I; jamSi6 II; unc-119(ed)? III; eri-1(jam263) IV |
| AMJ1723 | rde-10(jam206) I; jamSi6 II; unc-119(ed)? III |
| AMJ1724 | rde-10(jam206) I; jamSi6 II; unc-119(ed)? III; eri-1(mg366) IV |
| AMJ1725 | rde-10(jam206) I; jam297[bli-1p::gfp::cye-1 3'utr + unc-119(+)] II; unc-119(ed3)? III |
| AMJ1726 | jam297[bli-1p::gfp::cye-1 3'utr + unc-119(+)] II; unc-119(ed3)? III; nrde-3(jam205) X |
| AMJ1727 | mut-16(jam148) I; jam297[bli-1p::gfp::cye-1 3'utr + unc-119(+)] II; unc-119(ed3)? III |
| AMJ1728 | mut-16(jam148) rde-10(jam196) I; jam297[bli-1p::gfp::cye-1 3'utr + unc-119(+)] II; unc-119(ed3)? III |
| AMJ1730 | unc-22(jam300) IV |
| AMJ1731 | unc-22(jam301) IV |
| AMJ1754 | bli-1(jam307) II |
| AMJ1755 | bli-1(jam308) II |
| AMJ1757 | unc-22(jam300) IV; nrde-3(jam205) X |
| AMJ1758 | bli-1(jam307) II; nrde-3(jam205) X |
| AMJ1771 | bli-1(jam308) II; nrde-3(jam205) X |
| EG6787 | oxSi487 II; unc-119(ed3) III |
| GR1373 | eri-1(mg366) IV |
| WM27 | rde-1(ne219) V |
| WM49 | rde-4(ne301) III |
| WM156 | nrde-3(tm1116) X |
Table 2
Oligonucleotides used in this study.
| Primer | Sequence |
|---|---|
| P1 | atttaggtgacactatagaaatgctcagagatgctcggttttagagctagaaatagcaag |
| P2 | tcactttcttcgtgcgttcc |
| P3 | ggagaaccactcccagaatg |
| P4 | aatcaatcggctgtccacac |
| P5 | atttaggtgacactatagctggatcacctgggaatccgttttagagctagaaatagcaag |
| P6 | aatcgcaaacgagtgggtac |
| P7 | cgggctagatcataatgagg |
| P8 | ggaccacgtggagttccaggacatccaggttttccaggtgacccaggagagtatggaatt |
| P9 | gaatatttttcgaaaatata |
| P10 | cggcacatgcgaatattttccgaaaatagaaggatattcttcaactcgatccagaaaaac |
| P11 | gctaccataggcaccgcatg |
| P12 | cacttgaacttcaatacggcaagatgagaatgactggaaaccgtaccgcatgcggt gcctatggtagcggagcttcacatggcttcagaccaacagccta |
| P13 | cacaaacgccaggaaaggaag |
| P14 | catttctgcgttgttgtggacc |
| P15 | gttgtaacggatatctctgc |
| P16 | aagattgaatgttgtaacgaatatttcagcaggatacgatgaaagcttattgattgatgg |
| P17 | ccgaaatccagatgagttcc |
| P18 | gcatctggataaaaccaagc |
| P19 | ccgatacaatcagaatgatc |
| P20 | agcaaggccaccgatacaatcagaatgattaggcagacaaggatattatgacaagatatt |
| P21 | ggcattcgagccaataatgc |
| P22 | cgttgtgctcggcaacttct |
| P23 | acaccacgtacaaatgtttg |
| P24 | tgcgtcatccacaccacgtacaaacgtttagggcactgcaaaaaagccatccagccaaca |
| P25 | gactgtgctgacgctgtttt |
| P26 | ctcccagtggctttcgtttt |
| P27 | tgctgctccatatttccgag |
| P28 | gaaacagtcgatgctgctccatatttccgataggatcttcaacggctgtacacatggatg |
| P29 | cctatgtccgacctgtcaga |
| P30 | caattccggatttctgaagag |
| P31 | cagacctcacgatatgtggaaa |
| P32 | ggaacatatggggcattcg |
| P33 | caactttgtatagaaaagtt |
| P34 | acaagtttgtacaaaaaagc |
| P35 | gattacgccaagctatcaactttgtatagaaaagttgcctaccaaagtagaaattcc |
| P36 | acaactccagtgaaaagttcttctcctttactcatgatgaggttagatcacacta |
| P37 | tttcgctgtcctgtcacactc |
| P38 | tacgcggtaagacccaaatg |
| P39 | gaacgcgtcgaggtgatagc |
| P40 | ataaggagttccacgcccag |
| P41 | ctagtgagtcgtattataagtg |
| P42 | tgaagacgacgagccacttg |
| P43 | ctagaaacttctcataatag |
| P44 | ggatacgagagaagccaaat |
| P45 | cttttacaggaaccactattatgagaagtttctagtttaatcatcctgccaccaccactt |
| P46 | ccttatcttctgcggttttcccaactctccgcttcttccaaacatttctcagtcaacag |
| P47 | catacagaaggagaaatcgc |
| P48 | gttgtagtacagtgtcgcat |
| P49 | gcgtcccaattcttgaatca |
| P50 | ggtggcaggatgattagaca |
| P51 | aattctcactcaaaatttgc |
| P52 | tgcaaaatatgcggcagctcttctccttgtctaataactaaaaaaaacttctagtctaac |
| P53 | tgtctttcaaattctcactcaaaatttgctggtatcgatttggcttctctcgtatcc |
| P54 | gacgacgacggcatctatgt |
| P55 | gctatggctgttctcatggcggcgtcgccatattctacttcacacacacacacacaca |
| P56 | gctatggctgttctcatggc |
| P57 | gagttctacgatcacattct |
| P58 | tgctccgtggagcaactcgc |
| P59 | gagcacactattctgtgcat |
| P60 | ggcgtcgccatattctactt |
| P61 | cacttgctggaaagacaagg |
| P62 | cgcaagcatgctggtttgta |
| P63 | gcattccatctgcaatgcga |
| P64 | gccgatttacaagcacactg |
| P65 | tcgtcttcggcagttgcttc |
| P66 | gcaaagaatcttgcagcatgg |
| P67 | tcttcagtctgggtgtgttc |
| P68 | gacgagcaaatgctcaac |
| P69 | ttcggtgaactccatctcg |
Table 3
Summary of statistics.
| Figure | Comparison | Total n | Silenced n | p-value | Strains | Notes |
|---|---|---|---|---|---|---|
| 1B bli-1 | wild type vs mut-16(jam138) | 757, 229 | 391, 0 | <0.00001, * | EG6787, AMJ1023 | Pooled EG6787 from separate experiments |
| 1B bli-1 | wild type vs mut-16(jam140) | 757, 277 | 391, 0 | <0.00001, * | EG6787, AMJ1035 | Pooled EG6787 from separate experiments |
| 1B bli-1 | wild type vs mut-16(jam141) | 757, 124 | 391, 0 | <0.00001, * | EG6787, AMJ1042 | Pooled EG6787 from separate experiments |
| 1B bli-1 | wild type vs mut-16(jam247) | 757, 446 | 391, 1 | <0.00001, * | EG6787, AMJ1091 | Pooled EG6787 from separate experiments |
| 1B bli-1 | wild type vs mut-16(jam139) rde-10(jam248) | 757, 412 | 391, 1 | <0.00001, * | EG6787, AMJ1025 | Pooled EG6787 from separate experiments |
| 1B unc-22 | wild type vs mut-16(jam139) rde-10(jam248) | 309, 173 | 282, 0 | <0.00001, * | EG6787, AMJ1025 | Pooled EG6787 from separate experiments |
| 1B unc-22 | mut-16(jam138) vs mut-16(jam139) rde-10(jam248) | 180, 173 | 111, 0 | <0.00001, * | AMJ1023, AMJ1025 | Pooled EG6787 from separate experiments |
| 1B unc-22 | mut-16(jam140) vs mut-16(jam139) rde-10(jam248) | 91, 173 | 50, 0 | <0.00001, * | AMJ1035, AMJ1025 | Pooled EG6787 from separate experiments |
| 1B unc-22 | mut-16(jam141) vs mut-16(jam139) rde-10(jam248) | 267, 173 | 208, 0 | <0.00001, * | AMJ1042, AMJ1025 | Pooled EG6787 from separate experiments |
| 1B unc-22 | mut-16(jam247) vs mut-16(jam139) rde-10(jam248) | 100, 173 | 84, 0 | <0.00001, * | AMJ1091, AMJ1025 | Pooled EG6787 from separate experiments |
| 1D bli-1 | wild type vs mut-16(jam148) | 202, 126 | 159, 0 | <0.00001, * | N2, AMJ1397 | |
| 1D bli-1 | wild type vs mut-16(jam148) rde-10(jam196) | 202, 209 | 159, 0 | <0.00001, * | N2, AMJ1470 | |
| 1D bli-1 | wild type vs rde-10(jam206) | 202, 209 | 159, 0 | <0.00001, * | N2, AMJ1489 | |
| 1D unc-22 | wild type vs mut-16(jam148) | 206, 121 | 204, 119 | 0.58802, ns | N2, AMJ1397 | |
| 1D unc-22 | wild type vs mut-16(jam148) rde-10(jam196) | 206, 146 | 204, 0 | <0.00001, * | N2, AMJ1470 | |
| 1D unc-22 | wild type vs rde-10(jam206) | 206, 190 | 204, 185 | 0.21023, ns | N2, AMJ1489 | |
| 2B bli-1 | wild type vs nrde-3(jam205) | 295, 274 | 172, 16 | <0.00001, * | N2, AMJ1510 | |
| 2B bli-1 | wild type vs rde-10(jam206); nrde-3(jam205) | 295, 219 | 172, 0 | <0.00001, * | N2, AMJ1568 | |
| 2B bli-1 | wild type vs mut-16(jam148); nrde-3(jam205) | 295, 121 | 172, 0 | <0.00001, * | N2, AMJ1545 | |
| 2B unc-22 | wild type vs nrde-3(jam205) | 129, 110 | 127, 108 | 0.87221, ns | N2, AMJ1510 | |
| 2B unc-22 | wild type vs rde-10(jam206); nrde-3(jam205) | 129, 111 | 127, 0 | <0.00001, * | N2, AMJ1568 | |
| 2B unc-22 | wild type vs mut-16(jam148); nrde-3(jam205) | 129, 101 | 127, 0 | <0.00001, * | N2, AMJ1545 | |
| 2E | wild type vs mut-16(jam148) | 183, 107 | 179, 5 | <0.00001, * | N2, AMJ1397 | |
| 2E | wild type vs rde-10(jam206) | 183, 116 | 179, 16 | <0.00001, * | N2, AMJ1489 | |
| 2E | wild type vs nrde-3(jam205) | 183, 105 | 179, 72 | <0.00001, * | N2, AMJ1510 | |
| 2E | mut-16(jam148) vs rde-10(jam206) | 107, 116 | 5, 16 | 0.0190241, * | AMJ1397, AMJ1489 | |
| 2E | rde-10(jam206) vs nrde-3(jam205) | 116, 105 | 16, 72 | <0.00001, * | AMJ1489, AMJ1510 | |
| 2F unc-54 | wild type vs mut-16(jam148) | 148, 124 | 142, 2 | <0.00001, * | N2, AMJ1397 | |
| 2F unc-54 | wild type vs rde-10(jam206) | 148, 128 | 142, 2 | <0.00001, * | N2, AMJ1489 | |
| 2F unc-54 | wild type vs nrde-3(jam205) | 148, 263 | 142, 49 | <0.00001, * | N2, AMJ1510 | Fed on a different day with similar N2 silencing 164/171 animals showing Unc-54 |
| 2F unc-54 | wild type vs mut-16(jam148) rde-10(jam196) | 148, 159 | 142, 0 | <0.00001, * | N2, AMJ1470 | |
| 2F unc-54 | wild type vs mut-16(jam148); nrde-3(jam205) | 148, 166 | 142, 0 | <0.00001, * | N2, AMJ1545 | Fed on a different day with similar N2 silencing 164/171 animals showing Unc-54 |
| 2F unc-54 | wild type vs rde-10(jam206); nrde-3(jam205) | 148, 206 | 142, 0 | <0.00001, * | N2, AMJ1568 | Fed on a different day with similar N2 silencing 164/171 animals showing Unc-54 |
| 2F unc-54 | nrde-3(jam205) vs mut-16(jam148) | 263, 124 | 49, 2 | <0.00001, * | AMJ1510, AMJ1397 | |
| 2F unc-54 | nrde-3(jam205) vs rde-10(jam206) | 263, 128 | 49, 2 | <0.00001, * | AMJ1510, AMJ1489 | |
| 2F dpy-7 | wild type vs mut-16(jam148) | 322, 130 | 279, 34 | <0.00001, * | N2, AMJ1397 | |
| 2F dpy-7 | wild type vs rde-10(jam206) | 322, 159 | 279, 2 | <0.00001, * | N2, AMJ1489 | |
| 2F dpy-7 | wild type vs nrde-3(jam205) | 322, 126 | 279, 3 | <0.00001, * | N2, AMJ1510 | |
| 2F dpy-7 | wild type vs mut-16(jam148) rde-10(jam196) | 322, 184 | 279, 0 | <0.00001, * | N2, AMJ1470 | |
| 2F dpy-7 | wild type vs mut-16(jam148); nrde-3(jam205) | 322, 99 | 279, 0 | <0.00001, * | N2, AMJ1545 | |
| 2F dpy-7 | wild type vs rde-10(jam206); nrde-3(jam205) | 322, 180 | 279, 0 | <0.00001, * | N2, AMJ1568 | |
| 2F dpy-7 | mut-16(jam148) vs rde-10(jam206) | 130, 159 | 34, 2 | <0.00001, * | AMJ1397, AMJ1489 | |
| 2F dpy-7 | mut-16(jam148) vs nrde-3(jam205) | 130, 126 | 34, 6 | <0.00001, * | AMJ1397, AMJ1510 | |
| 2F | wild type vs mut-16(jam148) | 183, 107 | 179, 5 | <0.00001, * | N2, AMJ1397 | |
| 2F | wild type vs rde-10(jam206) | 183, 116 | 179, 16 | <0.00001, * | N2, AMJ1489 | |
| 2F | wild type vs nrde-3(jam205) | 183, 105 | 179, 72 | <0.00001, * | N2, AMJ1510 | |
| 2F | mut-16(jam148) vs rde-10(jam206) | 107, 116 | 5, 16 | 0.0190241, * | AMJ1397, AMJ1489 | |
| 2F | rde-10(jam206) vs nrde-3(jam205) | 116, 105 | 16, 72 | <0.00001, * | AMJ1489, AMJ1510 | |
| 3B | wild type vs eri-1(mg366) | 200, 200 | 134, 145 | 0.231163, ns | N2, GR1373 | N2 from a second experiment showed comparable values (219/304), GR1373 from a second experiment showed comparable values (169/213) |
| 3B | nrde-3(jam205) vs eri-1(mg366); nrde-3(tm1116) | 143, 200 | 3, 167 | 0.000132, * | N2, AMJ489 | |
| 3B | mut-16(148/268) vs mut-16(jam265-7); eri-1(jam263) | 172, 354 | 0, 0 | >0.5, ns | AMJ1397, AMJ1675, AMJ1672-4 | AMJ1397 (0/110) and AMJ1675 (0/123) were pooled; AMJ1672 (0/130), AMJ1673 (0/88), and AMJ1674 (0/111) were pooled |
| 3B | rde-10(jam206) vs rde-10(jam206); eri-1(mg366) | 233, 329 | 0, 0 | >0.5, ns | AMJ1489, AMJ1622, AMJ1623 | AMJ1622 (0/171) and AMJ1623 (0/183) were pooled |
| 3B | nrde-3(jam205) vs eri-1(mg366); nrde-3(jam205) | 143, 169 | 3, 130 | <0.00001, * | AMJ1510, AMJ1621 | |
| 3C | mut-16(jam148/240) rde-10(jam196/206) vs mut-16(jam240) rde-10(jam 206); eri-1(jam260-2) | 149, 191 | 1, 10 | 0.01826, * | AMJ1470, AMJ1611, AMJ1657-9 | AMJ1470 (0/32) and AMJ1661 (1/116) were pooled; AMJ1657 (9/75), AMJ1658 (0/56), and AMJ1659 (1/50) were pooled |
| 3C | rde-10(jam206); nrde-3(jam205) vs rde-10(jam206); eri-1(mg366); nrde-3(jam205) | 113, 265 | 6, 18 | 0.58837, ns | AMJ1568, AMJ1624, AMJ1625 | AMJ1624 (4/135) and AMJ1625 (14/112) were pooled |
| 3C | mut-16(jam148); nrde-3(jam205) vs mut-16(jam148); eri-1(mg366); nrde-3(jam205) | 28, 110 | 4, 1 | 0.00072, * | AMJ1545, AMJ1631, AMJ1632 | AMJ1631 (1/52) and AMJ1632 (0/57) were pooled |
| 3D bli-1 | wild type vs rde-1(ne219) | 50, 37 | 41, 0 | <0.00001, * | N2, WM27 | N2 data from rde-4(−) experiment; N2 data from rde-1(−) experiment (not shown) is comparable with 41/50 silenced |
| 3D bli-1 | wild type vs rde-4(ne301) | 40, 50 | 40, 0 | <0.00001, * | N2, WM49 | N2 data from rde-4(−) experiment; N2 data from rde-1(−) experiment (not shown) is comparable with 41/50 silenced |
| 3D bli-1 | wild type vs Si[mex-5p::rde-1(+)]/+; rde-1(ne219) | 50, 33 | 41, 0 | <0.00001, * | N2, AMJ345 | N2 data from rde-4(−) experiment; N2 data from rde-1(−) experiment (not shown) is comparable with 41/50 silenced |
| 3D bli-1 | wild type vs Si[mex-5p::rde-4(+)]/+; rde-4(ne301) | 40, 41 | 40, 41 | >0.5, ns | N2, AMJ285 | N2 data from rde-4(−) experiment; N2 data from rde-1(−) experiment (not shown) is comparable with 41/50 silenced |
| 3D unc-22 | wild type vs rde-1(ne219) | 25, 25 | 25, 0 | <0.00001, * | N2, WM27 | |
| 3D unc-22 | wild type vs rde-4(ne301) | 25, 25 | 25, 0 | <0.00001, * | N2, WM49 | |
| 3D unc-22 | wild type vs Si[mex-5p::rde-1(+)]/+; rde-1(ne219) | 25, 24 | 25, 2 | <0.00001, * | N2, AMJ345 | |
| 3D unc-22 | wild type vs Si[mex-5p::rde-4(+)]/+; rde-4(ne301) | 25, 24 | 25, 16 | 0.001600, † | N2, AMJ285 | † indicates statistical significance vs wild type and vs rde-4(ne301) mutant |
| 3D unc-22 | rde-4(ne301) vs Si[mex-5p::rde-4(+)]/+; rde-4(ne301) | 25, 24 | 0, 16 | <0.00001, † | WM49, AMJ285 | † indicates statistical significance vs wild type and vs rde-4(ne301) mutant |
| 3E | wild type vs rde-4(ne301); nrde-3(tm1116) | 150, 200 | 142, 0 | <0.00001, * | N2, AMJ183 | |
| 3E | wild type vs rde-4(ne301); nrde-3(tm1116); Si[nas-9p::rde-4(+)] | 150, 150 | 142, 98 | <0.00001, † | N2, AMJ611 | † indicates statistical significance vs wild type and vs rde-4(ne301); nrde-3(tm1116) mutant |
| 3E | rde-4(ne301); nrde-3(tm1116); vs rde-4(ne301); nrde-3(tm1116); Si[nas-9p::rde-4(+)] | 200, 150 | 0, 98 | <0.00001, † | AMJ183, AMJ611 | † indicates statistical significance vs wild type and vs rde-4(ne301); nrde-3(tm1116) mutant |
| 3F | wild type vs eri-1(mg366); nrde-3(jam205) | 282, 140 | 85, 69 | 0.0001199, * | N2, AMJ1621 | |
| 3F | wild type vs rde-10(jam206); eri-1(mg366) | 282, 279 | 85, 0 | <0.00001, * | N2, AMJ1622 | |
| 3F | wild type v Si[nas-9p::rde-4(+)]; rde-10(jam206) | 282, 180 | 85, 6 | <0.00001, * | N2, AMJ1723 | |
| 3F | wild type v Si[nas-9p::rde-4(+)]; rde-10(jam206); eri-1(mg366) | 282, 202 | 85, 0 | <0.00001, * | N2, AMJ1724 | |
| 3F | wild type vs mut-16(jam148); eri-1(mg366) | 282, 70 | 85, 0 | <0.00001, * | N2, AMJ1672 | |
| 3F | wild type v Si[nas-9p::rde-4(+)]; mut-16(jam148) | 282, 152 | 85, 0 | <0.00001, * | N2, AMJ1721 | |
| 3F | wild type v Si[nas-9p::rde-4(+)]; mut-16(jam148); eri-1(mg366) | 282, 187 | 85, 0 | <0.00001, * | N2, AMJ1722 | |
| 5B | wild type vs bli-1(jam307) | 488, 443 | 390, 425 | <0.00001, * | N2, AMJ1754 | |
| 5B | wild type vs bli-1(jam308) | 488, 245 | 390, 185 | 0.170996, ns | N2, AMJ1755 | |
| 5B | wild type vs nrde-3(jam205) | 488, 377 | 390, 111 | <0.00001, * | N2, AMJ1510 | |
| 5B | bli-1(jam307) vs bli-1(jam307); nrde-3(jam205) | 443, 459 | 425, 313 | <0.00001, * | AMJ1754, AMJ1758 | |
| 5B | nrde-3(jam205) vs bli-1(jam307); nrde-3(jam205) | 377, 459 | 111, 313 | <0.00001, * | AMJ1510, AMJ1758 | |
| 5B | bli-1(jam308) vs bli-1(jam308); nrde-3(jam205) | 245, 117 | 185,38 | <0.00001, * | AMJ1755, AMJ1771 | |
| 5B | wild type vs bli-1(jam307) | 488, 443 | 390, 425 | <0.00001, * | N2, AMJ1754 | |
| 5D | bli-1p::gfp vs mut-16(jam148); bli-1p::gfp | 21, 25 | 21, 6 | <0.00001, * | AMJ1709, AMJ1727 | |
| 5D | bli-1p::gfp vs rde-10(jam206); bli-1p::gfp | 21, 25, | 21, 9 | <0.00001, * | AMJ1709, AMJ1725 | |
| 5D | bli-1p::gfp vs nrde-3(jam205); bli-1p::gfp | 21, 25 | 21, 23 | 0.18508, ns | AMJ1709, AMJ1726 | |
| 5D | bli-1p::gfp vs mut-16(jam148)rde-10(jam196); bli-1p::gfp | 21, 20 | 21, 0 | <0.00001, * | AMJ1709, AMJ1728 | |
| 6A | 1 vs 2 days post RNAi | 94, 91 | 76, 86 | 0.00489, * | N2 | |
| 6A | 1 vs 3 days post RNAi | 94, 92 | 76, 89 | 0.00062, * | N2 | |
| 6A | 1 vs 4 days post RNAi | 94, 93 | 76, 89 | 0.001627, * | N2 | |
| 6A | 5 days post RNAi vs 7 days on RNAi | 110, 55 | 63, 51 | <0.00001, * | N2 | |
| 6A | 6 days post RNAi vs 7 days on RNAi | 104, 55 | 61, 51 | <0.00001, * | N2 | |
| 6A | 7 days post RNAi vs 7 days on RNAi | 112, 55 | 60, 51 | <0.00001, * | N2 | |
| 6A | 8 days post RNAi vs 7 days on RNAi | 124, 55 | 45, 51 | <0.00001, * | N2 | |
| S2B | wild type vs rde-10(jam243) | 115, 102 | 115, 100 | 0.13140071, ns | N2, AMJ1614 | |
| S2B | wild type vs mut-16(jam240) rde-10(jam206) | 115, 137 | 115, 5 | <0.00001, * | N2, AMJ1611 | |
| S2C | wild type vs mut-16(jam268) | 322, 74 | 279, 20 | <0.00001, * | N2, AMJ1675 | From the same feed in Figure 2E |
| S6B | wild type unc-22 vs wild type pL4440 | 138, 116 | 138, 0 | <0.00001, * | N2 | |
| S6B | wild type unc-22 vs nrde-3(jam205) unc-22 | 138, 110 | 138, 79 | <0.00001, * | N2, AMJ1510 | |
| S6B | unc-22(jam300) unc-22 vs unc-22(jam300) pL4440 | 101, 113 | 101, 101 | 0.00128, * | AMJ1730 | |
| S6B | unc-22(jam301) unc-22 vs unc-22(jam301) pL4440 | 101, 65 | 101, 49 | <0.00001, * | AMJ1731 | |
| S6B | unc-22(jam300); nrde-3(jam205) unc-22 vs unc-22(jam300); nrde-3(jam205) pL4440 | 82, 108 | 70, 83 | 0.14214, ns | AMJ1757 | |
| S6B | unc-22(jam300); nrde-3(jam205) unc-22 vs unc-22(jam300) unc-22 | 82, 101 | 70, 101 | <0.00001, * | AMJ1757, AMJ1730 | |
| S6B | unc-22(jam300); nrde-3(jam205) unc-22 vs nrde-3(jam205) unc-22 | 82,110 | 70, 79 | 0.02592, * | AMJ1757, AMJ1510 |
-
Table 3—source data 1
Excel sheet containing all information in Table 3.
- https://cdn.elifesciences.org/articles/97487/elife-97487-table3-data1-v1.xlsx
Additional files
Download links
A two-part list of links to download the article, or parts of the article, in various formats.
Downloads (link to download the article as PDF)
Open citations (links to open the citations from this article in various online reference manager services)
Cite this article (links to download the citations from this article in formats compatible with various reference manager tools)
Target-specific requirements for RNA interference can arise through restricted RNA amplification despite the lack of specialized pathways
eLife 13:RP97487.
https://doi.org/10.7554/eLife.97487.3


