Convergence of inputs from the basal ganglia with layer 5 of motor cortex and cerebellum in mouse motor thalamus
- Department of Neurobiology, University of Chicago, United States
Figures
Figure 1
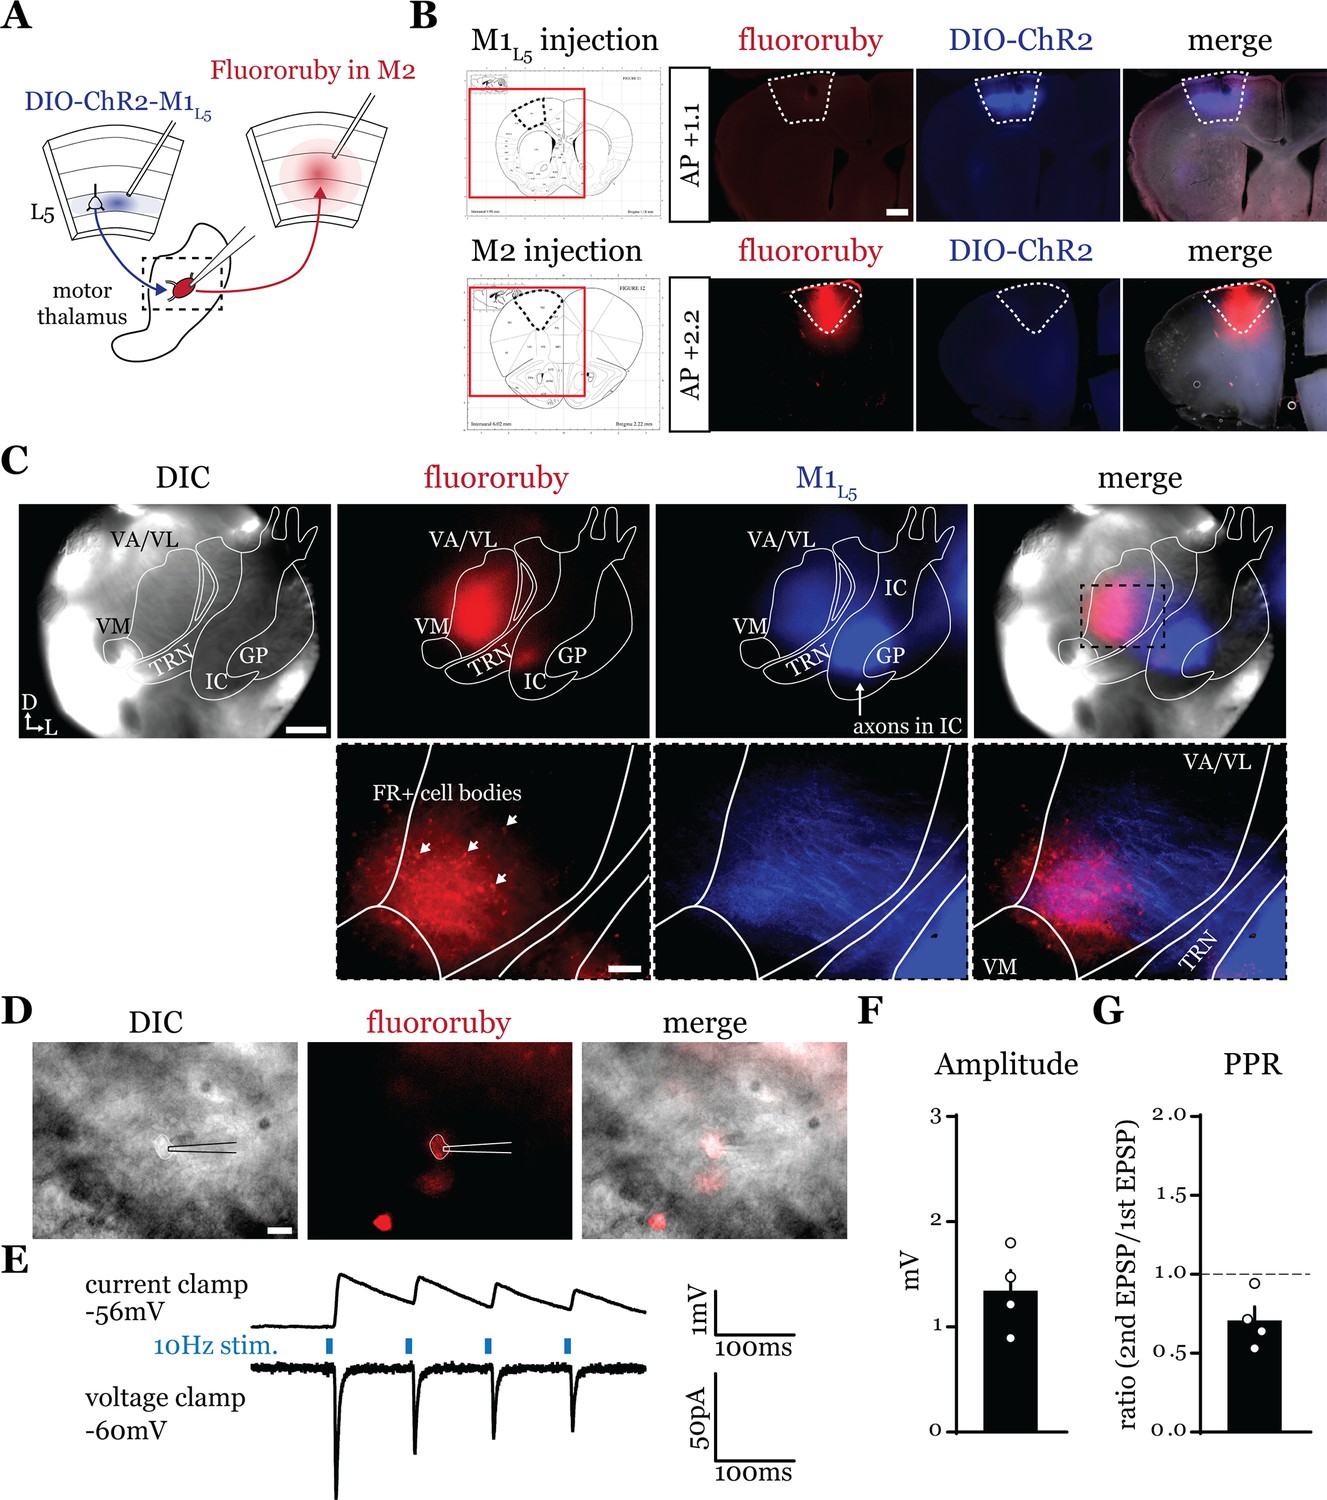
A feedforward transthalamic pathway through ventral anterior (VA)/ventral lateral (VL) motor thalamus.
(A) Schematic of injections and experiment. (B) Representative of primary motor cortex (M1) (top row) and secondary motor cortex (M2) (bottom row) injection sites with the corresponding Paxinos and Franklin, 2007, atlas image, demonstrating no bleed through of one injection to the next. Scale = 500 μm. (C) Representative low-magnification (×4) differential interference contrast (DIC) and fluorescence images from the recording rig (top row) and post hoc histology of layer 5 of primary motor cortex (M1L5) (ChR2) and M2 (fluororuby) labeling (bottom row) demonstrating a region of overlap between the two labels in the ventral VA/VL. Scale = 500 μm for top row, 100 μm for bottom row. (D) Representative high-magnification (×40 immersion) images from the recording rig demonstrating the recording electrode patched onto a fluororuby-positive neuron in VA/VL (same neuron the traces in E are derived from). Scale = 20 μm. (E) Representative traces in current (top) or voltage (bottom) clamp (held at –60 mV) of laser-evoked responses (blue rectangles) in an M2-projecting VA/VL thalamic neuron. (F) Quantification of the amplitude of the first excitatory postsynaptic potential (EPSP) in a 10 Hz pulse train for all cells in the transthalamic pathway (n=4). (G) Quantification of the paired-pulse ratio (PPR; amplitude of second EPSP/first EPSP in a 10 Hz pulse train) for all cells in the transthalamic pathway (n=4). Data are mean ± SEM.
-
Figure 1—source data 1
Amplitude and PPR values for Figure 1F and G.
- https://cdn.elifesciences.org/articles/97489/elife-97489-fig1-data1-v2.xlsx
Figure 2 with 1 supplement
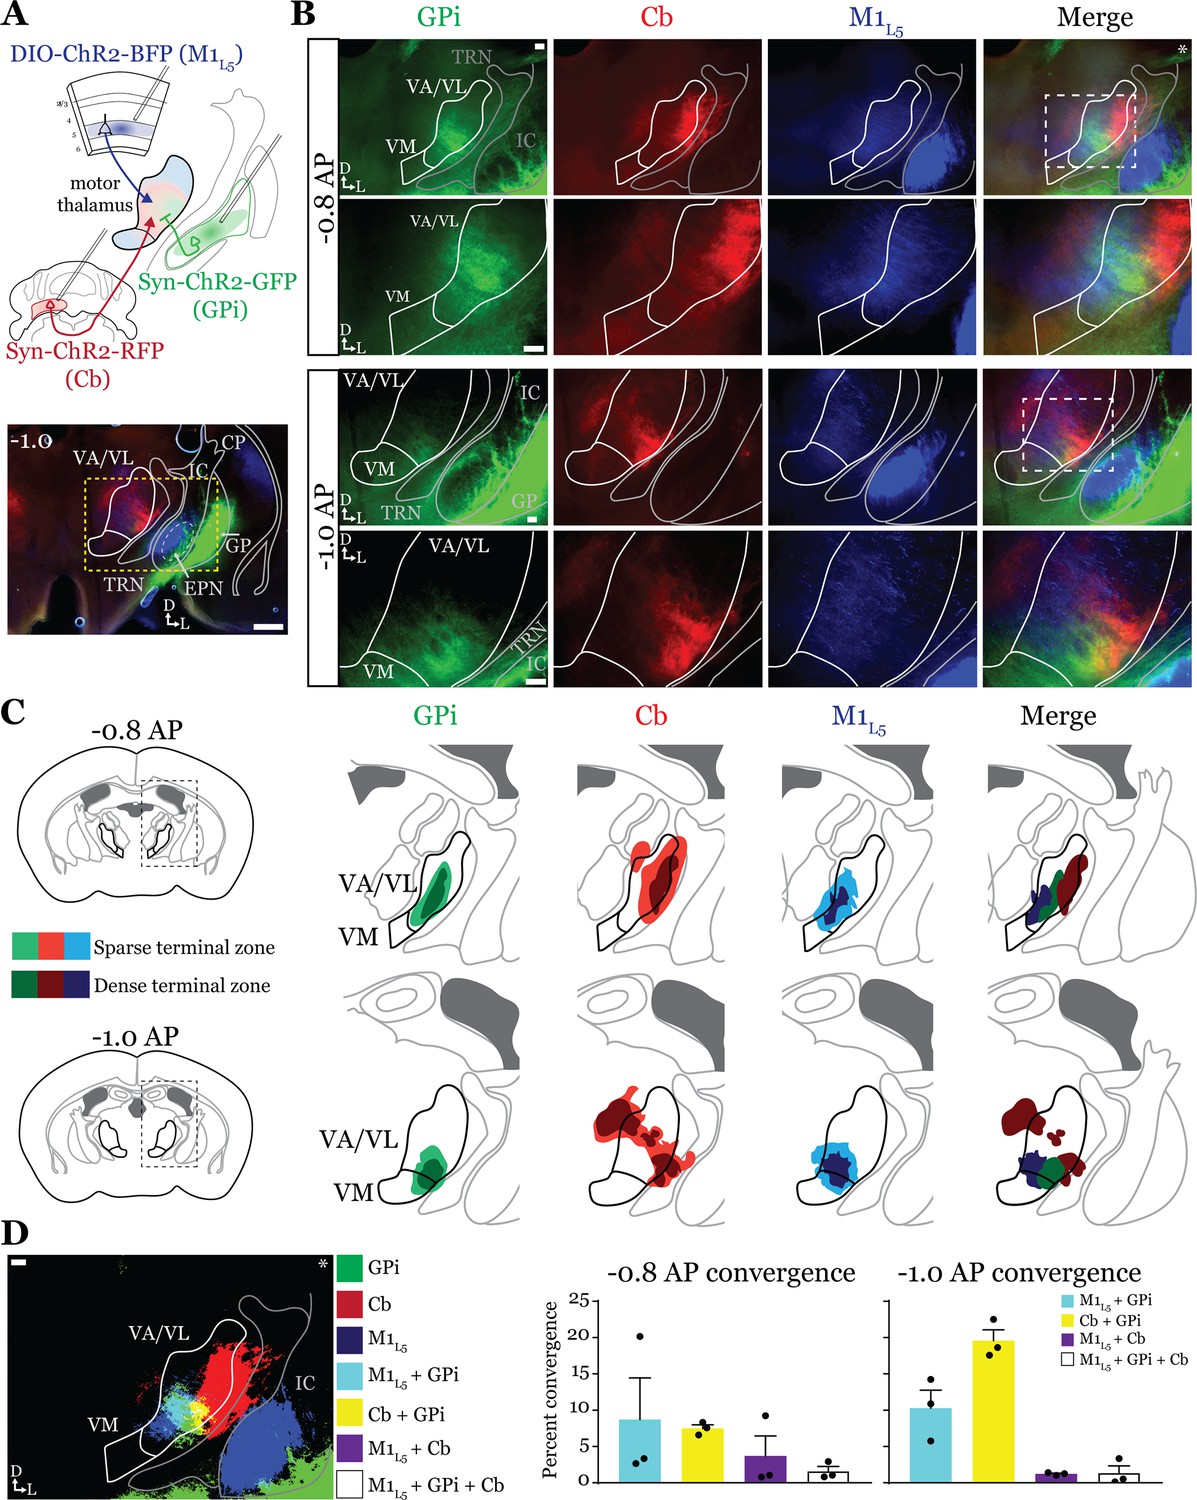
Anterograde labeling reveals overlap of inputs in ventral anterior (VA)/ventral lateral (VL) motor thalamus.
(A) Schematic of injections and experiment (top) with representative low-magnification image (bottom) of a section demonstrating the three terminal zones in motor thalamus and internal segment of the globus pallidus (GPi) injection site. White dashed line represents the entopeduncular nucleus (EPN), referred to here as the GPi, which shows expression of virus in addition to the globus pallidus (GP) lateral to the internal capsule (IC). Yellow dashed line represents the area of higher magnification images shown in B. Scale = 500 μm. (B) Representative images of coronal sections at –0.8 mm and –1.0 mm AP from bregma. Injection site and terminals from GPi (green), terminals from cerebellar nuclei (Cb) (red), and layer 5 of primary motor cortex (M1L5) axons (blue) coursing through the internal capsule and innervating motor thalamus are visible. White dashed line represents the area imaged in higher magnification in the next row of images. Asterisk demarks the same image used for convergence analysis in D. Scale = 100 μm for all images. (C) Cross-animal (n=3) averaged input maps of motor thalamus inputs at –0.8 mm and –1.0 mm AP from bregma color coded as in A and B. Dark colors represent dense terminal fields, while lighter colors represent sparser terminal fields. In the merged image (right), only outlines of the dense terminal fields are included. (D) Representative image depicting the terminal fields from each input with bit masks color coded as in A–C and quantification (right) of terminal field overlap (see Materials and methods) for sections at –0.8 mm and –1.0 mm AP from bregma. See Figure 2—figure supplement 1 for representative injection sites and additional images of the rostral-caudal extent of inputs to motor thalamus.
-
Figure 2—source data 1
Convergence values for Figure 2D.
- https://cdn.elifesciences.org/articles/97489/elife-97489-fig2-data1-v2.xlsx
Figure 2—figure supplement 1
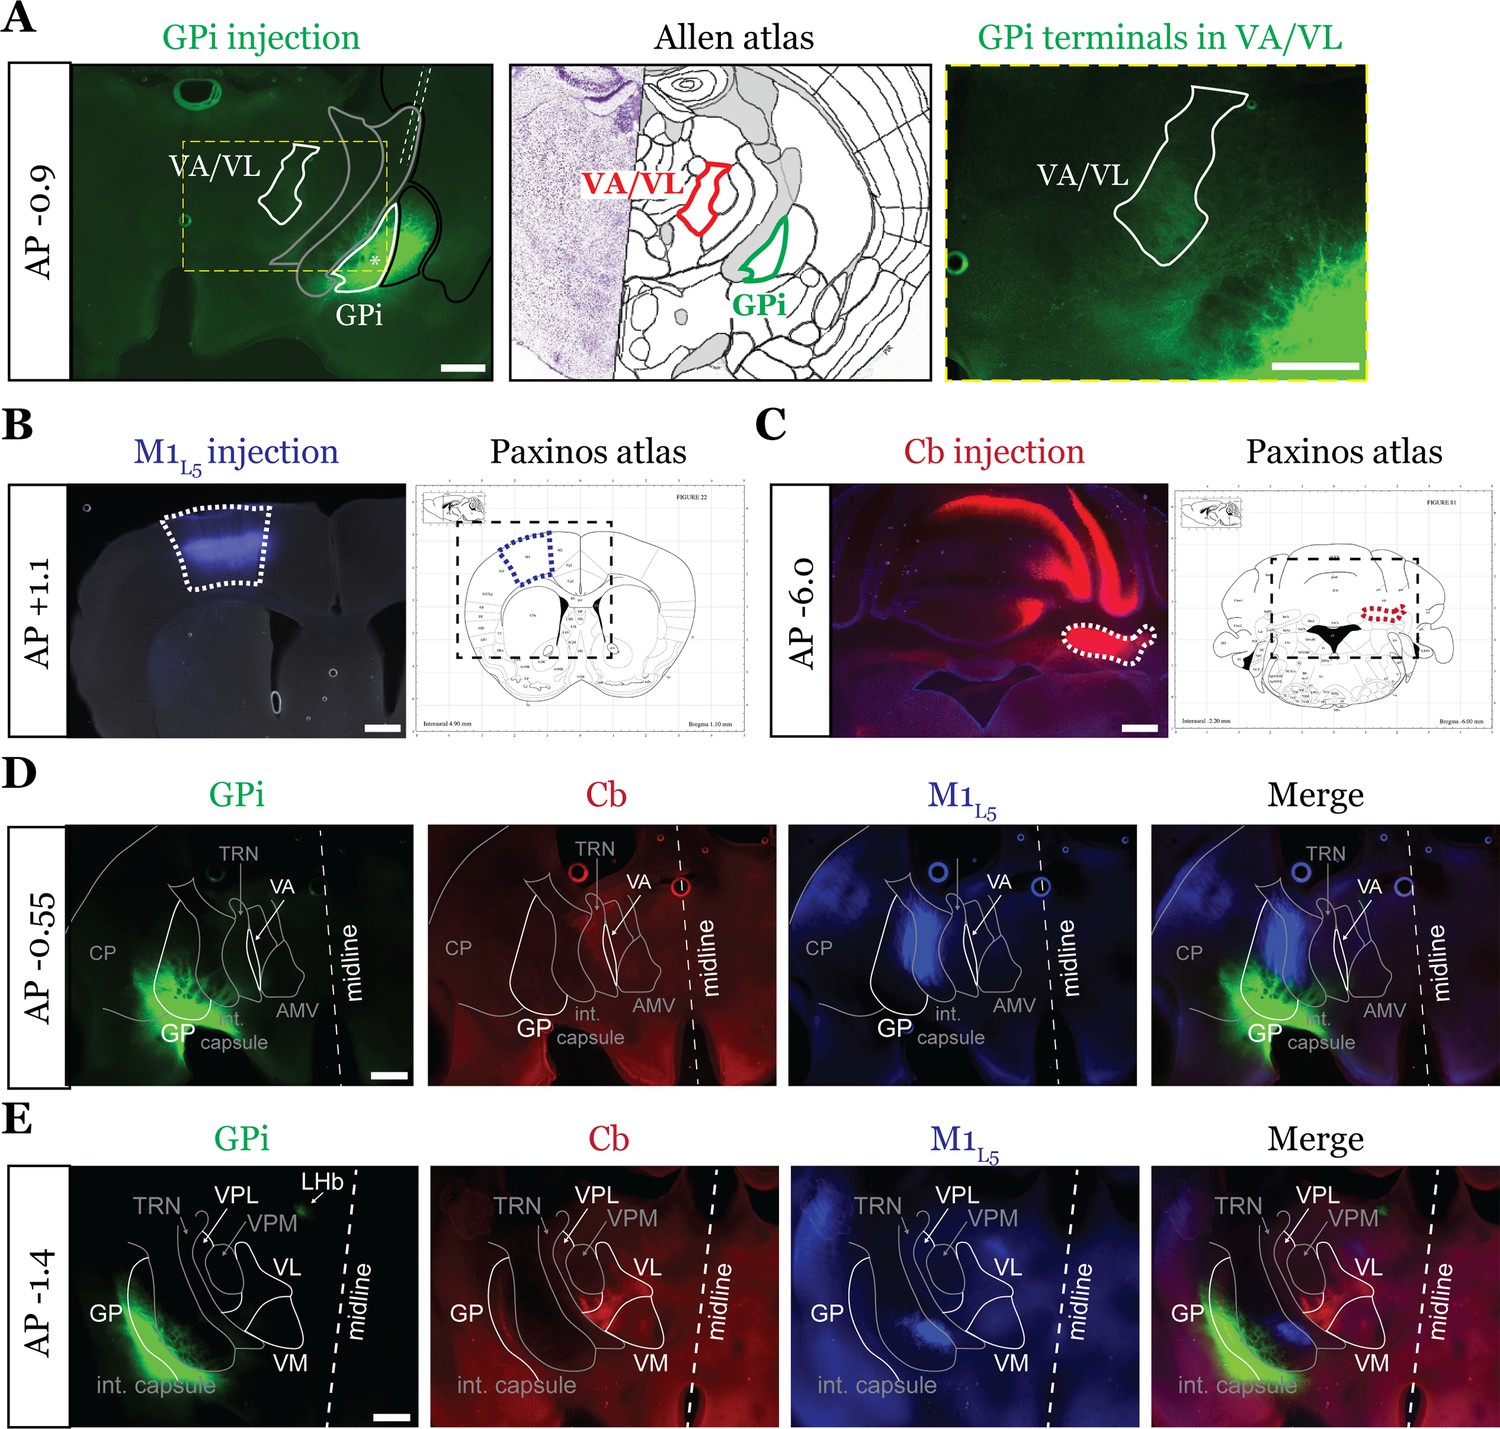
The examined inputs are segregated at the rostral and caudal poles of the motor thalamus.
Representative injection sites for internal segment of the globus pallidus (GPi) (A), layer 5 of primary motor cortex (M1L5) (B), and cerebellar nuclei (Cb) (C) for a three color-labeled animal. Viruses injected are depicted in Figure 2A. Note the reference to the Allen Coronal Atlas (https://mouse.brain-map.org/static/atlas) depicting the GPi injection site and ventral anterior (VA)/ventral lateral (VL) terminal zone, where marked. Also note that for Cb injections, the bolus of virus was introduced without the necessity for restriction to the deep Cb, as these are the only outputs of the Cb. (D) Representative images of coronal sections at –0.55 mm AP from bregma. Injection site and terminals from GPi (green), terminals (or lack thereof) from Cb (red), and M1L5 axons (blue) coursing through the internal capsule and innervating motor thalamus are shown. Note that at this rostral pole of the motor thalamus, where a thin sliver of VA is visible, only a limited projection from GPi is visible, whereas cerebellar and M1L5 terminals are absent. Scale = 100 μm for all images. (E) Representative images of coronal sections at –1.4 mm AP from bregma. Injection site and terminals (or lack thereof) from GPi (green), terminals from Cb (red), and M1L5 axons (blue) coursing through the internal capsule and innervating motor thalamus are shown. Note that at this caudal region of the motor thalamus, Cb fibers are well represented in the VPL and VL, while only a minimal projection from GPi is visible; M1L5 terminals largely innervate ventral medial (VM). Scale = 500 μm for all images.
Figure 3
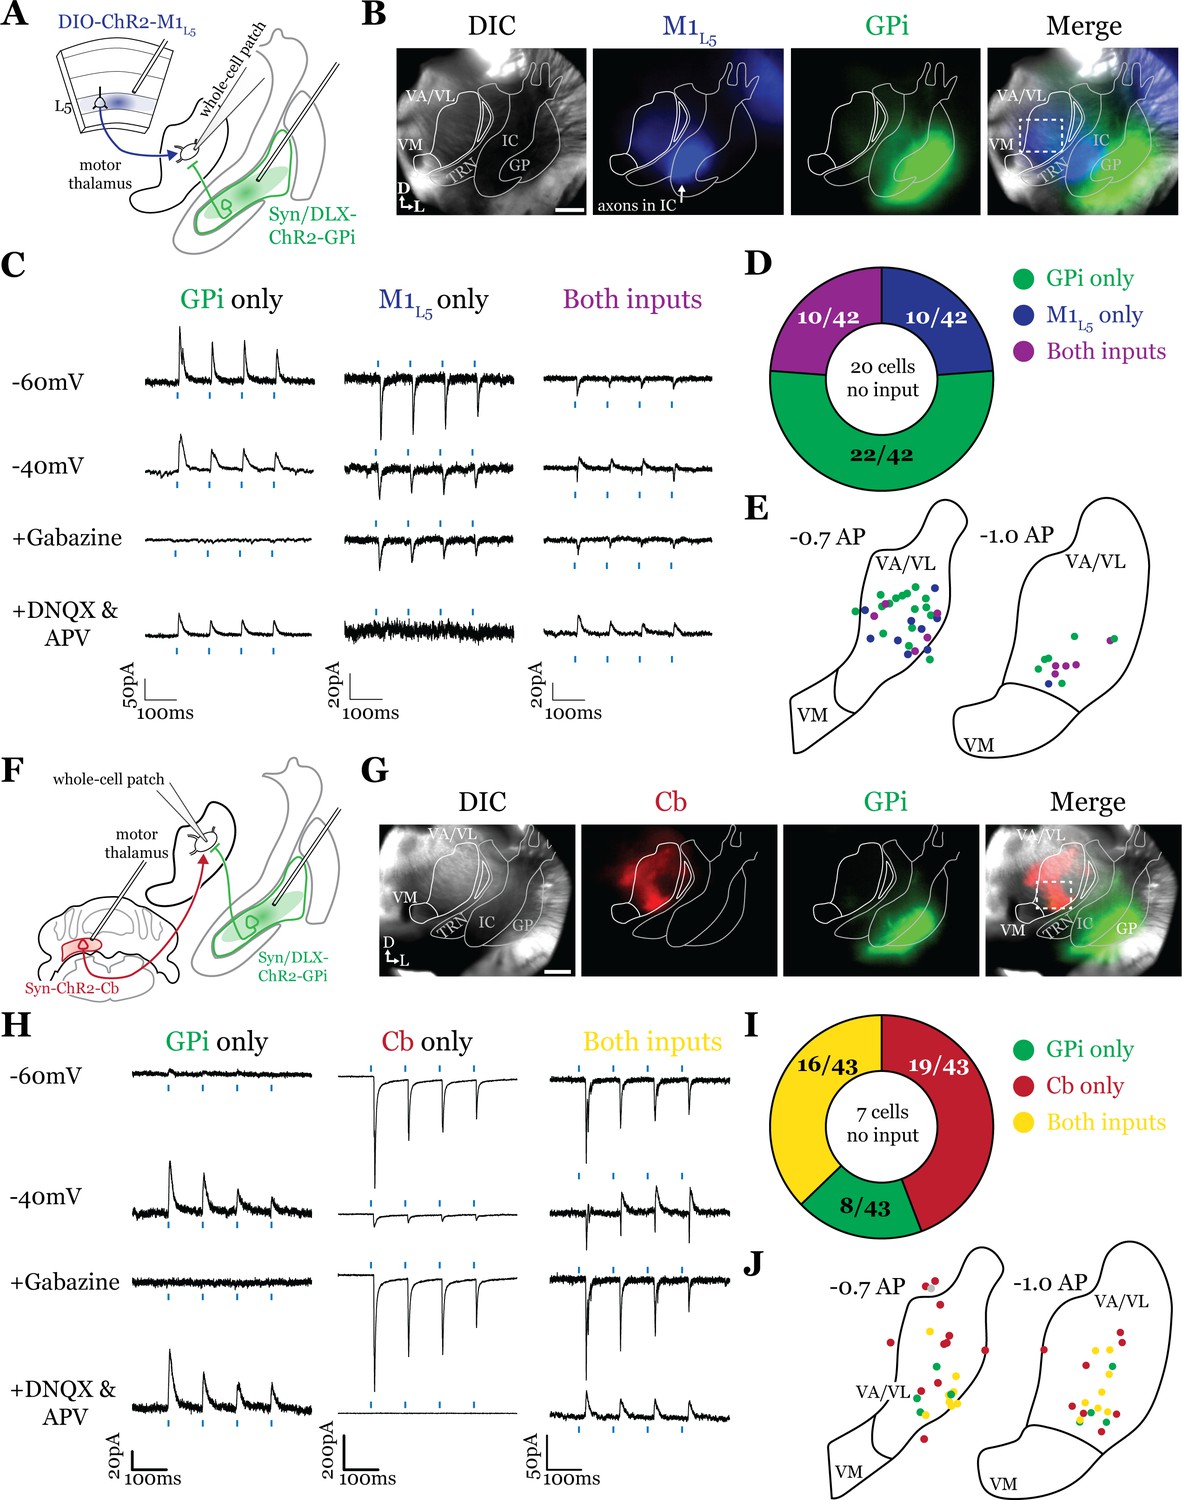
Internal segment of the globus pallidus (GPi) inputs to motor thalamus converge with those from layer 5 of primary motor cortex (M1L5) and cerebellar nuclei (Cb).
(A) Schematic of experiment. (B) Representative images from recording apparatus of the acute coronal slice (left) showing injection sites into GPi and terminals in motor thalamus (green), M1L5 axons coursing through the internal capsule and terminals in motor thalamus (blue), and merged image. Dashed rectangle indicates approximate target of recording. Arrows in bottom left of image represent dorsal (D) and lateral (L) directions. Scale = 0.5 mm. (C) Representative traces in voltage clamp of laser-evoked responses (blue rectangles) in three motor thalamic neurons (recorded with low Cl- internal solution) held near the resting membrane potential (Vm, –60), at –40 mV, at –40 mV with application of the GABAA antagonist gabazine (20 μM), and at –60 mV with application of the ionotropic glutamate receptor (iGluR) antagonists, DNQX (50 μM) and AP5 (100 μM). Note that some cells only exhibit inhibitory postsynaptic currents (IPSCs), some only excitatory postsynaptic currents (EPSCs), and some demonstrate a mixed EPSC/IPSC response, of which the excitatory or inhibitory components are abolished by iGluR or GABAA blockade, respectively. For quantification of the synaptic properties of excitatory inputs, see Figure 6D. (D) Summary data depicting how many recorded cells receive only GPi input, only M1L5 input, both, or neither. (E) Spatial pattern of motor thalamus neurons receiving each input type color coded to the inputs they receive. (F) Schematic of experiment. (G) Representative images from recording apparatus of the acute coronal slice (left) showing injection sites into GPi and terminals in motor thalamus (green), Cb terminals in motor thalamus (red), and merged image. Dashed rectangle indicates approximate target of recording. Arrows in bottom left of image represent dorsal (D) and lateral (L) directions. Scale = 0.5 mm. (H) Representative traces in voltage clamp of laser-evoked responses (blue rectangles) in three motor thalamic neurons (recorded with low Cl- internal solution) held near the resting membrane potential (Vm, –60), at –40 mV, at –40 mV with application of the GABAA antagonist gabazine (20 μM), and at –60 mV with application of the iGluR antagonists, DNQX (50 μM) and AP5 (100 μM). Note that some cells only exhibit IPSCs, some only EPSCs, and some demonstrate a mixed EPSC/IPSC response, of which the excitatory or inhibitory components are abolished by iGluR or GABAA blockade, respectively. (I) Summary data depicting how many recorded cells receive only GPi input, only Cb input, both, or neither. (J) Spatial pattern of motor thalamus relays color coded to the inputs they receive.
Figure 4 with 1 supplement
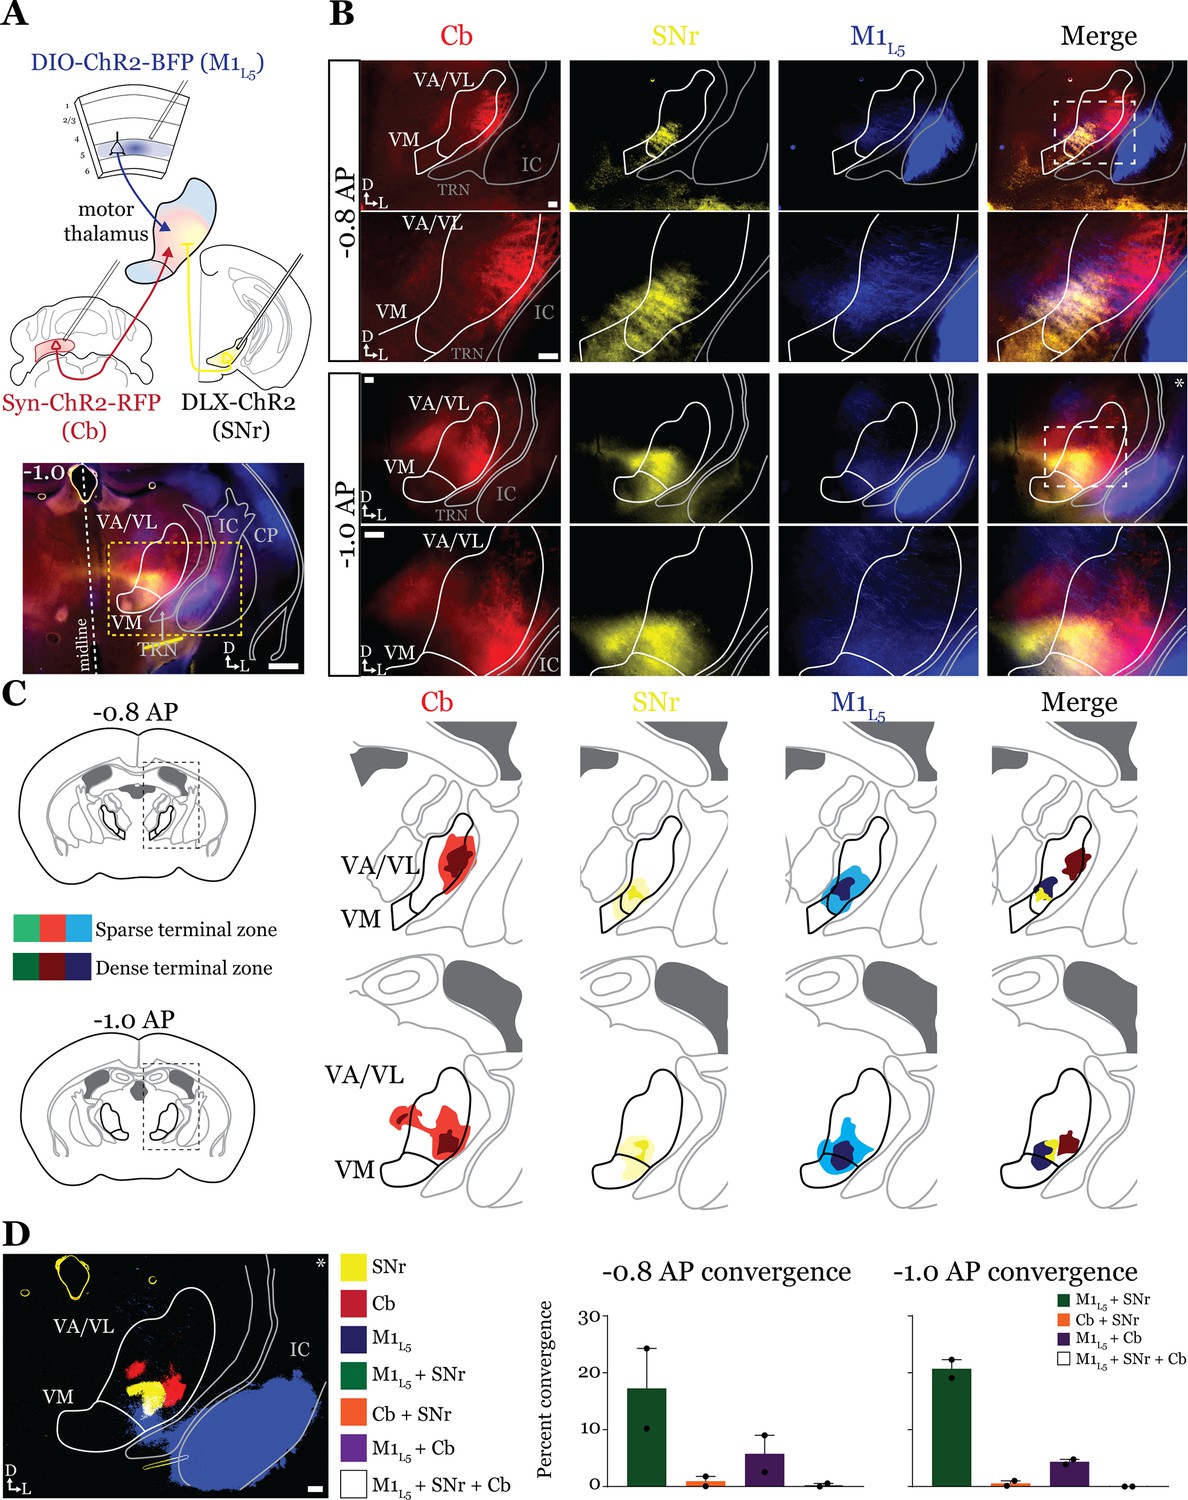
Anterograde labeling reveals stronger overlap between substantia nigra pars reticulata (SNr) and layer 5 of primary motor cortex (M1L5) compared to cerebellar nuclei (Cb) and SNr in ventral anterior (VA)/ventral lateral (VL) motor thalamus.
(A) Schematic of injections and experiment (top) with representative low-magnification image (bottom) of a section demonstrating the three terminal zones in motor thalamus. Yellow dashed line represents the area of higher magnification images shown in B. Scale = 500 μm. (B) Representative images of coronal sections at –0.8 mm and –1.0 mm AP from bregma. Terminals from SNr (yellow), terminals from Cb (red), and M1L5 axons (blue) coursing through the internal capsule and innervating motor thalamus are visible. White dashed line represents the area imaged in higher magnification in the next row of images. Asterisk demarks the same image represented for convergence analysis in D. Scale = 100 μm for all images. (C) Cross-animal (n=2) averaged input maps of motor thalamus inputs at –0.8 mm and –1.0 mm AP from bregma color coded as in A and B. Dark colors represent dense terminal fields, while lighter colors represent sparser terminal fields. In the merged image (right), only outlines of the dense terminal fields are included. (D) Representative image depicting the terminal fields from each input with bit masks color coded as in A–C and quantification (right) of terminal field overlap (see Materials and methods) for sections at –0.8 mm and –1.0 mm AP from bregma. See Figure 4—figure supplement 1 for representative injection sites.
-
Figure 4—source data 1
Convergence values for Figure 4D.
- https://cdn.elifesciences.org/articles/97489/elife-97489-fig4-data1-v2.xlsx
Figure 4—figure supplement 1
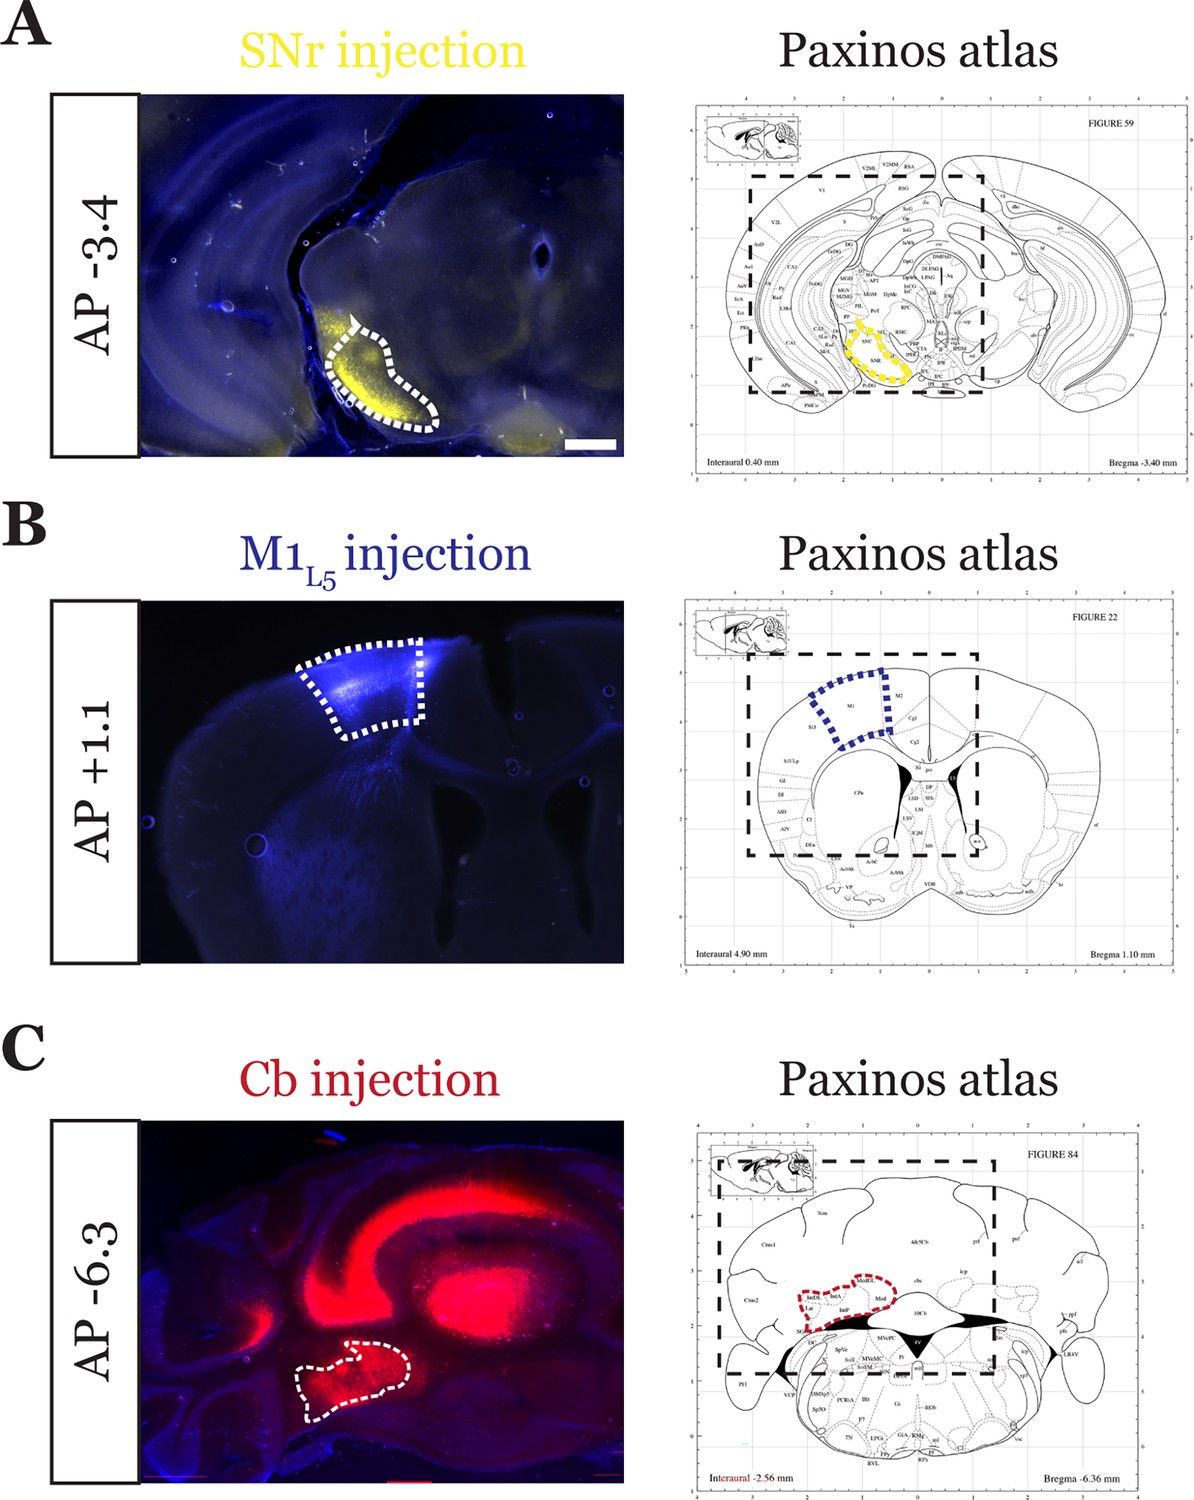
Representative injection sites for tricolor-labeled substantia nigra pars reticulata (SNr) animal.
Representative injection sites for SNr (A), layer 5 of primary motor cortex (M1L5) (B), and cerebellar nuclei (Cb) (C) for a three-color-labeled animal. Viruses injected are depicted in Figure 4A. Note that for Cb injections, the bolus of virus was introduced without the necessity for strict restriction to the deep Cb, as these are the only outputs of the Cb. Scale = 500 μm for all images.
Figure 5
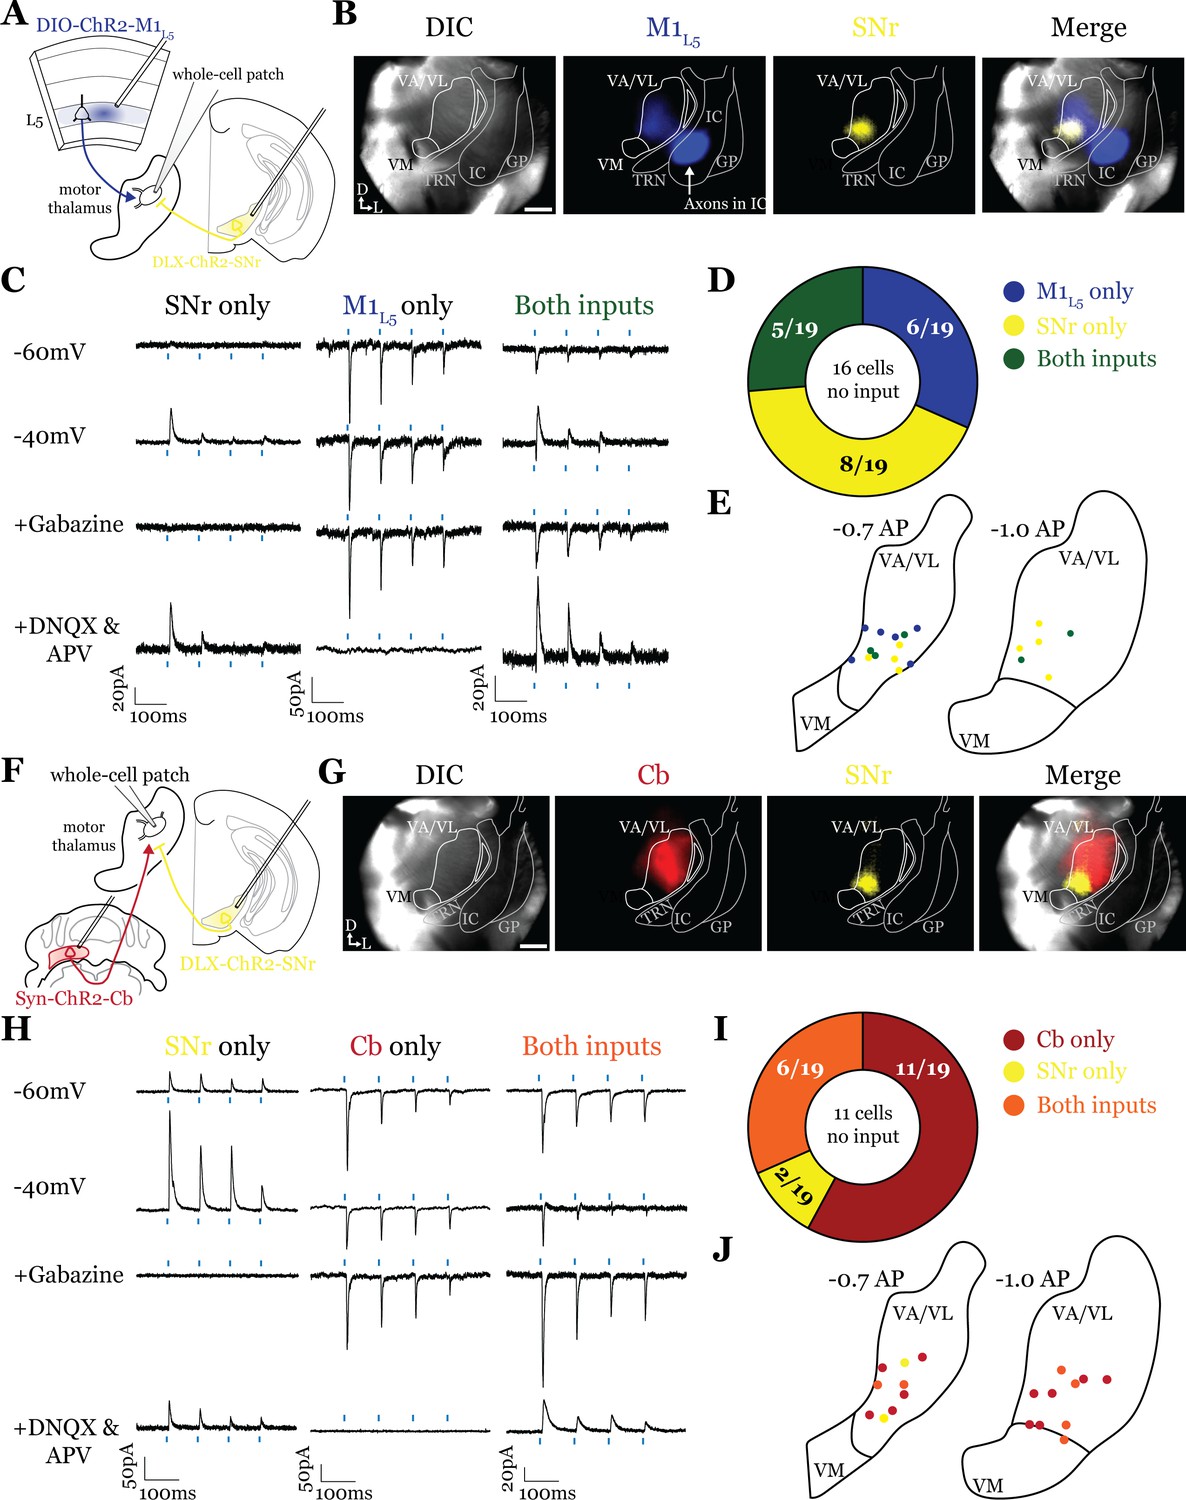
Substantia nigra pars reticulata (SNr) inputs to motor thalamus converge with those from layer 5 of primary motor cortex (M1L5) and cerebellar nuclei (Cb).
(A) Schematic of experiment. (B) Representative images from recording apparatus of the acute coronal slice showing SNr synaptic terminals in the motor thalamus (yellow), and M1L5 axons invading the motor thalamus through the internal capsule (blue), and merged image. Arrows in bottom left of image represent dorsal (D) and lateral (L) directions. Scale = 0.5 mm. (C) Representative traces in voltage clamp of laser-evoked responses (blue rectangles) in three motor thalamic neurons (recorded with low Cl- internal solution) held near the resting membrane potential (Vm, –60), at –40 mV, at –40 mV with application of the GABAA antagonist gabazine (20 μM), and at –60 mV with application of the ionotropic glutamate receptor (iGluR) antagonists, DNQX (50 μM) and AP5 (100 μM). Note that some cells only exhibit inhibitory postsynaptic currents (IPSCs), some only excitatory postsynaptic currents (EPSCs), and some demonstrate a mixed EPSC/IPSC response, of which the excitatory or inhibitory components are abolished by iGluR or GABAA blockade, respectively. For quantification of the synaptic properties of excitatory inputs, see Figure 6D. (D) Summary data depicting how many recorded cells receive only SNr input, only M1L5 input, both, or neither. (E) Spatial pattern of motor thalamus neurons receiving each input type color coded to the inputs they receive. (F) Schematic of experiment. (G) Representative images from recording apparatus of the acute coronal slice (left) showing SNr terminals in motor thalamus (yellow), Cb terminals in motor thalamus (red), and merged image. Arrows in bottom left of image represent dorsal (D) and lateral (L) directions. Scale = 0.5 mm. (H) Representative traces in voltage clamp of laser-evoked responses (blue rectangles) in three motor thalamic neurons (recorded with low Cl- internal solution) held near the resting membrane potential (Vm, –60), at –40 mV, at –40 mV with application of the GABAA antagonist gabazine (20 μM), and at –60 mV with application of the iGluR antagonists, DNQX (50 μM) and AP5 (100 μM). Note that some cells only exhibit IPSCs, some only EPSCs, and some demonstrate a mixed EPSC/IPSC response, of which the excitatory or inhibitory components are abolished by iGluR or GABAA blockade, respectively. (I) Summary data depicting how many recorded cells receive only SNr input, only Cb input, both, or neither. (J) Spatial pattern of motor thalamus relays color coded to the inputs they receive.
Figure 6
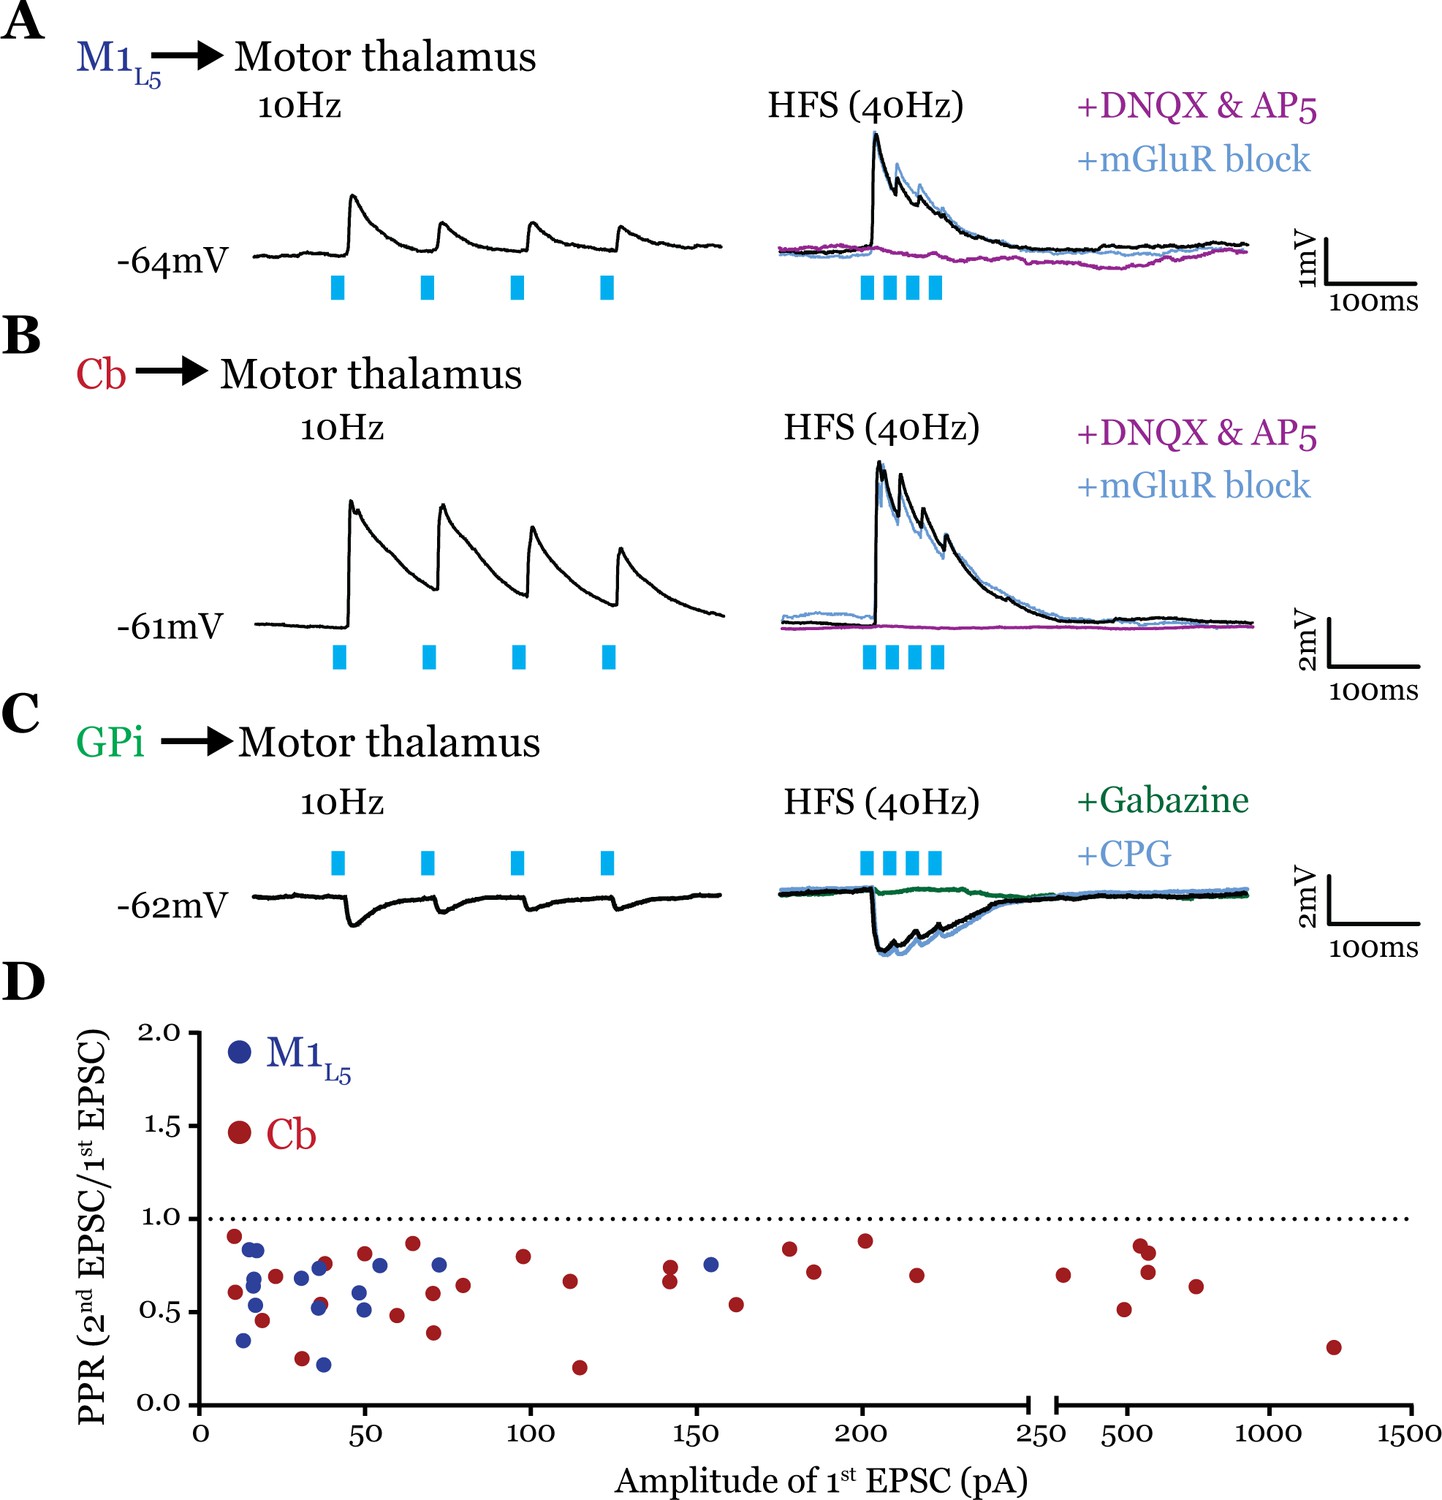
All inputs examined are drivers.
(A) Representative current clamp recordings of motor thalamic neuron demonstrating distal activation of layer 5 of primary motor cortex (M1L5) axons (>300 μm from recorded cell) gives a depressing response at low (10 Hz, left) and high frequencies (40 Hz, right) that is insensitive to metabotropic glutamate receptor (mGluR) antagonists (40 μM LY367385 and 30 μM MPEP) but abolished by DNQX. (B) Representative current clamp recordings of motor thalamic neuron demonstrating distal activation of cerebellar nuclei (Cb) axons (>300 μm from recorded cell) gives a depressing response at low (10 Hz, left) and high frequencies (40 Hz, right) that is insensitive to mGluR antagonists (40 μM LY367385 and 30 μM MPEP) but abolished by DNQX. (C) Representative current clamp recordings of motor thalamic neuron demonstrating distal activation of internal segment of the globus pallidus (GPi) axons (>300 μm from recorded cell) gives a depressing response at low (10 Hz, left) and high frequencies (40 Hz, right) that is insensitive to GABAB antagonists (CGP 46381, 25 μM) but abolished by gabazine (20 μM). (D) Compiled paired-pulse ratio (PPR) (second EPSC/first EPSC) data for all cells recorded receiving only the input of interest (not mixed inputs) plotted according to the amplitude of the first EPSC. PPRs below 1.0 (dotted line) are considered depressing, while those above 1.0 are considered facilitating. For Cb, n=30 cells; for M1L5, n=15 cells. EPSC, excitatory postsynaptic current.
-
Figure 6—source data 1
EPSC amplitude and PPR values for all cells receiving an excitatory input as shown in Figure 6D.
- https://cdn.elifesciences.org/articles/97489/elife-97489-fig6-data1-v2.xlsx
Figure 7
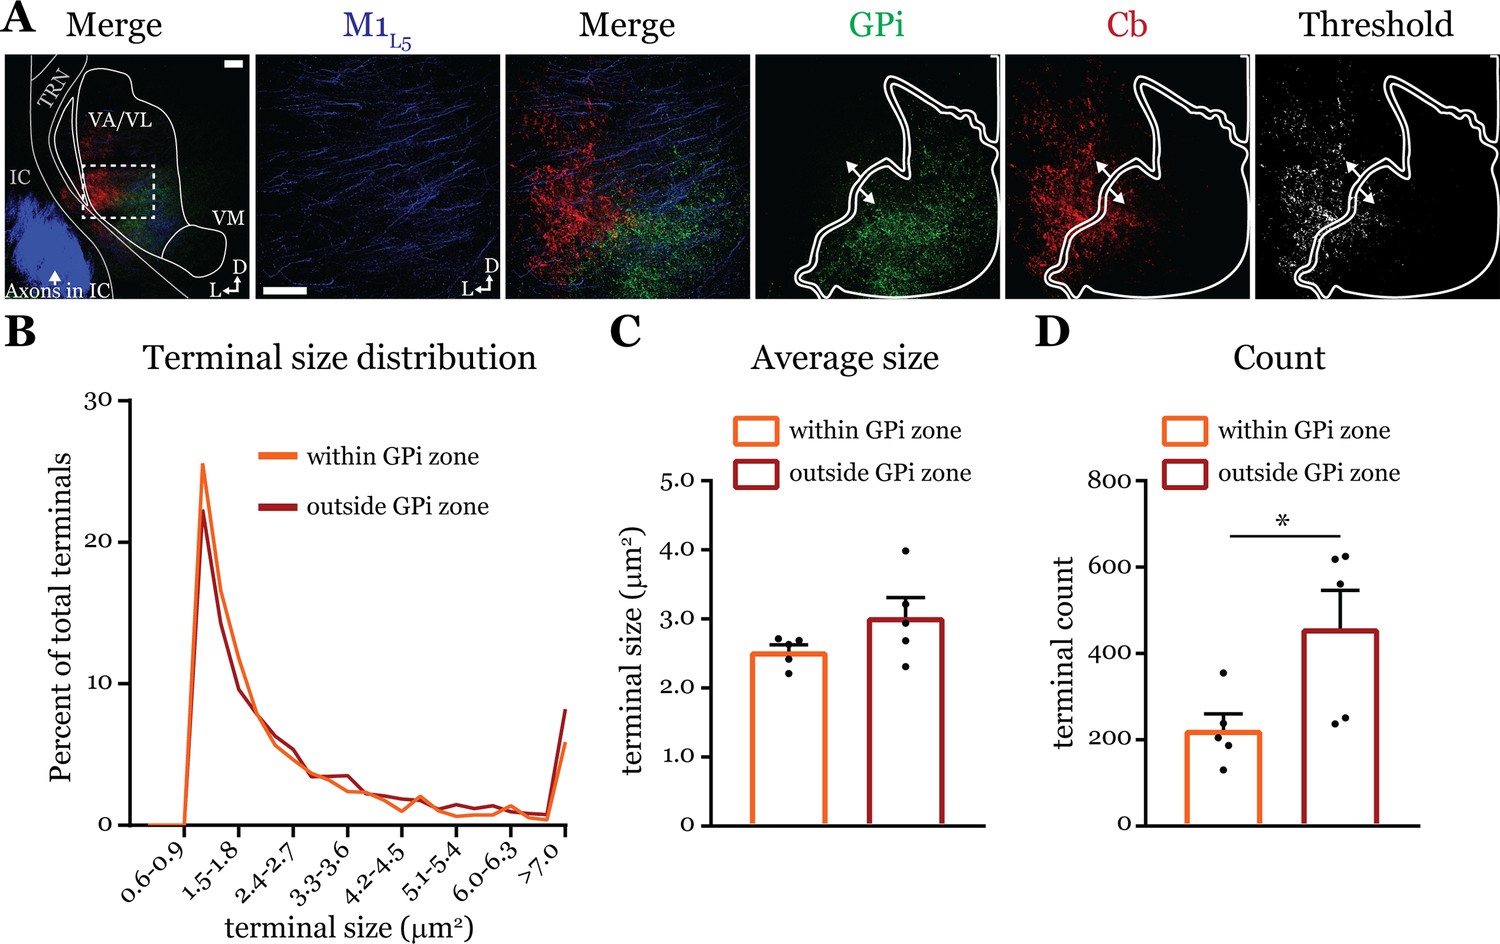
Cerebellar nuclei (Cb) terminal sizes within and outside the internal segment of the globus pallidus (GPi) overlap zone are equal.
(A) Representative maximum intensity projections of terminal overlap fields in low magnification (left) and terminals from motor thalamic inputs with GPi and Cb terminal zones distinguished. Thresholded image demonstrates binary masking of terminals for high-throughput estimation of terminal size. Scale = 100 μm. (B) Population distribution of Cb terminal size averaged across five animals (two sections per animal, averaged). (C) Average Cb terminal sizes within and outside the GPi overlap area. Ns = not significantly different; n=5 mice. Data are represented as mean ± SEM. (D) Number of terminals identified (count of terminal number) in size-matched analysis regions either within or outside the GPi overlap zone. *p=0.0317 by Mann-Whitney U-test; n=5 mice. Data are represented as mean ± SEM.
-
Figure 7—source data 1
Terminal size and count values for each individual animal, as displayed in Figure 7C and D.
- https://cdn.elifesciences.org/articles/97489/elife-97489-fig7-data1-v2.xlsx
Figure 8
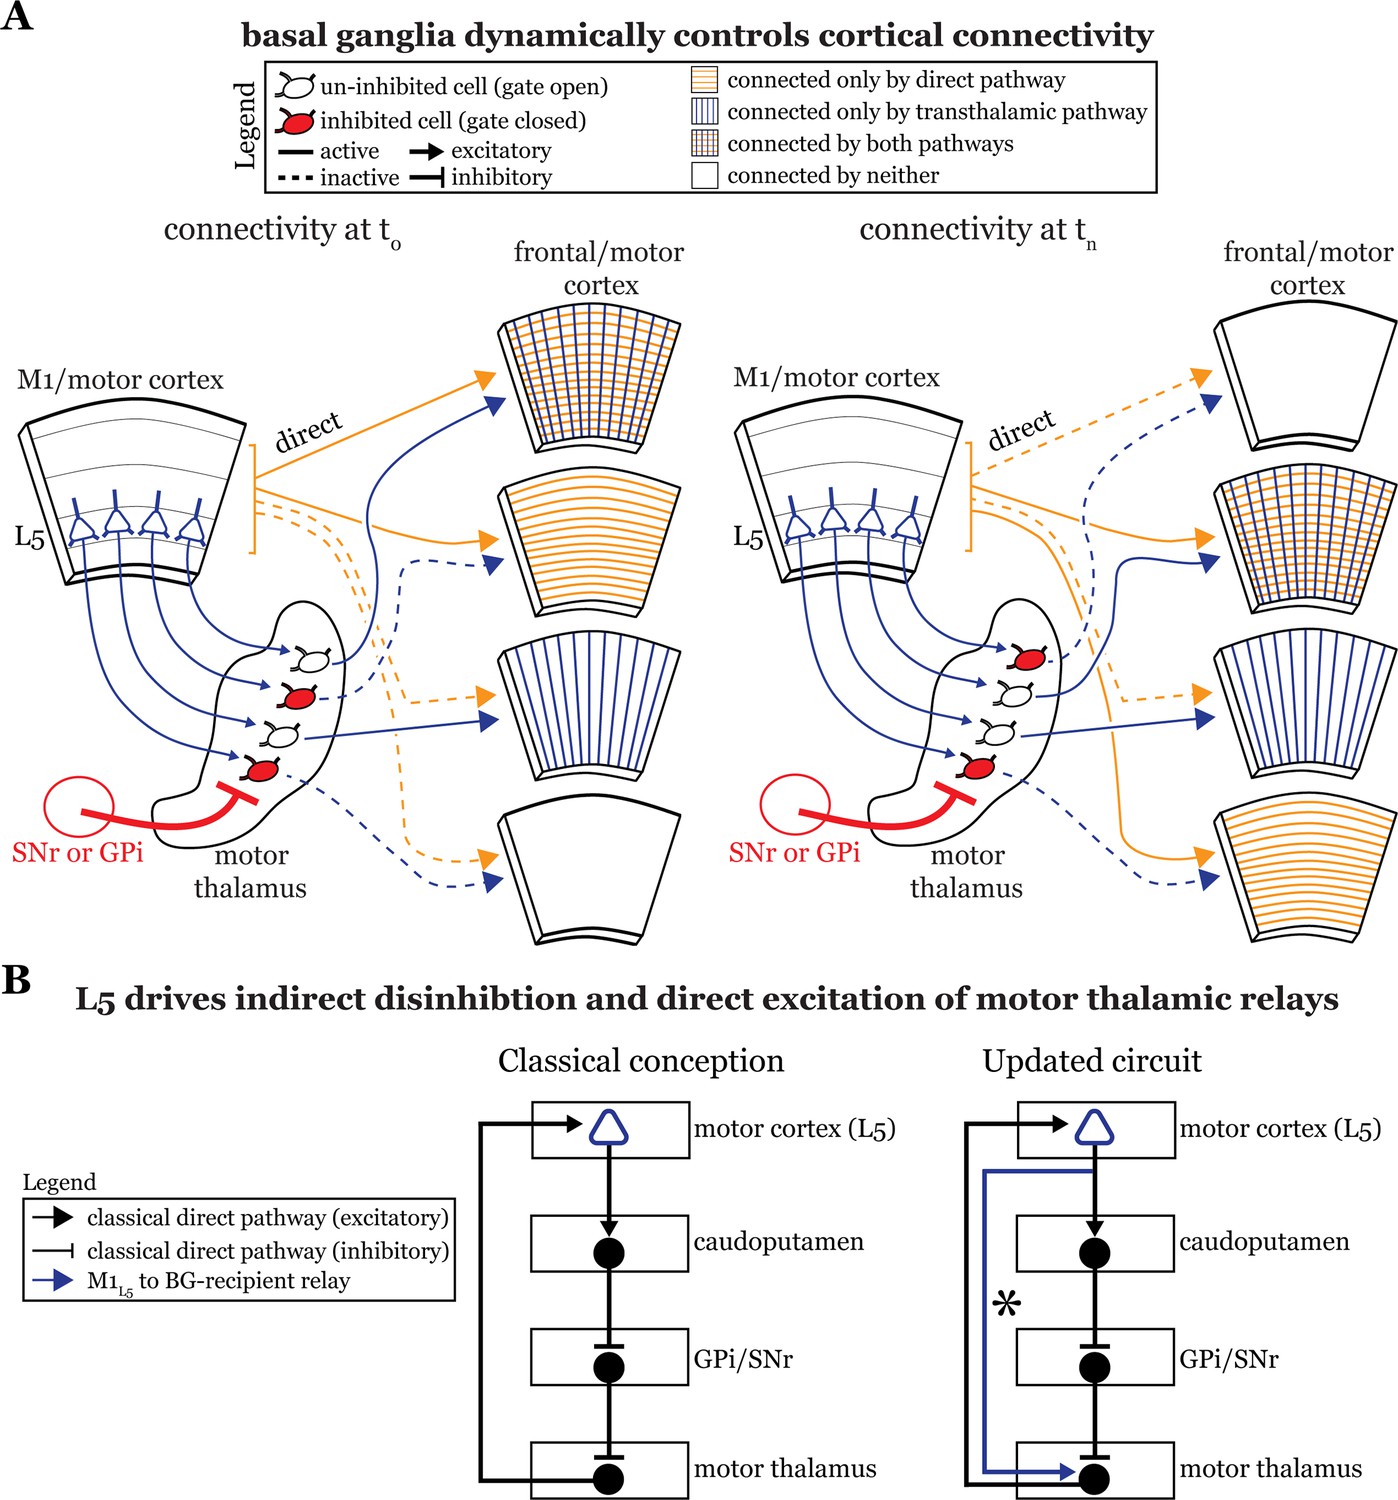
The basal ganglia gate information flow between cortical regions.
(A) Schematic of the circuit organization of motor thalamus with respect to cortex and basal ganglia, showing the direct (orange) and transthalamic (blue) pathways through motor thalamus. When basal ganglia projections (red) to motor thalamic relays are active, they potently inhibit (red filled motor thalamic cells) and thereby gate transthalamic information flow between cortical regions. In contrast, when basal ganglia inputs to motor thalamus are themselves inhibited (open fill motor thalamic cells), they allow transthalamic information flow between cortical regions, where it may encounter signals from the direct cortico-cortical pathways. Via this gating function, the basal ganglia can regulate which cortical areas are connected by only direct corticocortical pathways, only transthalamic pathways, both, or neither. Importantly, this regulation is dynamic, such that the pattern of connected areas can change over short time scales (see left, time T0, versus right, time Tn). (B) Box diagram of the basal ganglia circuitry according to the traditional textbook view (left) and with the novel direct connection between motor cortex layer 5 (L5) and motor thalamus shown (right; asterisk). That is, our data demonstrate that L5 of primary motor cortex (M1L5) drivers innervate cells receiving internal segment of the globus pallidus (GPi) and substantia nigra pars reticulata (SNr) inputs. Given this organization, M1L5 neurons could simultaneously disinhibit (via the basal ganglia loop, black arrows) and drive (via the direct corticothalamic projection, blue arrow) motor thalamic relays.
Additional files
Download links
A two-part list of links to download the article, or parts of the article, in various formats.
Downloads (link to download the article as PDF)
Open citations (links to open the citations from this article in various online reference manager services)
Cite this article (links to download the citations from this article in formats compatible with various reference manager tools)
Convergence of inputs from the basal ganglia with layer 5 of motor cortex and cerebellum in mouse motor thalamus
eLife 13:e97489.
https://doi.org/10.7554/eLife.97489


