Maternal obesity may disrupt offspring metabolism by inducing oocyte genome hyper-methylation via increased DNMTs
- College of Life Sciences, Institute of Reproductive Sciences, Key Laboratory of Animal Reproduction and Germplasm Enhancement in Universities of Shandong, Qingdao Agricultural University, China
- College of Horticulture, Qingdao Agricultural University, China
- Guangzhou Key Laboratory of Metabolic Diseases and Reproductive Health, Guangdong-Hong Kong Metabolism & Reproduction Joint Laboratory, Reproductive Medicine Center, Guangdong Second Provincial General Hospital, China
Figures
Figure 1 with 3 supplements
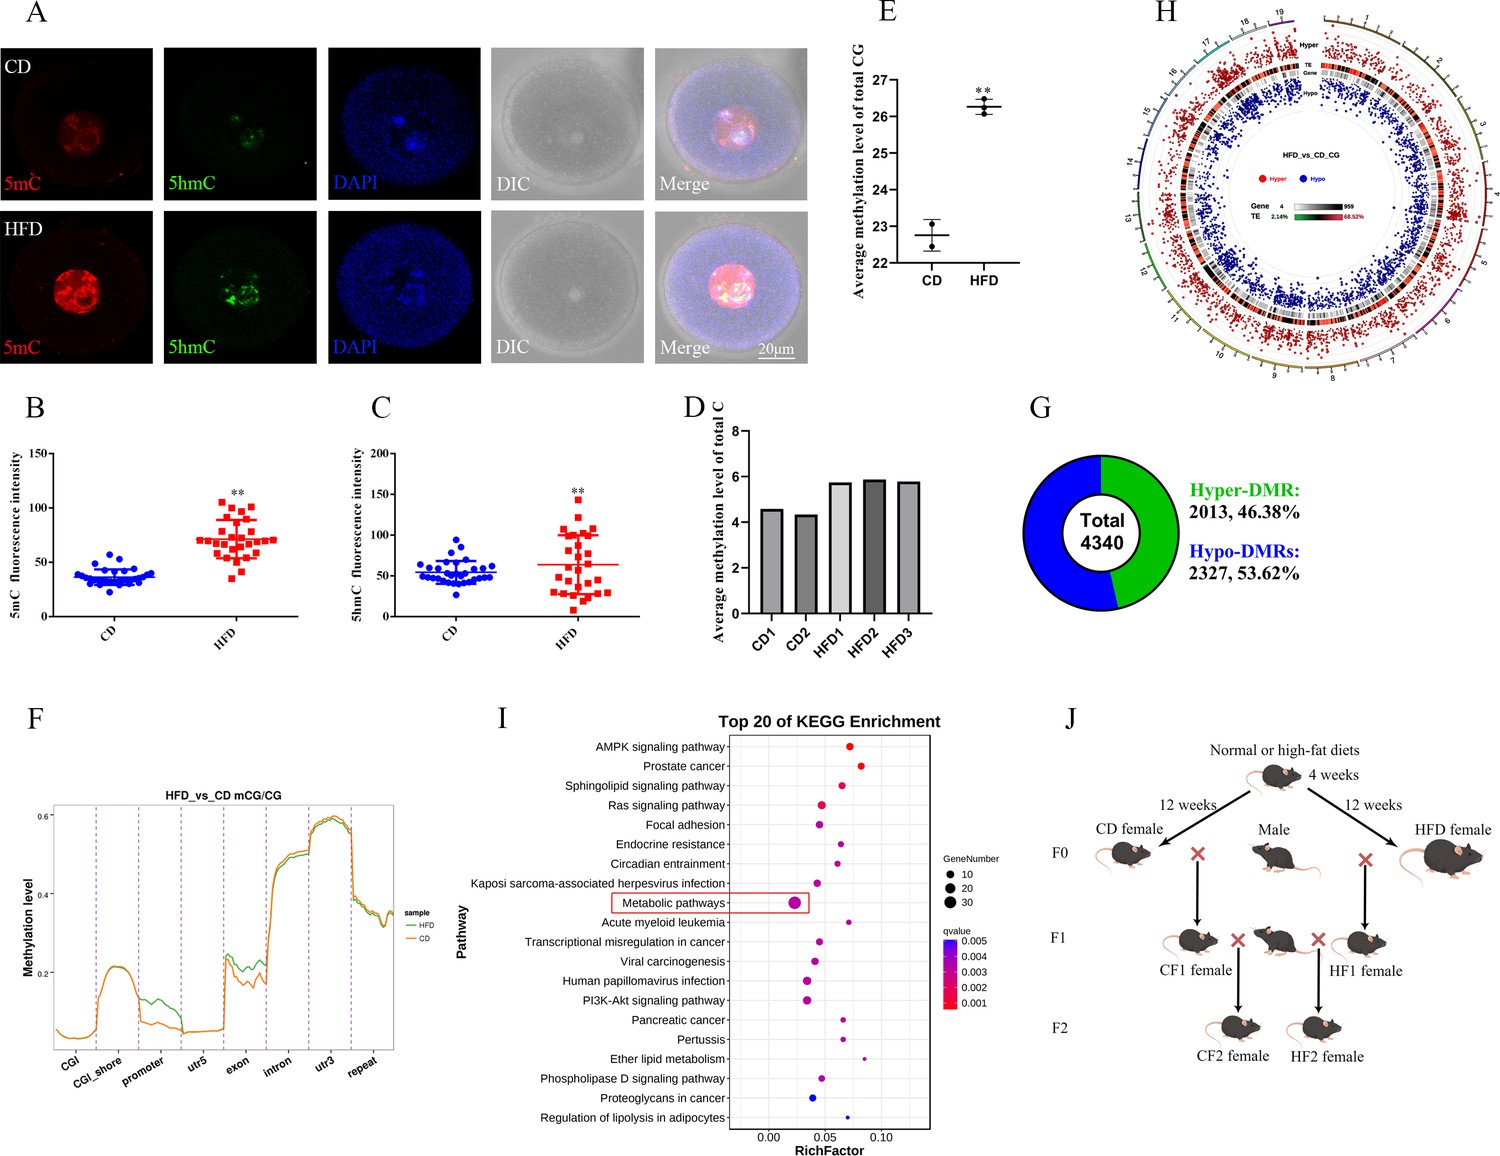
Maternal obesity alters the DNA methylation of oocytes.
(A) Methylation levels of 5mC and 5hmC in oocytes (n>30). 5mC, 5-methylcytosine; 5hmC, 5-hydroxymethylcytosine; DAPI, chromatin. (B, C) Relative fluorescence intensity of 5mC and 5hmC in germinal vesicle (GV) oocytes. Data presented as mean ± SEM; two-tail t-test used, **p<0.01. (D) Genomic methylation level of MII oocytes examined by single-cell whole genome bisulfite sequencing. The control group (CD) has two replicates, and the obesity group (HFD) has three replicates. (E) Average genomic CG methylation level in MII oocytes. CD, control group; HFD, obesity group; data presented as mean ± SD, **p<0.01. (F) CG methylation levels at different regions in MII oocytes. CGI, CpG island; utr5, 5’ untranslated region; utr3, 3’ untranslated region; repeat, repeat sequence. (G) Total differentially methylated regions (DMRs) in oocytes of control and obesity groups. Hyper-DMRs, hypermethylated DMRs; hypo-DMRs, hypomethylated DMRs. (H) Distribution of DMRs on chromosomes in MII oocytes. Outside-to-in: chromosomes, hyper-DMRs, TEs (transcription end regions), and gene, hypo-DMRs. (I) Kyoto Encyclopedia of Genes and Genomes (KEGG) pathway enrichment of genes with DMRs at the promoter regions, and the top 20 pathways are presented. (J) Schedule of breeding. Female C57BL/6 mice fed with normal (CD) or high-fat diet (HFD) for 12 weeks were marked as F0. F1 was produced by F0 mated with normal males, respectively, and marked as CF1 and HF1; F2 was produced by female F1 mated with normal males and marked as CF2 and HF2, respectively.
Figure 1—figure supplement 1
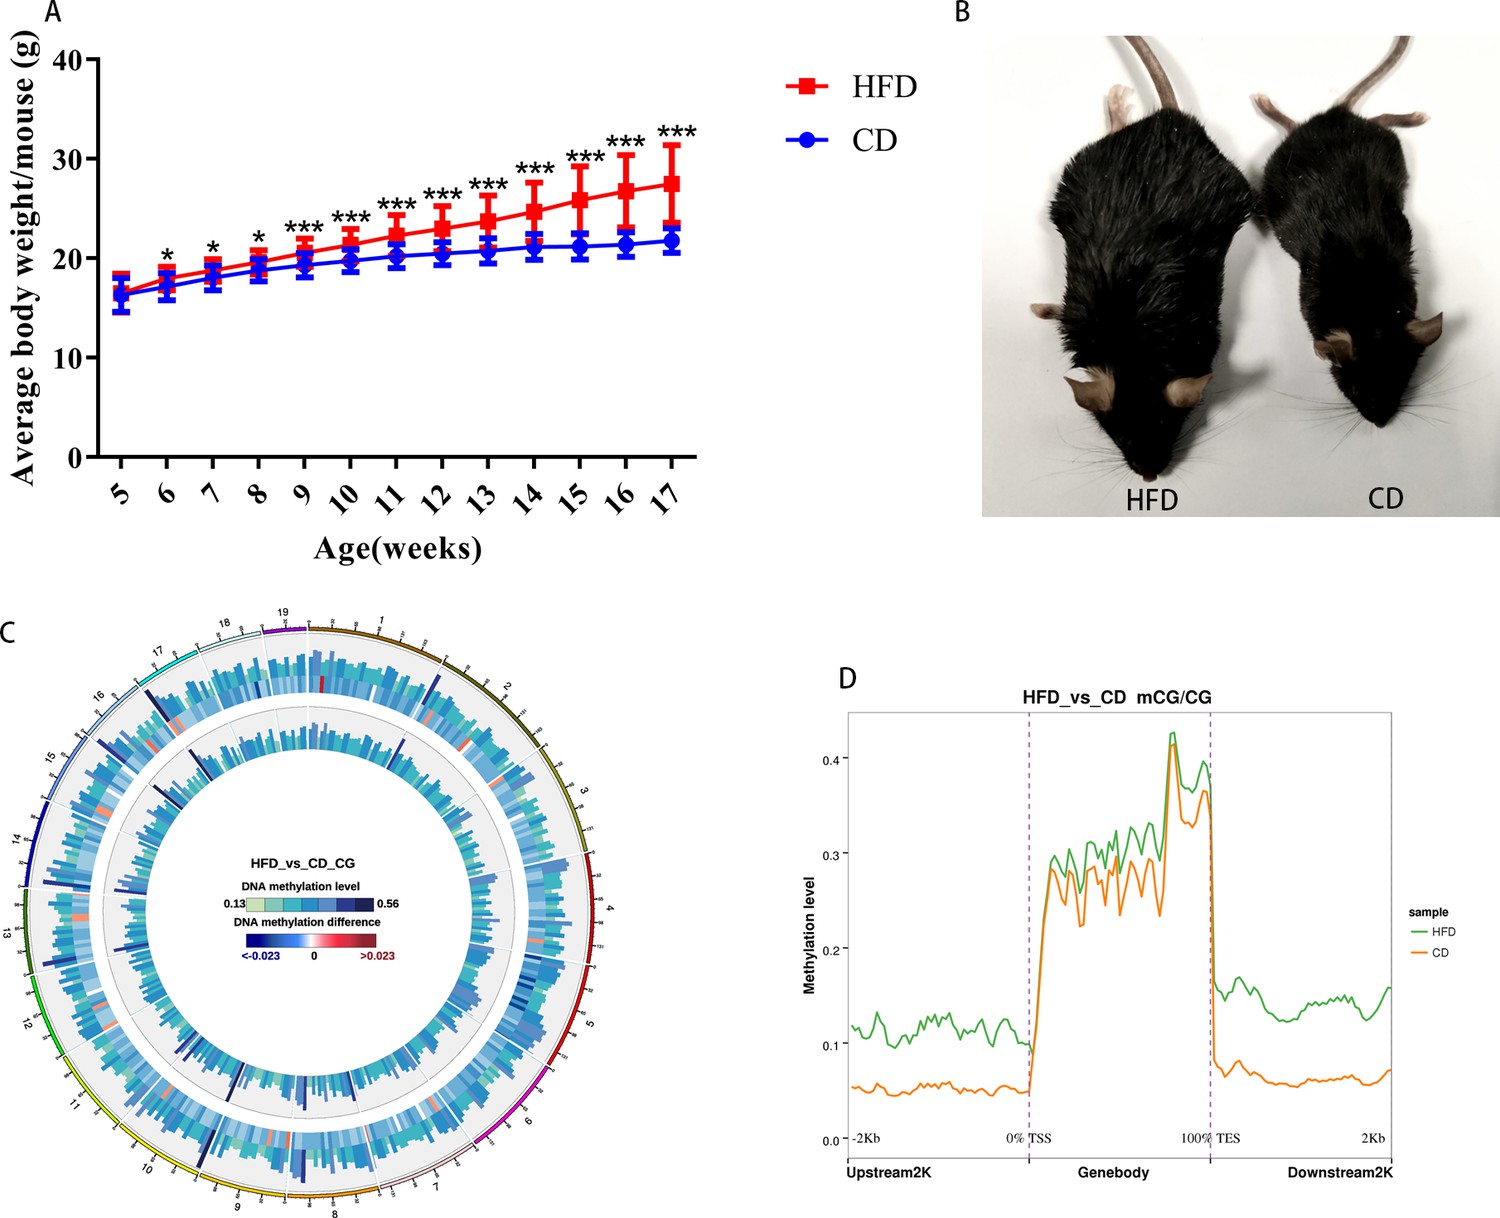
Obese mouse model and DNA methylation in oocytes.
(A) Body weights of mice were examined every week (n: CD=107, HFD=167). Data presented as mean ± SEM; two-tail t test usedk. (B) Mice fed with a high-fat diet were obese compared with the control. (C) Methylation level of CG distributed on chromosomes. From outside to inside circles: high-fat diet (HFD) methylation level, methylation difference between groups, control methylation level; color grading diagram, DNA methylation level; heat map, methylation difference level. (D) Methylation distribution at different regions of genes.
Figure 1—figure supplement 2
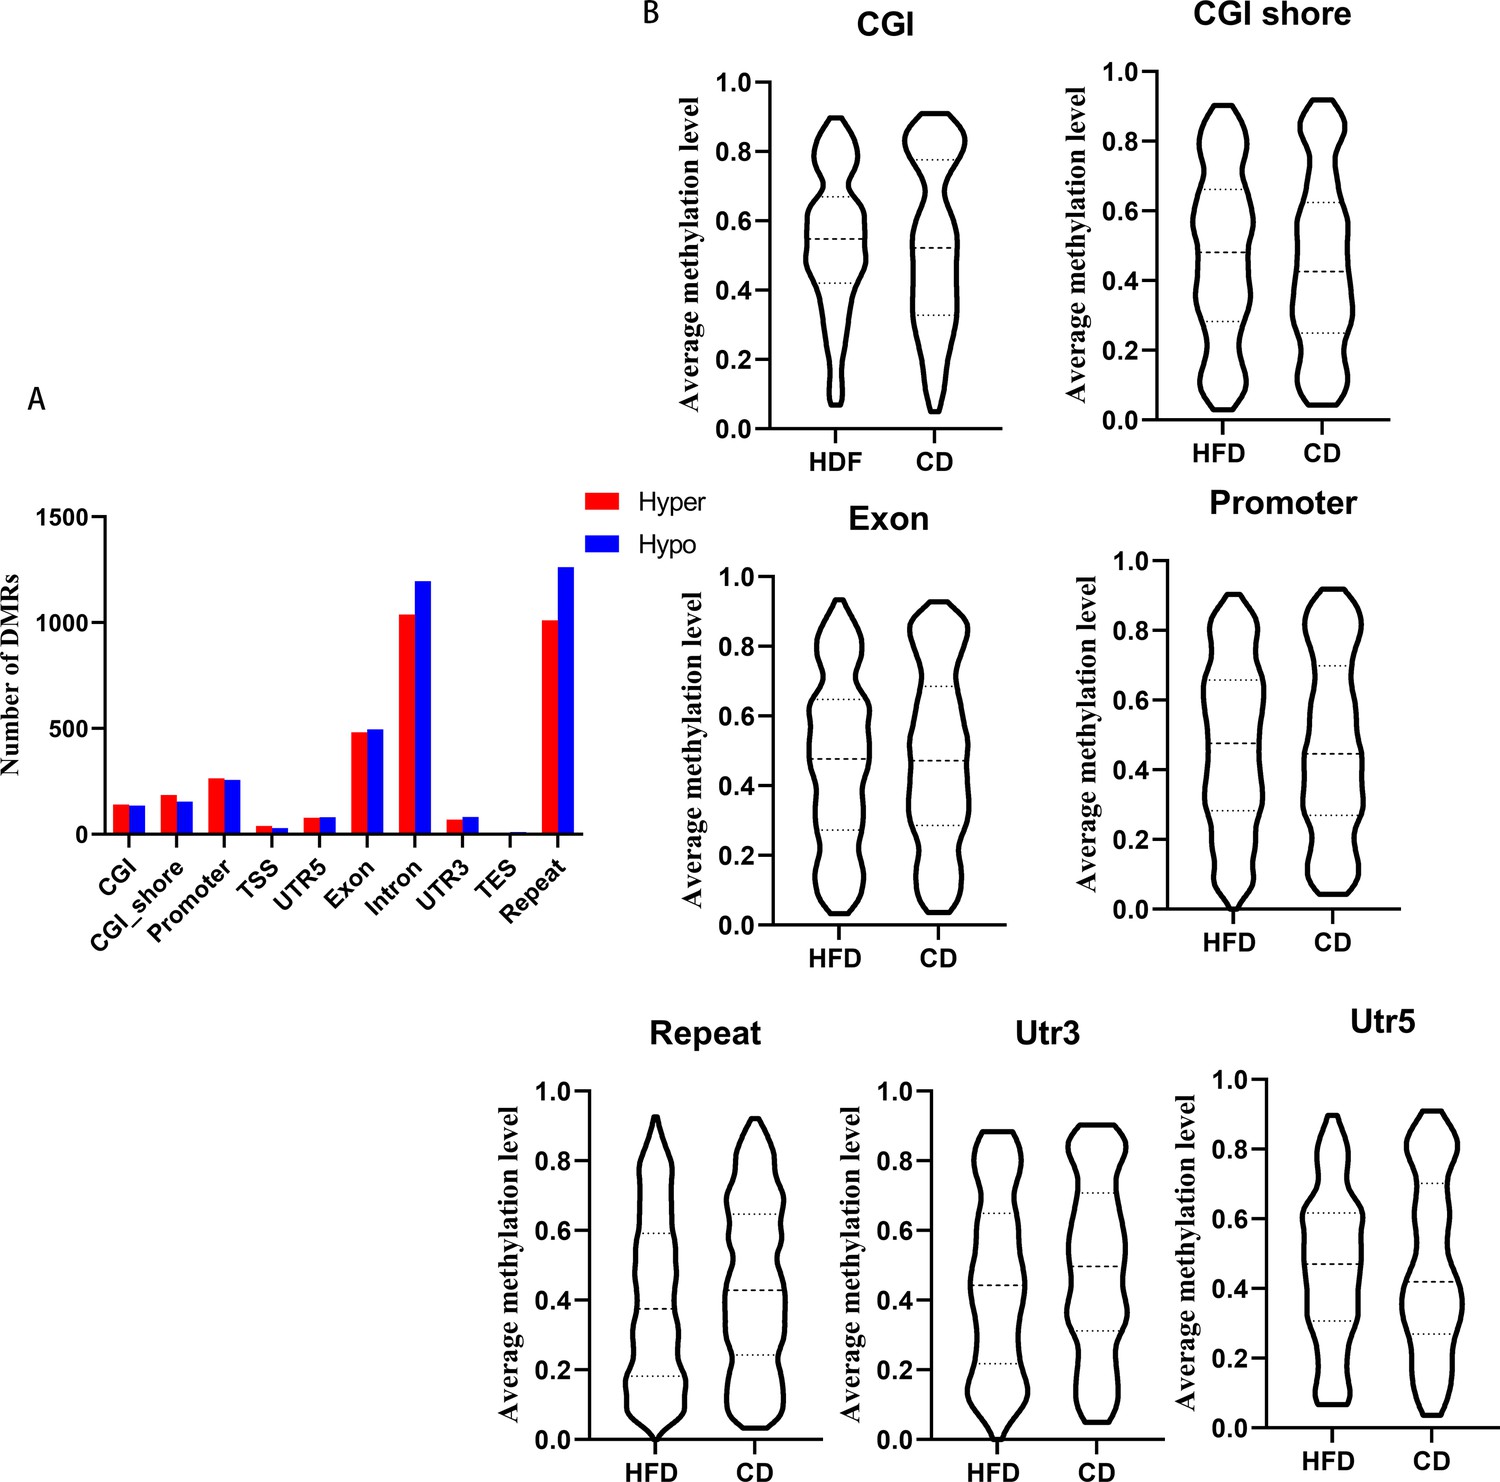
dDifferentially methylated regions (DMRs) methylation at different regions.
(A) DMRs numbers distribution at different elements. (B) Average methylation levels of DMRs at elements.
Figure 1—figure supplement 3
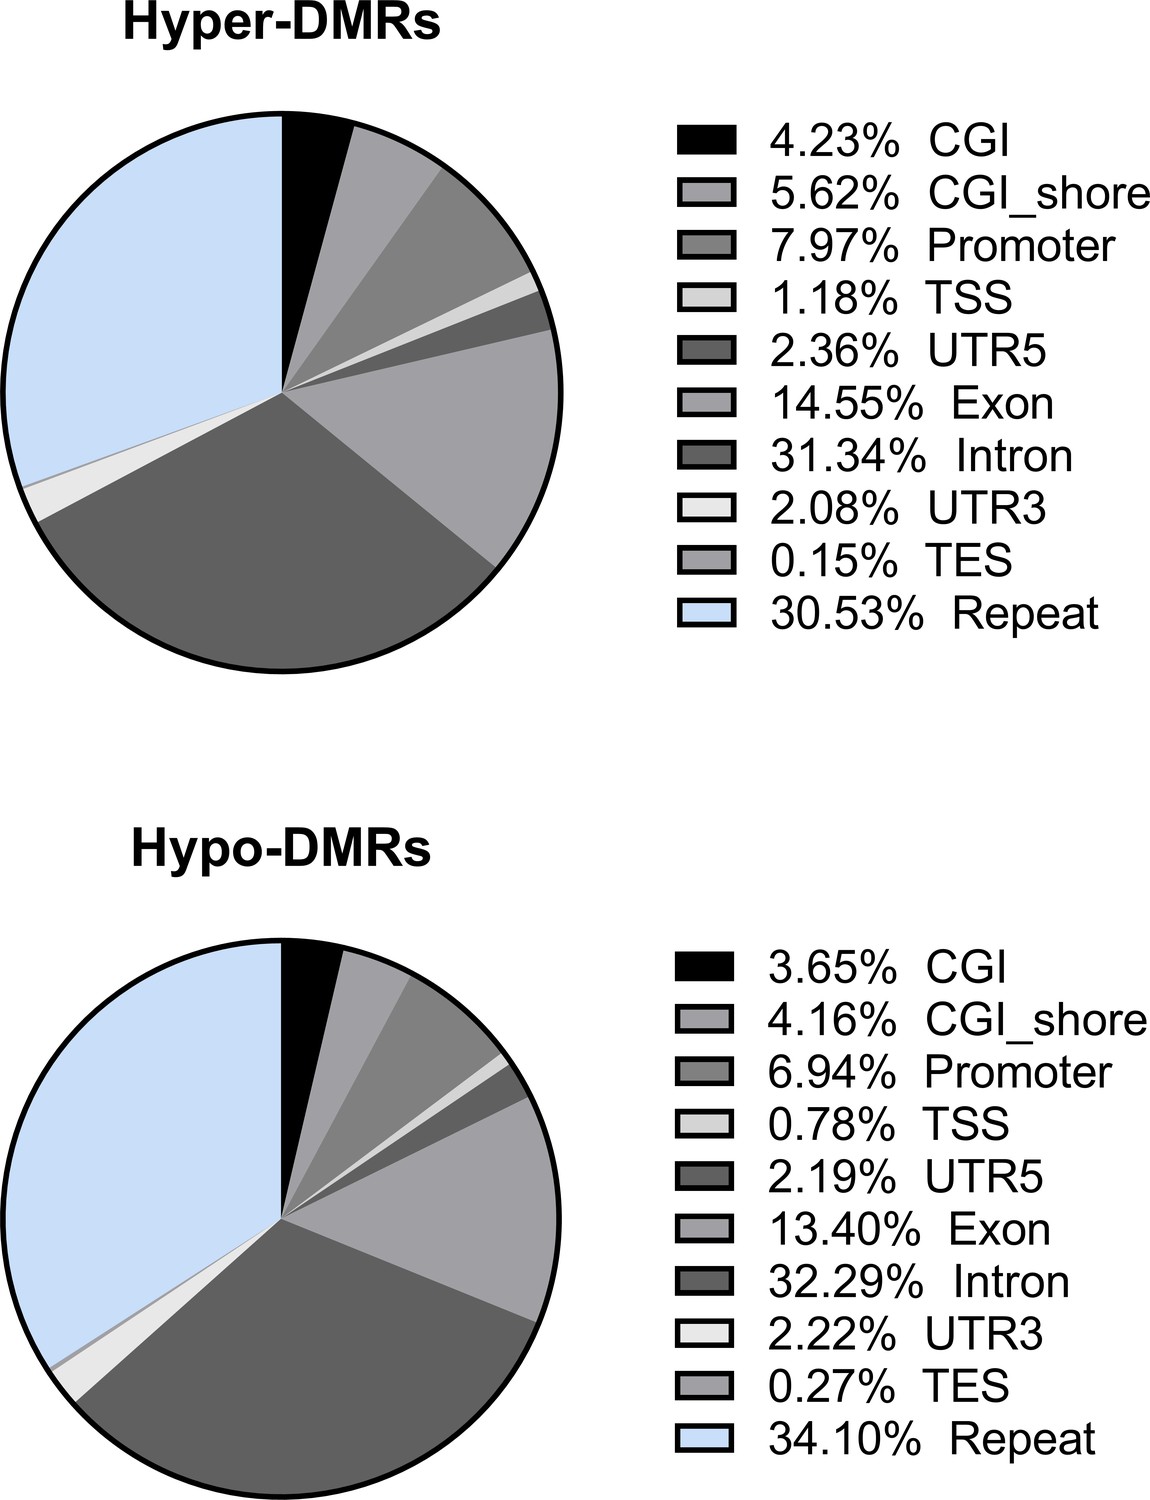
Distribution of the hypo- and hyper-differentially methylated regions (DMRs) in genomic elements.
Figure 2 with 4 supplements
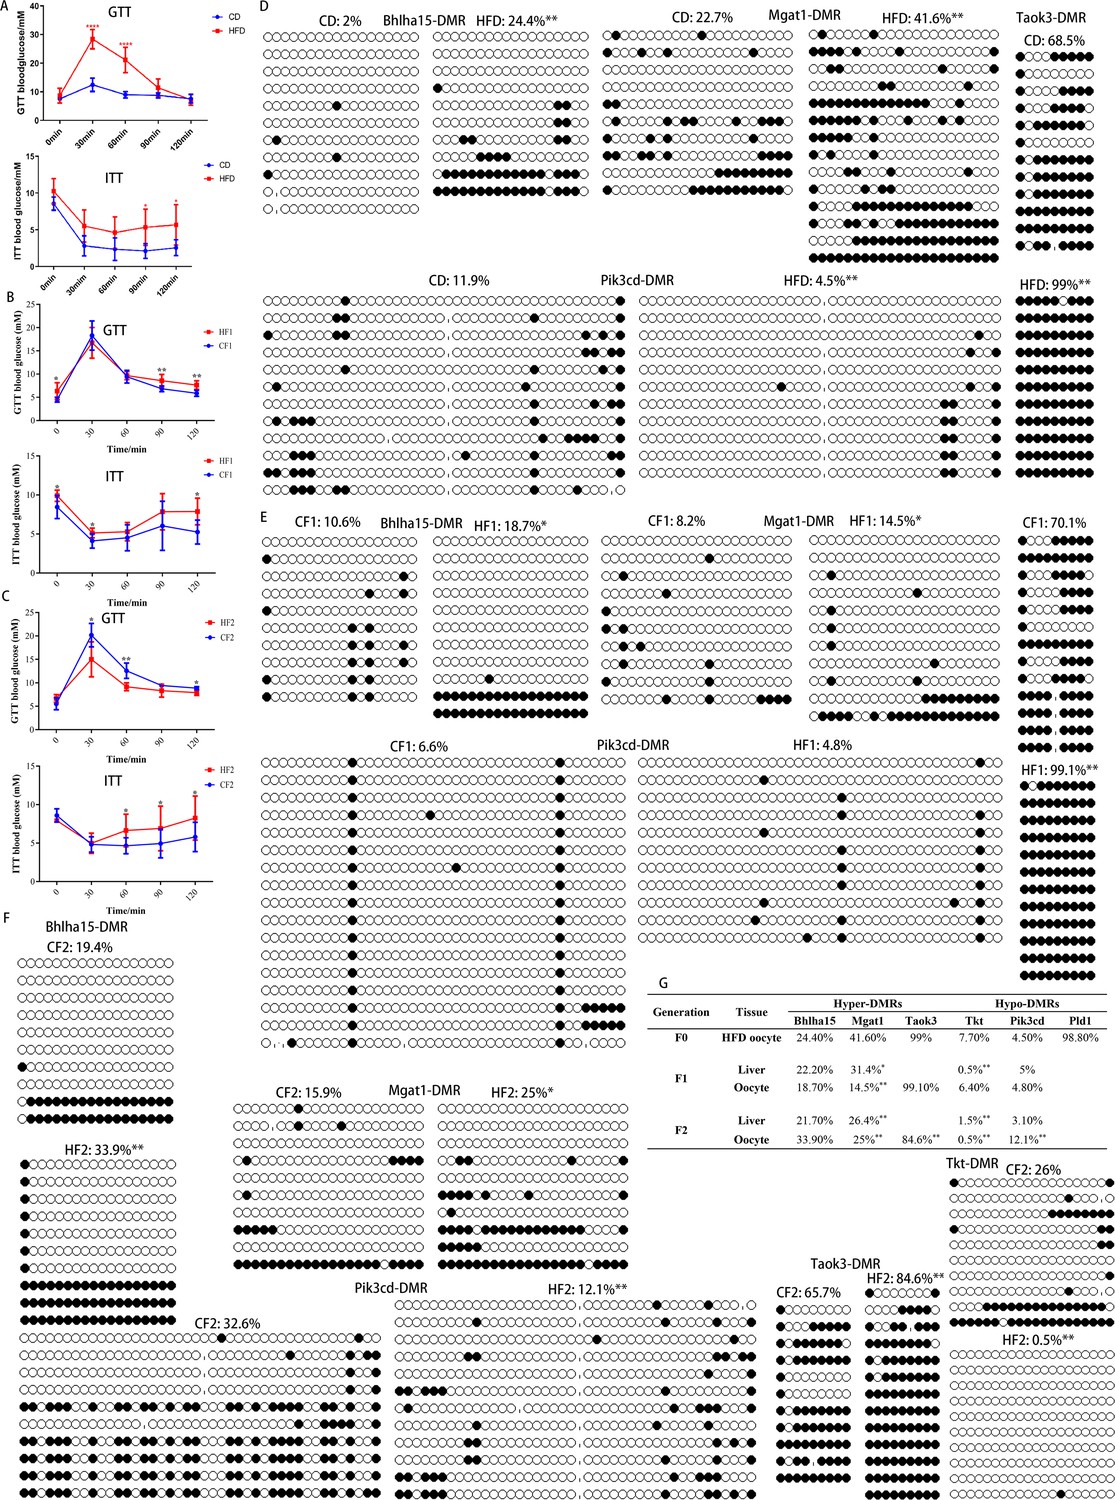
Transgenerational inheritance of metabolic disorders and altered DNA methylation.
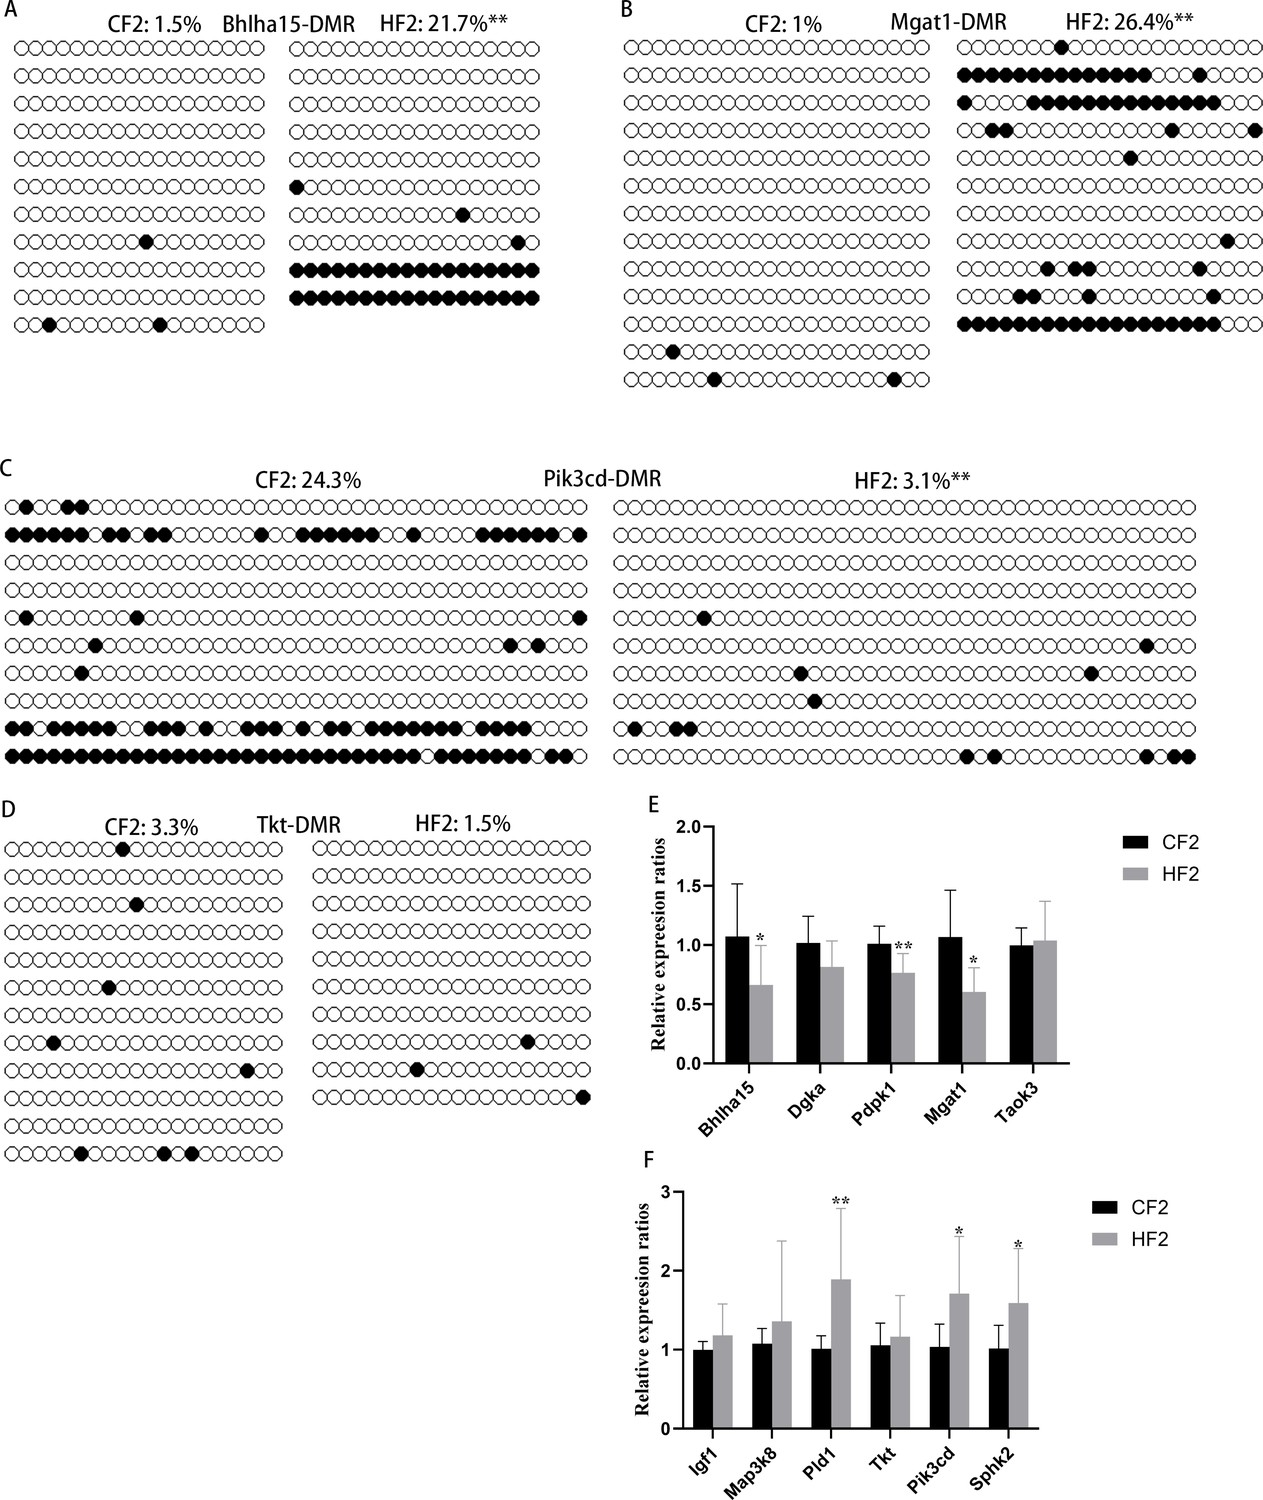
(A-C) Glucose tolerance (GTT) and insulin tolerance (ITT) were tested for female F0 (n: GTT, CD=6, HFD=11; ITT, CD=5, HFD=11), F1 (n: GTT, CF1=6, HF1=16; ITT, CH1=6, HF1=6), and F2 (n: GTT, CF2=5, HF2=5; ITT, CF2=7, HF2=5), respectively. * p<0.05; ** p<0.01. Data presented as mean ± SD; two-tail t test used. P value and n number are presented in the source data. (D-F) DMR methylation at the promoter regions of Bhlha15, Mgat1, Taok3, Tkt, and Pid3cd in F0, F1, and F2 oocytes was respectively examined using bisulfite sequencing. At least 10 available clones from 80-100 oocytes were used to calculate the methylation level. White circle, unmethylated CG; black circle, methylated CG. * p<0.05; ** p<0.01. Chi-square test used. (G) Inheritance of altered methylation in different generations was analyzed. * p<0.05; ** p<0.01. Chi-square test used.
-
Figure 2—source data 1
Extended data for Figure 2A, B, and C.
- https://cdn.elifesciences.org/articles/97507/elife-97507-fig2-data1-v1.xlsx
Figure 2—figure supplement 1
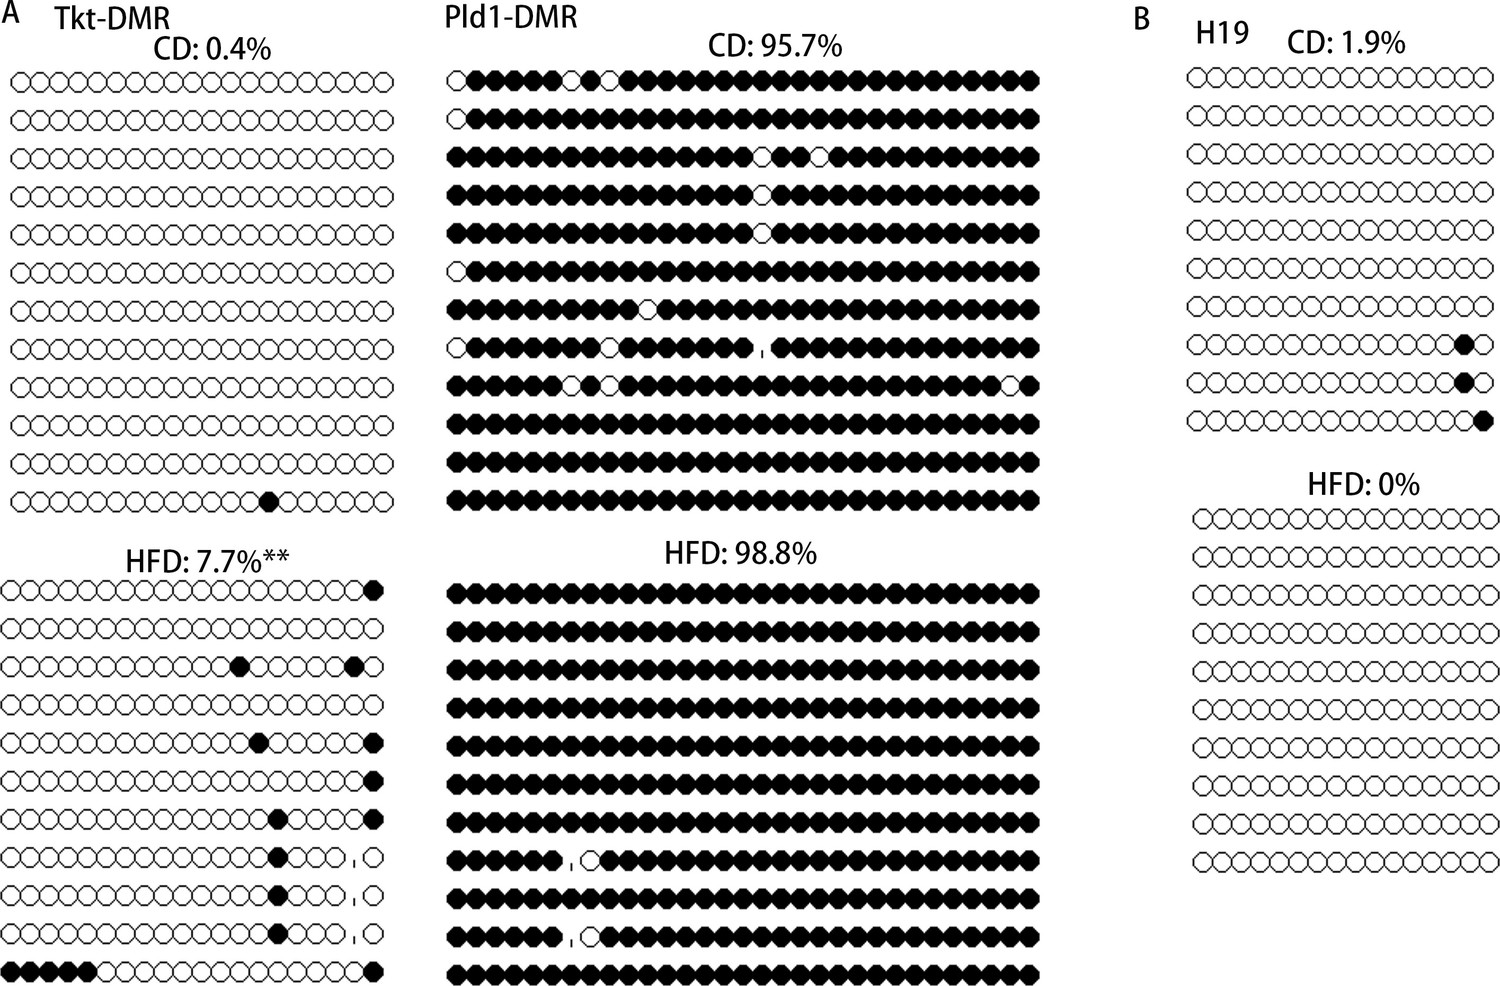
Methylation of H19 in oocytes.
Methylation level of H19 in oocytes was examined using bisulfite sequencing. At least 10 available clones were used to calculate the methylation level, and a total of 80–100 oocytes were analyzed for each group.
Figure 2—figure supplement 2
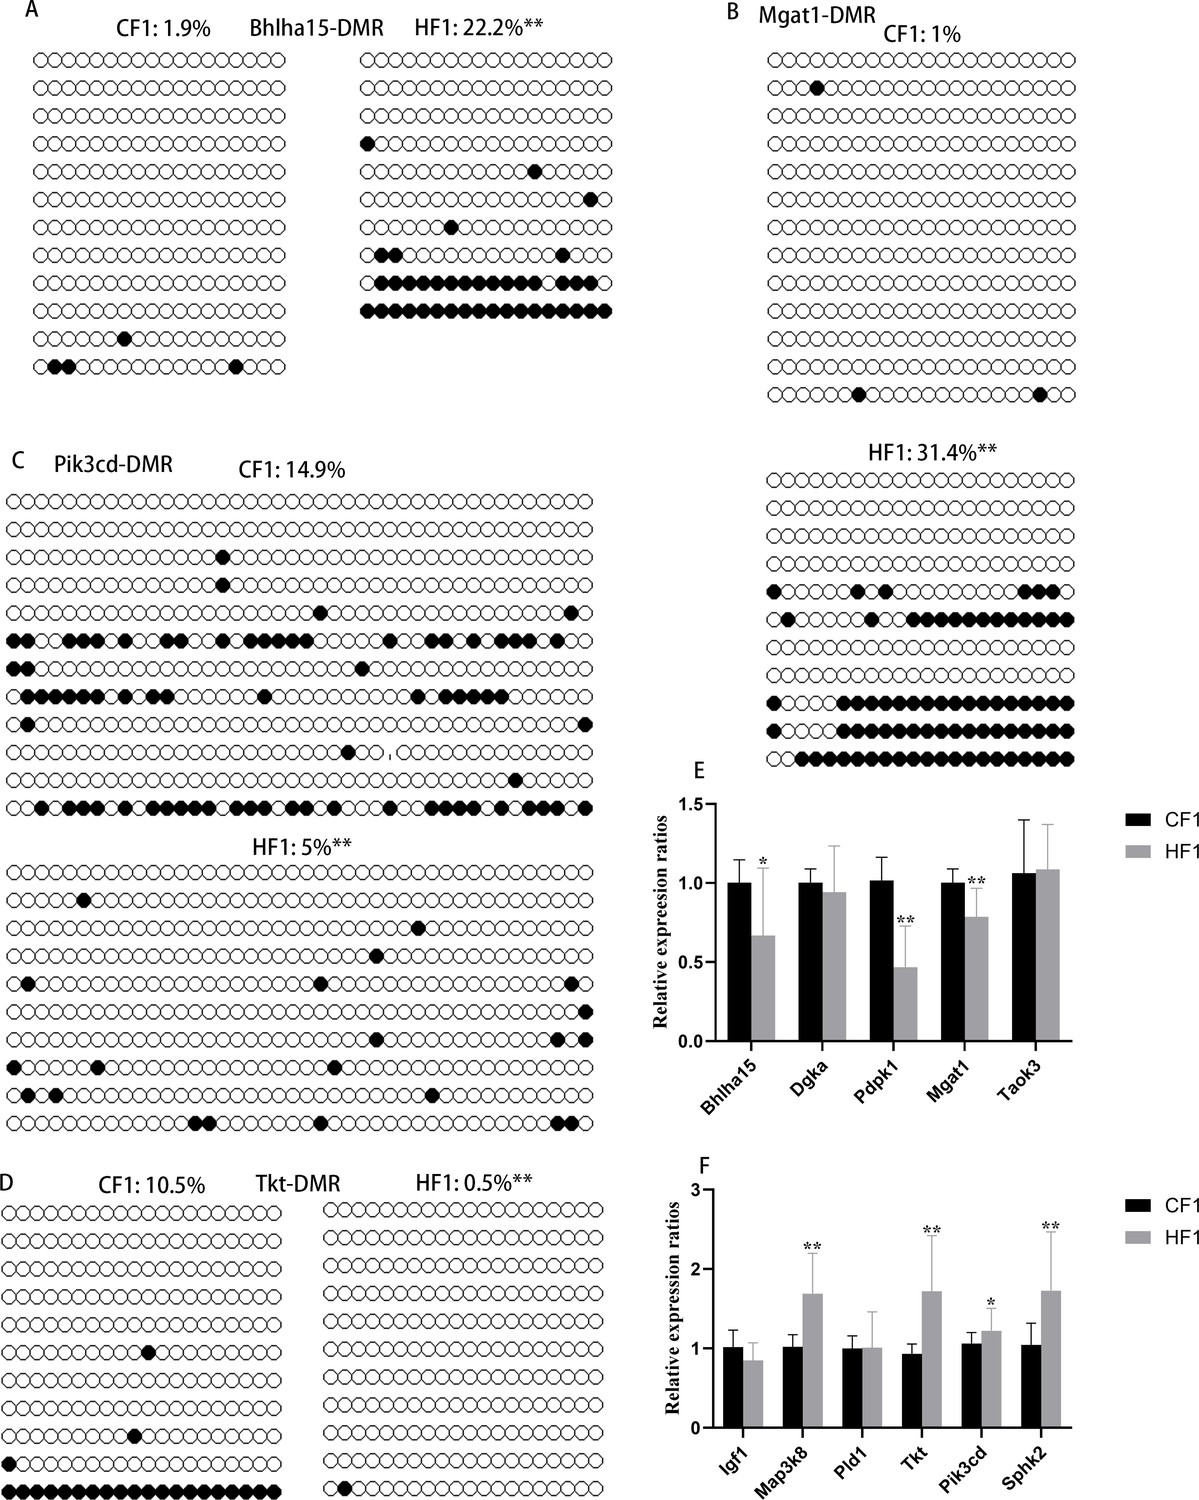
Methylation status of differentially methylated regions (DMRs) in F1 livers.
(A) DMR methylation status at the promoter region of Bhlha15. CF1, female control mated with normal males; HF1, female obese mice mated with normal males. White circle, unmethylated CG; black circle, methylated CG. (B) DMR methylation status at the promoter region of Mgat1. White circle, unmethylated CG; black circle, methylated CG. (C) DMR methylation status at the promoter region of Pik3cd. White circle, unmethylated CG; black circle, methylated CG. (D) DMR methylation status at the promoter region of Tkt. White circle, unmethylated CG; black circle, methylated CG. (E and F) Relative expression of genes with hyper- or hypo-DMRs at promoter regions. *p<0.05; **p<0.01. Data presented as mean ± SEM; a two-tail t-test was used.
Figure 2—figure supplement 3
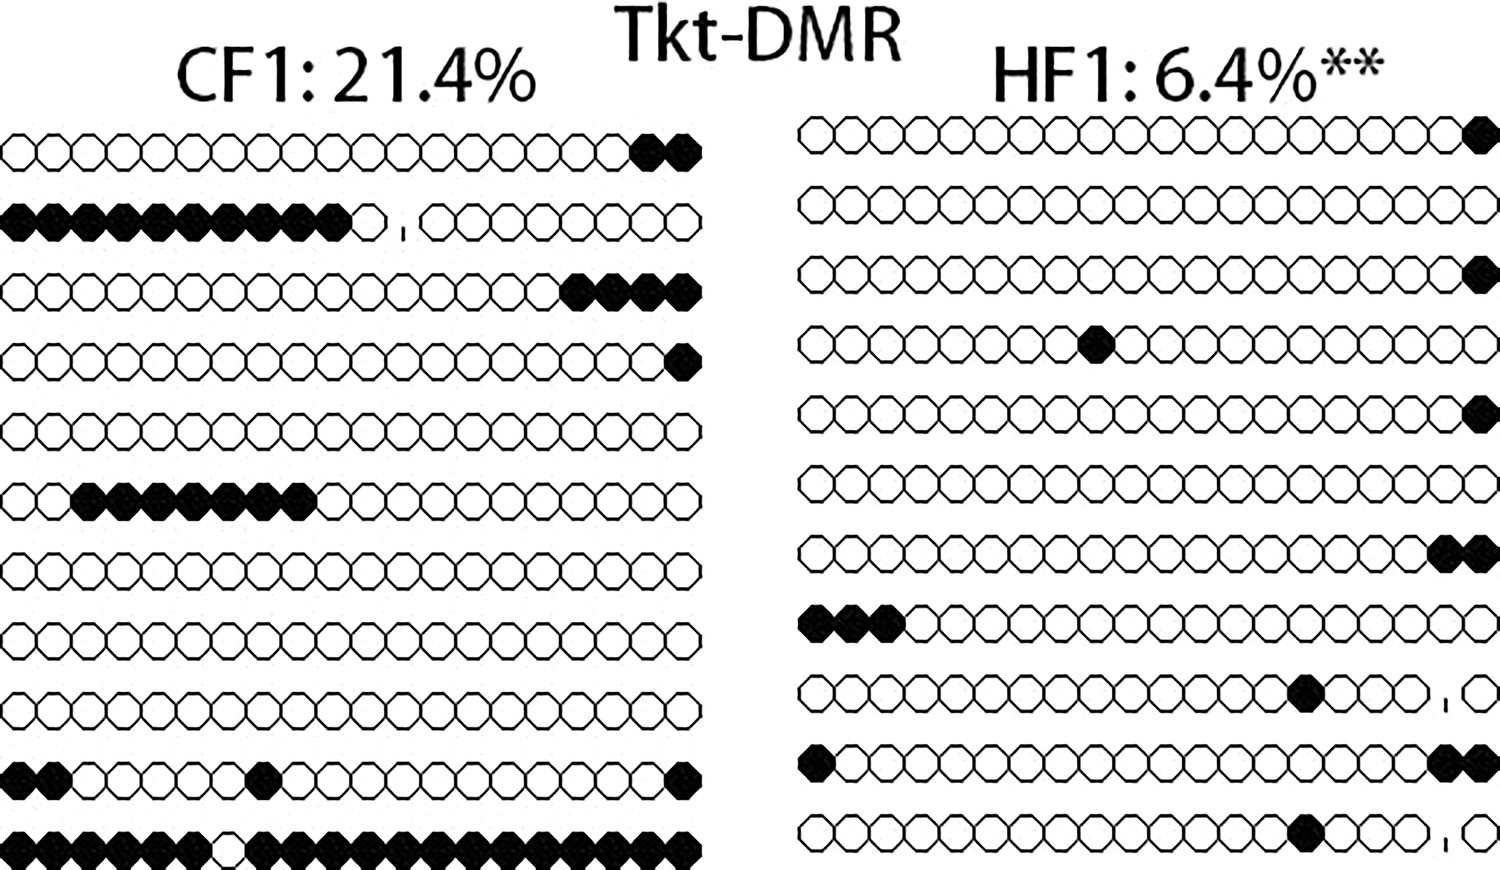
Methylation level of Tkt-differentially methylated region (DMR) in F1 oocytes.
Figure 2—figure supplement 4
Methylation of differentially methylated regions (DMRs) in F2 livers.
(A–D) Methylation levels of Bhlha15-DMR, Mgat1-DMR, Pik3cd-DMR, and Tkt-DMR were respectively examined using bisulfite sequencing, and at least 10 available clones were used for each DMR. White circle, unmethylated CG; black circle, methylated CG. **p<0.01. Data presented as mean ± SEM; a two-tail t-test was used. (E) Expression of genes with hyper-DMRs at promoter regions in F2 livers. *p<0.05; **p<0.01. Data presented as mean ± SEM; a two-tail t-test was used. (F) Expression of genes with hypo-DMRs at promoter regions in F2 livers. *p<0.05; **p<0.01. Data presented as mean ± SEM; a two-tail t-test was used.
Figure 3 with 1 supplement
Maternal obesity alters the metabolome of serum.
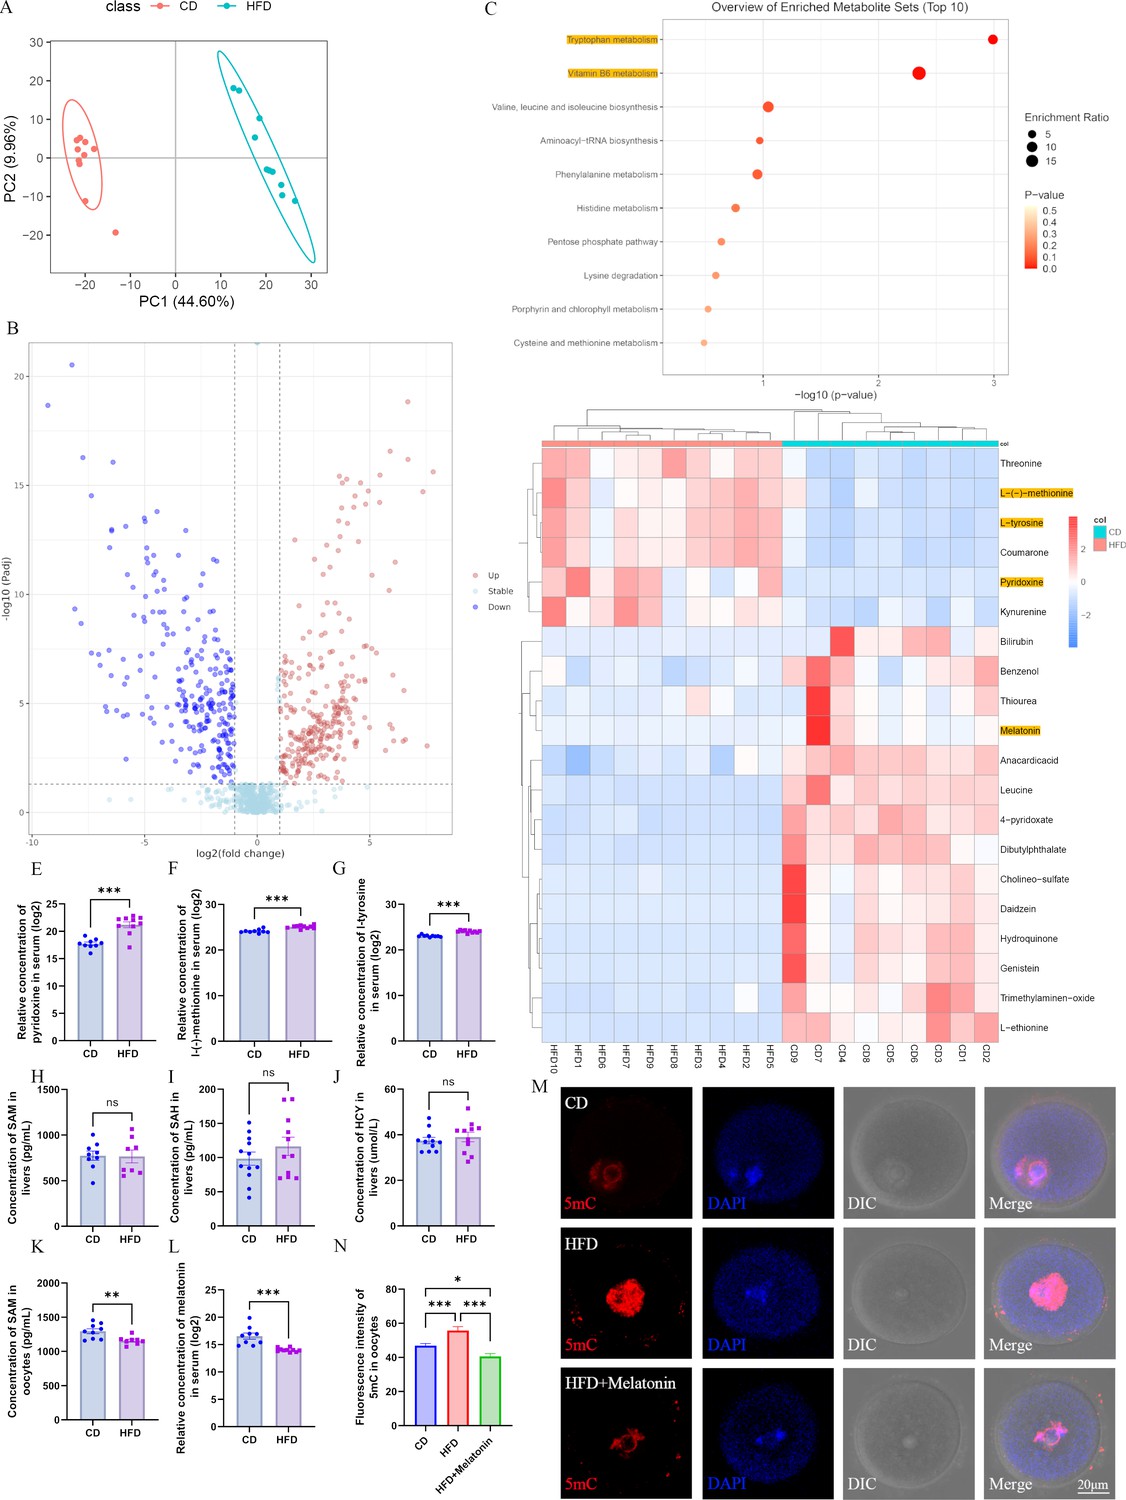
(A) Principal component analysis in control group (CD) and high-fat diet (HFD) mice. (B) Differential metabolites in the HFD serum compared with those in the CD group. Red circles, upregulated metabolites; blue circles, downregulated metabolites. (C) The enrichment of differential metabolites was analyzed using Kyoto Encyclopedia of Genes and Genomes (KEGG), and the top 10 enrichment terms were presented. (D) Heat map of the top 20 differential metabolites in HFD serum. (E–G) Comparison of the concentrations of pyridoxine (n: CD=9, HFD=10; p=5.295×10⁻⁵), methionine (n: CD=9, HFD=10; p=5.5×10⁻⁵), and tyrosine (n: CD=9, HFD=10; p=1.532×10⁻⁷) among the groups. *p<0.05; **p<0.01; ***p<0.001. Data presented as mean ± SEM; a two-tail t-test used. (H–J) Concentrations of S-adenosyl methionine (SAM) (n: CD=9, HFD=8; p=0.925814), S-adenosyl homocysteine (SAH) (n: CD=12, HFD=11; p=0.279946) and homocysteine (HCY) (n: CD=11, HFD=11; p=0.540962) in the livers were examined by ELISA. Ns, there was no statistical significance between groups. Data presented as mean ± SEM; a two-tail t-test used. (K) The concentration of SAM in oocytes was analyzed using ELISA. **p<0.01. Data presented as mean ± SEM; a two-tail t-test was used; n: CD=9, HFD=8; p=0.006335. (L) Relative concentration of melatonin in the serum. ***p<0.001. Data presented as mean ± SEM; a two-tail t-test was used; n: CD=9, HFD=10; p=0.00022. (M) Genomic DNA methylation in oocytes was examined using immunofluorescence. CD, control group; HFD, obesity group; HFD + melatonin, obese mice were treated with exogenous melatonin for 14 d. (N) Relative fluorescence intensity of 5mC was examined using Image J (CD, n=109; HFD, n=104, p=0.000639; HFD + melatonin, n=96, p=2.657×10⁻⁷). *p<0.05; ***p<0.001. Data presented as mean ± SEM; a two-tail t-test was used. Source data are presented in Figure 3—source data 1.
-
Figure 3—source data 1
Extended data for Figure 3F-L, and N.
- https://cdn.elifesciences.org/articles/97507/elife-97507-fig3-data1-v1.xls
Figure 3—figure supplement 1
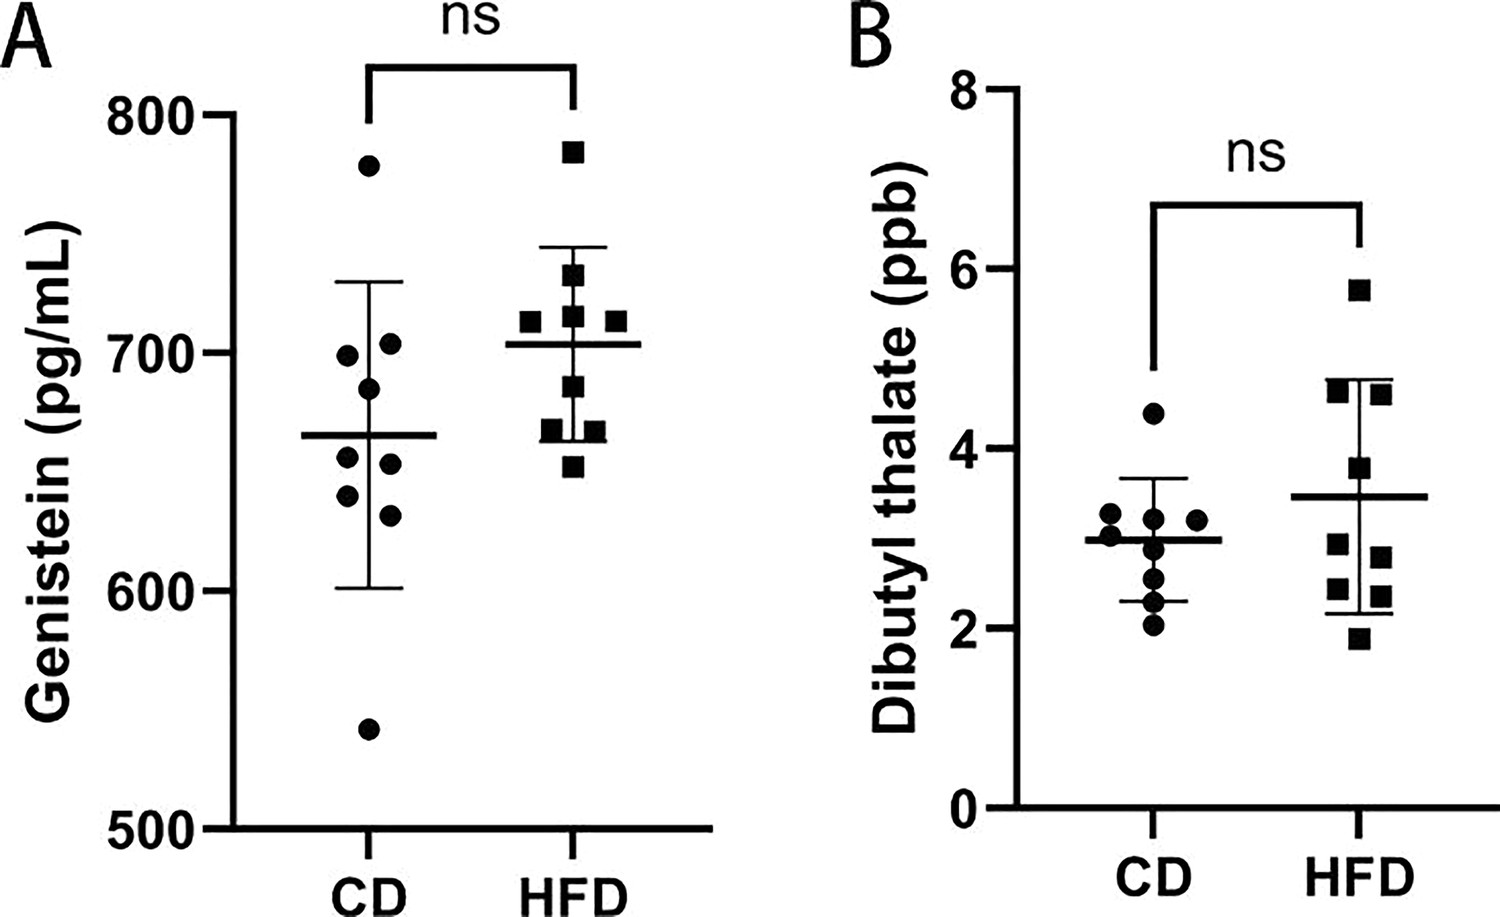
Concentrations of genistein and dibutylthalate in the serum of high-fat diet (HFD) and control group (CD).
Concentrations of genistein and dibutylthalate in the serum of HFD and CD. (A) Genistein(pg/mL) (n:CD=9,HFD=9); (B) Dibutyl thalate(ppb) (n:CD=9,HFD=9). Data presented as mean ± SEM; two-tail t test used.
Figure 4 with 1 supplement
Melatonin regulates DNA methylation in oocytes.
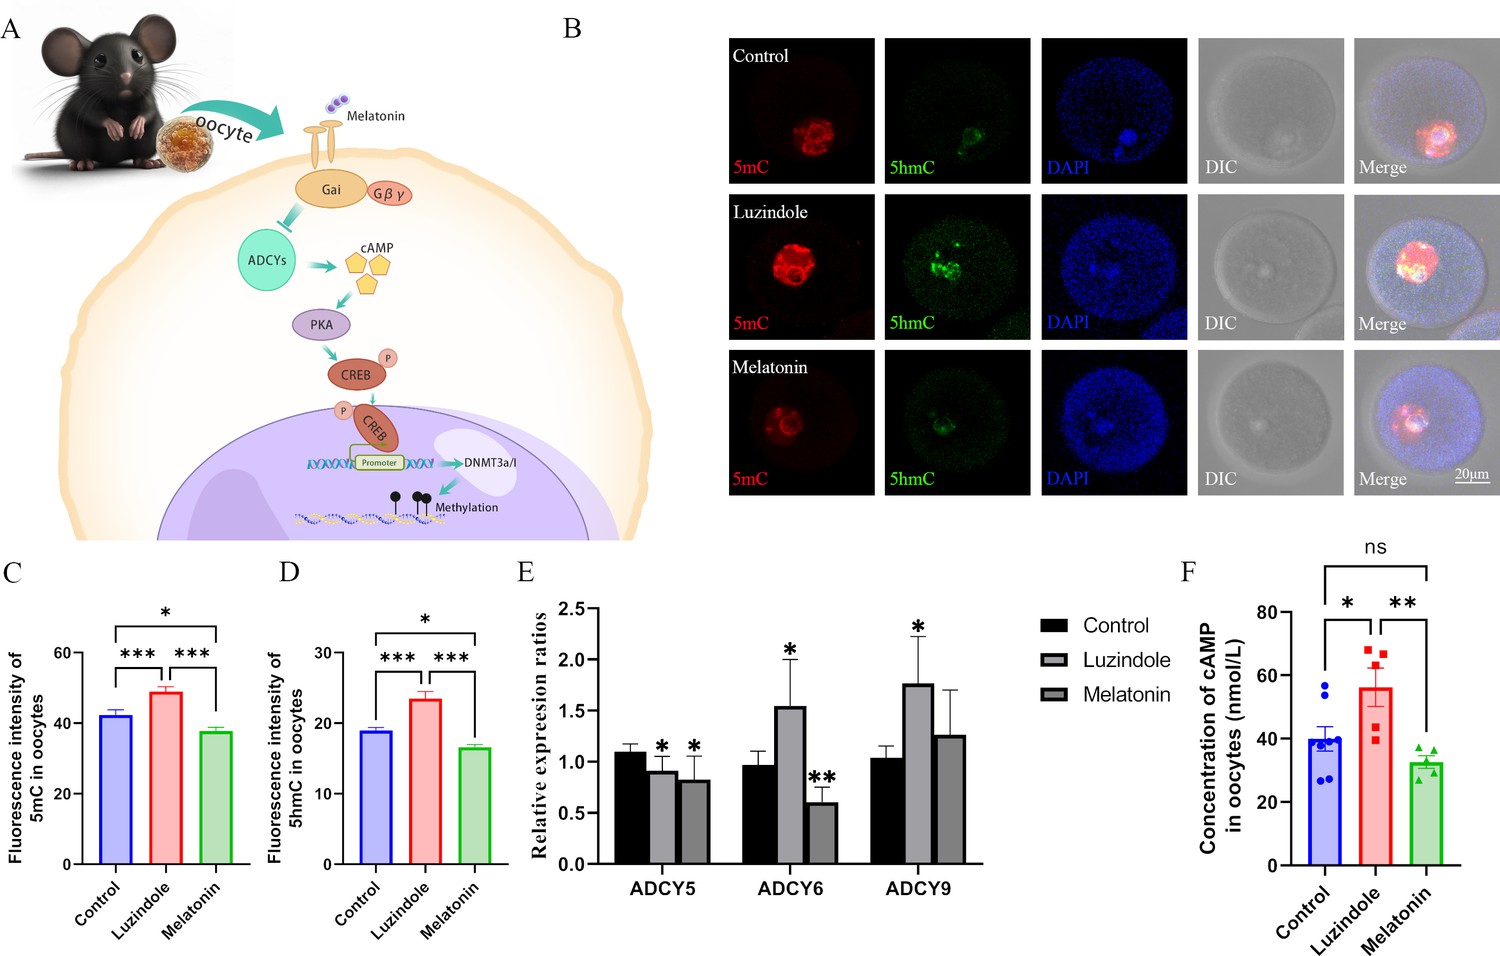
(A) Schedule of the possible pathway by which melatonin regulates DNA methylation in oocytes. According to previous studies, we predicted that melatonin might regulate DNA methylation in oocytes via the cAMP/PKA/CREB pathway. (B) Effects of melatonin and its inhibitor luzindole on oocyte methylation were examined using immunofluorescence. (C, D) The relative fluorescence intensities of 5mC and 5hmC were analyzed using Image J (5mC: Control, n=81; Luzindole, n=83, p=0.000886; Melatonin, n=86, p=5.19×10⁻¹⁰; 5hmC: Control, n=64; Luzindole, n=58, p=3.258×10⁻⁵; Melatonin, n=49, p=2.065×10⁻⁸). *p<0.05; ***p<0.001. Data presented as mean ± SEM; two-tail t-test was used. (E) The effects of melatonin and its inhibitor luzindole on the expression of adenylate cyclase (ADCY) in oocytes were examined by qPCR. *p<0.05; **p<0.01. Data presented as mean ± SD; two-tail t-test was used. p-value presented in Figure 4—source data 1. (F) The concentration of cAMP in oocytes was examined by ELISA. *p<0.05; **p<0.01. Data presented as mean ± SEM; a two-tail t-test was used; n: control=8, luzindole=5, p=0.035046, melatonin=5, p=0.006113. Source data are presented in Figure 4—source data 1.
-
Figure 4—source data 1
Extended data for Figure 4C-F.
- https://cdn.elifesciences.org/articles/97507/elife-97507-fig4-data1-v1.xls
Figure 4—figure supplement 1

Melatonin level in the blood and ADCYs expression in oocytes.
(A) The concentrations of melatonin in serum (n:Control=9,Luzindole=4,Melatonin=5); data presented as mean ± SEM; two-tail t test used.; (B) the expression of ADCYs in oocytes examined by RT-PCR.
Figure 5
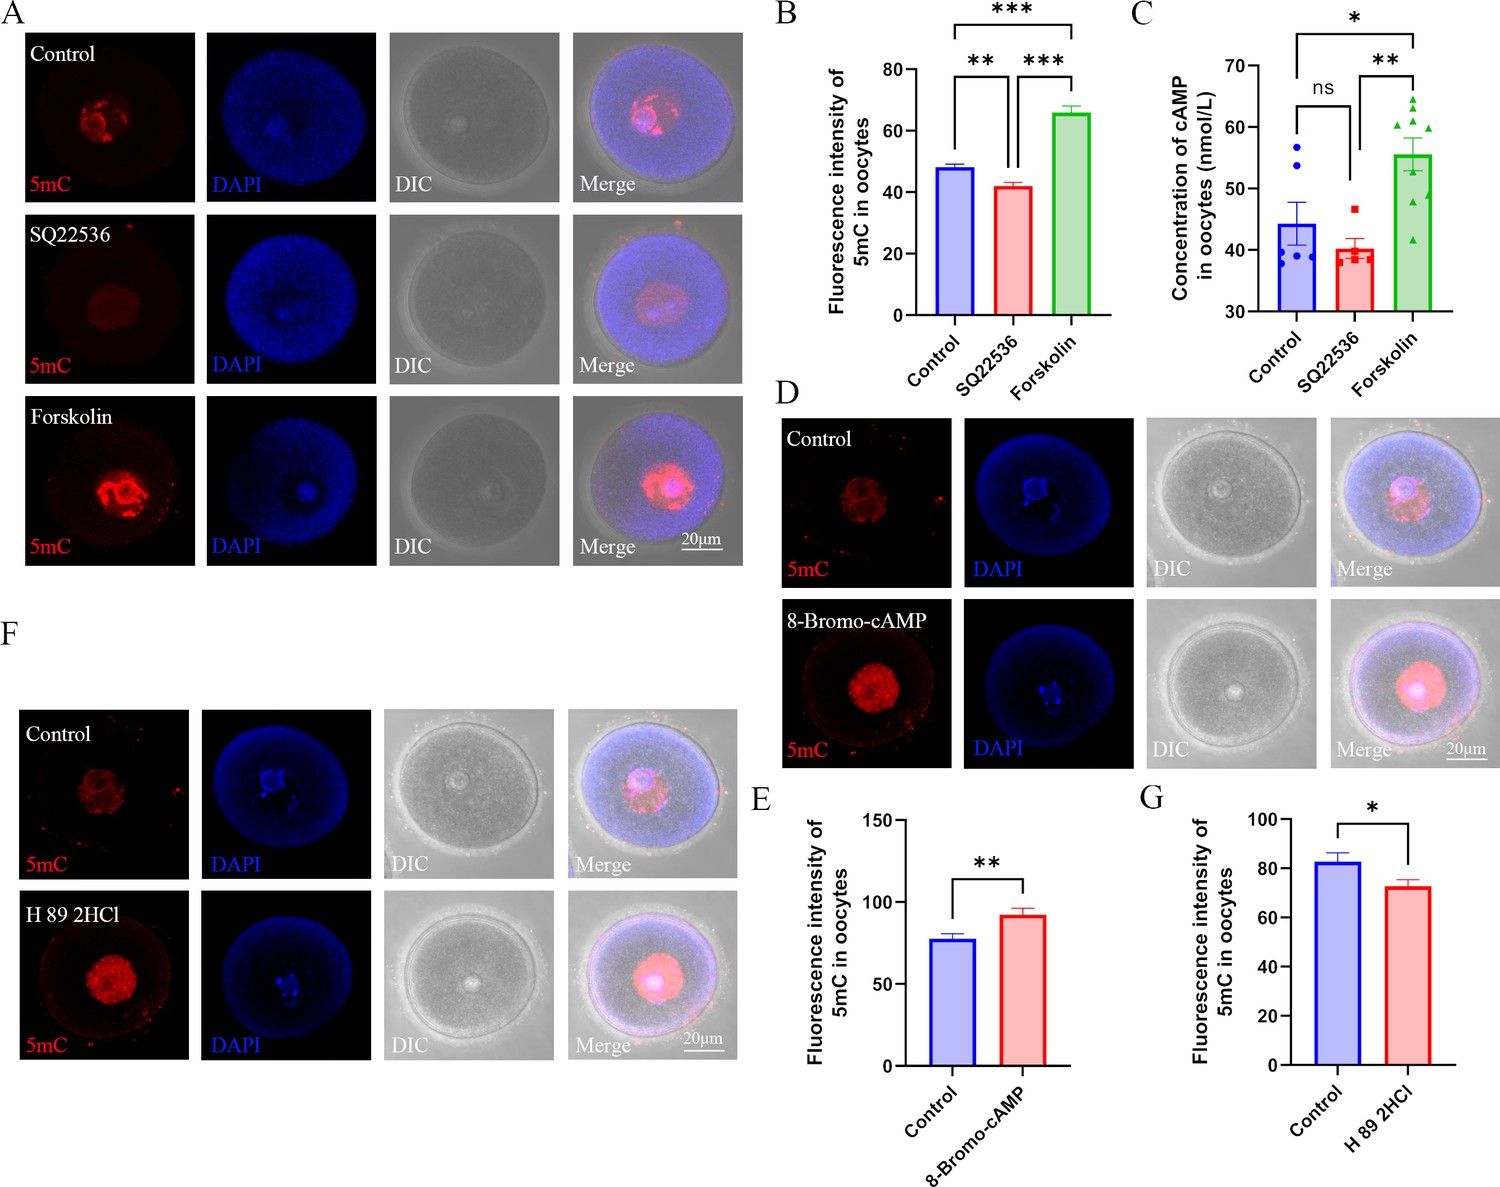
Role of cAMP in DNA methylation in oocytes.
(A) Female mice were respectively treated with the adenylyl cyclase (ADCY) inhibitor SQ22536 or activator forskolin. Oocyte methylation was examined using immunofluorescence. (B) The relative intensity of fluorescence in oocytes was analyzed using Image J (Control, n=107; SQ22536, n=51, p=0.000257; Forskolin, n=57, p=3.099×10⁻¹⁶). **p<0.01; ***p<0.001. Data presented as mean ± SEM; a two-tail t-test was used. (C) cAMP concentration in oocytes was examined using ELISA. *p<0.05; **p<0.01. Data presented as mean ± SEM; a two-tail t-test was used; n: control=6, SQ22536=5, p=0.350475, forskolin=9, p=0.001756. (D) Female mice were treated with the cAMP analogue 8-Bromo-cAMP, and oocyte methylation was examined using immunofluorescence. (E) The relative fluorescence intensity of 5mC was analyzed using Image J (Control, n=41; 8-Bromo-cAMP, n=42, p=0.004255). **p<0.01. Data presented as mean ± SEM; a two-tail t-test was used. (F) Female mice were treated with the PKA (protein kinase A) antagonist H 89 2HCL, and then oocyte methylation was examined using immunofluorescence. (G) The relative fluorescence intensity of 5mC was analyzed using Image J (Control, n=24; H 89 2HCl, n=25, p=0.032292). *p<0.05. Data presented as mean ± SEM; a two-tail t-test was used. Source data are presented in Figure 5—source data 1.
-
Figure 5—source data 1
Extended data for Figure 5B, C, E and G.
- https://cdn.elifesciences.org/articles/97507/elife-97507-fig5-data1-v1.xls
Figure 6
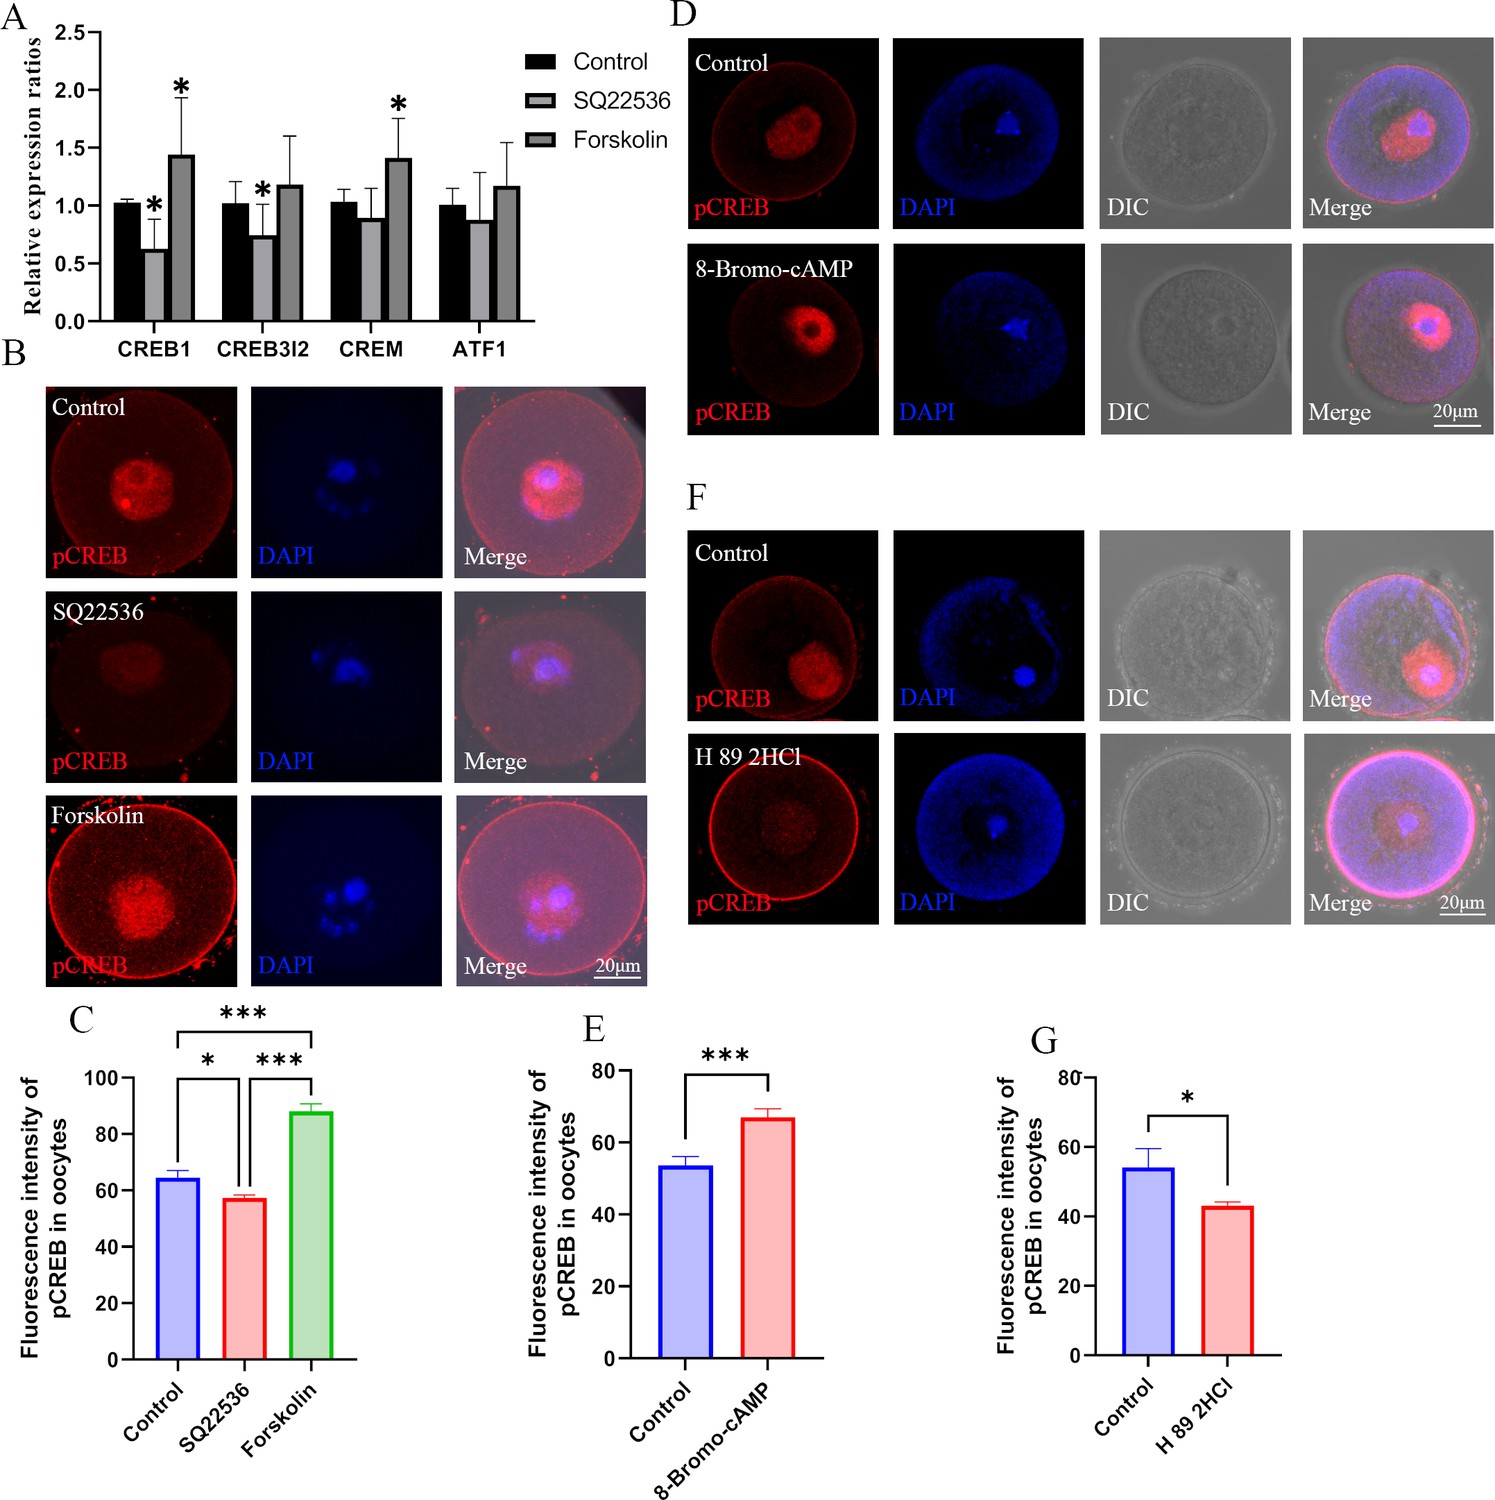
Effects of cAMP on CREB1.
(A) The mRNA expression of cAMP-response element binding (CREB) proteins in oocytes was examined by qPCR. *p<0.05. Data presented as mean ± SD; a two-tail t-test was used. p-value presented in the Figure 6—source data 1. (B) Phosphorylated CREB1 (pCREB1) in oocytes was examined using immunofluorescence. (C) The relative fluorescence intensity of pCREB1 was examined by Image J (Control, n=36; SQ22536, n=48, p=0.003985; Forskolin, n=41, p=4.402×10⁻¹⁹). *p<0.05; **p<0.01; ***p<0.001. Data presented as mean ± SEM; a two-tail t-test was used. (D) After treatment with the cAMP analogue 8-Bromo-cAMP, pCREB1 in oocytes was examined using immunofluorescence. (E) The relative fluorescence intensity was analyzed using Image J (Control, n=28; 8-Bromo-cAMP, n=28, p=0.00022). ***p<0.001. Data presented as mean ± SEM; a two-tail t-test was used. (F) Immunofluorescence of pCREB in GV oocytes after treated with H89 2HCl. (G) The relative intensity of pCREM in GV oocytes treated with H89 2HCl, n: control=23, H89 2HCl=26, p=0.040168. Source data are presented in Figure 6—source data 1.
-
Figure 6—source data 1
Extended data for Figure 6A, C, E, and G.
- https://cdn.elifesciences.org/articles/97507/elife-97507-fig6-data1-v1.xls
Figure 7 with 1 supplement
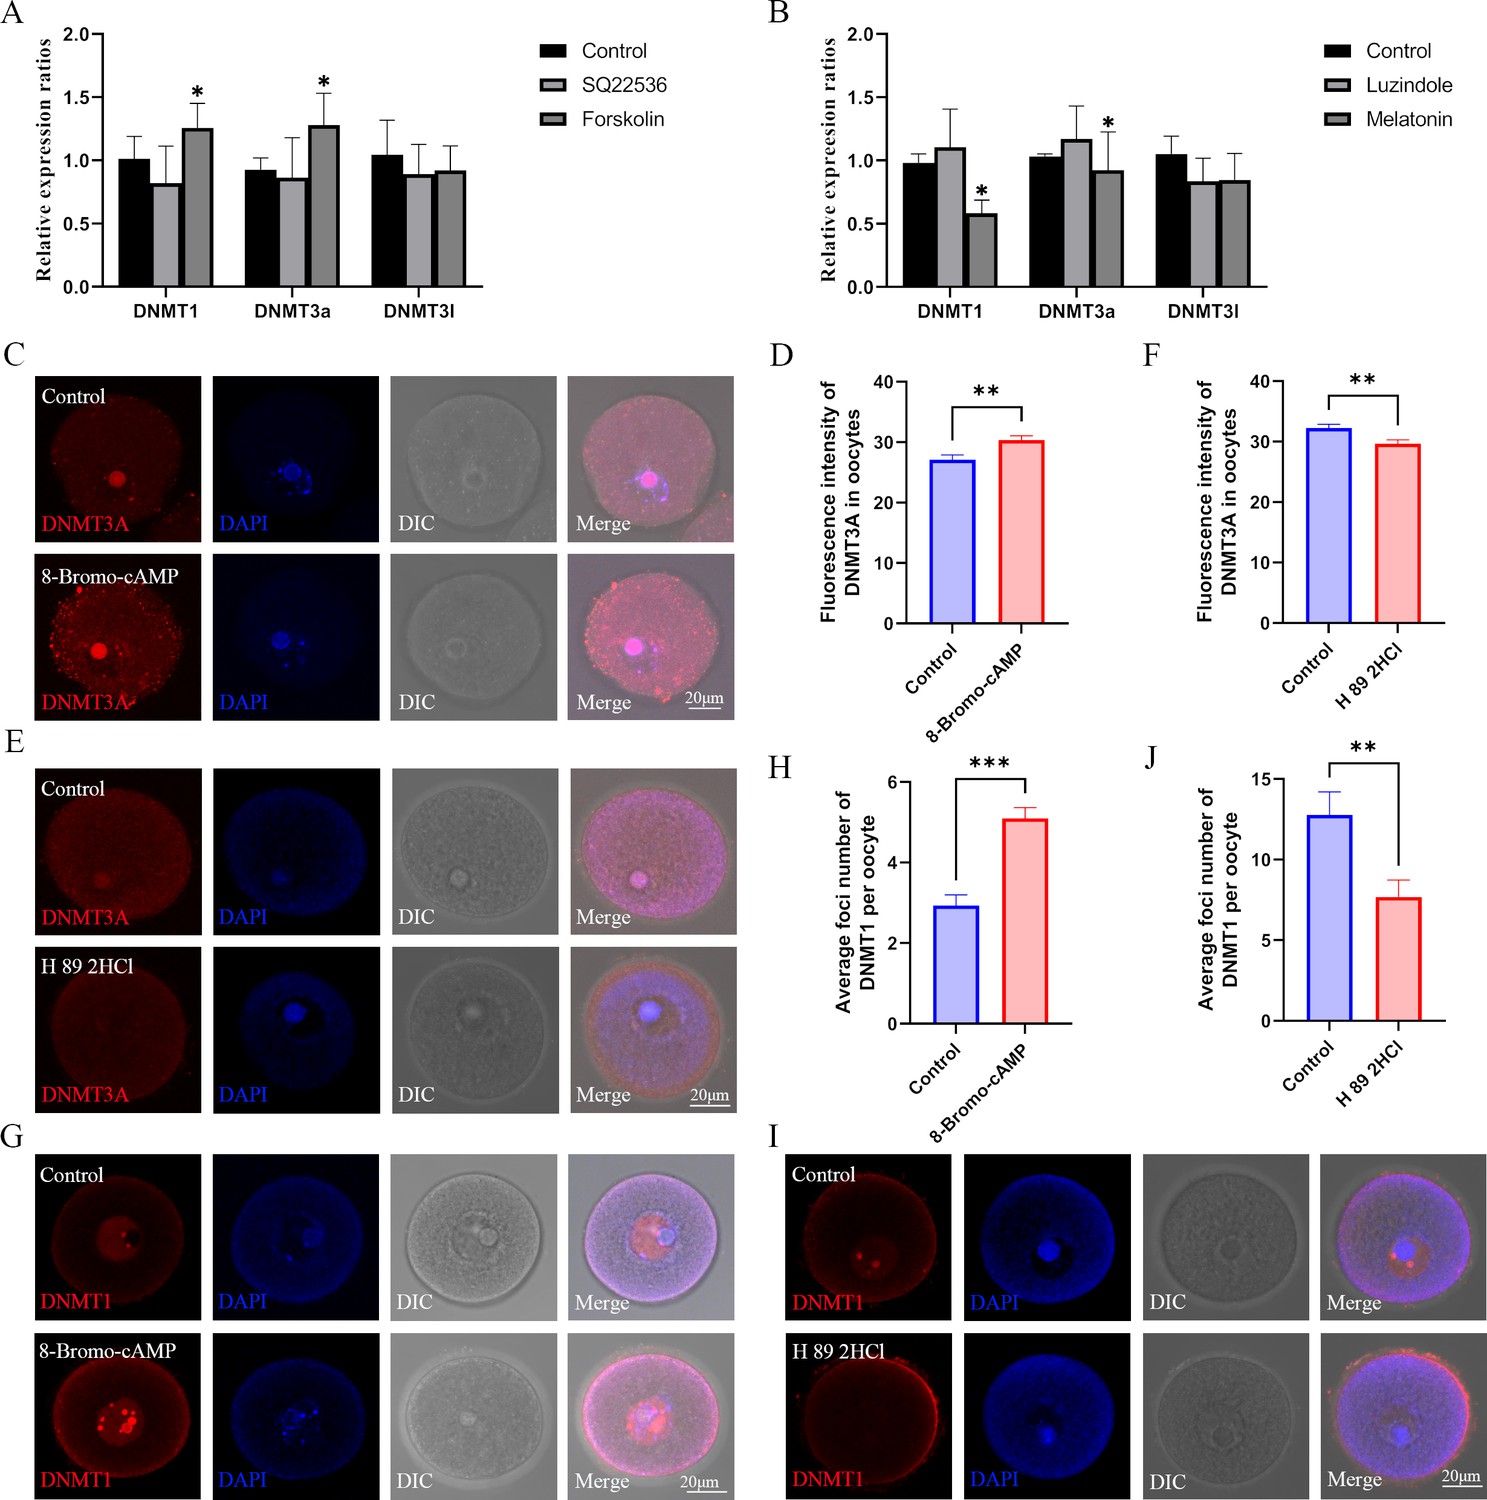
Role of the melatonin/cAMP/PKA pathway in the expression of DNMTs.
(A) The expression levels of Dnmt1, Dnmt3a, and Dnmt3l in oocytes were examined using qPCR after the treatment with SQ22536 and forskolin. *p<0.05. Data presented as mean ± SEM; a two-tail t-test was used. p-value presented in the source data. (B) The relative expressions of Dnmt1, Dnmt3a, and Dnmt3l in oocytes were examined using qPCR after the treatment with luzindole and melatonin. *p<0.05. Data presented as mean ± SEM; a two-tail t-test was used. (C) After 8-Bromo-cAMP treatment, the relative expression of DNMT3a in oocytes was examined using immunofluorescence and calculated by Image J (D) (Control, n=54; 8-Bromo-cAMP, n=70, p=0.002447). **p<0.01. Data presented as mean ± SEM; a two-tail t-test was used. (E and F) Treatment with the protein kinase A (PKA) antagonist H 89 2HCL treatment significantly reduced the level of DNMT3A in oocytes examined using immunofluorescence (Control, n=62; H 89 2HCl, n=48, p=0.003922). **p<0.01. Data presented as mean ± SEM; a two-tail t-test was used. (G and H) DNMT1 localization in the oocyte nucleus was examined using immunofluorescence after 8-Bromo-cAMP treatment (Control, n=30; 8-Bromo-cAMP, n=31, p=3.136*10–7). ***p<0.001. Data presented as mean ± SEM;a two-tail t-test was used. (I and J) The localization of DNMT1 in oocyte nucleus was reduced by the treatment with the PKA antagonist H 89 2HCL (Control, n=22; H 89 2HCl, n=28, p=0.004929). ** p<0.01. Data presented as mean ± SEM; a two-tail t-test was used. Source data are presented in Figure 7—source data 1.
-
Figure 7—source data 1
Extended data for Figure 7A, B, D, F, H, and J.
- https://cdn.elifesciences.org/articles/97507/elife-97507-fig7-data1-v1.xls
Figure 7—figure supplement 1

DNMTs regulate DNA methylation in oocytes.
(A) The methylation level of 5mC in oocytes after DNMTs inhibited by 5-Azacytidine; (B) the relative intensity of fluorescence of 5mC in oocytes (n:Control=59,5-Azacytidine=43). Data presented as mean ± SEM; two-tail t test used.
Figure 8
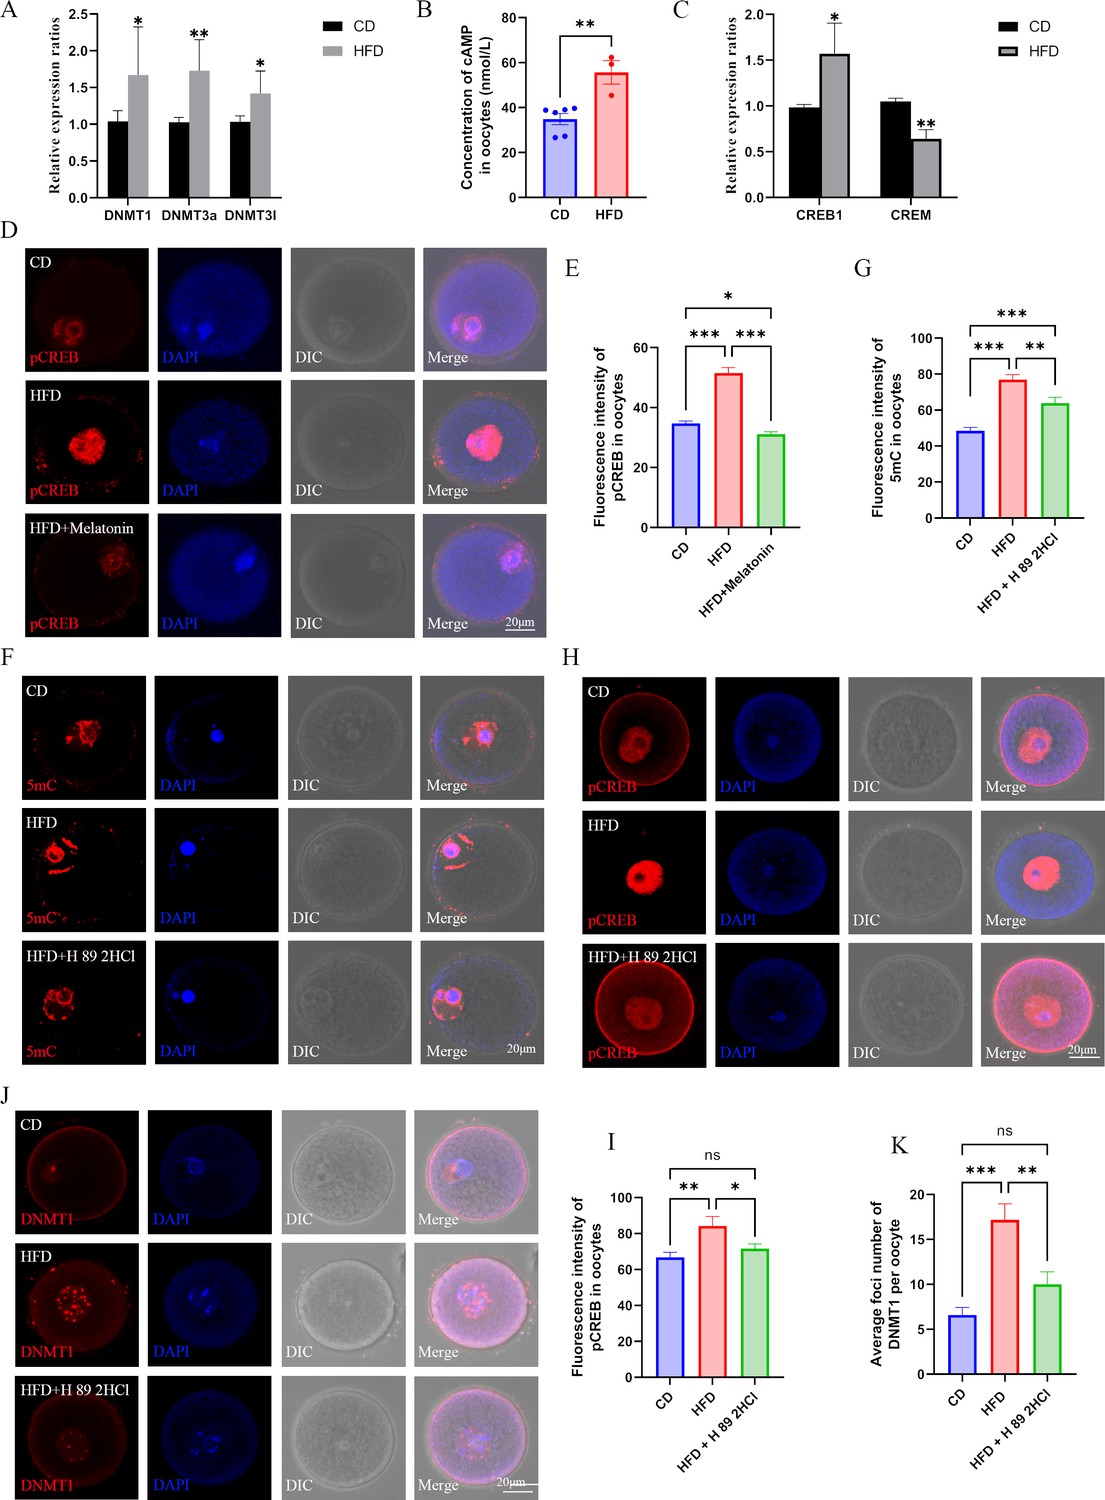
Melatonin regulates DNMTs expression via cAMP/PKA/CREB pathway in high-fat diet (HFD) oocytes.
(A) The relative expression of Dnmt1, Dnmt3a, and Dnmt3l in HFD oocytes was examined using qPCR. *p<0.05; **p<0.01. Data presented as mean ± SD; two-tail t-test used. p-value presented in the source data. (B) The concentration of cAMP in HFD oocytes was examined using ELISA. **p<0.01. Data presented as mean ± SEM; a two-tail t-test was used, n: CD=6, HFD = 3, p=0.004375.(C) The relative expressions CREB1 and CREM in HFD oocytes were tested using qPCR. *p<0.05; **p<0.01. Data presented as mean ± SD; a two-tail t-test was used. Replicated three times for each gene, and p value presented in the source data.(D and E) The level of pCREB1 in oocytes was examined using immunofluorescence, and the relative fluorescence intensity was calculated by Image J (E) (CD, n=69; HFD, n=49, p=3.326×10⁻¹⁶; HFD + melatonin, n=61, p=8.997×10⁻²⁰). HFD, oocytes from obese mice; CD, oocytes from control mice; HFD + melatonin, oocytes from obese mice treated with exogenous melatonin. *p<0.05; ***p<0.001. Data presented as mean ± SEM; a two-tail t-test was used. (F and G) Treatment with the PKA antagonist H89 2HCL reduced the methylation level of HFD oocytes (CD, n=48; HFD, n=31, p=1.674*10–13; HFD + H 89 2HCl, n=27, p=0.00324). ** p<0.01; *** p<0.001. Data presented as mean ± SEM; a two-tail t-test was used. (H and I) The level of pCREB1 in HFD oocytes was also decreased by the treatment with the protein kinase A (PKA) antagonist H89 2HCL (CD, n=17; HFD, n=17, p=0.006249; HFD +H 89 2HCl, n=22, p=0.027987). *p<0.05; **p<0.01; ns, no statistical significance between groups. Data presented as mean ± SEM; a two-tail t-test was used. (J and K) Treatment with the PKA antagonist H89 2HCL reduced the localization of DNMT1 in HFD oocytes (CD, n=24; HFD, n=29, p=6.214×10⁻⁶; HFD + H 89 2HCl, n=25, p0.003147). **p<0.01; ***p<0.001; ns, no statistical significance between groups. Data presented as mean ± SEM; a two-tail t-test was used. Source data are presented in Figure 8—source data 1 .
-
Figure 8—source data 1
Extended data for Figure 8A, B, C, E, G, I, and K.
- https://cdn.elifesciences.org/articles/97507/elife-97507-fig8-data1-v1.xls
Tables
Appendix 1—key resources table
| Reagent type (species) or resource | Designation | Source or reference | Identifiers | Additional information |
|---|---|---|---|---|
| Biological sample (Mus musculus) | Mus musculus | C57BL/6 | C57BL/6 | Jinan Pengyue Company (Jinan, China) |
| Antibody | Anti-5mC antibody (Mouse monoclonal) | Abcam | Ab73938 | IF(1:200) |
| Antibody | Anti-5hmC antibody (Rabbit monoclonal) | Abcam | Ab214728 | IF(1:200) |
| Antibody | Anti-DNMT3A antibody (Rat Monoclonal) | Active motif | 61478 | IF(1:200) |
| Antibody | Anti-DNMT1 antibody (Mouse Monoclonal) | Active motif | 39204 | IF(1:200) |
| Antibody | Anti-pCREB antibody (Rabbit mAb) | Cell Signaling Technology | 9198 S | IF(1:400) |
| Sequence-based reagent | Bhlha15_F1 | This paper | PCR primers | GTAGGGTGGTTTATTTTAGATT |
| Sequence-based reagent | Bhlha15_R1 | This paper | PCR primers | ACCATCCCATCTATCTATCTAT |
| Sequence-based reagent | Bhlha15_F2 | This paper | PCR primers | TTTGGTAAGTTTTTAGAGAGGT |
| Sequence-based reagent | Bhlha15_R2 | This paper | PCR primers | CCCAACAATCCTATATAATTTC |
| Sequence-based reagent | Mgat1_F1 | This paper | PCR primers | TAGTAGAGGAAGGTTTTGGA |
| Sequence-based reagent | Mgat1_R1 | This paper | PCR primers | CCTTATCCTCCTAAAACAAAC |
| Sequence-based reagent | Mgat1_F2 | This paper | PCR primers | GGAAGGTTTTGGAAGGAG |
| Sequence-based reagent | Mgat1_R2 | This paper | PCR primers | ACAAACCCCAAAACTAAAAAC |
| Sequence-based reagent | Pik3cd_F1 | This paper | PCR primers | GTTAGAGGAGATATAGGGATTT |
| Sequence-based reagent | Pik3cd_R1 | This paper | PCR primers | CCTTAACCCCTAACTAAAATAT |
| Sequence-based reagent | Pik3cd_F2 | This paper | PCR primers | AGAGGAGATATAGGGATTTTA |
| Sequence-based reagent | Pik3cd_R2 | This paper | PCR primers | TTAACCCCTAACTAAAATATATCT |
| Sequence-based reagent | Tkt_F1 | This paper | PCR primers | TATTTTGTTGTTATTGTTTGTG |
| Sequence-based reagent | Tkt_R1 | This paper | PCR primers | CTTCAAAACCTAAAACTTCTACT |
| Sequence-based reagent | Tkt_F2 | This paper | PCR primers | TATTTTGTTGTTATTGTTTGTGT |
| Sequence-based reagent | Tkt_R2 | This paper | PCR primers | TAAAAACAAAAACACAAAACC |
| Sequence-based reagent | Pld1_F1 | This paper | PCR primers | AGGATATTTGGATAGAAGAAAG |
| Sequence-based reagent | Pld1_R1 | This paper | PCR primers | CAAAAAAACTTCAAAAACAA |
| Sequence-based reagent | Pld1_F2 | This paper | PCR primers | AGGATATTTGGATAGAAGAAAG |
| Sequence-based reagent | Pld1_R2 | This paper | PCR primers | TCCTACRAACTCAAAAATC |
| Sequence-based reagent | H19_F1 | This paper | PCR primers | GAGTATTTAGGAGGTATAAGAATT |
| Sequence-based reagent | H19_R1 | This paper | PCR primers | ATCAAAAACTAACATAAACCCCT |
| Sequence-based reagent | H19_F2 | This paper | PCR primers | GTAAGGAGATTATGTTTATTTTTGG |
| Sequence-based reagent | H19_R2 | This paper | PCR primers | CCTCATTAATCCCATAACTAT |
| Sequence-based reagent | Gapdh_F | This paper | PCR primers | CCTTCCGTGTTCCTACCC |
| Sequence-based reagent | Gapdh_R | This paper | PCR primers | CAACCTGGTCCTCAGTGTAG |
| Sequence-based reagent | Pld1_F | This paper | PCR primers | TCGTTTTGTGGACTGAGAACAC |
| Sequence-based reagent | Pld1_R | This paper | PCR primers | GCTGCTGTTGAAACCCAAATC |
| Sequence-based reagent | Bhlha15_F | This paper | PCR primers | GCTGACCGCCACCATACTTAC |
| Sequence-based reagent | Bhlha15_R | This paper | PCR primers | TGTGTAGAGTAGCGTTGCAGG |
| Sequence-based reagent | Dgka_F | This paper | PCR primers | GATGAACAGATTTTGCCAGGGA |
| Sequence-based reagent | Dgka_R | This paper | PCR primers | GTAGCAGTACACATCACTGAGAC |
| Sequence-based reagent | Pdpk1_F | This paper | PCR primers | GTGCCCATTCAGTCCAGTGT |
| Sequence-based reagent | Pdpk1_R | This paper | PCR primers | AAGGGGTTGGTGCTTGGTC |
| Sequence-based reagent | Mgat1_F | This paper | PCR primers | TTGTGCTTTGGGGTGCTATCA |
| Sequence-based reagent | Mgat1_R | This paper | PCR primers | CCACAGTGGGAACTCTCCA |
| Sequence-based reagent | Taok3_F | This paper | PCR primers | TTGCATGAAATTGGACATGGGA |
| Sequence-based reagent | Taok3_R | This paper | PCR primers | CGATGGTGTTAGGATGCTTCAG |
| Sequence-based reagent | Igf1_F | This paper | PCR primers | CTGGACCAGAGACCCTTTGC |
| Sequence-based reagent | Igf1_R | This paper | PCR primers | GGACGGGGACTTCTGAGTCTT |
| Sequence-based reagent | Map3k8_F | This paper | PCR primers | ATGGAGTACATGAGCACTGGA |
| Sequence-based reagent | Map3k8_R | This paper | PCR primers | GGCTCTTCACTTGCATAAAGGTT |
| Sequence-based reagent | Pld1_F | This paper | PCR primers | TCGTTTTGTGGACTGAGAACAC |
| Sequence-based reagent | Pld1_R | This paper | PCR primers | GCTGCTGTTGAAACCCAAATC |
| Sequence-based reagent | Tkt_F | This paper | PCR primers | ATGGAAGGTTACCATAAGCCAGA |
| Sequence-based reagent | Tkt_R | This paper | PCR primers | TGCAGCATGATGTGGGGTG |
| Sequence-based reagent | Pik3cd_F | This paper | PCR primers | GTAAACGACTTCCGCACTAAGA |
| Sequence-based reagent | Pik3cd_R | This paper | PCR primers | GCTGACACGCAATAAGCCG |
| Sequence-based reagent | Sphk2_F | This paper | PCR primers | CACGGCGAGTTTGGTTCCTA |
| Sequence-based reagent | Sphk2_R | This paper | PCR primers | CTTCTGGCTTTGGGCGTAGT |
| Sequence-based reagent | PPIA_F | This paper | PCR primers | GCCATCACCATCTTCCAGG |
| Sequence-based reagent | PPIA_R | This paper | PCR primers | CACGCCCATCACAAACAT |
| Sequence-based reagent | ADCY5_F | This paper | PCR primers | CTTGGGGAGAAGCCGATTCC |
| Sequence-based reagent | ADCY5_R | This paper | PCR primers | ACCGCTTAGTGGAGGGTCT |
| Sequence-based reagent | ADCY6_F | This paper | PCR primers | TGAGTCTTCTAGCCAGCTCTG |
| Sequence-based reagent | ADCY6_R | This paper | PCR primers | CAGCACCAAGTAGGTGAACCC |
| sequence-based reagent | ADCY9_F | This paper | PCR primers | CAACAGCGTGAGGGTCAAGAT |
| Sequence-based reagent | ADCY9_R | This paper | PCR primers | CATGGAGTCGAATTTGGGGTC |
| Sequence-based reagent | CREB1_F | This paper | PCR primers | AGCAGCTCATGCAACATCATC |
| Sequence-based reagent | CREB1_R | This paper | PCR primers | AGTCCTTACAGGAAGACTGAACT |
| Sequence-based reagent | CREB3l2_F | This paper | PCR primers | CATGTACCACACGCACTTCTC |
| Sequence-based reagent | CREB3l2_R | This paper | PCR primers | CCACCTCCATTGACTCGCTC |
| Sequence-based reagent | CREM_F | This paper | PCR primers | TTGCCCCAAGTCACATGGC |
| Sequence-based reagent | CREM_R | This paper | PCR primers | ACTGCGACTCGACTCTCAAGA |
| Sequence-based reagent | ATF1_F | This paper | PCR primers | GATTCCCACAAGAGTAACACGAC |
| Sequence-based reagent | ATF1_R | This paper | PCR primers | CCTATGCTGTCAGATGAGTCCT |
| Sequence-based reagent | DNMT1_F | This paper | PCR primers | ATCCTGTGAAAGAGAACCCTGT |
| Sequence-based reagent | DNMT1_R | This paper | PCR primers | CCGATGCGATAGGGCTCTG |
| Sequence-based reagent | DNMT3a_F | This paper | PCR primers | GAGGGAACTGAGACCCCAC |
| Sequence-based reagent | DNMT3a_R | This paper | PCR primers | CTGGAAGGTGAGTCTTGGCA |
| Sequence-based reagent | DNMT3l_F | This paper | PCR primers | GCTCTAAGACCCTTGAAACCTTG |
| Sequence-based reagent | DNMT3l_R | This paper | PCR primers | GTCGGTTCACTTTGACTTCGTA |
| Commercial assay or kit | cAMP ELISA kit | Jinma Biotechnology Co. Ltd, Shanghai, China | JS772-Mu | |
| Commercial assay or kit | SAM ELISA kit | Jinma Biotechnology Co. Ltd, Shanghai, China | JS1361-Mu | |
| Commercial assay or kit | SAH ELISA kit | Jinma Biotechnology Co. Ltd, Shanghai, China | JS1362-Mu | |
| Commercial assay or kit | HCY ELISA kit | Jinma Biotechnology Co. Ltd, Shanghai, China | JS1363-Mu | |
| Commercial assay or kit | Genistein ELISA kit | Jinma Biotechnology Co. Ltd, Shanghai, China | JS194-SH | |
| Commercial assay or kit | Dibutyl thalate ELISA kit | Jinma Biotechnology Co. Ltd, Shanghai, China | JS291-NC | |
| Commercial assay or kit | CUT&Tag Assay Kit | Vazyme, China | TD903 | |
| Chemical compound, drug | Luzindole | Sigma | L2407 | 5 mg/kg (ip) |
| Chemical compound, drug | SQ22536 | Selleck | S8283 | 2 mg/kg (ip) |
| Chemical compound, drug | Forskolin | Selleck | S2449 | 2 mg/kg (ip) |
| Chemical compound, drug | H89 2HCL | Selleck | S1582 | 5 mg/kg (ip) |
| Chemical compound, drug | Azacitidine | Selleck | S1782 | 10 mg/kg (ip) |
| Chemical compound, drug | 8-Bromo-cAMP | Selleck | S7857 | 5 mg/kg (ip) |
| Chemical compound, drug | Melatonin | Sigma | M5250 | 10 mg/kg (iv) |
| Software, algorithm | GraphPad Prism 9 | GraphPad |
Additional files
-
Supplementary file 1
Some information on whole genome bisulfite sequencing.
- https://cdn.elifesciences.org/articles/97507/elife-97507-supp1-v1.docx
-
Supplementary file 2
Kyoto Encyclopedia of Genes and Genomes (KEGG) pathway analysis of metabolism-relative genes.
- https://cdn.elifesciences.org/articles/97507/elife-97507-supp2-v1.docx
-
Supplementary file 3
Differentially methylated region (DMRs) methylation status of metabolism-relative genes.
- https://cdn.elifesciences.org/articles/97507/elife-97507-supp3-v1.docx
-
Supplementary file 4
Binding sites of CREB1 on sequences of DNMTs.
- https://cdn.elifesciences.org/articles/97507/elife-97507-supp4-v1.docx
-
Supplementary file 5
Annotation of peaks at relative gene regions.
- https://cdn.elifesciences.org/articles/97507/elife-97507-supp5-v1.docx
-
Supplementary file 6
Percentage of ingredients of diets.
- https://cdn.elifesciences.org/articles/97507/elife-97507-supp6-v1.docx
-
MDAR checklist
- https://cdn.elifesciences.org/articles/97507/elife-97507-mdarchecklist1-v1.docx
Download links
A two-part list of links to download the article, or parts of the article, in various formats.
Downloads (link to download the article as PDF)
Open citations (links to open the citations from this article in various online reference manager services)
Cite this article (links to download the citations from this article in formats compatible with various reference manager tools)
Maternal obesity may disrupt offspring metabolism by inducing oocyte genome hyper-methylation via increased DNMTs
eLife 13:RP97507.
https://doi.org/10.7554/eLife.97507.3


