Aeromonas hydrophila CobQ is a new type of NAD+- and Zn2+-independent protein lysine deacetylase
- Fujian Provincial Key Laboratory of Agroecological Processing and Safety Monitoring, China
- Agricultural College, Anhui Science and Technology University, China
- State Key Laboratory of Proteomics, Beijing Proteome Research Center, National Center for Protein Sciences (Beijing), Beijing Institute of Lifeomics, China
- Key Laboratory of Crop Ecology and Molecular Physiology (Fujian Agriculture and Forestry University), Fujian Province University, China
- Key Laboratory of Marine Biotechnology of Fujian Province, Institute of Oceanology, Fujian Agriculture and Forestry University, China
Figures
Figure 1 with 1 supplement
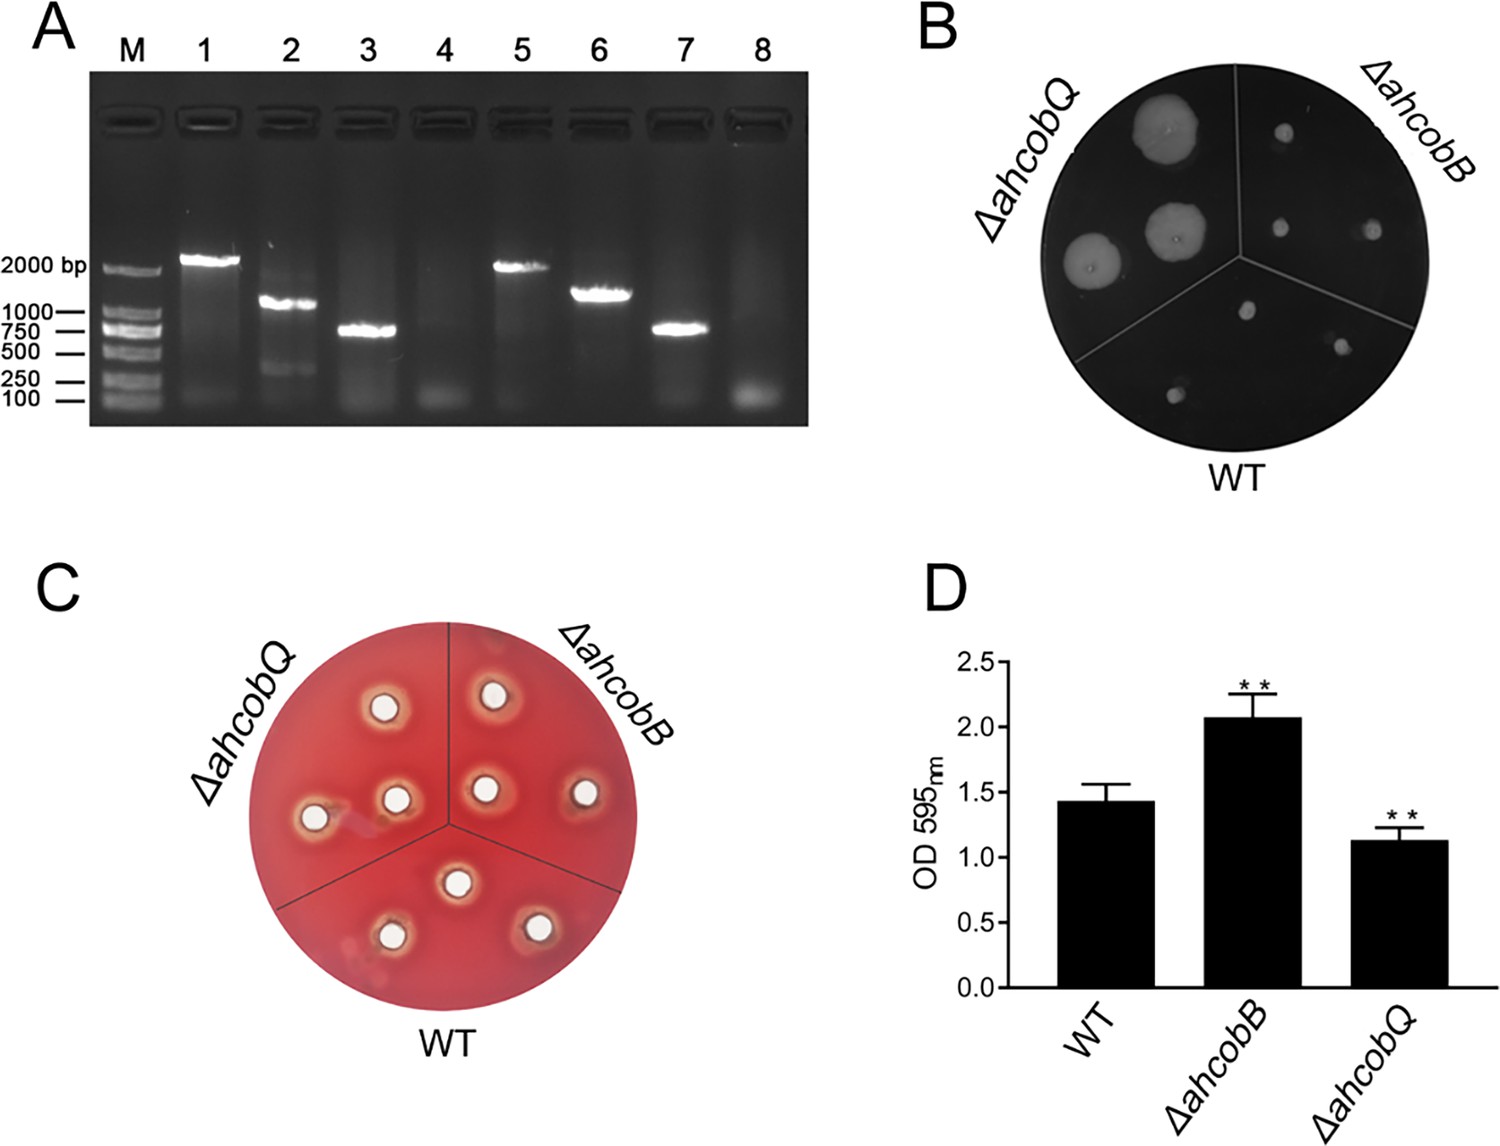
Phenotypes of ΔahcobB and ΔahcobQ strains.
(A) Construction of ahcobB- and ahcobQ-defective strains. M: Marker; Lanes 1 and 3: PCR products of wild-type (WT) using the P7/P8 primer pairs of ahcobB and ahcobQ, respectively; Lanes 2 and 6: PCR products of ΔahcobB and ΔahcobQ, respectively, using P7/P8 primer pairs; Lanes 5 and 7: PCR products of WT using P5/P6 primer pairs of ahcobB and ahcobQ, respectively; Lanes 4 and 8: PCR products of ΔahcobB and ΔahcobQ, respectively, using the P5/P6 primer pairs. (B) Bacterial migration ability; (C) hemolytic activity; (D) histogram of the biofilm formation ability (OD 595 nm). **p<0.005.
-
Figure 1—source data 1
PDF file containing original PCR for Figure 1A, indicating the relevant bands and treatments.
- https://cdn.elifesciences.org/articles/97511/elife-97511-fig1-data1-v1.zip
-
Figure 1—source data 2
Original files for PCR analysis displayed in Figure 3D.
- https://cdn.elifesciences.org/articles/97511/elife-97511-fig1-data2-v1.zip
Figure 1—figure supplement 1
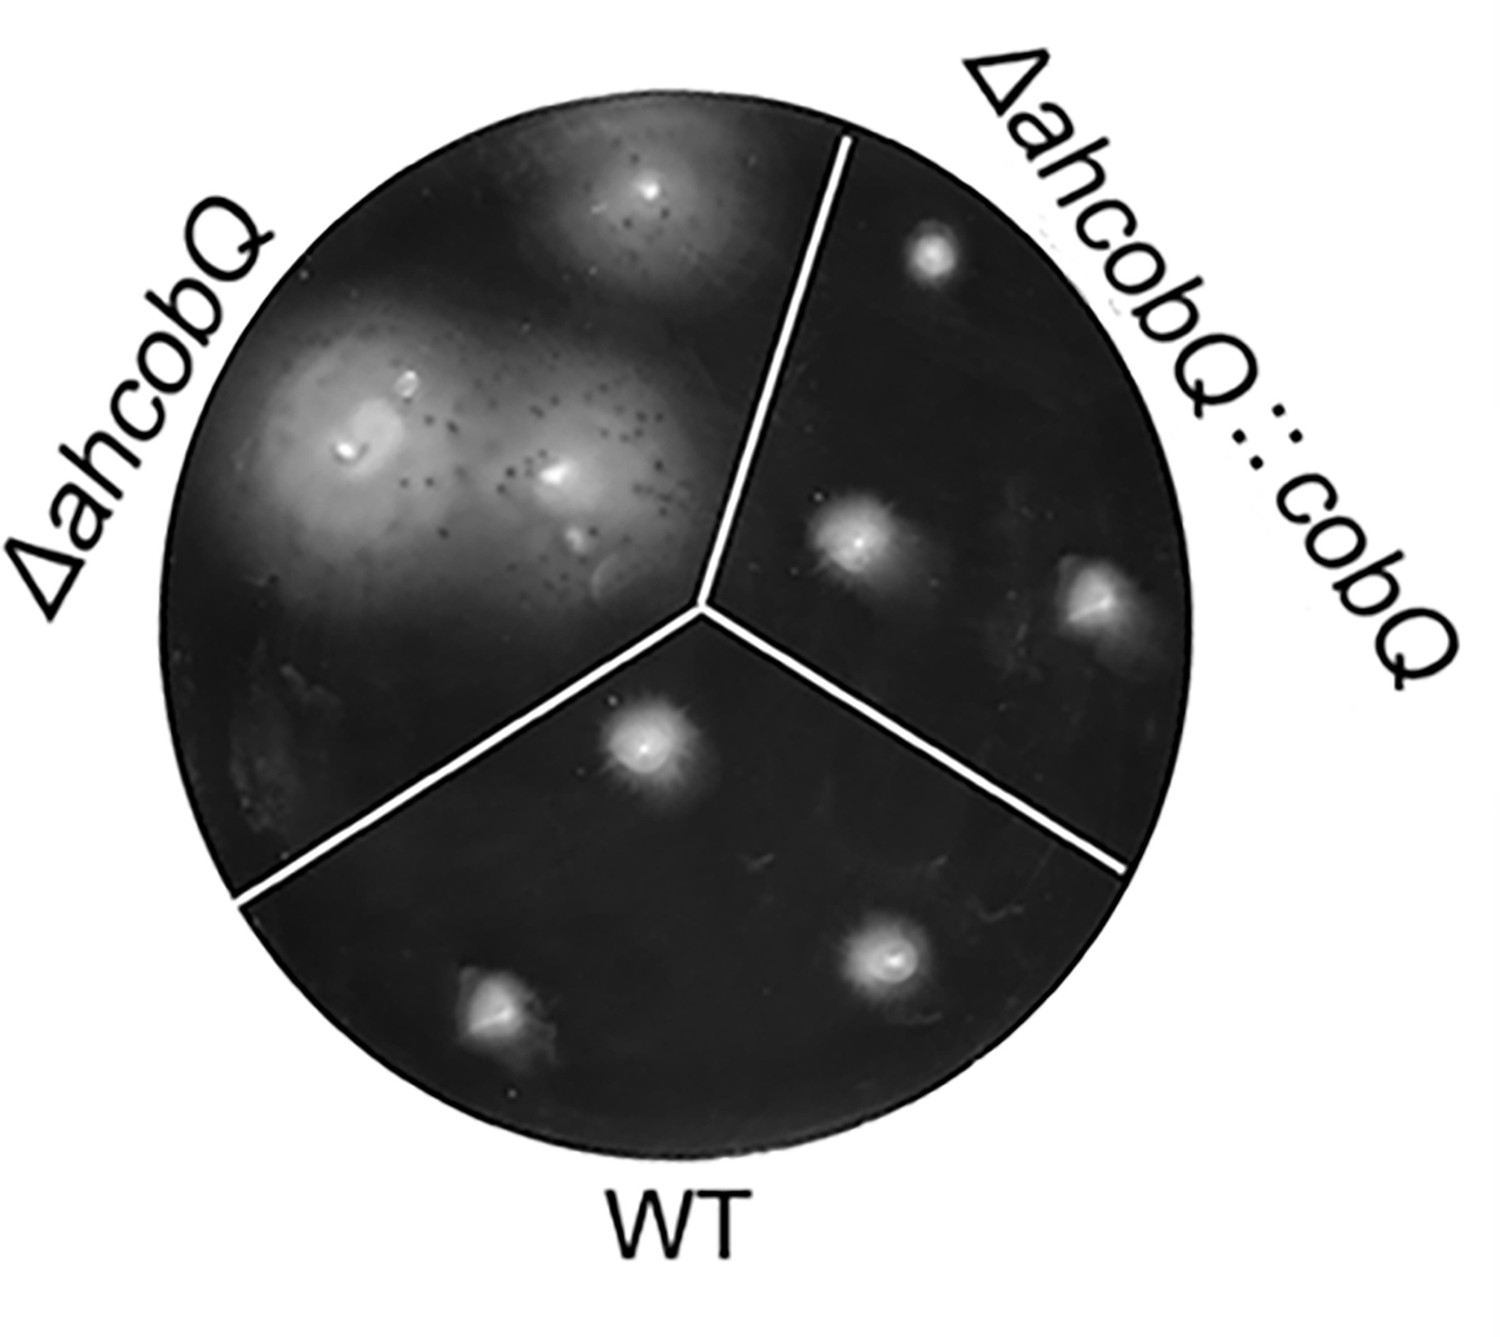
Bacterial swarming ability of ΔahcobQ, wild-type (WT), and ahcobQ complement strain.
Figure 2 with 5 supplements

Homology comparison and deacetylase activity assay of AhCobQ and AhCobB.
(A, B) Homologous and conserved domain analysis of AhCobQ and AhCobB family proteins. (C, D) Dot blot and western blot verified the whole cell protein Kac level among WT, ΔahcobB, and ΔahcobQ strains. (E–H) Effect of NAD+, NAM, Zn2+, and ATP on KDAC enzymatic activity of AhCobQ.
-
Figure 2—source data 1
PDF file containing original western blots for Figure 2C–H, indicating the relevant bands and treatments.
- https://cdn.elifesciences.org/articles/97511/elife-97511-fig2-data1-v1.zip
-
Figure 2—source data 2
Original files for western blot analysis displayed in Figure 2C–H.
- https://cdn.elifesciences.org/articles/97511/elife-97511-fig2-data2-v1.zip
Figure 2—figure supplement 1
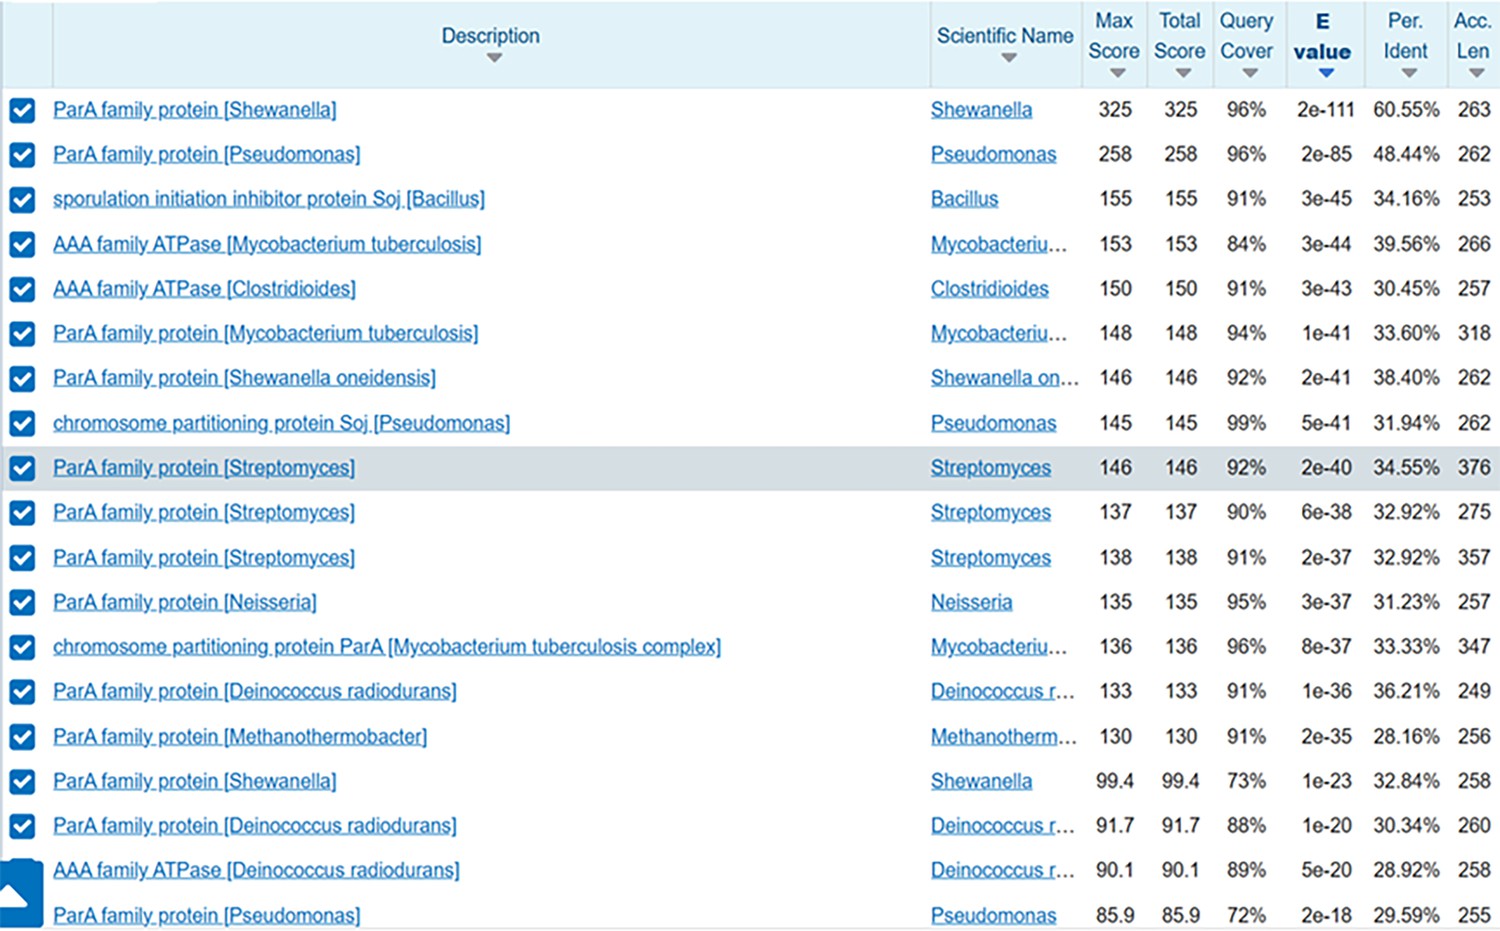
Comparison of homology of AhCobQ protein sequences by using BLAST.
Figure 2—figure supplement 2
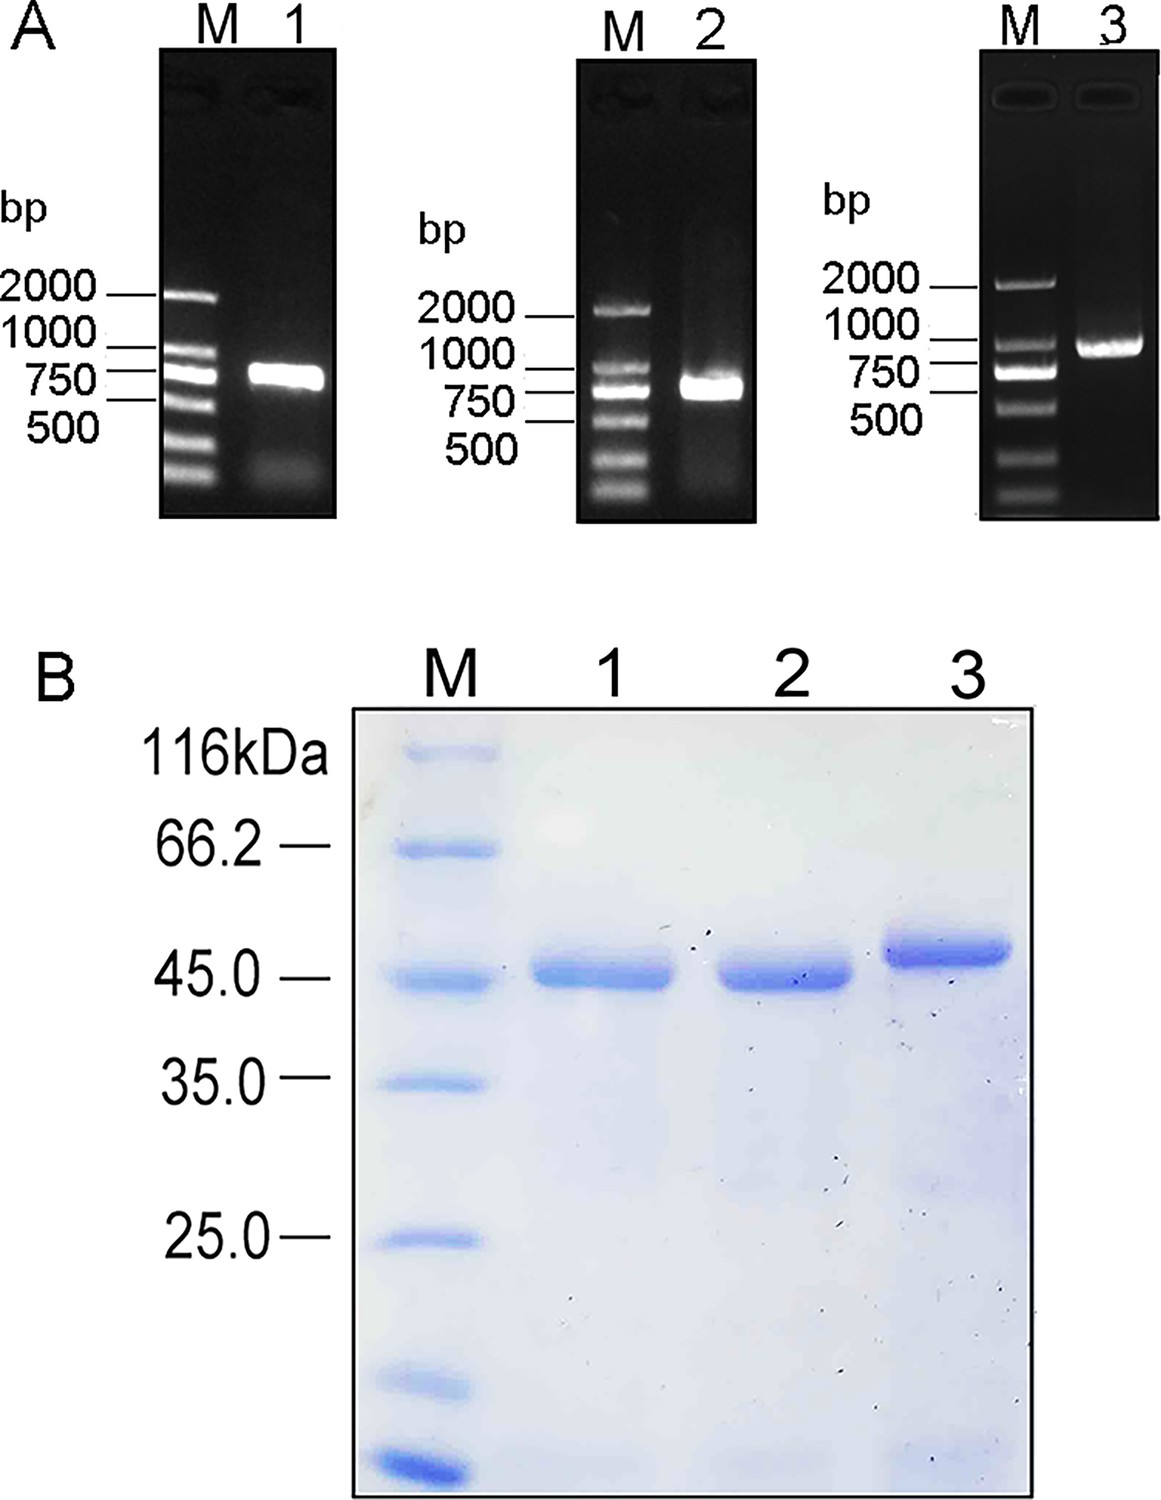
Characteristics of overexpressed and purified recombinant proteins AhCobQ, AhCobB, and AhAcuC.
(A) PCR amplification results of ahcobQ, ahcobB, and ahacuC gene, respectively; (B) SDS-PAGE gels of purified recombinant proteins AhCobQ, AhCoB, and AhAcuC, respectively. Lane M represents the DNA or protein marker. M: Marker; Lane 1: AhCobQ; Lane 2: AhCobB; Lane 3: AhAcuC.
-
Figure 2—figure supplement 2—source data 1
PDF file containing original PCR and SDS-PAGE for Figure 2—figure supplement 2, indicating the relevant bands.
- https://cdn.elifesciences.org/articles/97511/elife-97511-fig2-figsupp2-data1-v1.zip
-
Figure 2—figure supplement 2—source data 2
Original files for PCR and SDS-PAGE analysis displayed in Figure 2—figure supplement 2.
- https://cdn.elifesciences.org/articles/97511/elife-97511-fig2-figsupp2-data2-v1.zip
Figure 2—figure supplement 3
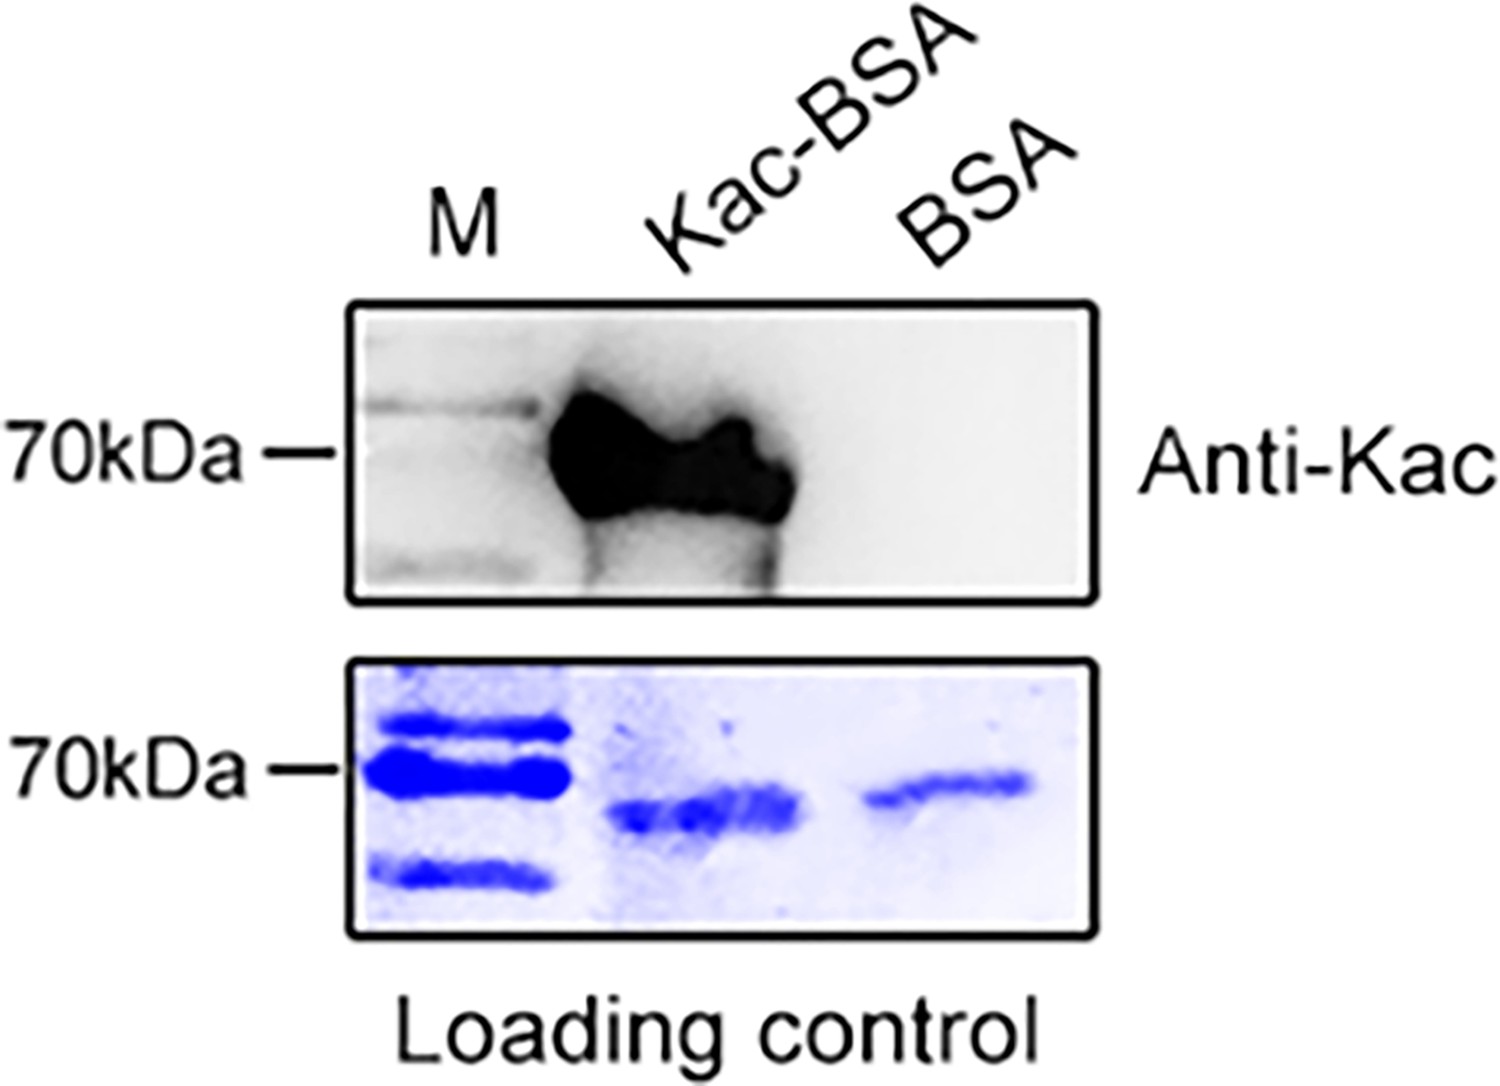
In vitro acetylated BSA (Kac-BSA) was verified by western blot.
-
Figure 2—figure supplement 3—source data 1
PDF file containing western blots for Figure 2—figure supplement 3, indicating the relevant bands and treatments.
- https://cdn.elifesciences.org/articles/97511/elife-97511-fig2-figsupp3-data1-v1.zip
-
Figure 2—figure supplement 3—source data 2
Original files for western blots analysis displayed in Figure 2—figure supplement 3.
- https://cdn.elifesciences.org/articles/97511/elife-97511-fig2-figsupp3-data2-v1.zip
Figure 2—figure supplement 4
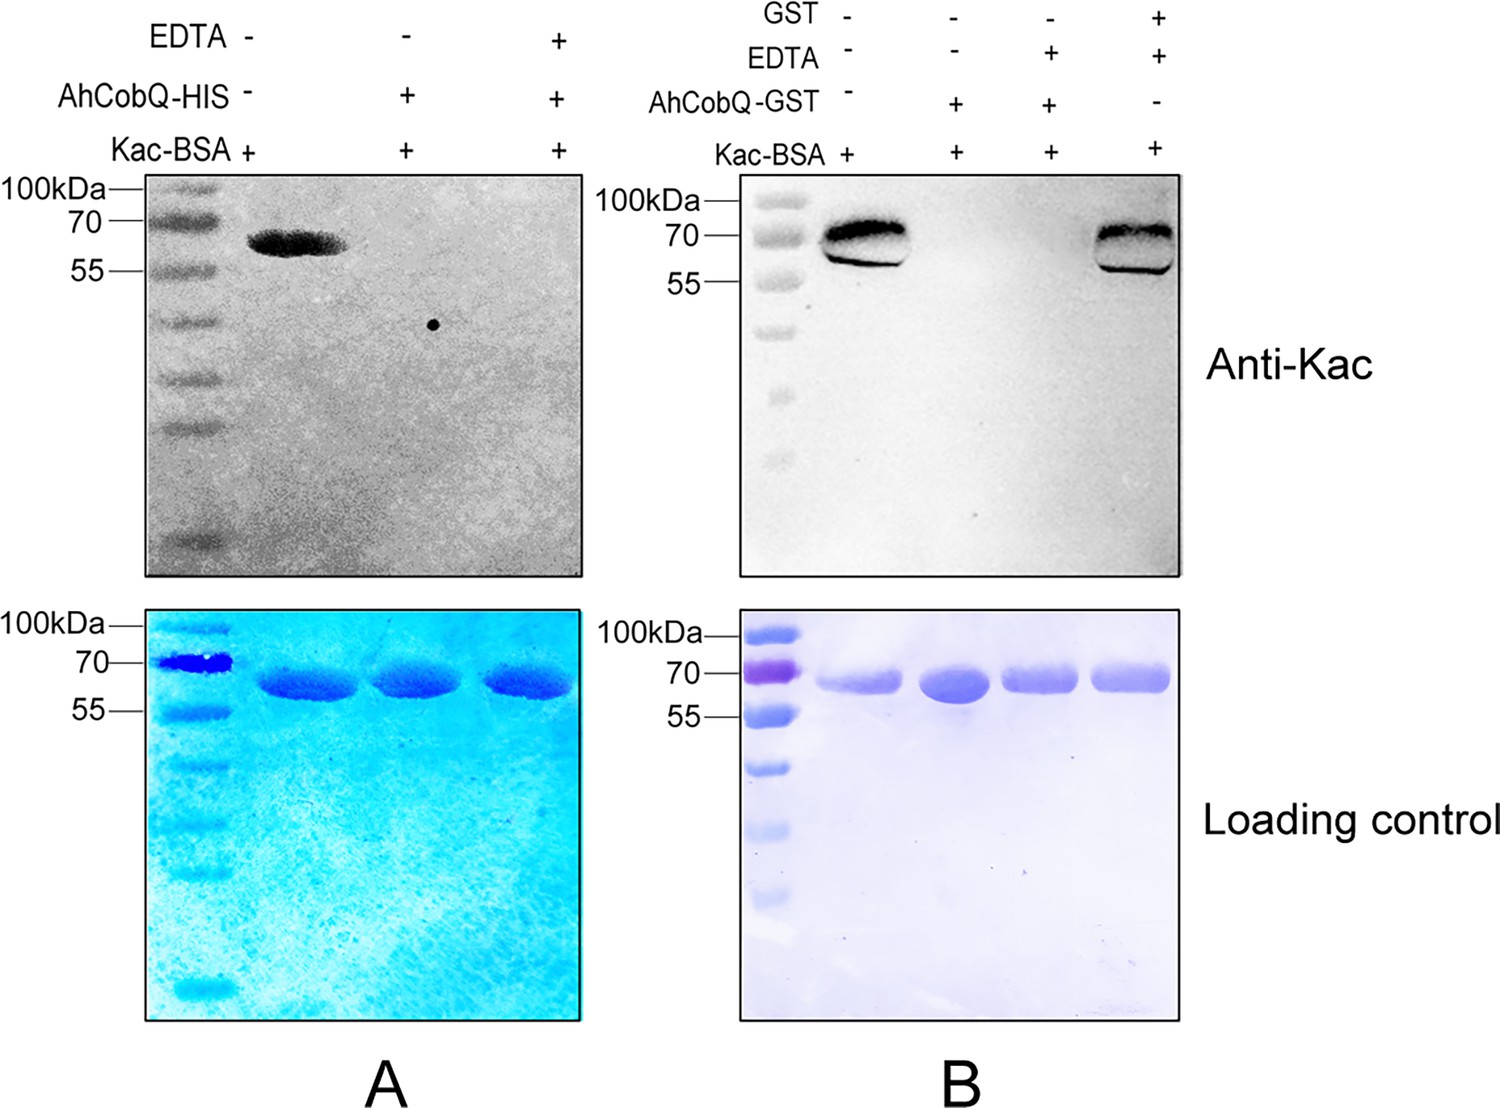
In vitro deacetylase activity assay of different recombinant AhCobQ proteins in the presence and absence of EDTA utilizing Kac-BSA as substrate.
Purified His-tag (A) and GST-fused (B) recombinant AhCobQ incubated with the substrate Kac-BSA, both in the absence and presence of 150 µM EDTA treatment, respectively.
-
Figure 2—figure supplement 4—source data 1
PDF file containing original western blots for Figure 2—figure supplement 4, indicating the relevant bands and treatments.
- https://cdn.elifesciences.org/articles/97511/elife-97511-fig2-figsupp4-data1-v1.zip
-
Figure 2—figure supplement 4—source data 2
Original files for western blots analysis displayed in Figure 2—figure supplement 4.
- https://cdn.elifesciences.org/articles/97511/elife-97511-fig2-figsupp4-data2-v1.zip
Figure 2—figure supplement 5

The lysine deacetylase activity of AhCobQ didn’t be affected by 0.5 mM ATP at different incubation times.
-
Figure 2—figure supplement 5—source data 1
PDF file containing original western blots for Figure 2—figure supplement 5, indicating the relevant bands and treatments.
- https://cdn.elifesciences.org/articles/97511/elife-97511-fig2-figsupp5-data1-v1.zip
-
Figure 2—figure supplement 5—source data 2
Original files for western blots analysis displayed in Figure 2—figure supplement 5.
- https://cdn.elifesciences.org/articles/97511/elife-97511-fig2-figsupp5-data2-v1.zip
Figure 3
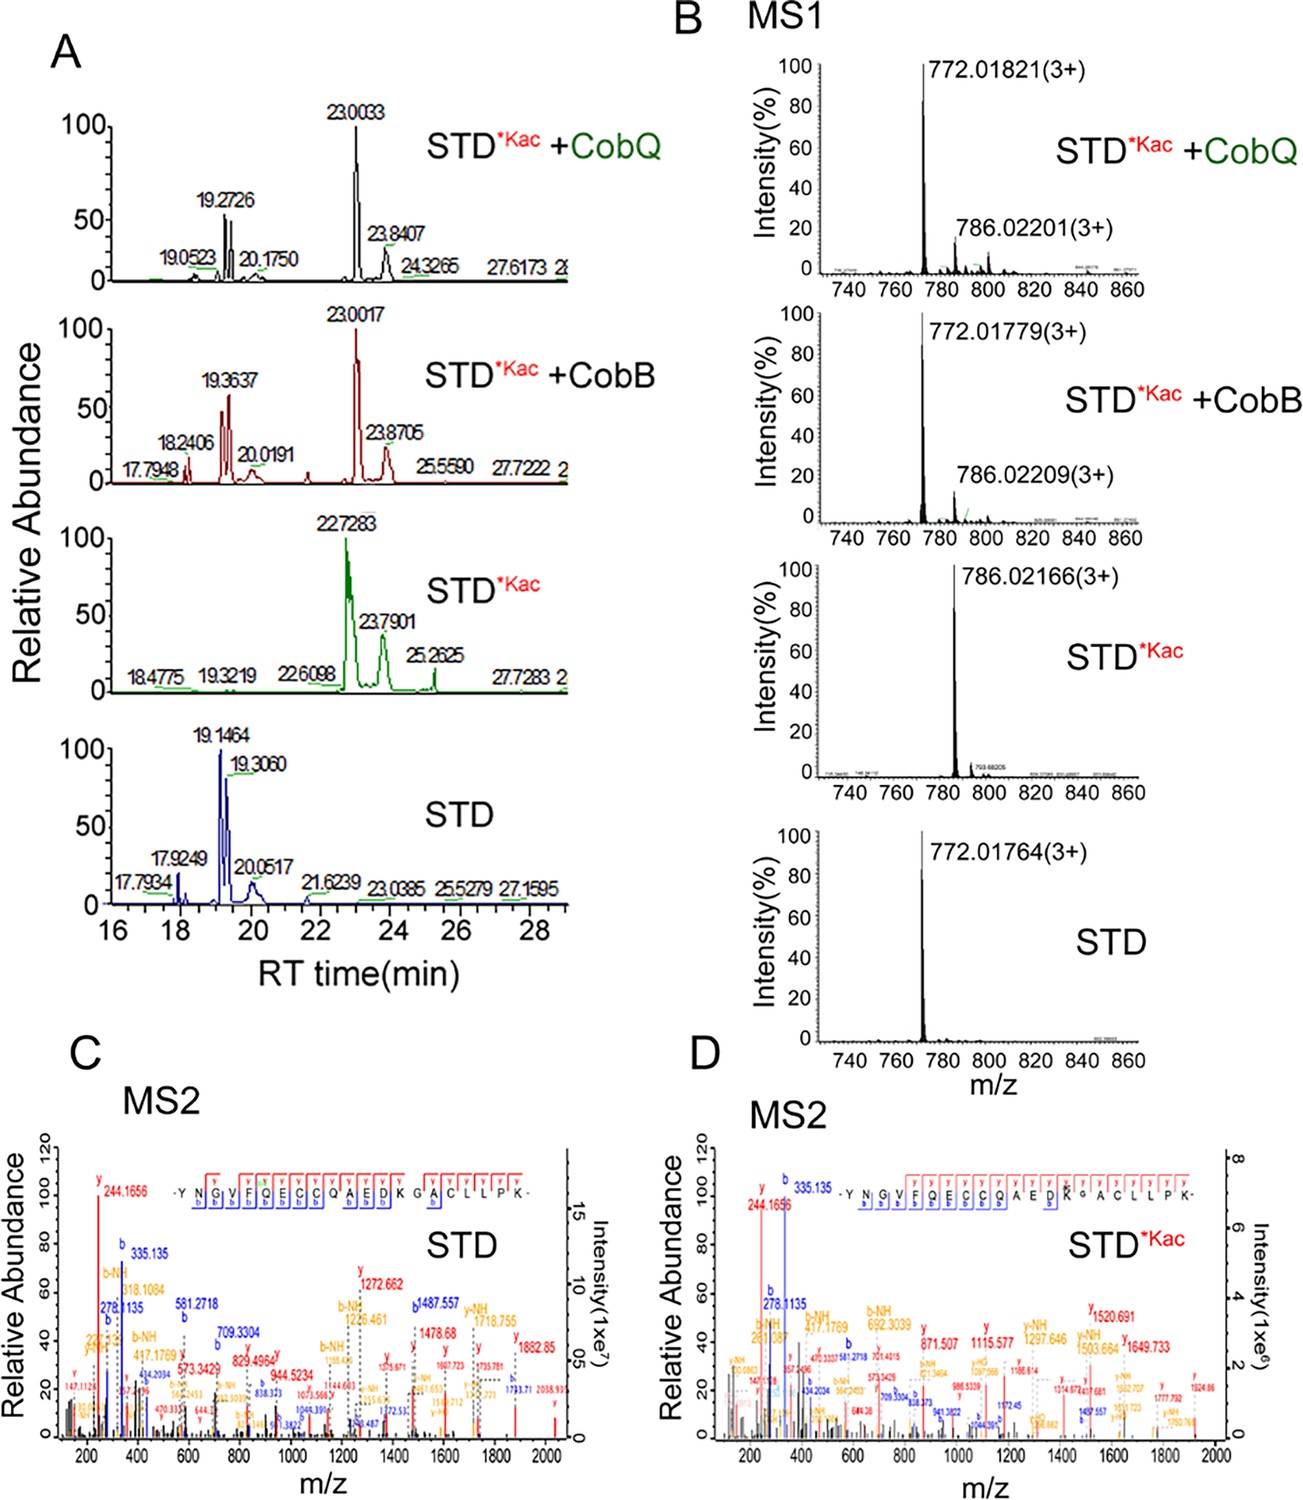
Validation of the KDAC activity of AhCobQ by LC-MS/MS.
(A) Retention time of synthetic peptides YNGVFQECCQAEDKGACLLPK (STD) and YNGVFQECCQAEDKacGACL-L-PK (STD*Kac) with or without AhCobB and AhCoQ treatment; (B) MS1 spectrum of synthetic peptides STD and STD*Kac with or without AhCobB and AhCobQ treatment; (C, D) MS2 spectrum of acetylated and unmodified peptides.
Figure 4 with 1 supplement
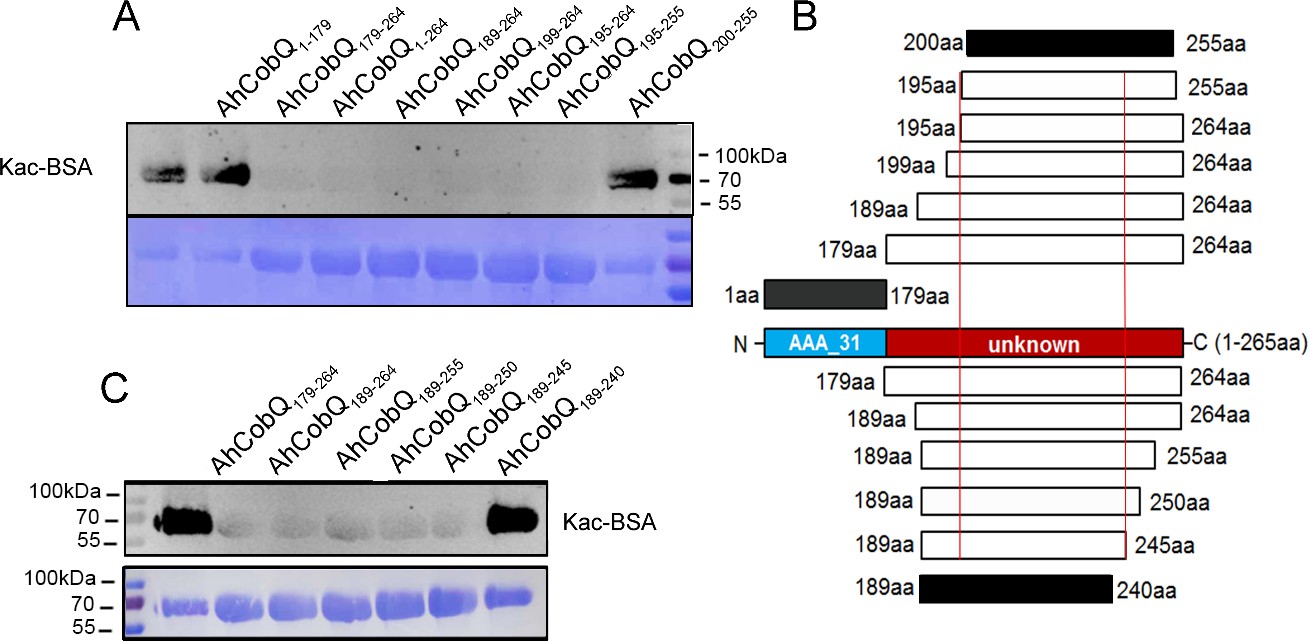
Lysine deacetylase activity of AhCobQ truncated proteins.
Western blot analysis of the lysine acetylases and deacetylases (KDAC) activity of (A) AhCobQ1–179, AhCobQ179–264, AhCobQ1–264, AhCobQ189–264, AhCobQ199–264, AhCobQ195–264, AhCobQ195–255, and AhCobQ200–255; (C) AhCobQ179–264, AhCobQ189–264, AhCobQ189–255, AhCobQ189–250, AhCobQ189–245, and AhCobQ189–240 truncated proteins treated with Kac-BSA. The first lane represents Kac-BSA without AhCobQ truncated proteins. The upper part of the figure shows the WB results of the Kac level of truncated proteins with Kac-BSA, and the lower part shows the PVDF membrane R350 staining for the loading amount control. (B) Design of the series of truncated proteins and the summary of the WB results in this experiment. Blue indicates the AAA_31 domain (1–179 aa), and red indicates the unknown range (180–264 aa) in AhCobQ. Black and white indicate the positive and negative WB results, respectively, in this study.
-
Figure 4—source data 1
PDF file containing original western blots for Figure 4A and C, indicating the relevant bands and treatments.
- https://cdn.elifesciences.org/articles/97511/elife-97511-fig4-data1-v1.zip
-
Figure 4—source data 2
Original files for western blots analysis displayed in Figure 4A and C.
- https://cdn.elifesciences.org/articles/97511/elife-97511-fig4-data2-v1.zip
Figure 4—figure supplement 1
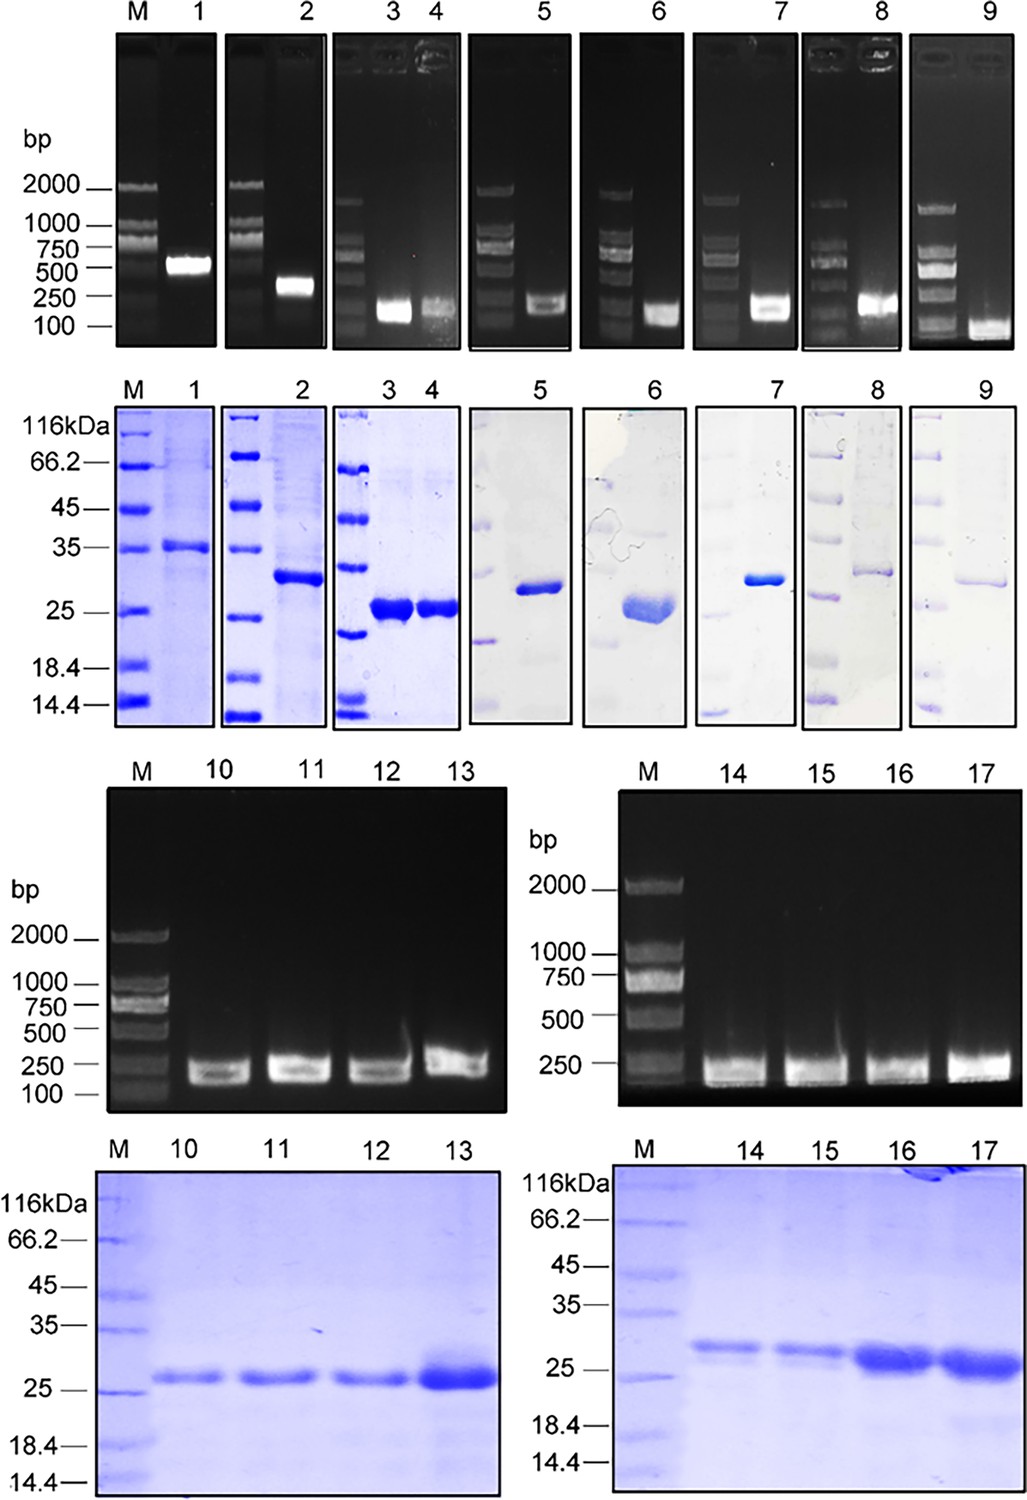
Characteristics of overexpressed and purified recombinant AhCobQ truncated proteins.
The PCR amplification and SDS-PAGE results of purified recombinant truncated proteins (GST-fusion) 1: AhCobQ1–179; 2: AhCobQ179–265; 3: AhCobQ189–265; 4: AhCobQ189–255; 5: AhCobQ189–250; 6: AhCobQ189–245; 7: AhCobQ189–240; 8: AhCobQ195–255; 9: AhCobQ200–255; 10: AhCobQ179–225; 11: AhCobQ179–235; 12: AhCobQ179–245; 13: AhCobQ179–255; 14: AhCobQ189–265; 15: AhCobQ199–265; 16: AhCobQ209–265; 17: AhCobQ219–265.
-
Figure 4—figure supplement 1—source data 1
PDF file containing original PCR and SDS-PAGE for Figure 4—figure supplement 1, indicating the relevant bands.
- https://cdn.elifesciences.org/articles/97511/elife-97511-fig4-figsupp1-data1-v1.zip
-
Figure 4—figure supplement 1—source data 2
Original files for PCR and SDS-PAGE analysis displayed in Figure 4—figure supplement 1.
- https://cdn.elifesciences.org/articles/97511/elife-97511-fig4-figsupp1-data2-v1.zip
Figure 5
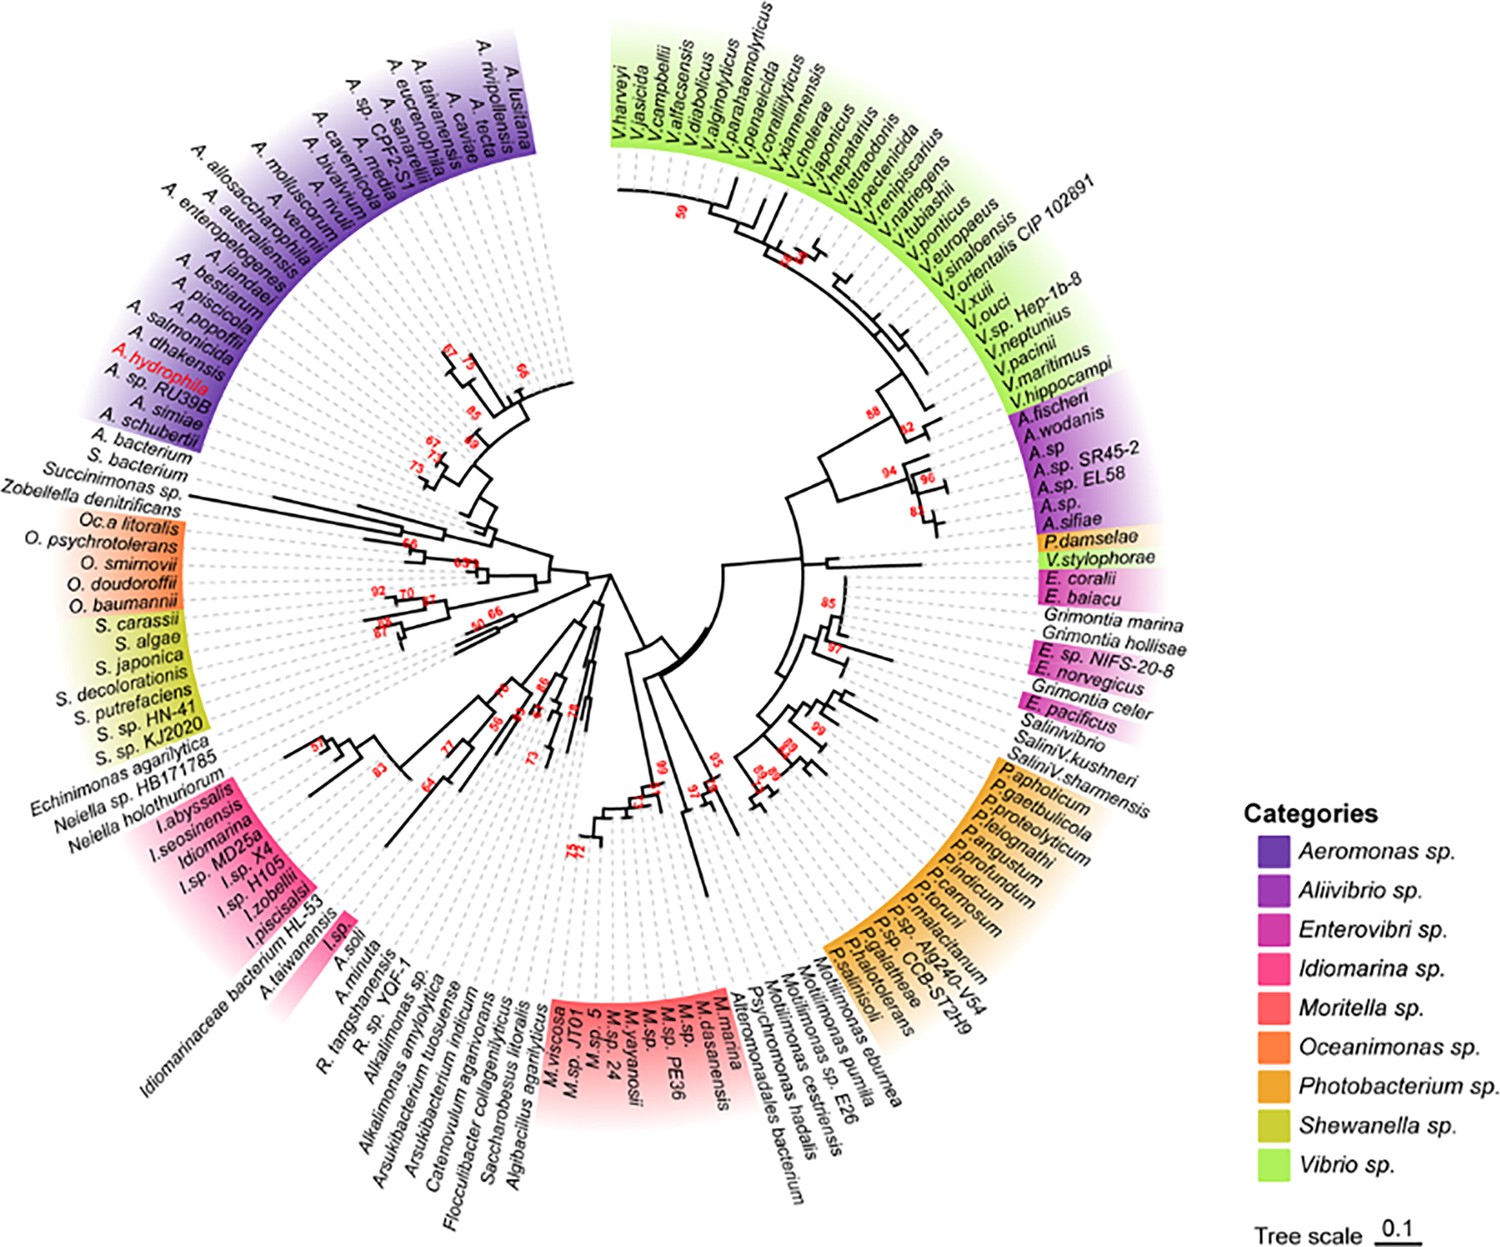
Phylogenetic tree of the AhCobQ lysine acetylases and deacetylases (KDAC) activity domain (195–245 aa).
Different colors indicate different branches, and Aeromonas hydrophila spp. is highlighted in red.
Figure 6 with 3 supplements
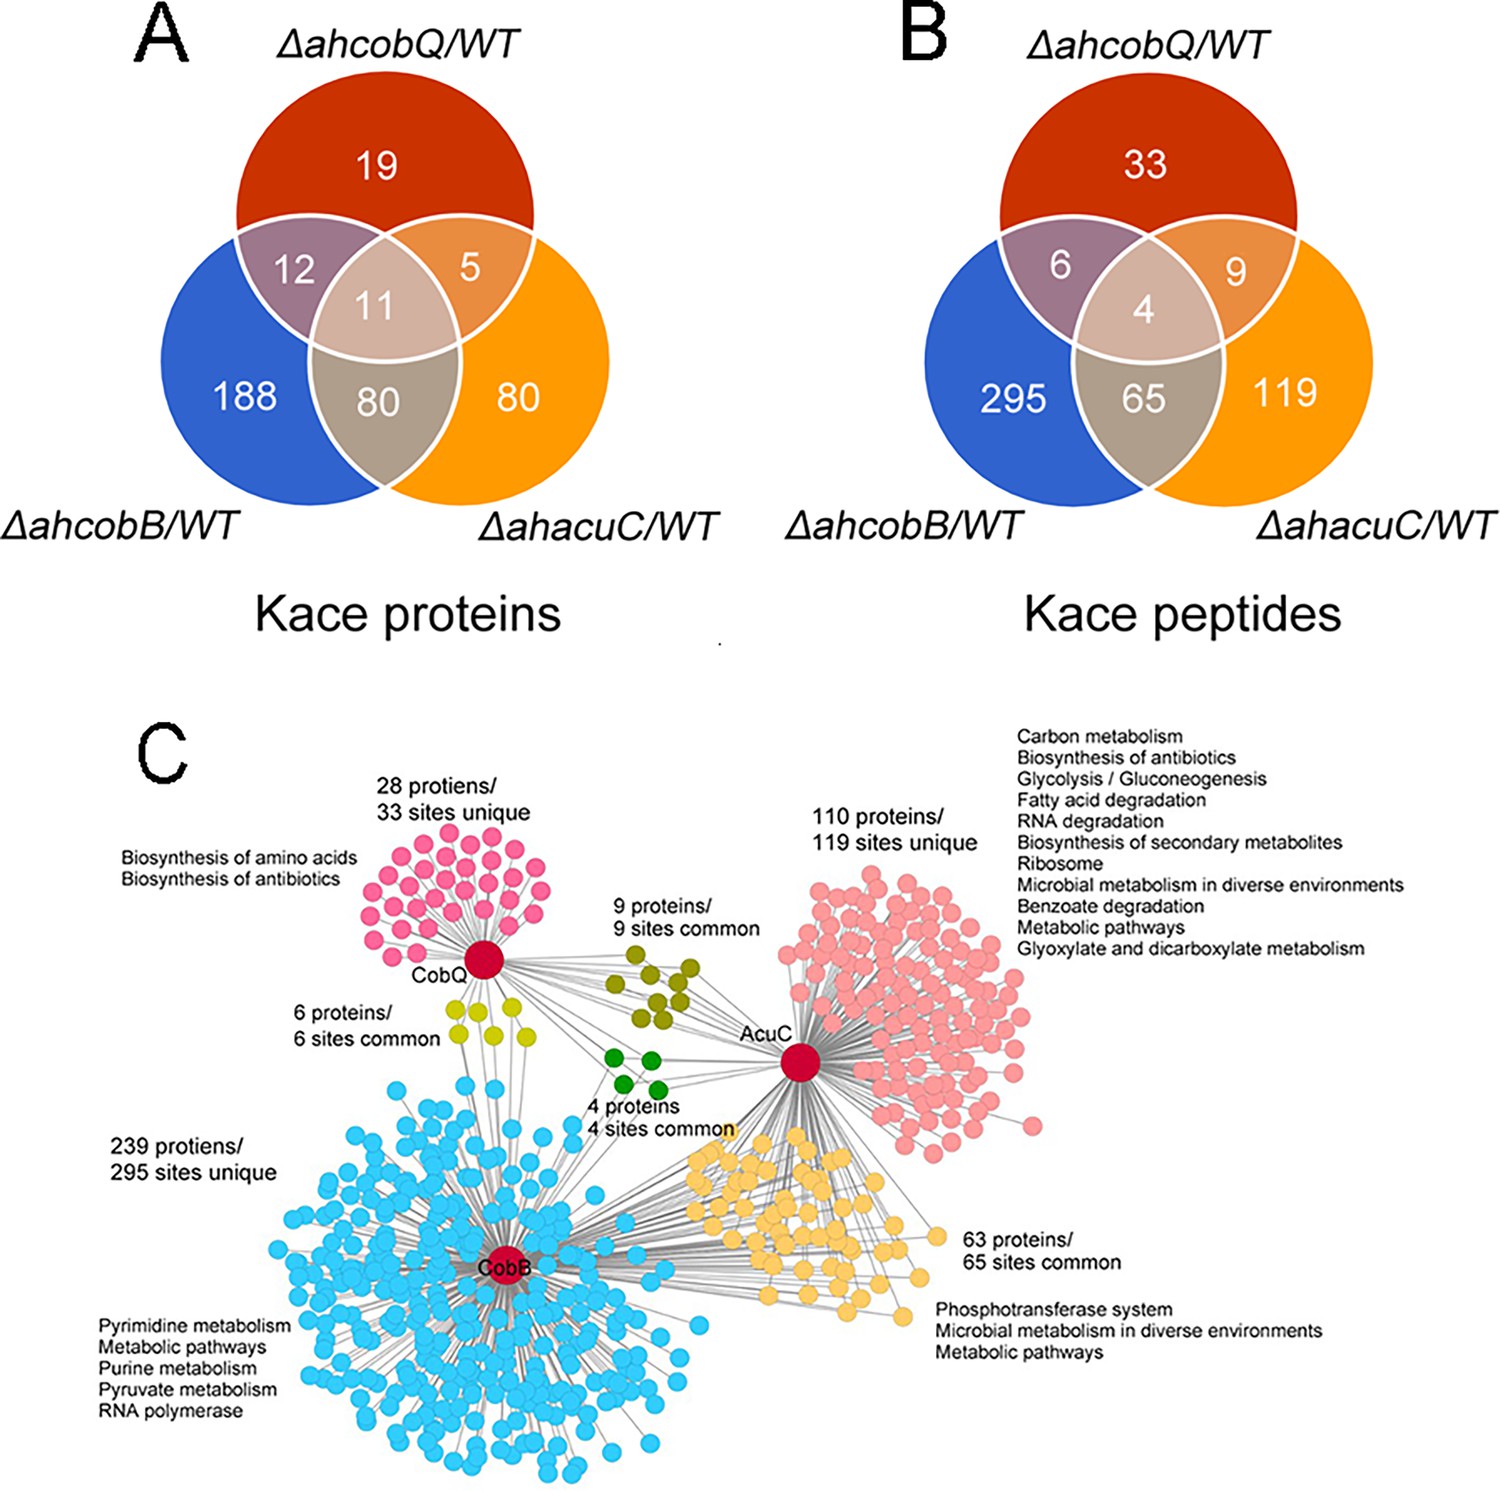
Proteomics analysis of upregulated proteins in ΔahcobB, ΔahcobQ, ΔahacuC, and wild-type (WT) strains.
(A) Venn diagrams visualized the overlapped upregulated NƐ-lysine acetylation (Kac) proteins and Kac peptides among the ΔahcobB, ΔahcobQ, ΔahacuC, and WT strains. The number of acetylated proteins and peptides (sites) are shown in the figure. (B) Kyoto Encyclopedia of Genes and Genomes (KEGG) metabolic pathway enrichment analysis of upregulated Kac proteins and peptides by the three lysine acetylases and deacetylases (KDACs). Unique and overlapped Kac proteins and peptides (sites) are presented in different colors.
Figure 6—figure supplement 1
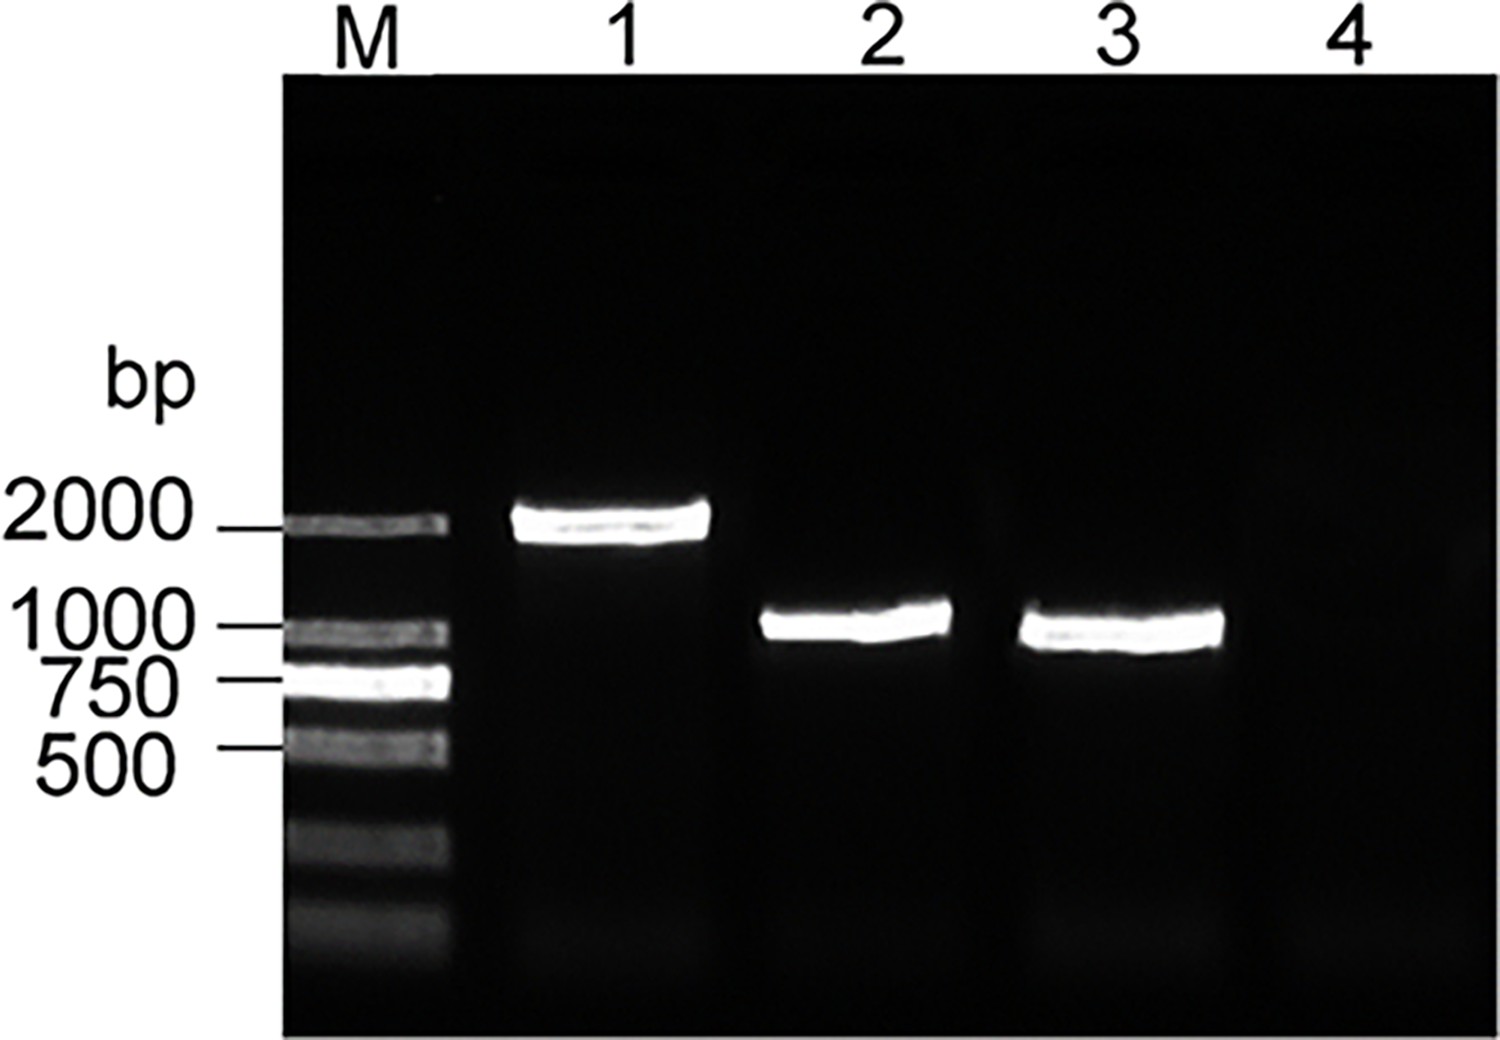
Construction of A.
hydrophila ahacuC knockout mutant strain. M: Marker; Lanes 1 and 2: PCR products of wild-type (WT) and ΔahacuC using the P7/P8 primer pairs; Lanes 3 and 4: PCR products of WT and ΔahacuC using the P5/P6 primer pairs.
-
Figure 6—figure supplement 1—source data 1
PDF file containing original PCR for Figure 6—figure supplement 1, indicating the relevant bands.
- https://cdn.elifesciences.org/articles/97511/elife-97511-fig6-figsupp1-data1-v1.zip
-
Figure 6—figure supplement 1—source data 2
Original files for PCR analysis displayed in Figure 6—figure supplement 1.
- https://cdn.elifesciences.org/articles/97511/elife-97511-fig6-figsupp1-data2-v1.zip
Figure 6—figure supplement 2
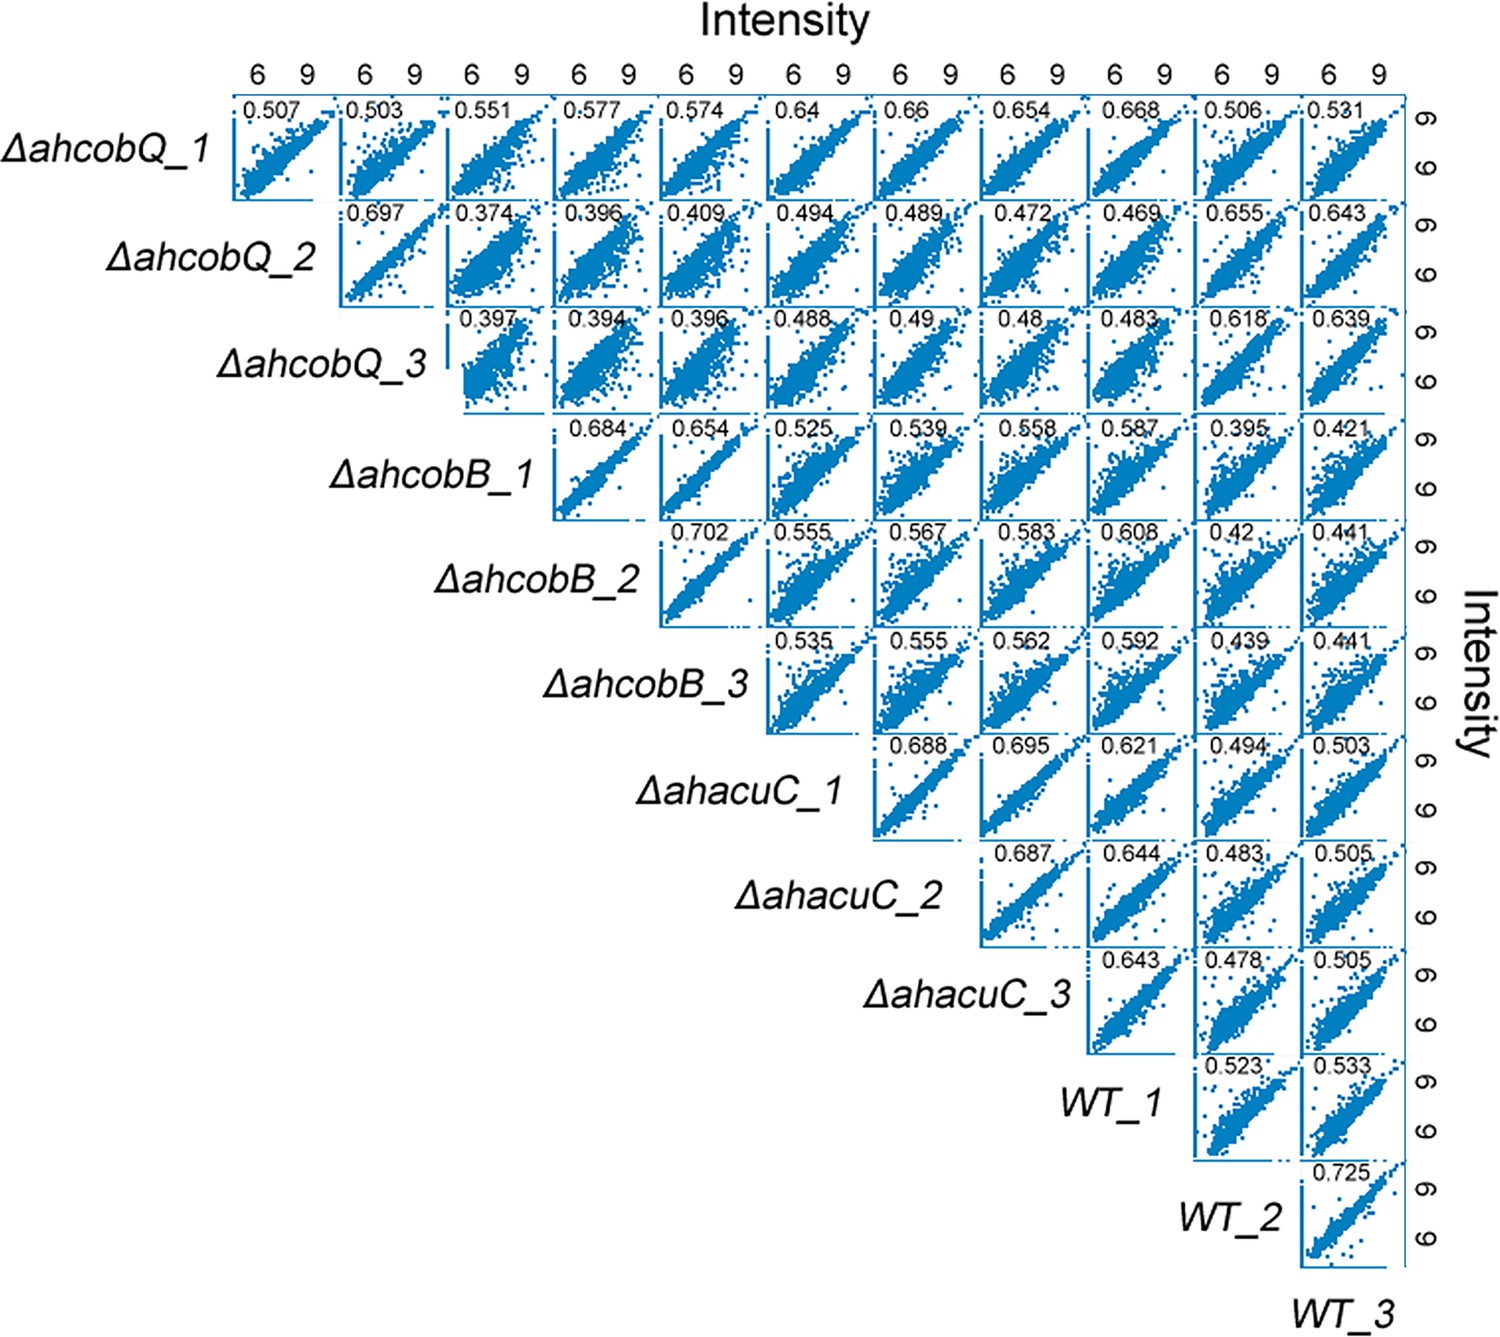
Scatter plot of Pearson’s correlation coefficients of label-free quantification (LFQ) intensity among each group and their biological replicates in the quantitative acetylome.
Figure 6—figure supplement 3
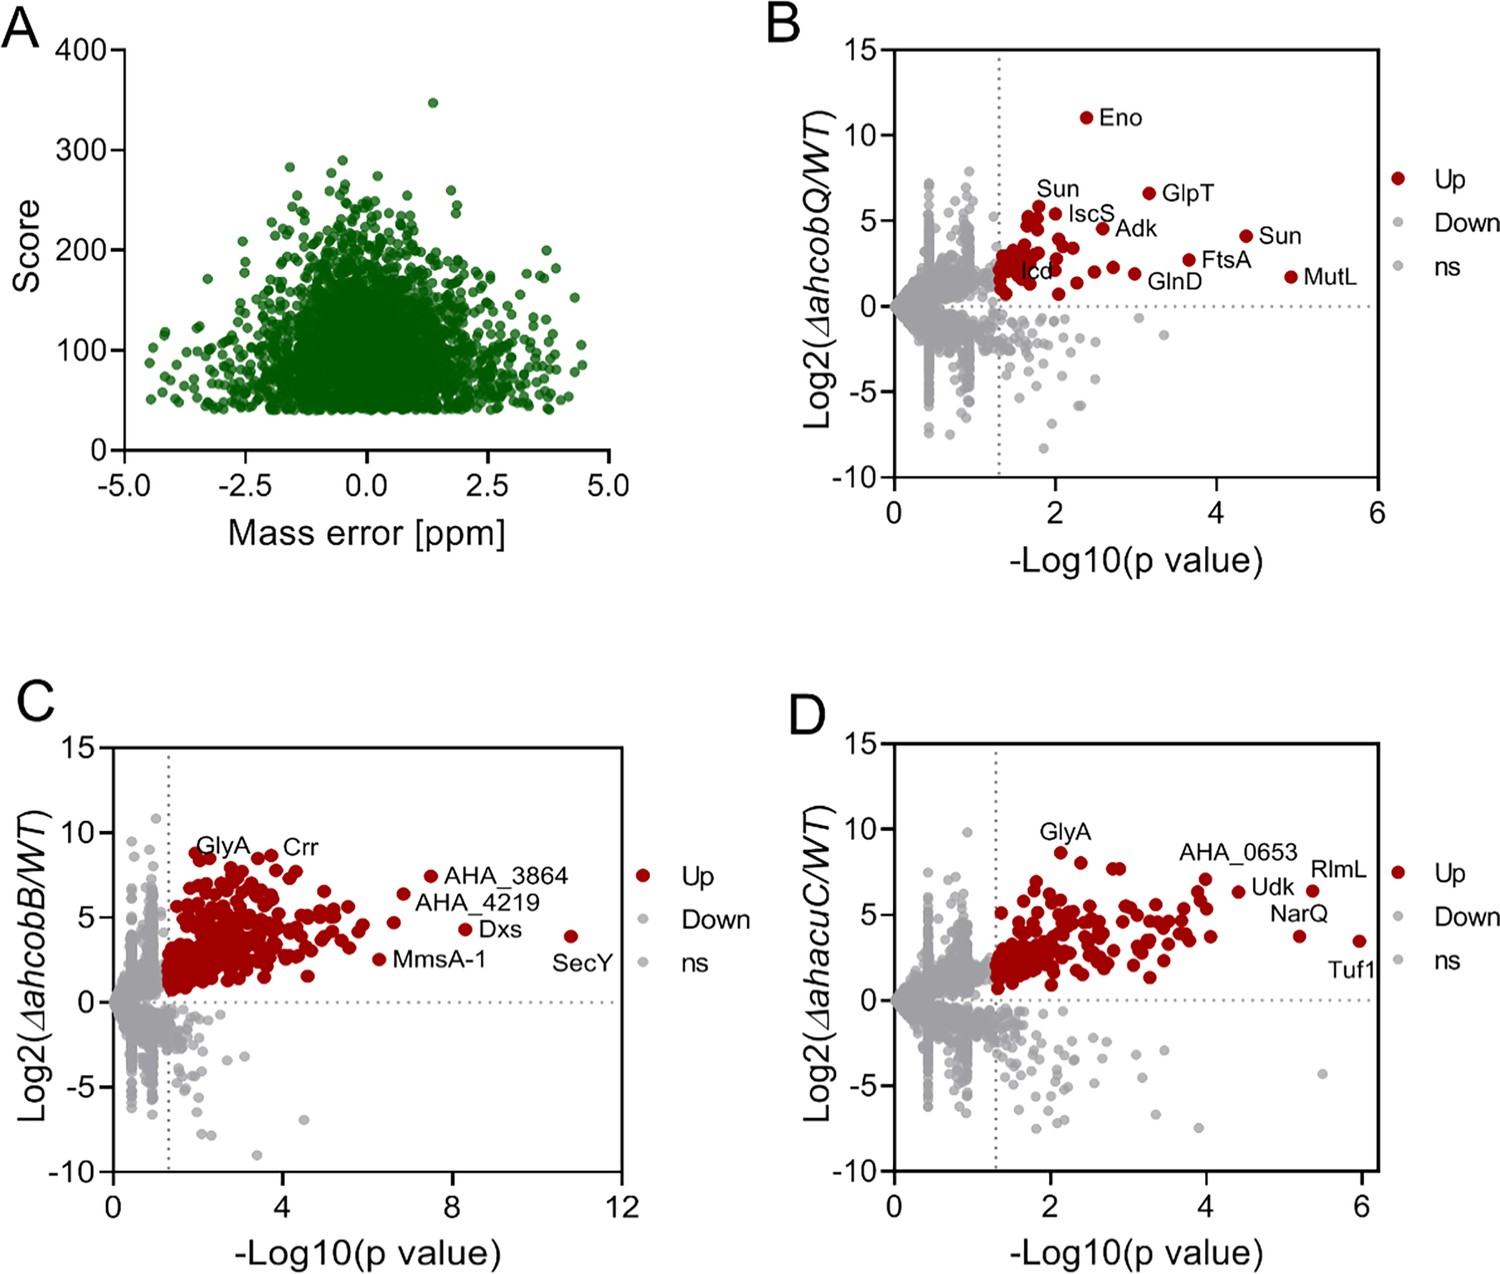
Quantitative acetylome analysis among the ΔahcobQ, ΔahcobB, ΔahacuC, and wild-type (WT) strains.
(A) Mass error distribution of total identified NƐ-lysine acetylation (Kac) peptides; (B–D) Volcano plot of the p-values vs. the log2 Kac peptide abundance differences between ΔahcobQ vs. WT, ΔahcobB vs. WT, and ΔahacuC vs. WT, with upregulated Kac proteins outside the significance lines colored in red. Some representative Kac protein names are highlighted.
Figure 7 with 2 supplements
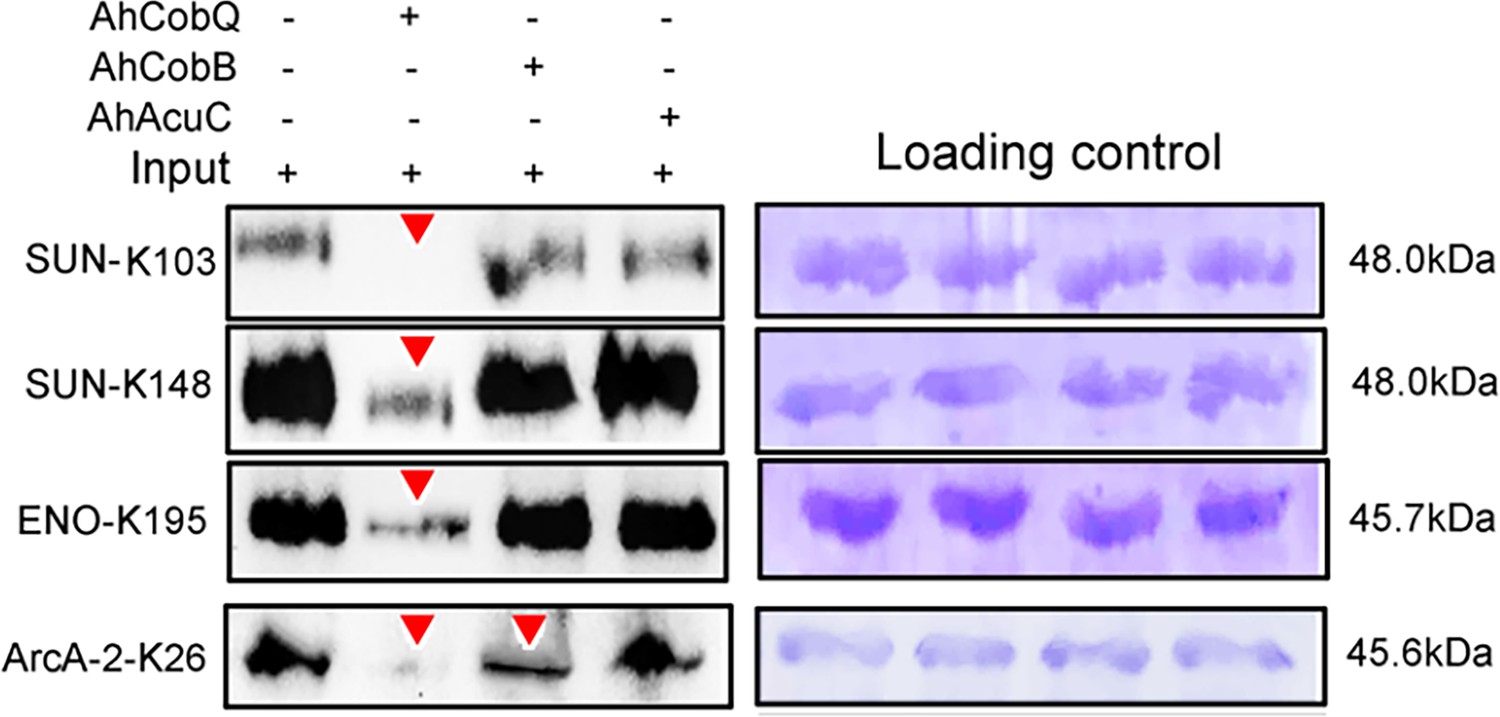
Western blot validation of the site-specific NƐ-lysine acetylation (Kac) protein substrates regulated by the three KDACs.
-
Figure 7—source data 1
PDF file containing original western blots for Figure 7, indicating the relevant bands and treatments.
- https://cdn.elifesciences.org/articles/97511/elife-97511-fig7-data1-v1.zip
-
Figure 7—source data 2
Original files for western blots analysis displayed in Figure 7.
- https://cdn.elifesciences.org/articles/97511/elife-97511-fig7-data2-v1.zip
Figure 7—figure supplement 1
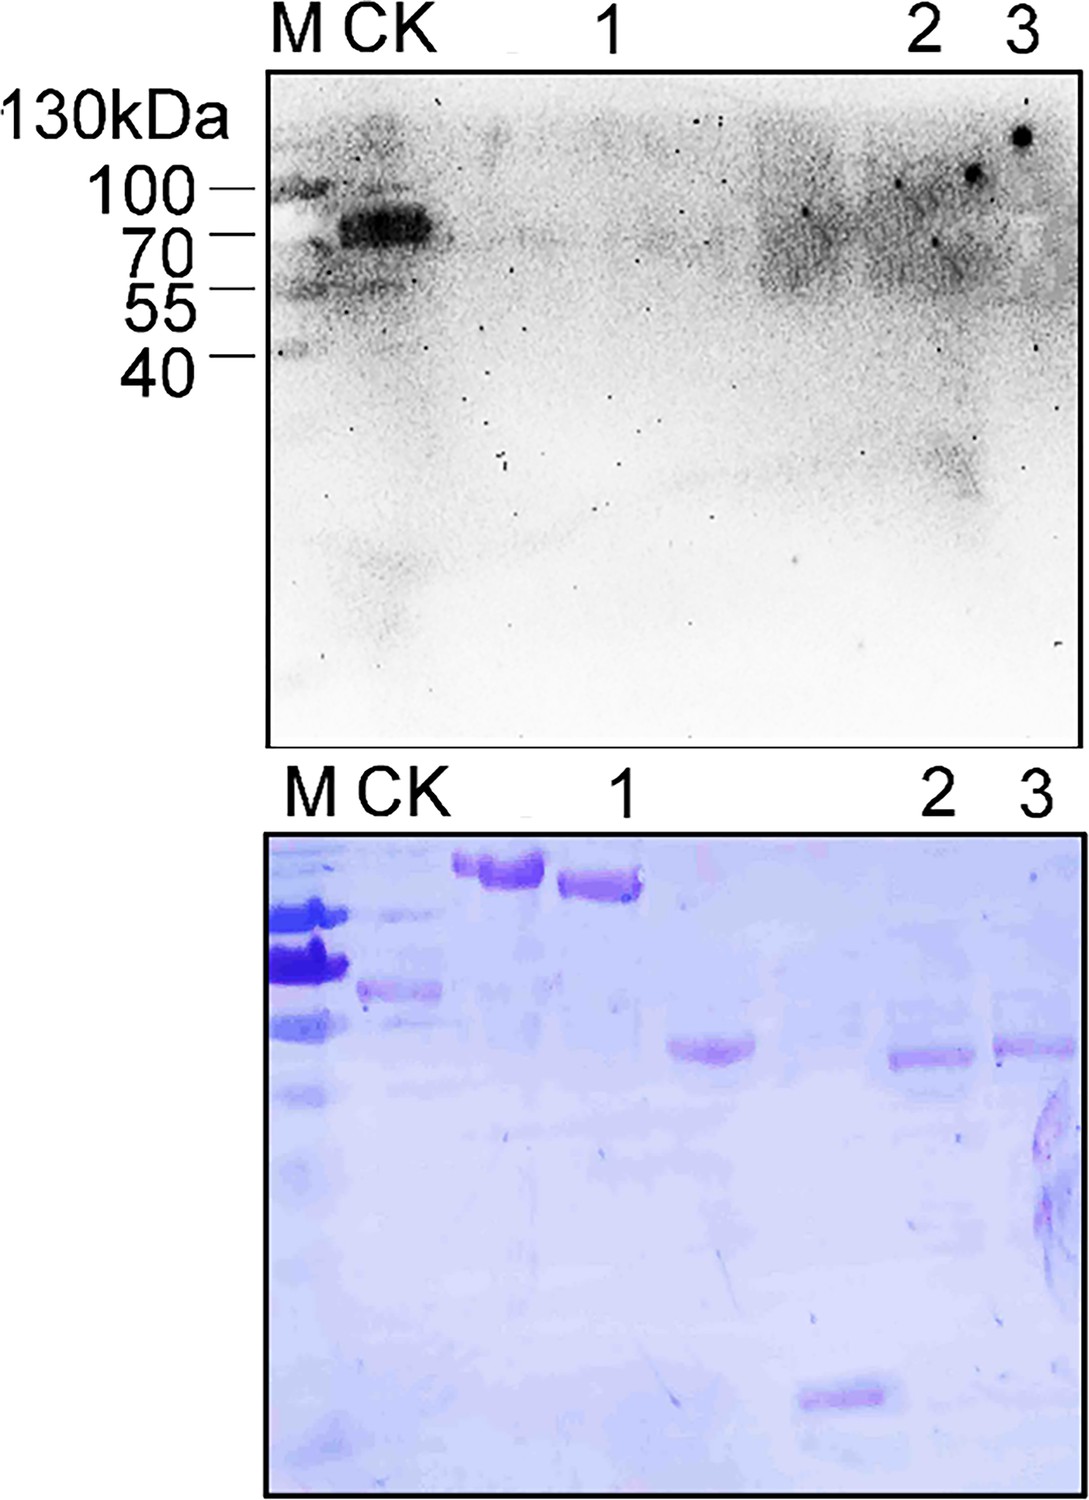
Purified original recombinant proteins (without site-directed acetylation modification) without Kac modifications, validated by Western blot.
1: SUN, 2: ENO, 3 ArcA-2, CK: Kac-BSA, M: prestained protein marker. CK is Kac-BSA as a positive control. The lower section presents the PVDF membrane R350 staining for the loading amount control.
-
Figure 7—figure supplement 1—source data 1
PDF file containing original western blots for Figure 7—figure supplement 1, indicating the relevant bands and treatments.
- https://cdn.elifesciences.org/articles/97511/elife-97511-fig7-figsupp1-data1-v1.zip
-
Figure 7—figure supplement 1—source data 2
Original files for western blots analysis displayed in Figure 7—figure supplement 1.
- https://cdn.elifesciences.org/articles/97511/elife-97511-fig7-figsupp1-data2-v1.zip
Figure 7—figure supplement 2
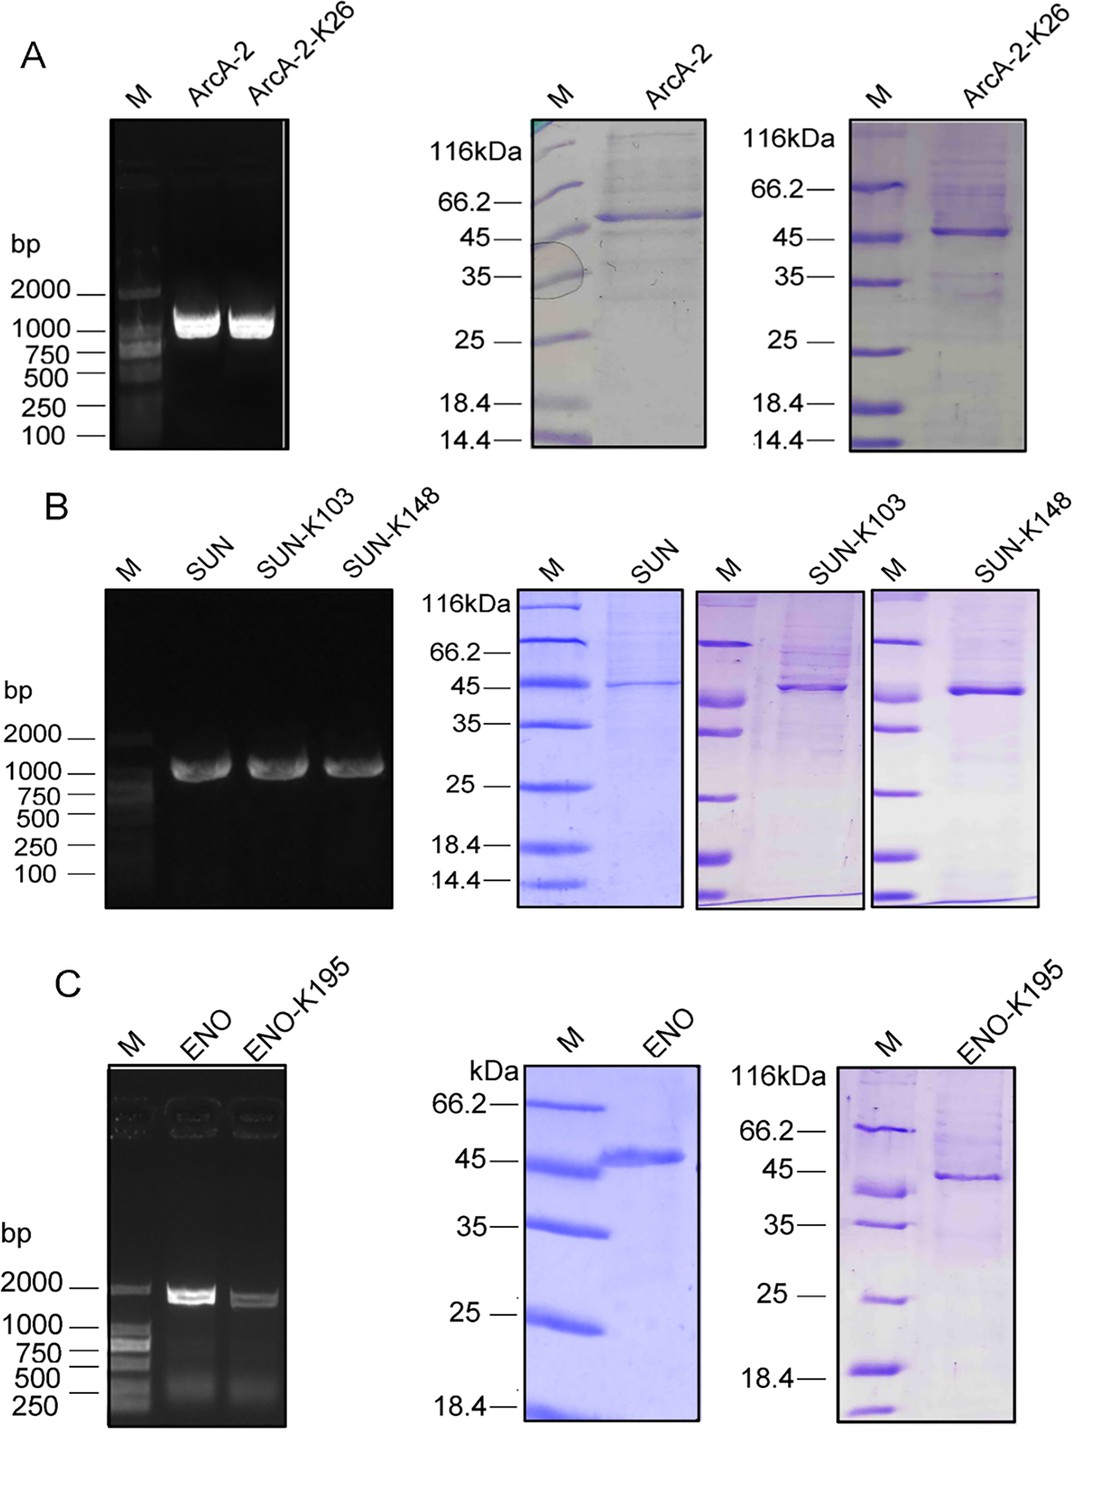
Characteristics of the overexpressed and purified recombinant target proteins.
The PCR products (right) and SDS-PAGE results of the target recombinant or site-directed acetylated proteins. (A) ArcA-2 and ArcA-2-K26; (B) SUN, SUN-K103, and SUN-K148; (C) ENO and ENO-K195.
-
Figure 7—figure supplement 2—source data 1
PDF file containing original PCR and SDS-PAGE for Figure 7—figure supplement 2, indicating the relevant bands.
- https://cdn.elifesciences.org/articles/97511/elife-97511-fig7-figsupp2-data1-v1.zip
-
Figure 7—figure supplement 2—source data 2
Original files for PCR and SDS-PAGE analysis displayed in Figure 7—figure supplement 2.
- https://cdn.elifesciences.org/articles/97511/elife-97511-fig7-figsupp2-data2-v1.zip
Figure 8

AhCobQ positively regulates the isocitrate dehydrogenase (ICD) enzymatic activity through deacetylation of K388 on ICD.
(A) Western blot verified the deacetylation effect of AhCobQ on ICD and ICD-K388; (B) Western blot verified the deacetylation effect of AhCobQ, AhCobB, and AhAcuC on ICD-K388. The PVDF membrane R350 staining for the loading amount control was displayed under the WB results; (C) Enzymatic activities of ICD (yellow), ICD-Kac388(blue), ICD-Kac388 treated with AhCobQ (red), ICD-Kac388 treated with AhCobB (green), ICD-Kac388 treated with AhAcuC (brown); (D) The histogram showed the effect of AhCobQ/AhcobB on ICD or ICD-Kac388 enzymatic activities at 5 min. ***p<0.001.
-
Figure 8—source data 1
PDF file containing original western blots for Figure 8A and B, indicating the relevant bands and treatments.
- https://cdn.elifesciences.org/articles/97511/elife-97511-fig8-data1-v1.zip
-
Figure 8—source data 2
Original files for western blots analysis displayed in Figure 8A and B.
- https://cdn.elifesciences.org/articles/97511/elife-97511-fig8-data2-v1.zip
Author response image 1
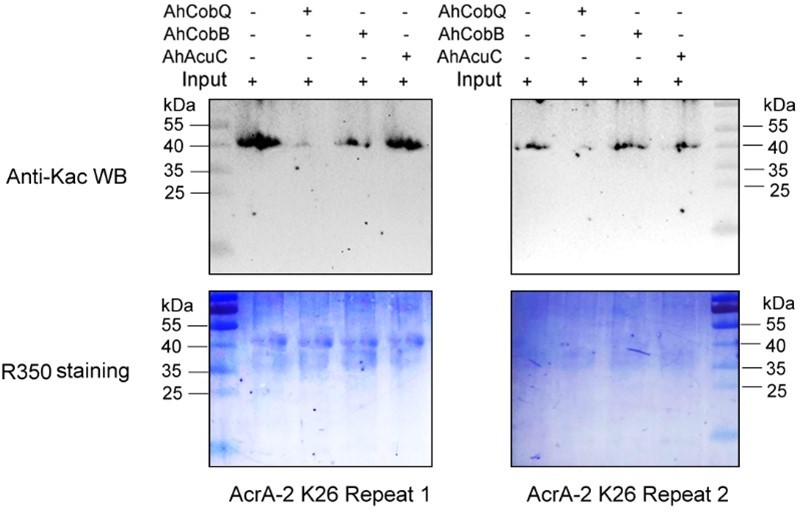
Western blot validation of the Kac26 AcrA-2 protein substrates regulated by the three KDACs in two biological replicates.
Author response image 2

Western blot validation of the Kac48 Sun protein substrates regulated by the three KDACs in two biological replicates.
Author response image 3

Western blot validation of the Kac103 Sun protein substrates regulated by the three KDACs in two biological replicates.
Author response image 4
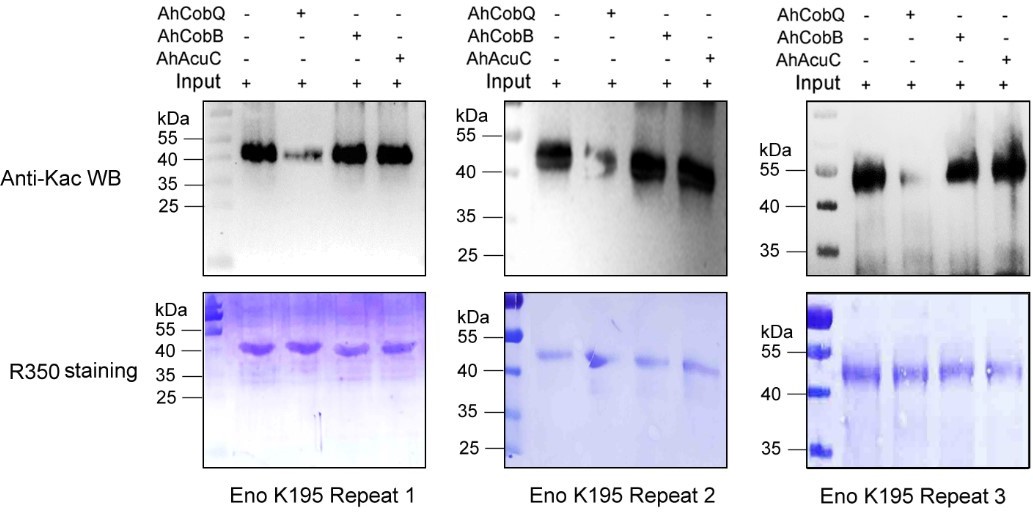
Western blot validation of the Kac195 Eno protein substrates regulated by the three KDACs in three biological replicates.
Author response image 5

Western blot validation of the Kac388 ICD protein substrates regulated by AhCobQ in this study.
Each sample was independently repeated at least three time.
Author response image 6

The comparison of Western blotting and R-350 strained results of same protein marker in the same PVDF membrane.
The protein marker located at 70 kDa can be detected easily in Coomassie R-350, while is difficult to display in WB result.
Author response image 7

The SDS-PAGE gel displayed the loading amounts of Kac-BSA and CobB/CobQ.
Author response image 8
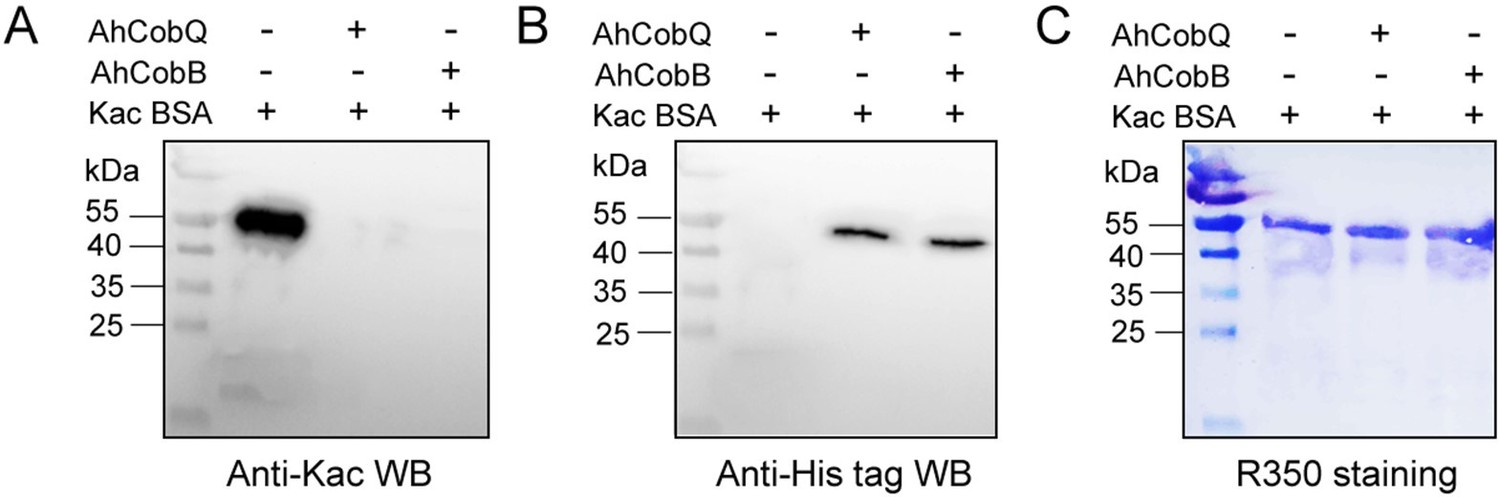
Western blot verified the deacetylase activity assay of AhCobQ and AhCobB on Kac-BSA.
Author response image 9

The intensities of all Kac peptides of Kac-BSA with or without AhCobQ incubation in LC MS/MS.
Author response image 10
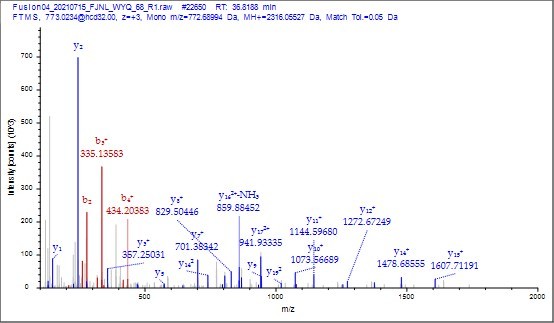
MS2 spectrum of unmodified peptide using PD v2.4 software.
Author response image 11
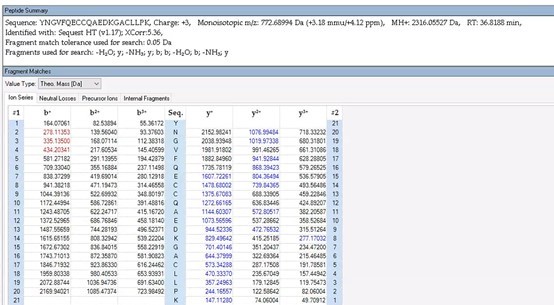
The theoretical mass of unmodified peptide by PD 2.4.
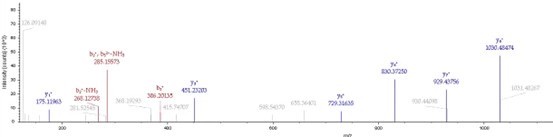
Author response image 12
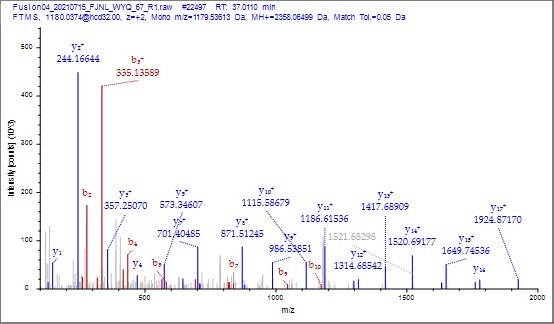
MS2 spectrum of acetylated peptide using PD v2.4 software.
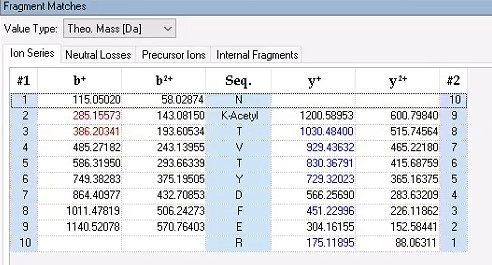
Author response image 13
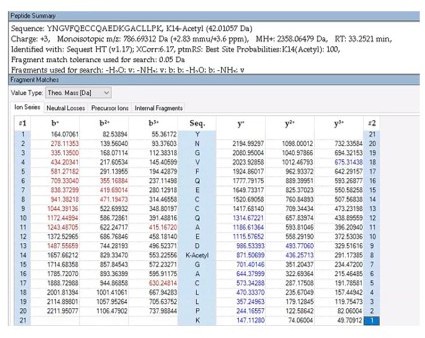
The theoretical mass of acetylated peptide by PD 2.4.
Author response image 14
The MS2 of ICD-K388 peptide by PD 2.4.
Author response image 15
The theoretical mass of ICD-K388 peptide by PD 2.4.
Author response image 16

The default parameter in Kac peptide identification in Maxquant v1.6 software.
Tables
Author response table 1
LC MS/MS results of selected peptide quantification among Kac-BSA and Kac-BSA incubated with CobQ and BSA without acetylation against A. hydrophila database (unique matched peptides>1).
| Gene name | Unique peptide | Description | Kac-BSA+AhCobQ intensity | Kac-BSA intensity | BSA intensity |
|---|---|---|---|---|---|
| cobQ | 11 | CobQ/CobB/MinD/ParA family protein | 2.59E+09 | 0 | 0 |
| tuf1 | 7 | Elongation factor Tu | 5.35E+09 | 0 | 0 |
| rp/Q | 4 | Large ribosomal subunit protein bL17 | 3.44E+08 | 0 | 0 |
| groEL | 3 | Chaperonin GroEL | 1.6E+08 | 0 | 0 |
| AHA_3036 | 3 | VWA domain-containing protein | 1.03E+08 | 23562000 | 5005500 |
| rpsF | 2 | Small ribosomal subunit protein bS6 | 79780000 | 0 | 0 |
| rpsU | 2 | Small ribosomal subunit protein bS21 | 56694000 | 0 | 0 |
| rpsB | 2 | Small ribosomal subunit protein uS2 | 47779000 | 0 | 0 |
| rpsO | 2 | Small ribosomal subunit protein uS15 | 15869000 | 0 | 0 |
| rpsJ | 2 | Small ribosomal subunit protein uS10 | 58784000 | 0 | 0 |
| AHA_0497 | 2 | ATP-grasp domain-containing protein | 20711000 | 50345000 | 0 |
| AHA_1279 | 2 | Major outer membrane protein OmpAll | 7316100 | 18183000 | 0 |
| valS | 2 | Valine--tRNA ligase | 0 | 173130000 | 0 |
| aceE | 2 | Pyruvate dehydrogenase E1 component | 74854000 | 0 | 0 |
Additional files
-
Supplementary file 1
LC MS/MS of acetylated peptides and materials used in this study.
(a) Selected Kac peptide quantification among Kac-BSA and Kac-BSA incubated with CobQ and BSA without acetylation, by LC MS/MS. (b) Acetylation-modified upregulated proteins of AhCobQ-deleted strains and the identification of residue positions by LC MS/MS. (c) Chemicals and reagents used in this study. (d) Critical commercial assay kits used in this study. (e) Bacterial strains and plasmids used in this study. (f) Primer pairs used in this study.
- https://cdn.elifesciences.org/articles/97511/elife-97511-supp1-v1.docx
-
MDAR checklist
- https://cdn.elifesciences.org/articles/97511/elife-97511-mdarchecklist1-v1.docx
Download links
A two-part list of links to download the article, or parts of the article, in various formats.
Downloads (link to download the article as PDF)
Open citations (links to open the citations from this article in various online reference manager services)
Cite this article (links to download the citations from this article in formats compatible with various reference manager tools)
Aeromonas hydrophila CobQ is a new type of NAD+- and Zn2+-independent protein lysine deacetylase
eLife 13:RP97511.
https://doi.org/10.7554/eLife.97511.4


